1. Introduction
The in situ monitoring of volatile organic compounds (VOCs) in indoor work environments and residences located in proximity to U.S. Environmental Protection Agency (EPA) Superfund or Agency for Toxic Substances and Disease Registry (ATSDR) brownfield sites is of increasing interest [
1,
2,
3]. Southeastern Michigan, and the greater Detroit metropolitan area specifically, have observed increasing incidences of weather events resulting in the flooding of both residential and commercial structures by contaminated waters [
1], causing the intrusion of VOCs into the occupied built environment with increasing frequency [
2]. Such local flooding events typically leave residual contaminated water, and moisture, in structures that provides an ongoing source of hazardous VOCs typically associated with these urban areas including the common BTEX and CAH target hydrocarbon contaminants chosen for examination in this study [
3] While the United States has yet to set VOC exposure guidelines, the World Health Organization (WHO) guidelines for Europe [
4] establish indoor air quality (IAQ) limits for toluene of 260 µg/m
3 over one week and 250 µg/m
3 over one year. Additionally, the WHO sets guideline values for benzene corresponding to the concentrations levels associated with an excess lifetime risk of 1/10,000, 1/100,000, and 1/1,000,000 equal to 17, 1.7, and 17 µg/m
3, respectively, consistent with the low VOC concentration range (0–6000 ppb) examined in this study.
Although real-time monitoring of VOCs using electronic sensors is not yet a standard U.S. Environmental Protection Agency (EPA) method, portable and low-cost in-situ sensor networks could provide important real-time human exposure data for at risk urban populations. Currently, expensive and specialized commercial laboratory methods such as gas chromatography–mass spectrometry (GC-MS) are typically utilized for measurement of airborne VOC concentration. These EPA standard methods generally require off-line sample processing and GC-MS analysis requiring specialized techniques (e.g., solvent extraction) and trained personnel. Reducing the cost and increasing the portability of monitoring technologies is essential to realizing the objective of assessing real-time exposure based monitoring of target VOCs with useful spatial resolution.
Numerous metal oxide sensors are currently marketed in the United States for detection of unspecified total VOC (TVOC). Specific challenges that have arisen in the course of developing VOC sensors include a lack of chemical specificity, detection limits too high relative to air quality standards for VOCs, and the difficulty of field deployment, as well as the high cost associated with calibration and maintenance [
5,
6]. Semiconductor MOx sensors typically employ a thick or thin metal oxide film or filament composed of tin oxide (SnO
2), tungsten trioxide (WO
3) or zinc oxide (ZnO) for n-type sensors or nickel oxide (NiO) for p-type MOx sensors. Conductivity changes in MOx sensors arise from changes in electron density or availability due to formation of an electronic depletion layer and associated electrical resistance changes in this surface active metal oxide layer upon chemisorption of a target VOC [
7,
8]. Thus, the degree of change in the sensor conductivity or resistance, is generally the property specified in sensor output. Changes in MOx sensor electrical responses undergoing this band bending phenomenon have been previously shown to be influenced by temperature and humidity which affect gas species chemisorption and associated oxidation/reduction properties in the depletion layer [
9,
10,
11]. Therefore, many sensor assemblies, such as the two used in this study, contain additional circuitry allowing for the conversion of output signals to various unit systems such as ppm or ppb under ambient temperature and humidity conditions. These are likely to be particularly important for MOx sensor deployment in real world applications related to this study, such as flood impacted residential environments, where MOx sensor responses to mixed VOCs has been previously unexamined.
Challenges presented by the presence of mixed VOC analytes, including BTEX and CAHs, in closed indoor systems has not been previously examined. In order to assess the effectiveness of such MOx sensors, three commercially available sensors were selected for this study specifically based on their capability to be connected to an IoT network to enable a real-time sensing array, as well as their low-cost, small size, sensitivity, and portability. The experimental design utilized testing chambers where residual liquid phase sources of VOC existed in order to mimic the flooding and vapor intrusion due to persistence of contaminated groundwater in subsurface proximity to the built structures. The precedent for MOx sensor application for VOC detection in such two phase (gas and liquid) systems has been established in a limited number of previous studies of VOCs originating from contaminated water sources [
12], therefore, further examination of their applicability for use in such indoor environments is essential.
2. Materials and Methods
2.1. MOx Sensors Tested
In order to assess sensor performance prior to deployment in field-scale sensor networks for real-time monitoring of human exposure to target VOCs, experiments were conducted to examine chemical detection limit, and sensor response characteristics for each of three commercial MOx sensors to each of the target chemicals individually and in hydrocarbon class specific (BTEX or CAH) mixtures. Each of these MOx n-type semiconductor film sensors, contained hotplate filament temperature control elements, with the SGP30 sensor containing the MOx film coated onto nano-sized particles. The three metal oxide sensors BME680, CCS811 and SGP30 were obtained from Adafruit with various performance characteristics supplied by the manufacturer (
Table 1). BME680 is a digital sensor made by Bosch that reacts to most volatile compounds polluting indoor air (one exception is CO
2). BME680 measures the sum of VOC contaminants in the surrounding air and the results are displayed on laptop or websites as a time counter, temperature, humidity, pressure, and resistance across the sensor that correlates to air quality. CCS811 is an ultra-low power digital gas sensor designed to monitor indoor air quality. It is manufactured by Austria Mikro Systeme (ams) and is designed to synthesize the raw sensor data and output a time count, temperature, TVOC in parts per billion (ppb) and approximate CO
2 equivalence in ppm. The SGP30 sensor is made by Sensirion and is the first meta-oxide gas sensor with multiple sensors on the same chip [
13]. It outputs a time count, TVOC in parts per billion (ppb) and an equivalent CO
2 concentration in parts per million.
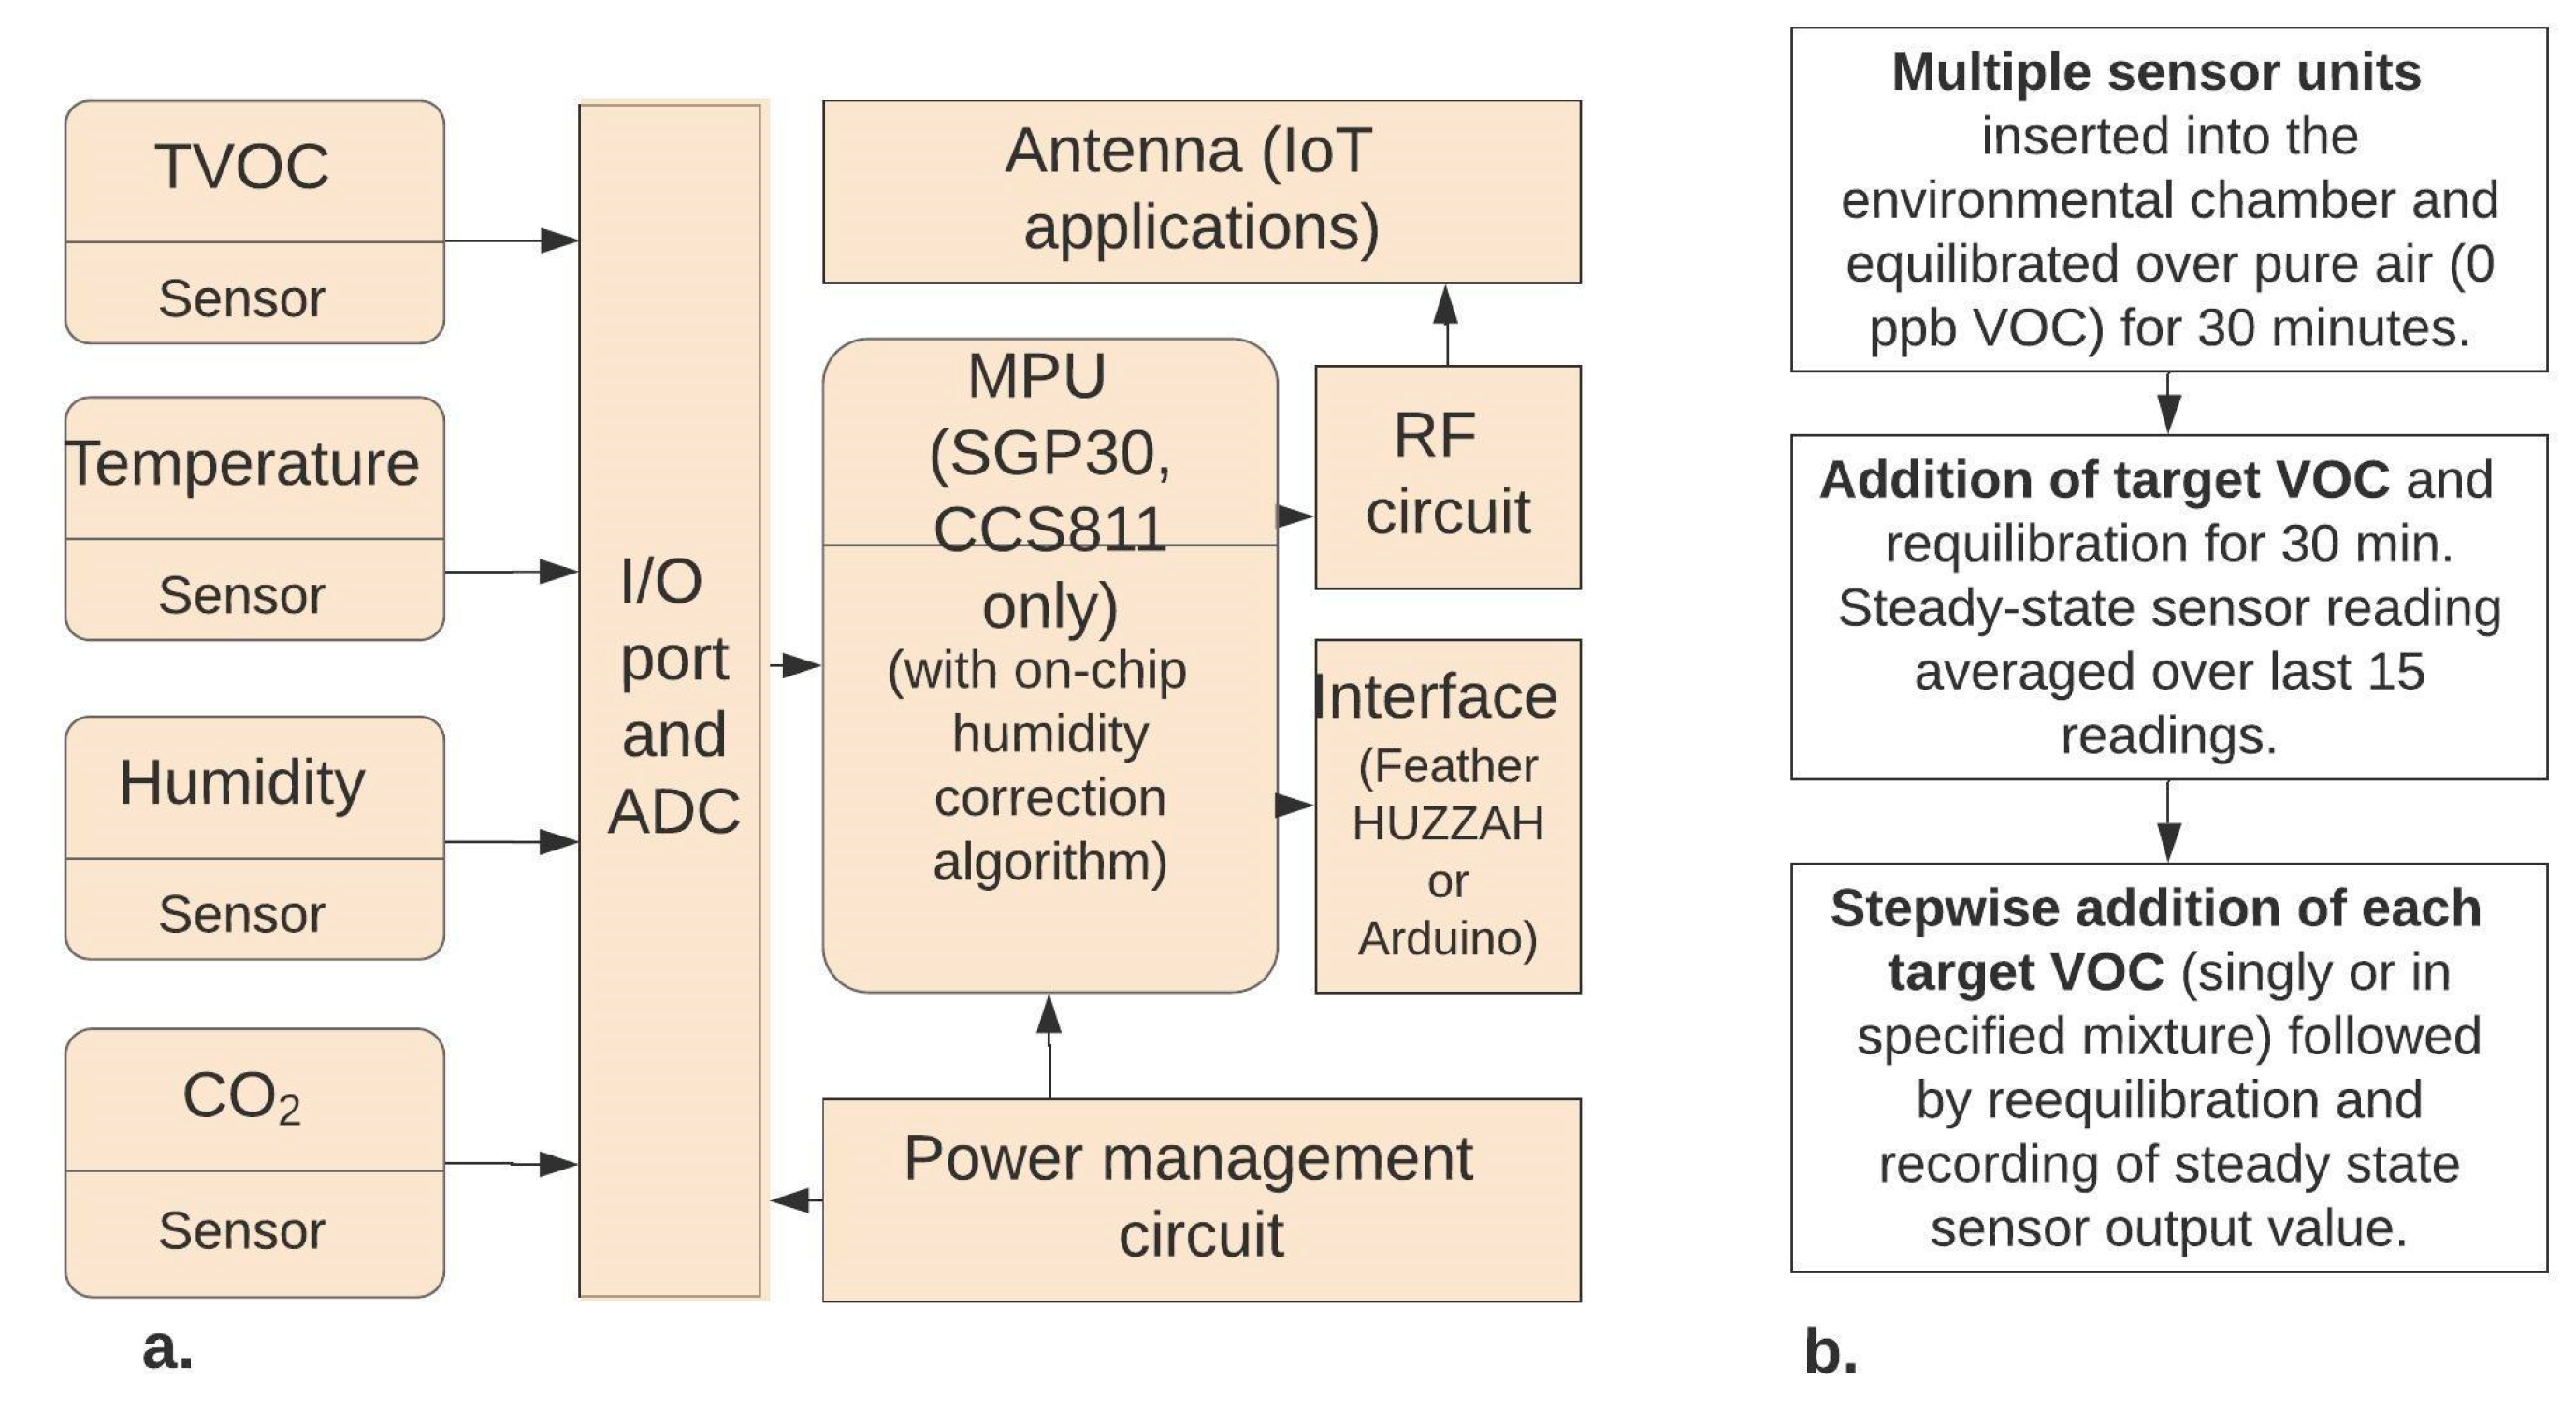
Each of the metal oxide sensors contains on-chip algorithms for correcting sensor TVOC output for humidity and temperature. Each sensor was attached to either an Arduino or Adafruit Feather HUZZAH microcontroller (
Figure 1). Code for running the sensors was obtained from Adafruit and modified based on experiments needs, then uploaded onto the boards. Results were acquired in real-time on a laptop computer we used data collection software Coolterm™ v.1.5.0.
2.2. Sensor Testing Apparatus
Each sensor testing apparatus consisted of a glass environmental sample collection bottle (1L) with screw lid containing two drilled holes of approximately 12.7 mm and 9.5 mm diameter, respectively. Each sensor testing bottle contained multiple commercial sensors; quadruplicate for BME680 and SGP30 model sensors and duplicate for CCS811, to allow for direct comparison of multiple sensors of the same model in the same conditions. The sensors were wired through the 12.7 mm aperture of the screw cap and the opening was then sealed with Teflon™ thread seal tape (Everflow 812PTFE). Caps were then tightly sealed onto the environmental chamber and each testing apparatus was placed inside a chemical fume hood.
Each sensor package was connected to a Microsoft Surface Pro 3 tablet computer with an Intel Core i5-4300U CPU on a 64 bit operating system and running Windows 10 Pro version via a 10 port USB 2.0 hub. The Microsoft computer running program Coolterm™ version 1.5.0 (build 572) ©2007-18 by Roger Meier for data collection. A data window was opened for each USB port and each sensor was connected under the options tab and to the appropriate port and set to each sensor’s baud rate, 9600 for the BME680 and CCS811 sensors and a baud rate of 115,200 for the SGP30 sensor. This initiated the data logging function of the program. The connection was set to eight data bits, no parity, 1 stop bits, software supported flow control, blocking keystrokes while flow is halted, with DTR and RTS both active. The sensors were set to output their data every five seconds via USB to a laptop computer. After the sensors were running for thirty minutes the output data was halted and saved to a text file as the control run.
2.3. Sensor Response Dynamics
The response over time for each of the sensor units in each sensor model cohort was examined prior to conducting the various chemical response studies. Commercial resistive sensors are well known to be affected by temperature, humidity as well as inorganic gas constituents such as SOx and NOx. These variables were controlled for by maintaining uniform conditions in the testing chamber with respect to temperature, humidity and background gas species throughout each ~3.5 hour experimental time period. The humidity in the sealed vapor headspace was near saturation at the ambient lab temperature.
Each sensor’s response and recovery time dynamics were examined under two conditions: (1) over pure water (the sensor is in air with a humidity that is assumed to be near saturation), and (2) over 840 ppb vapor phase concentration of toluene. A relatively high toluene concentration of 840 ppb was chosen as previous studies of MOx sensor response and recovery dynamics have shown that higher concentrations of target VOCs (>200–500 ppb) require longer recovery times for sensor readings to return to baseline [
14]. After readings stabilized over toluene, the sensor was removed from the test apparatus and the time required for the sensor readings to re-equilibrate in the open air was measured. It was determined that all sensors appeared to fully equilibrate within 30 minutes (
Figures S1–S3 Supplemental materials) and generally returned to zero within a few minutes of removal from the test apparatus after exposure to toluene which is consistent with generally observed response dynamics for MOx sensors [
15]. Notable variations in responses were observed for individual sensors in each model cohort (CCS811, BME680 and SGP30). Certain individual sensor responses over the course of the response studies were deemed aberrant, in that they either exhibited values roughly two fold higher than the other sensors in the sensor type test group (BME680) or they never appeared to stabilize in their readings underscoring the fact that known variability between individual sensors within each MOx model cohort typically exist [
6]. Such variability is frequently attributed to manufacturing parameters such as film thickness or manufacturer calibration of on-chip algorithms.
2.4. Microscopic and X-ray Photon Spectroscopy Analysis
In order to confirm MOx layer composition as n-type, as well as better understand possible sources of variability, one sensor from each model cohort was subjected to microscopic analysis and two sensor models, CCS811 and BME680, were subjected to x-ray photon spectroscopy (XPS) analysis at the conclusion of VOC sensor response data collection. XPS analyses were performed with a Perkin-Elmer ESCA 5500 system using monochromatized (SiO2 crystal) Al Kα radiation (15 kV at 15 mA) and a 90 degree angle Omni-Focus lens. The typical background pressures during analysis were 1 × 10⁻⁹ Torr. The spectrometer was calibrated to the Au 4f7/2peak at 83.80 eV. A low energy electron flood gun was used to neutralize the charge by aligning the adventitious carbon (C 1s) peak to 284.6 eV. For all samples, a survey spectrum was recorded over a binding energy range of 0 to 1400 eV using pass energy of 117.4 eV with a scan step of 1.0 eV.
2.5. Sensor Testing Procedure
Vapor phase target VOC hydrocarbon concentrations were calculated for each target hydrocarbon species based on the aqueous solution concentration in the sealed headspace sensor testing apparatus using Henry’s Law with the appropriate Henry’s constants [
16],
where
is Henry’s constant, c
air refers to the concentration of target hydrocarbon in air, and C
H2O is the concentration of target hydrocarbon in aqueous phase (Equation (1)). The experimental range of liquid phase concentrations was chosen to ensure that vapor phase concentrations tested fell within target indoor air concentration values as well as manufacturer supplied sensor detection limits. Individual chemicals and mixtures examined were obtained from Sigma or Aldrich and included benzene (HLPC grade 99.9%), toluene (anhydrous 99.9%), ethylbenzene (analytical standard grade), xylene (99% ACS reagent grade), trichloroethylene (analytical standard), tetrachloroethylene (HPLC 99.9%), and BTEX mix (standard mixture from SpecXCertiPrep with equal parts benzene, toluene, ethylbenzene, p-xylene, o-xylene, m-xylene).
At the beginning of each experiment the sensor testing apparatus was filled with 0.5 L of high-purity water through a nano-filtration system. In a 20 ml glass chromatography sealed headspace sample vial, 5% (v/v) target hydrocarbon stock solutions were prepared. After collection of sensor readings over pure water, a ten microliter sample of target hydrocarbon stock solution was inserted into the bottle through the 9.52 mm aperture and resealed with Teflon tape. A fifty microliter Hamilton™ gas tight syringe (model 1805N) was used to deliver each ten-microliter sample of hydrocarbon stock solution to the glass bottle for each individual or target hydrocarbon mixture concentration at thirty minutes intervals resulting in stepwise increasing VOC concentrations (
Figure 1). Sensors were then run for thirty minutes before a steady state sensor reading was determined by averaging the last two minutes of readings. This process was repeated five to seven times in the stepwise experiment making the system within the testing chamber increasingly more concentrated with the target VOC or mixture. This procedure was repeated for each individual target VOC hydrocarbon studied as well as VOC mixtures.
4. Discussion
Previous studies of MOx sensor responses to CAHs such as TCE and PCE, are extremely limited [
12] or nonexistent, respectively. Our study is important because it is the first report directly comparing MOx sensor responses for detection of low concentrations of BTEX and CAH hydrocarbons presented singly versus in mixed VOC systems. In addition, materials analysis of the BME680 and CCS811 sensors was performed indicating that the sensing MOx films were predominantly comprised of SnO
2. The SGP30 sensor resistive MOx layer has been previously described as SnO
2 doped with between 0.1%–0.5% palladium resistive layer coated onto nanoparticles [
13], confirming that the sensors compared all contained the same class (n-type) of MOx sensing elements.
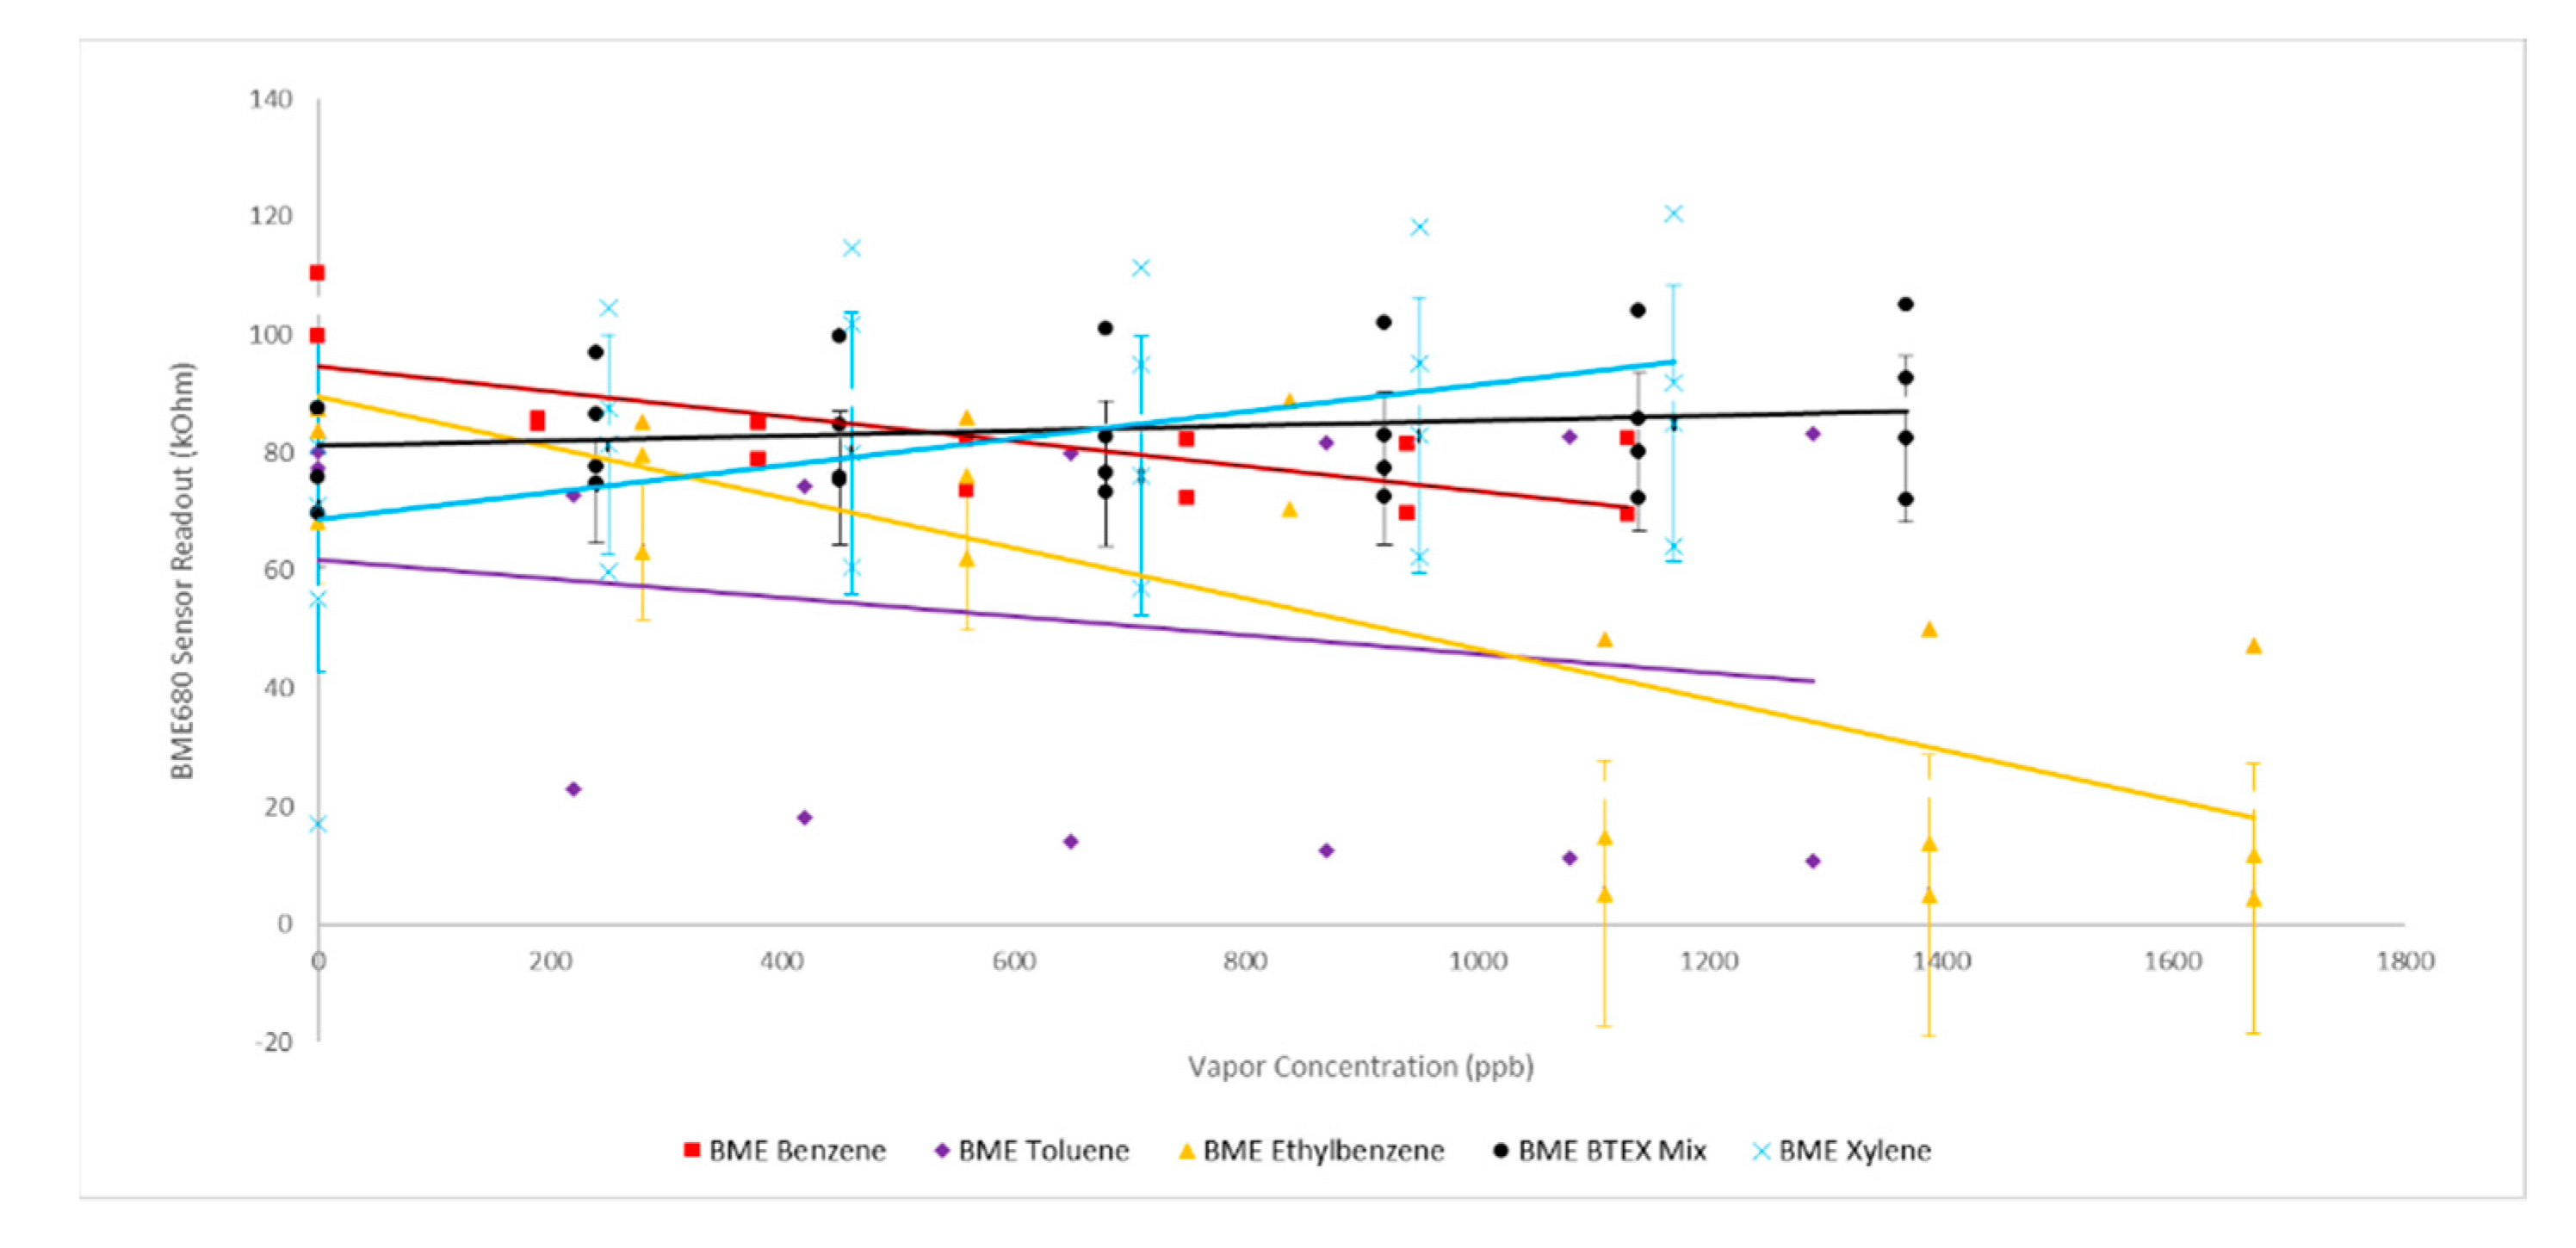
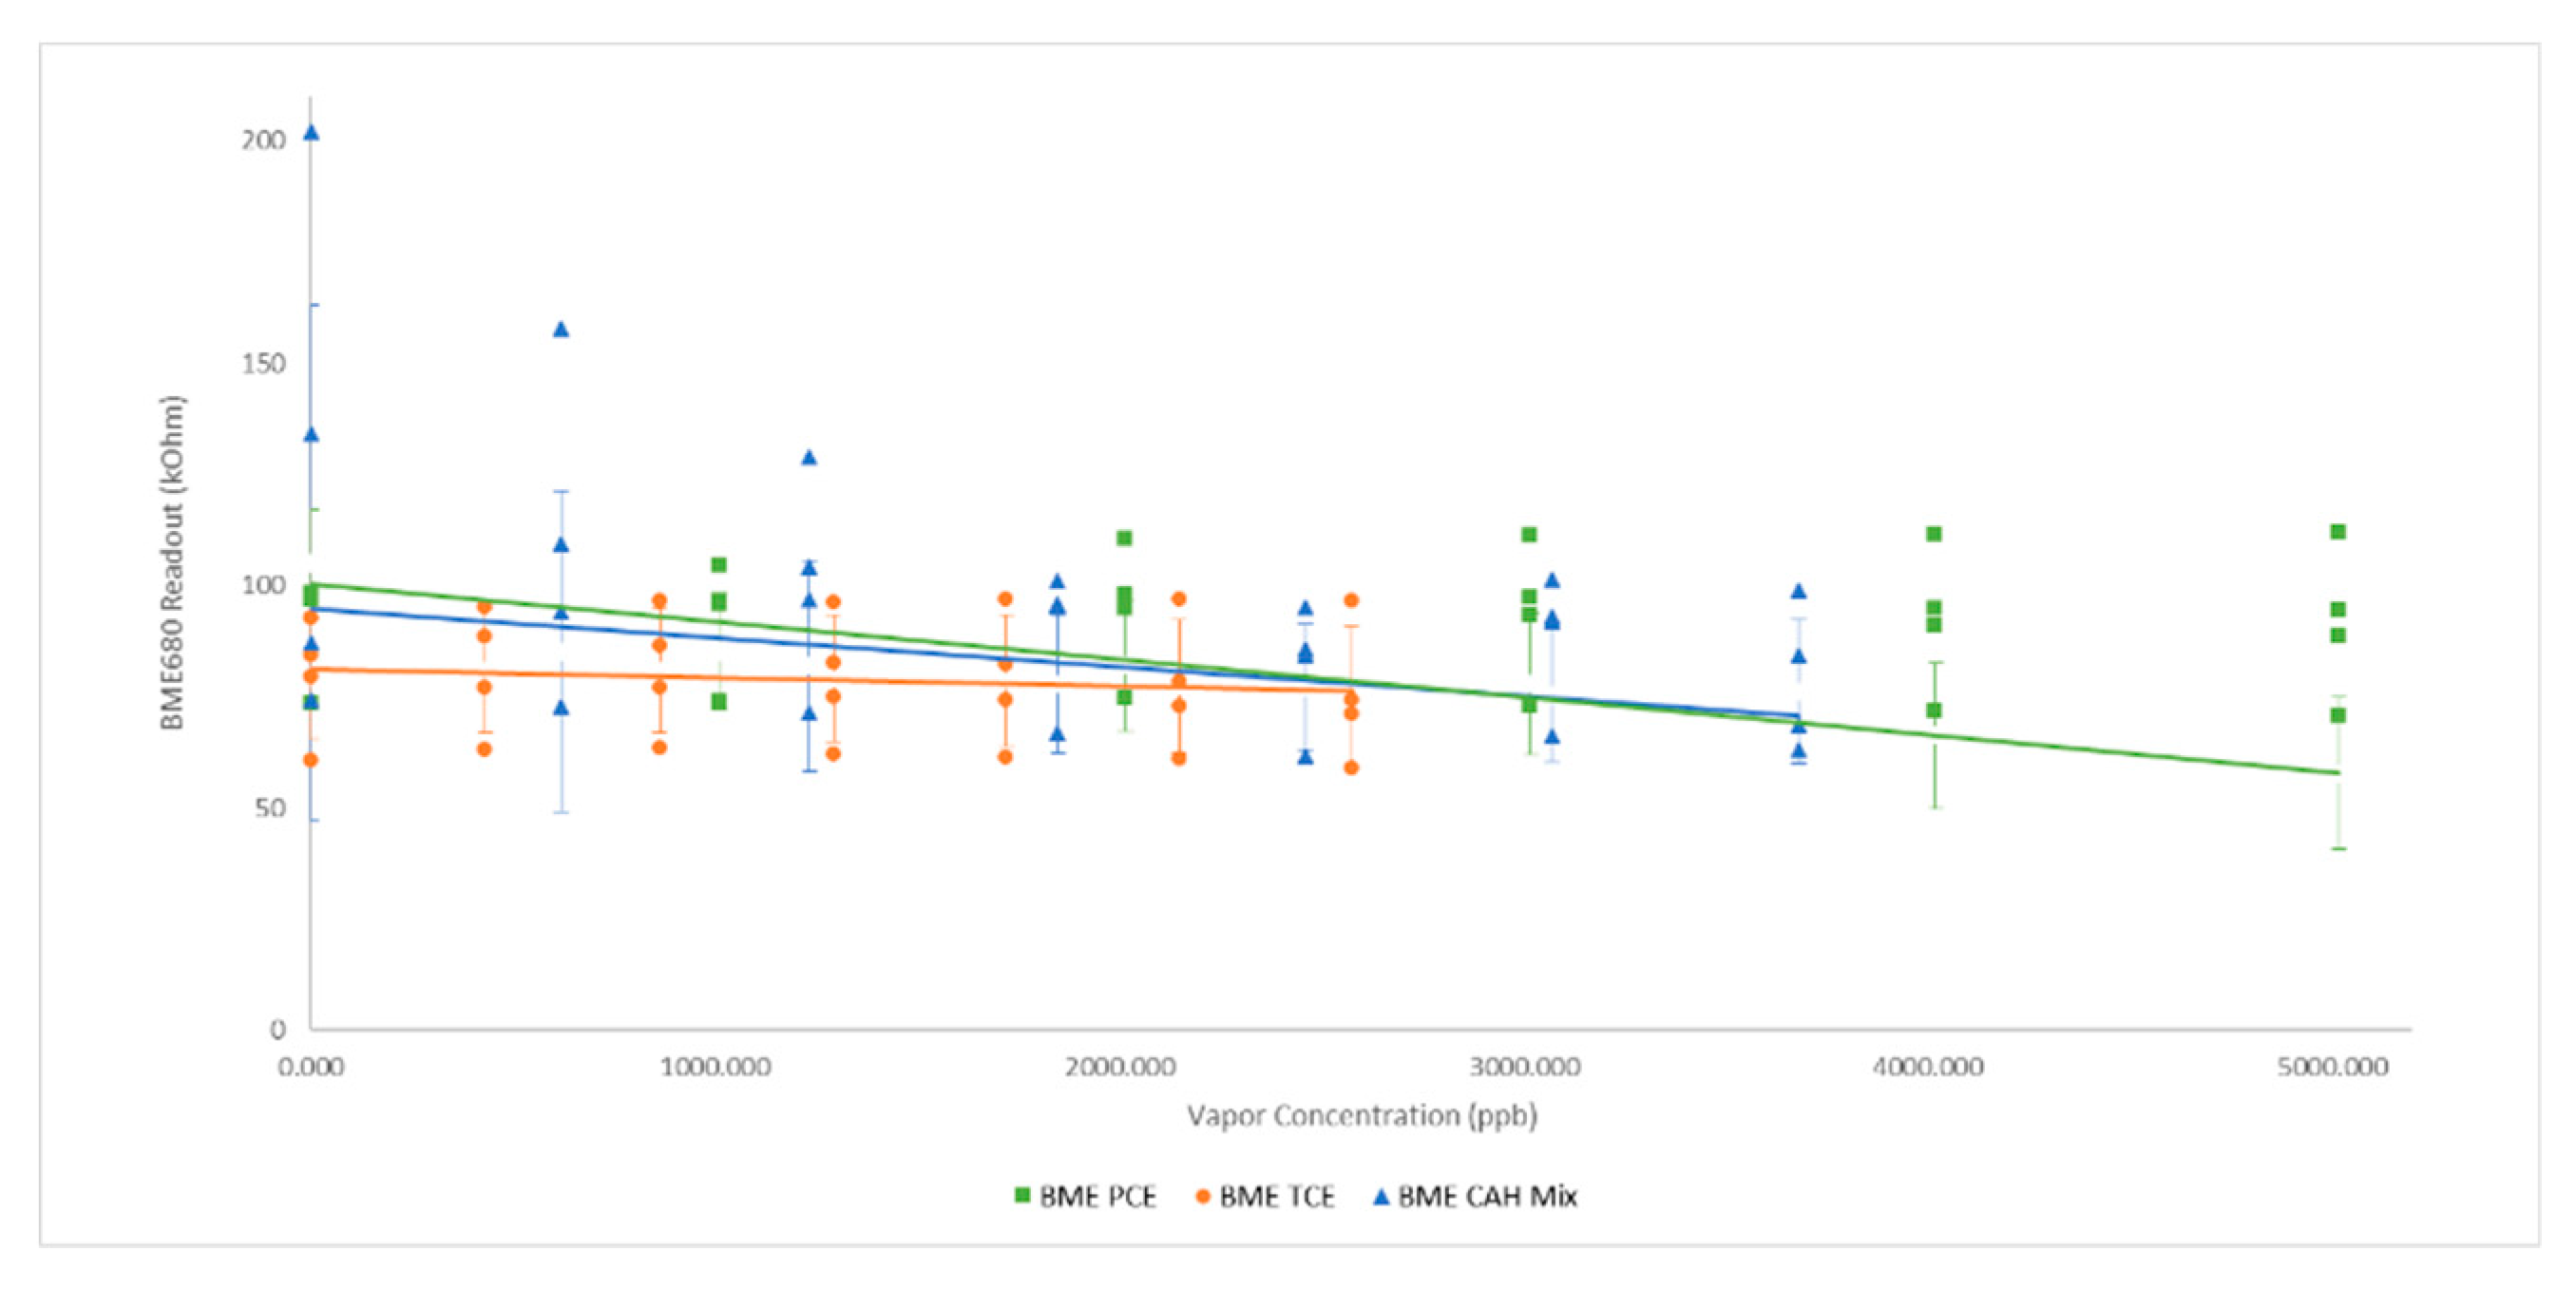
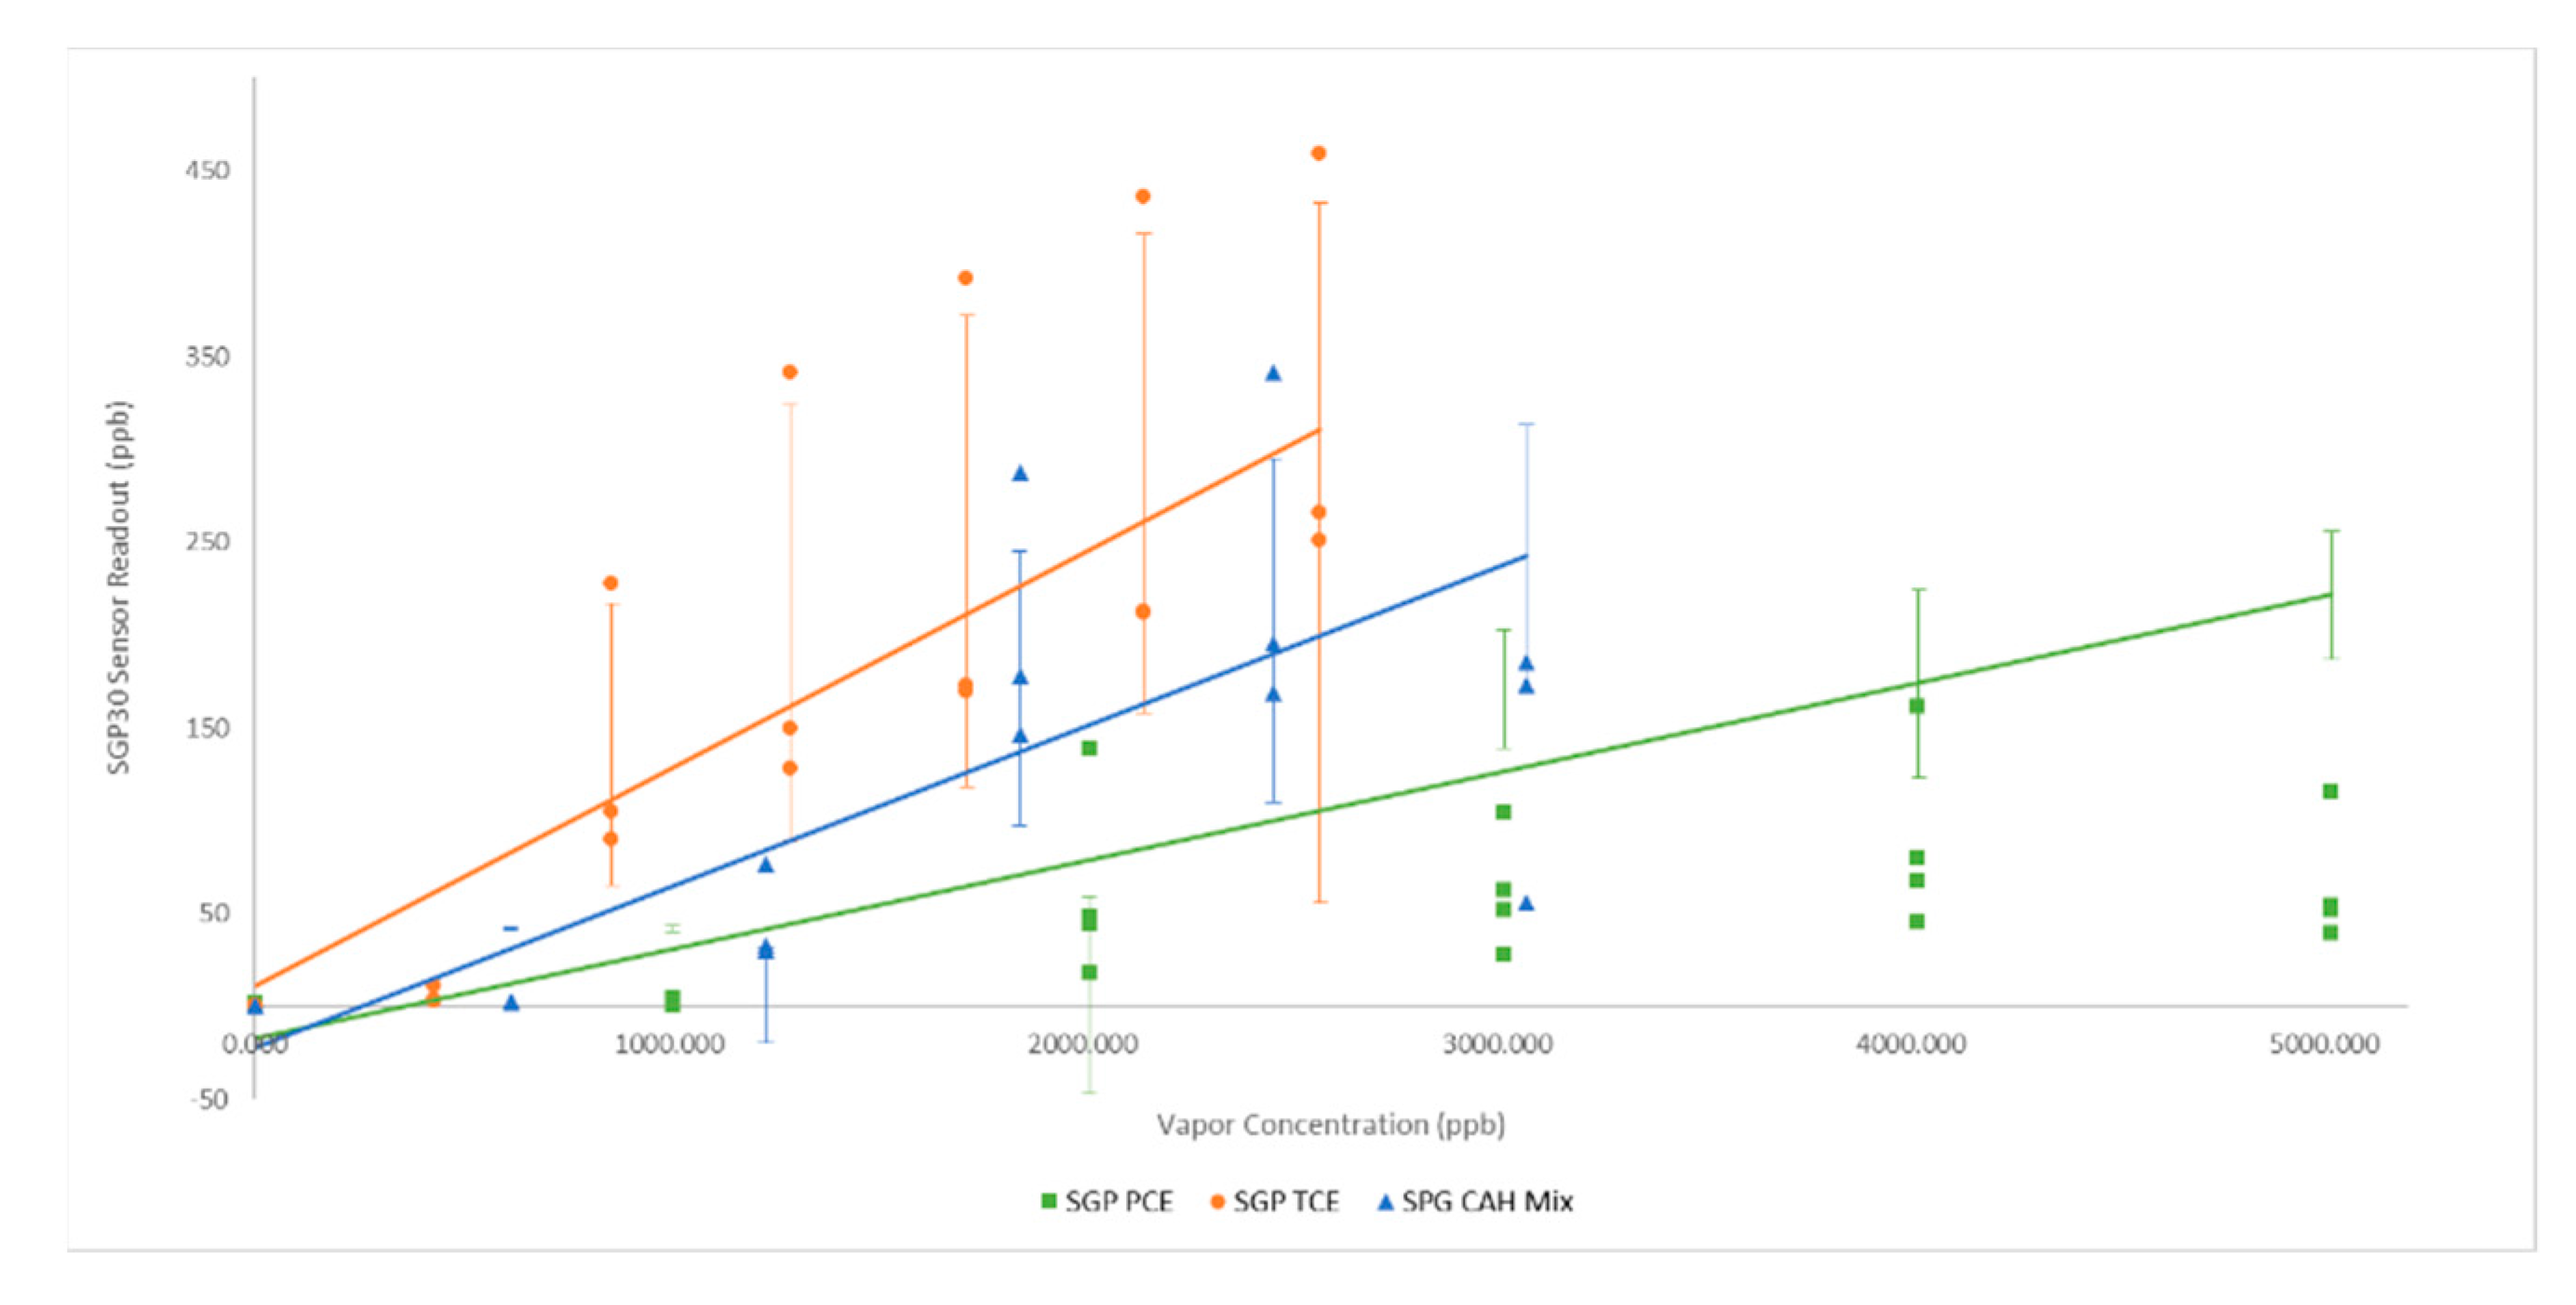
Data obtained in each of the sensor response to target chemical experiments (
Figure 2,
Figure 3,
Figure 4,
Figure 5 and
Figure 6) were subjected to regression analysis using Rstudio™ for calculation of linear least weighted squares slopes. Relevant statistical parameters, standard deviations (S.D.) and p-values, were calculated for each sensor experiment (
Table 2). It is noteworthy that
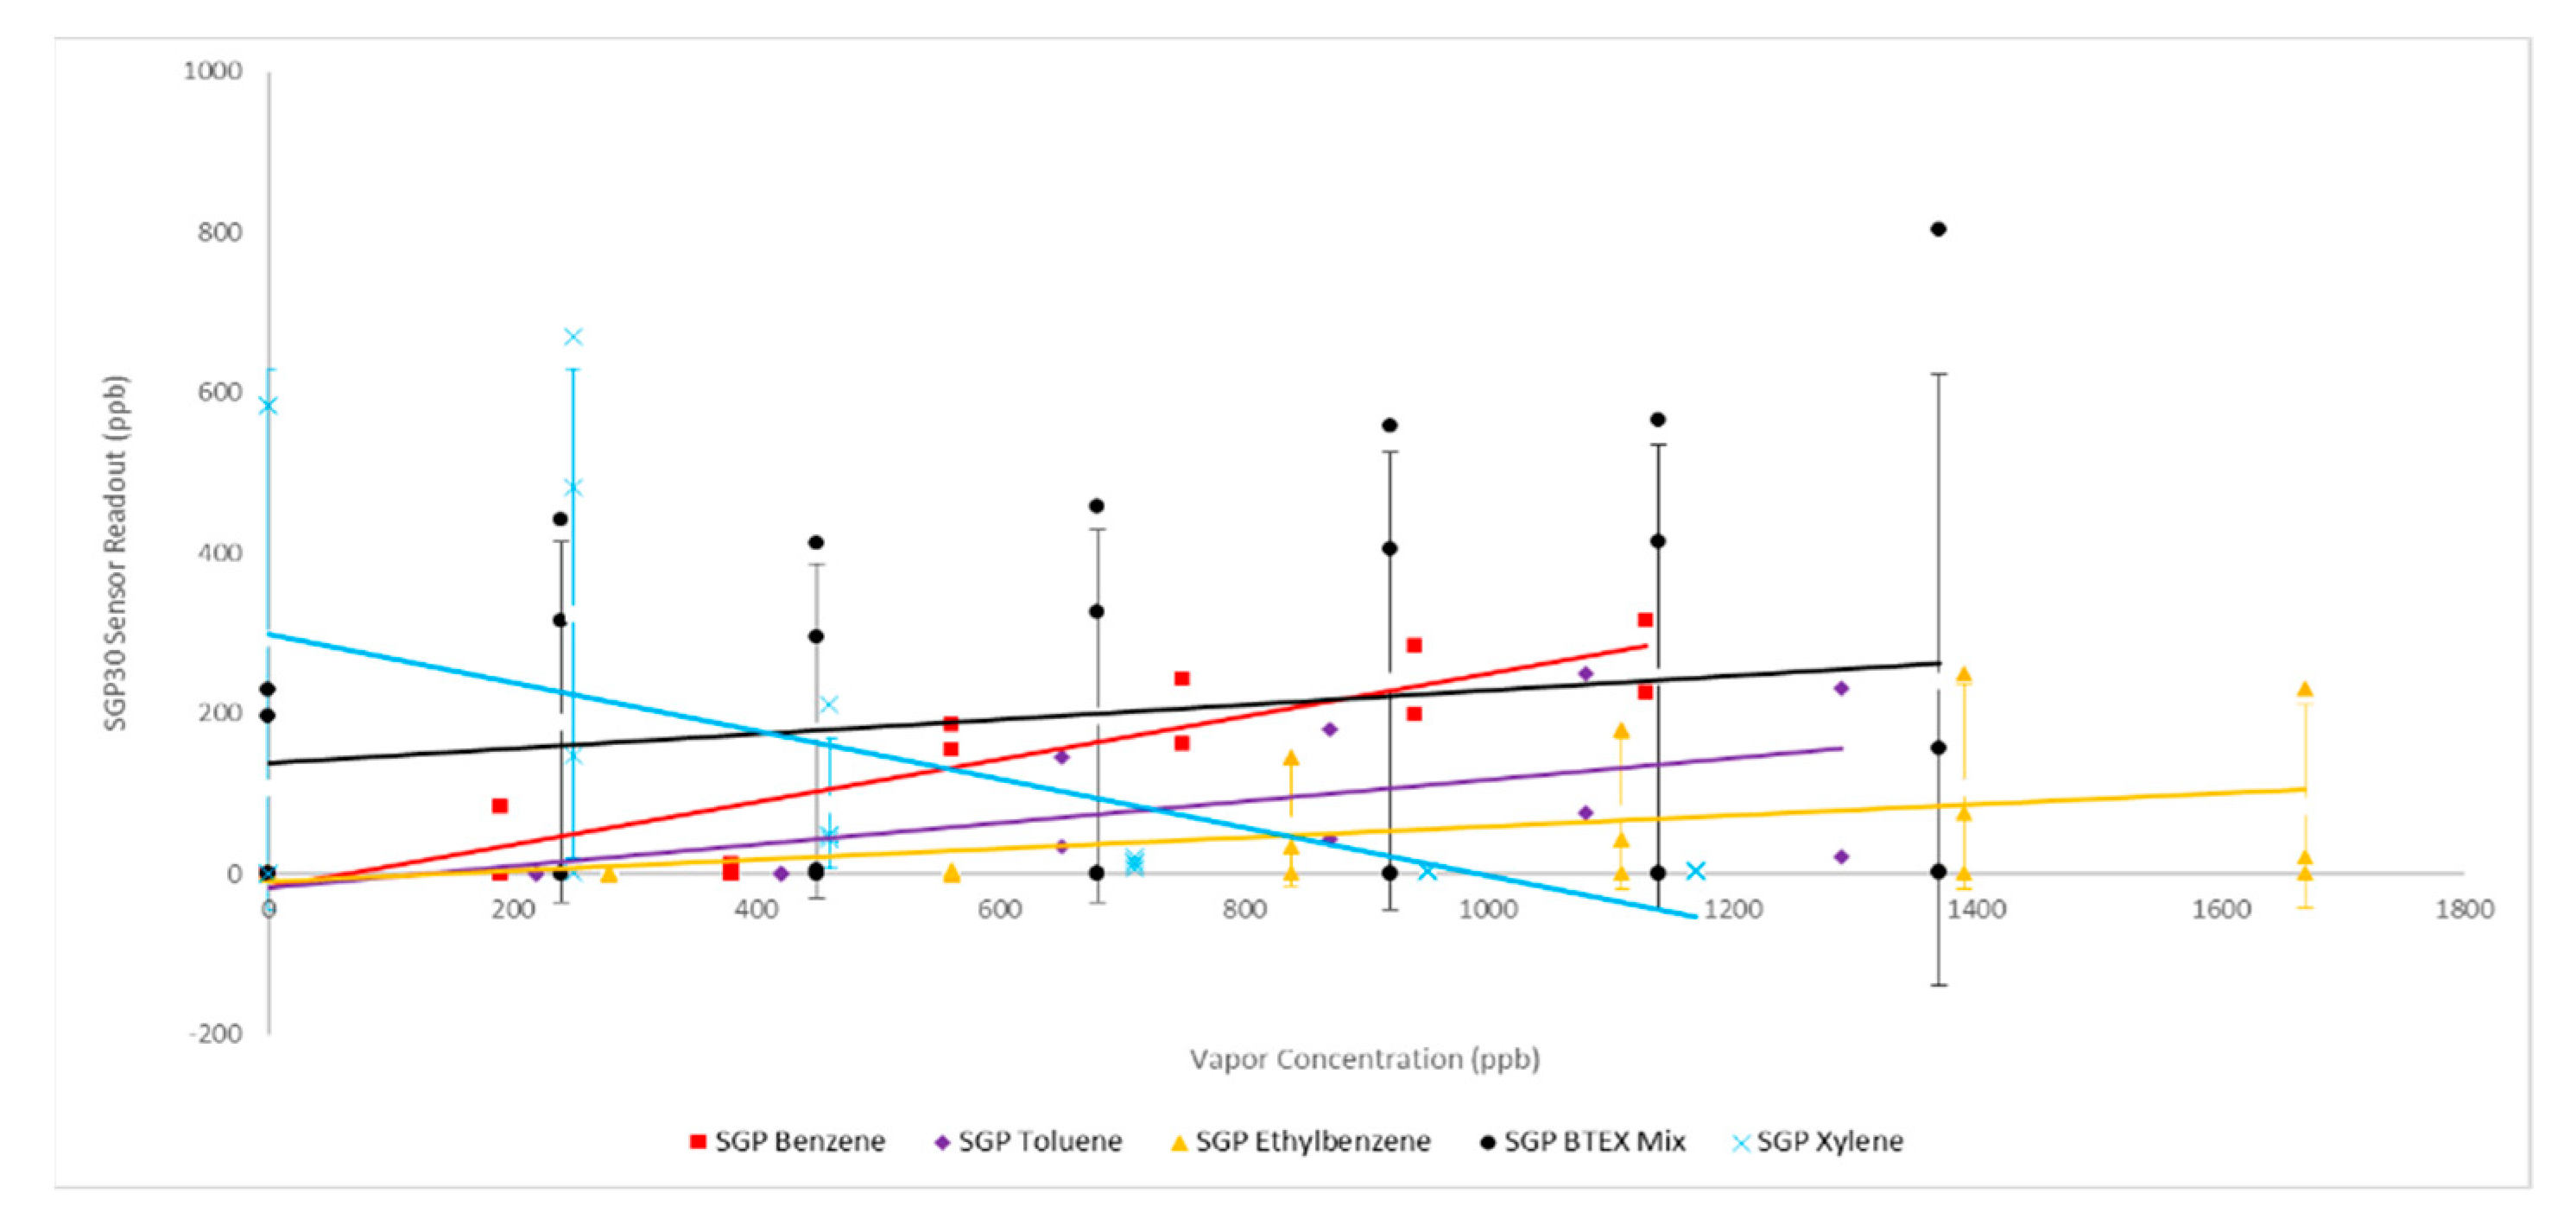
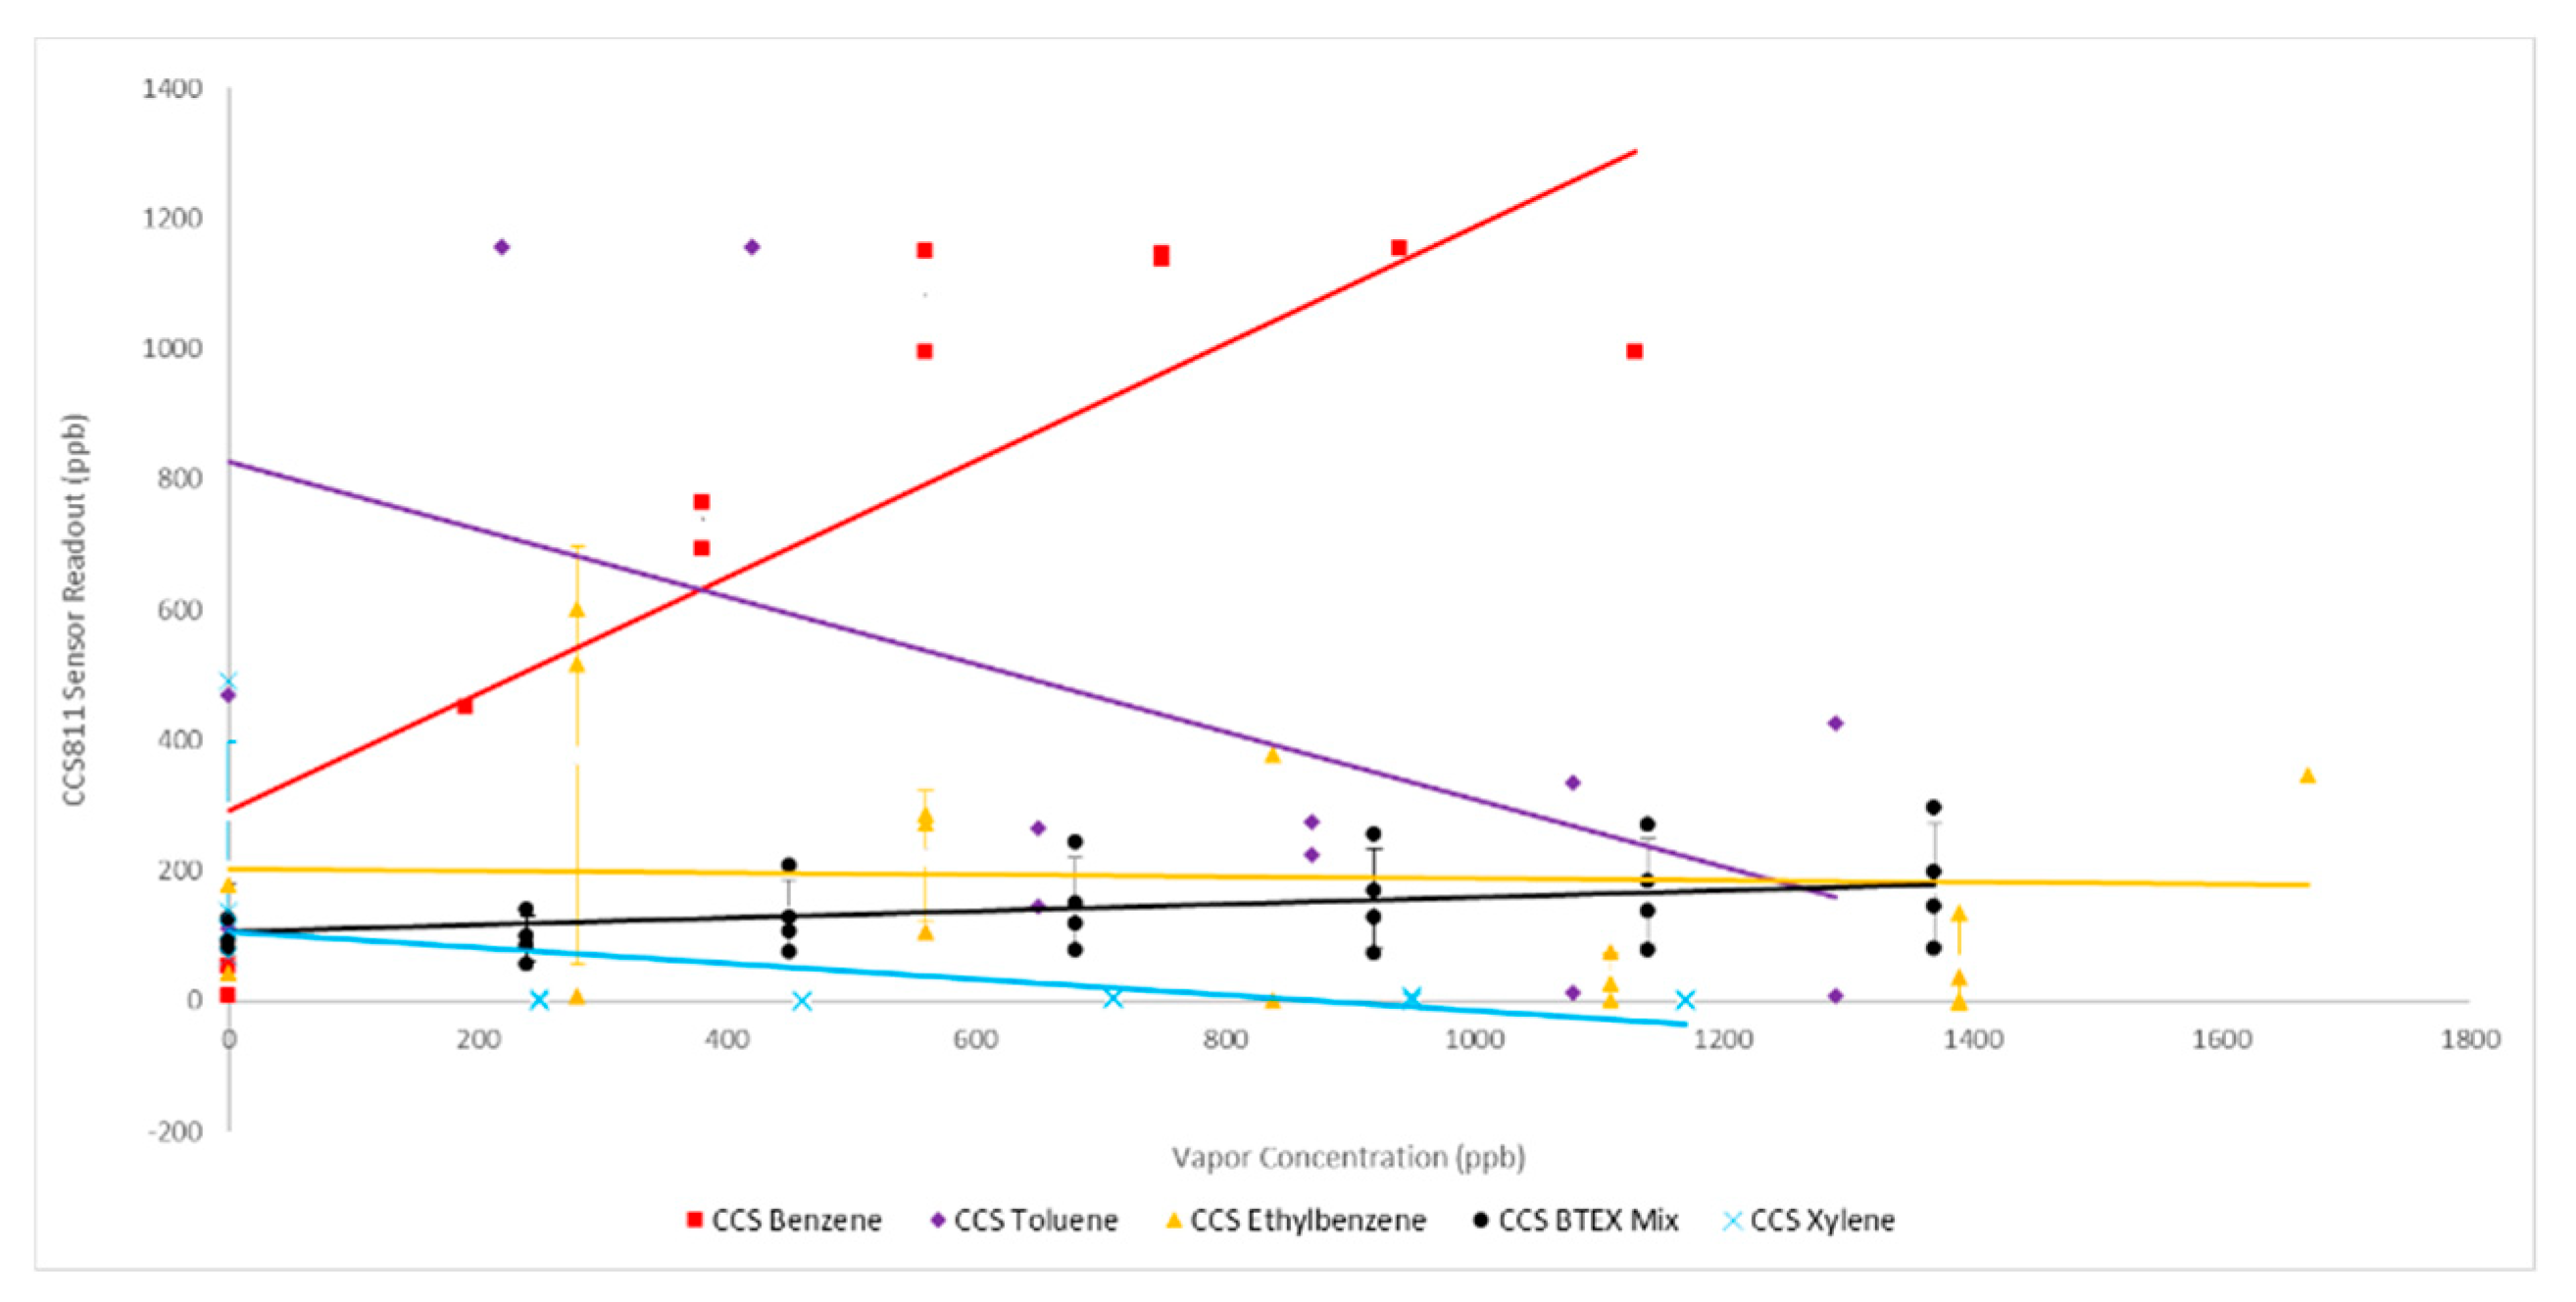
p-values < 0.05, representing ~95% likelihood of a statistically significant relationship, were only obtained for SGP30 datasets associated with xylene, as well as the target CAHs, while BME680 and CCS811 yielded statistically significant results for individual VOCs ethylbenzene (EtB), and xylenes, respectively.
Discernable sensor response trends were apparent in the BTEX chemical tests for each sensor, with benzene, toluene and ethylbenzene generally demonstrating similar response trends between the three sensors, while mixed xylenes consistently yielded oppositely directed resistive MOx response trends for each of the three sensor models examined. Although not demonstrating a statistically linear response, the magnitude of BME680 sensor responses over the tested concentration ranges yielded similar magnitude slopes for benzene and toluene, with a slightly larger sensor response to ethylbenzene (
Table 2). Sensor responses to the xylene isomer mix were the most surprising with BME680 showing an increase in resistance yielding a positive resistive slope, and contributing to the resultant statistically insignificant change in baseline for the BTEX mixture (
Table 2).
In BTEX mixtures containing mixed xylenes this oppositely directed resistive trend significantly affected overall sensor responses and TVOC readings. Most interestingly, the BTEX mixture appeared to yield values that were roughly summative of those obtained for each individual component BTEX sample reading. For each of the three SnO2 resistive MOx sensor models examined, sensor response trends with the xylene isomer mix consistently yielded an opposite response trend to that of benzene, toluene or ethylbenzene. This oppositely directed resistive response trend for mixed xylenes effectively canceled out the summative BTE individual species readings, leading to an approximately unchanged baseline for all sensors examined except SGP30.
In our studies CAH detection was effective in the ppb range making MOx sensors a possible alternative gas-sensing method relative to more expensive field methods under development, such as microGC (µGC), however, much more investigation of sensor responses to VOC mixtures is required. Our results indicate that the BME680 and SGP30 sensors tested provided the most consistent and reproducible results for all VOC hydrocarbons tested with the SGP30 sensors demonstrating low but statistically significant responses to the chlorinated aliphatic hydrocarbons. Previous examination of MOx sensor detection of TCE in headspace vapor of groundwater demonstrated detection down to the 0.03 g/l of TCE in water with reliable responses over the tested range of 0.03 mg/ml to 2.29 mg/ml [
12]. In that study, as in ours, authors emphasized the need to utilize sensor arrays and software analysis in order to obtain reliable or selective detection of a CAH compound in a mixture of other hydrocarbons.
The results obtained in this study underscore the importance of calibrating individual sensor responses to target hydrocarbons as well as the need for increased understanding of mixture effects on MOx sensor response [
18]. Manufacturers generally provide little information or recommendations for addressing the known drift and variable responses of resistive sensors to different chemicals, typically stating only that MOx sensors require regular recalibration. Close examination of real-time sensor responses is required in order to develop data analysis algorithms that address the geospatial and time-dependent variability inherent in large field sampling, as well as sensitivity, accuracy and response dynamics associate with collection of such real-time monitoring data [
19]. Sensor arrays have been widely proposed to overcome some of this variability, however, calibration of such arrays is particularly complex with respect to model development, fitting, and choice of calibration gas mixtures [
20,
21]. Additionally, advanced data analysis techniques will be required to account for the generally lower data quality associated with field measurement and more spatially distributed data samples. It has been recently shown that calibration against low concentration datasets of target VOCs is particularly important for indoor air quality applications [
14].
The results of this study support those previously reported with respect to benzene and toluene with toluene showing similar or slightly higher resistive changes [
18]. Results with toluene were least reliable in our early experiments. This is somewhat consistent with previous studies of MOx sensor responses to target hydrocarbons under uniform conditions, which determined that toluene was not a suitable candidate as a calibration gas due to its significant difference in sensor readings relative to various mixtures of either six or two mixtures of varying structural classes of hydrocarbons [
18]. Both that study and ours indicate significant differences in MOx sensor responses to varying hydrocarbon structures which may extend the already known drawbacks to field deployment of real-time MOx sensors such as low sensitivity, stability and reliability [
6,
22,
23,
24].
5. Conclusions
In this study we examined three IoT compatible sensors (SGP30, BME680, and CCS811) for measurement of VOCs gases. Varying resistive effects in mixed target VOC studies were identified in our study. Results indicate that sensor resistive responses to specific mixture chemical constituents require close examination, and specific calibration for, prior to deployment of MOx sensors for measuring levels of certain mixed VOC contaminants. Such mixture effects may make such calibrations more challenging in the presence of specific hydrocarbons such as xylenes. The sensors examined did not allow for identification of specific chemicals in the mixed vapor systems and results were limited by the small size of the sensor cohorts examined relative to that required for field applications. Of the two most reliable sensors examined for their response to target CAHs, only one (SGP30) demonstrated statistically significant, a similar magnitude, and resistive change in response to TCE and PCE, indicating that with appropriate calibration certain MOx sensors may be useful for the detection of these chlorinated aliphatic hydrocarbons.
The results obtained indicate that significant future work will be required to improve the reliability of MOx sensors for use in residential and work environments. Specifically, the best approach for deployment of MOx sensors will include careful quantitation of the sensing MOx film response to mixtures of target hydrocarbons present in a particular environment will be required in order to interpret sensor response data. Furthermore, standardized calibration protocols, containing relevant target VOCs specific to the detection environments, is strongly recommended for the confirmation of sensor responses prior to deployment. Finally, the development of multisensory arrays containing multiple sensing elements, and utilizing applied statistical analysis of recovered sensor data, will likely be required. Such arrays and advanced algorithms for data analysis are already under development as discussed and will likely be required for the widespread and successful deployment of MOx sensors.

 ,
, 


