1. Introduction
The development of analytical methods that are increasingly selective and sensitive is of paramount importance for different areas, including food, environmental, pharmaceutical, and other sectors. At this point, the analytical sciences play a key role, and among analytical techniques, electrochemical techniques are noteworthy [
1]. This statement is justified due to some of its advantageous features, such as high sensitivity and selectivity, moderate cost, portability, rapid responses, possibility of system miniaturization, and analysis of complex matrices [
2,
3]. Nevertheless, the utilization of electrodes in their original form without adding any other component limits its use for sensitivity, stability, and many other reasons. Thus, aiming to improve the features of electrochemical sensors, chemically modified electrodes (CMEs) have arisen for this purpose [
4,
5]. The term “chemically modified electrodes” was initially used by Murray and collaborators in the 1970s [
6].
CMEs are electrodes with chemically active species, resulting from the immobilization of a modifying agent on the surface of a base electrode. The purpose of this modification is to preset and control the physical-chemical nature of the electrode-solution interface as a means of altering the reactivity and selectivity of the base sensor [
7]. The modification of these electrodes can be done in several ways and using different materials. A new alternative in the practice of modifying electrodes that deserves highlighting is the use of molecularly imprinted polymers (MIPs) [
8,
9]. MIPs have been attracting considerable attention since the last decade; when they appeared as a promising tool for the development of systems with biomimetic recognition, similar to substrate-enzyme and/or antigen-antibody specific systems. Advantages of MIPs regarding biological materials include easy preparation, low cost, and simple storage (which is usually room temperature and for extended periods), among others [
10]. The use of MIPs stands out for its acquired selectivity. This selectivity is due to molecular recognition of the imprinted polymer, which is obtained from the analyte molecule of interest [
10,
11].
Conventionally, MIPs are synthesized by the bulk method, where the reaction is carried out in a homogeneous system. There are several steps for the synthesis of MIPs, such as carefully establishing the choice of the employed monomer and the analyte of interest, which must interact strongly to form a stable complex. This analyte-monomer interaction can occur through covalent bonds, which have more selective sites, but this would restrict the applicability of the MIPs to just a few analytes. The interaction can also occur by non-covalent bonds, which have fewer selective sites, but is more commonly used because of the greater flexibility of application to MIPs for different analytes [
11,
12].
Another important parameter that influences stability of the formation of “analyte–monomer” complex is the solvent. The substance chosen as solvent must provide a soluble medium without interfering in the interaction between analyte-monomer. The solvent should also induce the formation of pores that will facilitate the diffusion of analyte through the selective sites. Such solvents are called porogenic [
10]. Finally, selectivity of these polymers is also ensured by the use of reagents that promote crosslinking in the polymer, thus allowing thermal and mechanical stability of the "analyte–monomer” complex. Also necessary is the addition of a radical initiator to the reactional medium in order to initiate the polymerization reaction [
1,
10].
MIPs have proved to be an excellent tool for analytical chemistry due to their versatility of applications, including their use in pre concentration methods, such as solid-phase extraction (SPE) [
13] and solid-phase microextraction (SPME) [
14]; in separation processes, such as high-performance liquid chromatography (HPLC) [
15], capillary electrophoresis (CE) [
16], capillary electrochromatography (CEO) [
17], and thin layer chromatography (TLC) [
18]; and a growing interest in the use of these polymers in electroanalytical methods. Among them, the utilization of sensors stands out due to some unique features, such as low cost, portability, and the possibility of miniaturization, thus allowing the obtainment of information in situ and in real time [
3,
6].Even with such features, sensors can suffer from lack of selectivity. The use of MIP stands out for the obtainment of highly selective sensors [
1].
Benilda et al. [
19] reported the use of MIP in a sensor for determination of the antibiotic chloramphenicol. The sensor exhibited low cost and showed to be promising for the quantification of chloramphenicol residues in food products. Gu et al. [
20] used MIP with an enzyme to enhance the catalytic efficiency of the sensor for determination of metronidazole. This sensor showed a low limit of detection and a good response for metronidazole determination. Another study using MIP was conducted by Reza and Motaharian [
21], in which they developed a sensor based on a carbon-paste electrode modified with MIP for determination of diazepam in tablets and in human serum samples. The sensor showed a good response for diazepam. Abdelrehim et al. [
22] utilized MIP as a modifier for a carbon-paste electrode to identify famciclovir (FCV). This study presented a low limit of detection and a good application for FCV determination in pharmaceutical preparations.
In this way, the use of imprinting technology is an excellent alternative for obtaining new voltammetric methods, especially when associated with materials that facilitate electron exchange with the electrode surface, as in the case of carbon nanotubes (CNTs).
Iijima synthesized carbon nanotubes for the first time in 1991, and since then, CNTs have aroused great interest for different applications. They have distinct features, such as electronic properties, high mechanical strength, and their chemical properties—in particular, their thermal conductivity and electrical conductivity attracted attention for their excellence [
23,
24].
CNTs are formed by carbon hexagonal arrangements disposed in graphene sheets that are rolled into a cylindrical shape with diameters in the nanometer scale. From a structural point of view, there are two types of CNTs. Single-walled carbon nanotubes (SWNTs), which can be viewed as a single graphene sheet rolled on itself to form a cylindrical tube, and multiwalled carbon nanotubes (MWCNTs), comprising a set of three or more concentric nanotubes rolled up on each other [
23].
The modified electrodes are an outstanding alternative for determining substances of pharmaceutical and medical interest, and others, due to features such as selectivity, sensibility, low cost, and portability.
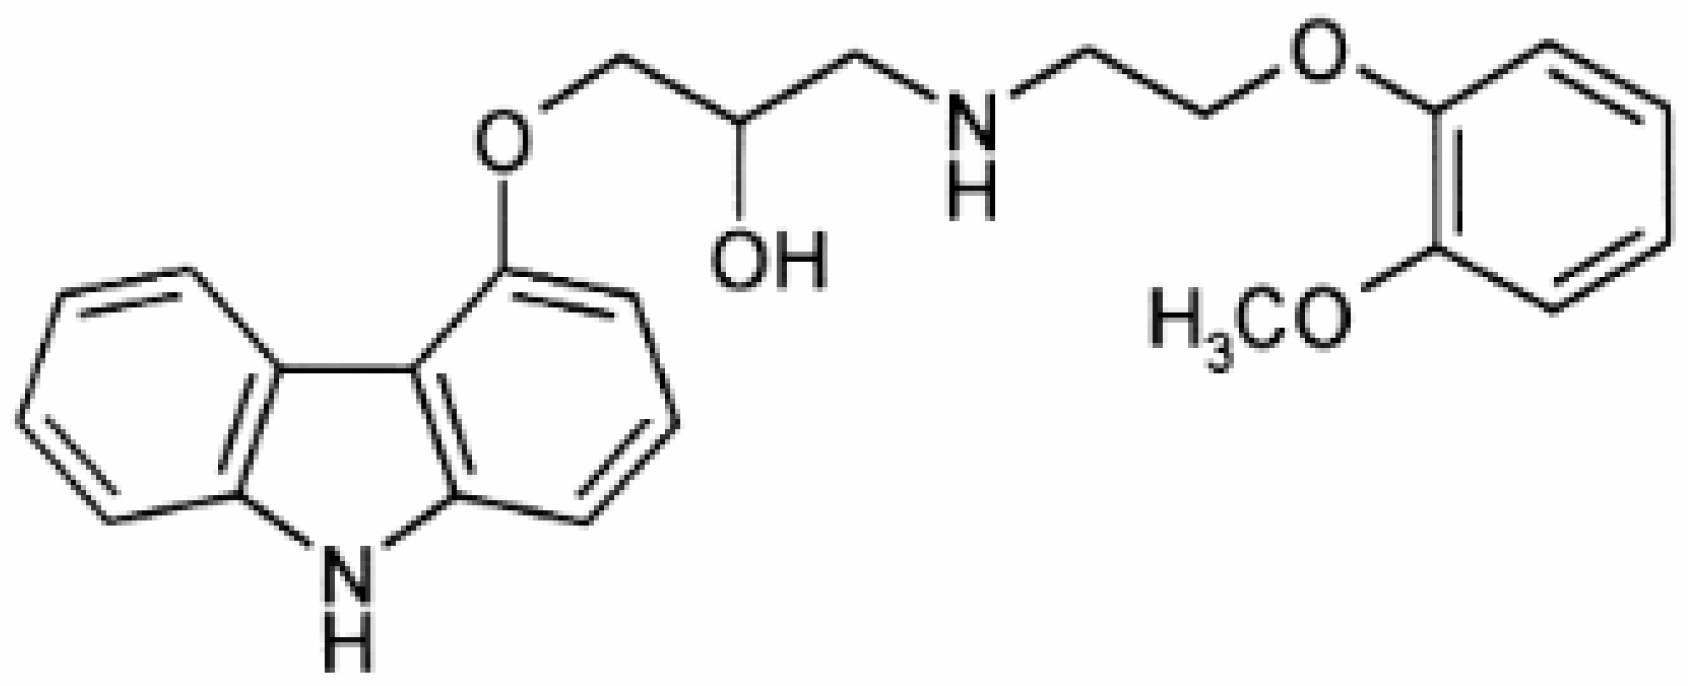
A substance whose determination presents is of significance, in both pharmaceuticals and human plasma, is carvedilol (CAR). CAR belongs to the third generation of β-blockers, which includes, besides the β-blocking function, a vasodilator function due to the α-adrenoceptor. CAR is used in the treatment of severe congestive heart failure and hypertension [
25]. The CAR structure is shown in
Figure 1.
Beta-adrenergic blockers are a class of drugs that possess the ability to block β noradrenaline receptors. Beta-adrenergic receptors are divided into two subtypes, β1 and β2, which are present in different concentrations in body tissues [
25,
26].
Beta-adrenergic blockers may also be divided into three generations in accordance with the degree of cardio selectivity compared to the blocking effect of β1 and β2 receptors. CAR is in the third generation, presenting nonspecific vasodilator properties [
26,
27].
CAR has α1 vessel-dilating action; moreover, it has a high antioxidant effect and is an oxygen radical scavenger, thus protecting heart membranes from lipid peroxidation induced by these radicals [
27]. As cardiovascular diseases are a major group of diseases, considering the frequency at which they occur and the number of deaths related to them, the quantitative determination of CAR in pharmaceuticals and in human plasma is important, mainly for quality control, as more and more people need medication to control these cardiovascular diseases [
2,
27].
In this context, many analytical techniques have been employed for determination of CAR, such as high-performance liquid chromatography [
28], spectrophotometry [
29], capillary electrophoresis [
30], and electrochemistry [
2]. Electrochemical techniques stand out because (1) they allow investigating the redox properties of the studied drug; (2) have rapid, sensitive, and selective responses; (3) render system miniaturization possible; and (4) permit analysis of complex matrices [
2]. However, it must be pointed out that the use of MIP integrated on electrochemical devices for larger molecules, such as the carvedilol, is not so straightforward, because such molecules can hinder the creation of selective binding sites in the MIP. Therefore, the highlight of the proposed method relies upon the synthesis of MIP for carvedilol, which has been little exploited due to the molecule’s larger size, and its integration onto the surface of transducer electrode in the presence of multiwalled carbon nanotube. The feasibility of the sensor was verified using electroanalytical analysis of CAR in pharmaceutical formulations.
2. Experimental
2.1. Reagents and Solutions
Multiwalled carbon nanotubes (MWCNTs)—99% purity, diameter between 6 and 13 nm, and length between 2.5 and 20 µm—were acquired from Nanocyl® (Auvelais, Belgium), carvedilol (CAR) was supplied by Sigma-Aldrich® (St. Louis, MO, USA), dimethylformamide (DMF) was purchased from F.MAIA Industry and Trade Ltda.® (Cotia, Brazil), phosphoric acid was purchased from Qhemis® (Indaiatuba, Brazil), boric acid was acquired from Labsynth® (Diadema, Brazil), acetic acid was purchased from Labsynth® (Diadema, Brazil), methanol was acquired from J.T.Baker®(Ecatepec Estado de Mexico)Nafion was supplied by Sigma-Aldrich® (St. Louis, MO, USA), potassium chloride was purchased from Sigma-Aldrich® (St. Louis, MO, USA), hydrochloric acid was acquired from Vetec Química Fina® (Industrial District of Duque de Caxias, Brazil ), and sodium hydroxide was supplied by Sigma-Aldrich® (St. Louis, MO, USA). For the synthesis of MIP, the following reagents and solvents were used:methacrylic acid (Sigma-Aldrich; Japan), chloroform (Tedia®; Fairfield, CA, USA), (J. T. Baker®; Ecatepec Estado de Mexico, México), methanol (J.T. Baker; Ecatepec Estado de Mexico), ethylene glycol dimethacrylate (Sigma-Aldrich; USA) and 4,4′-azobis-(4-cyanopentanoic acid) (Santa Cruz Biotechnology). All chemical reagents were analytical grade and solutions were prepared in distilled and deionized water (resistivity > 18 MΩ·cm−1, 25 °C; purification system Milli-Q® Millipore, Bedford, MA, USA).
2.2. Instrumentation
Electrochemical measurements were performed with a Multi Autolab potentiostat/galvanostat, model PGSTAT101 Ecochemie, controlled by Nova 1.11 software. The system used for obtaining electrochemical measurements consisted of a glass cell containing five orifices: three for the electrodes, one for gas inlet (N2), and one for addition of reagents. Auxiliary and reference electrodes were made of a platinum wire spiral and Ag/AgCl, respectively. A glassy carbon disk electrode with a diameter of 3 mm was used as a bare electrode. Analysis by Fourier-transform infrared spectroscopy (FT-IR) was carried out using a Fourier Transform Spectrometer (Bomem Hartmann & Braun, MB series, Quebec, Canada), operating between 4000 and 400 cm−1 at 4 cm−1 resolution, using the conventional method (KBr pellet). Thermo gravimetric analysis (TGA) was conducted in a thermo balance (2950 Thermal Analysis Instrument, Instrument, New Castle, DE, USA) with a heating rate of 10 °C·min−1, under nitrogen flow (50 mL·min−1) from 25 to 600 °C. The scanning electron microscopy (SEM) images were obtained using a TM3000 Hitachi Analytical Table Top Microscope (Tarrytown, NY, USA) with an acceleration tension of 15 kV.
2.3. Synthesis of MIP
Molecularly imprinted polymer was synthesized by using 1.0 mmol of CAR, 4.0 mmol of methacrylic acid dissolved in 10.0 mL of chloroform, 1.0 mL of acetonitrile, and 1.0 mL of methanol (J.T. Baker; Mexico). Next, 20.00 mmol of ethylene glycol dimethacrylate and 0.3 mmol of 4,4′-azobis-(4-cyanopentanoic acid) were added to the mixture. The solution was sonicated in an ultrasonic bath (Ultra Clener—Unique, Brazil) for 10 min, followed by nitrogen flow for 5 min. Taking into account that polymer synthesis was carried out through radical polymerization, the removal of dissolved oxygen was needed, and was accomplished using nitrogen flow. The solution was sealed in vials, and then placed in an oven at 80 °C for 24 h. Following successful polymerization, the material was washed with methanol/acetic acid (9:1,
v/
v) several times using an ultrasonic bath. The removal of template from cavities of polymer has been shown to be efficient when using a methanol/acetic mixture [
31]. Total removal of CAR from MIP was monitored by HPLC. In order to remove the residual acid molecules that would potentially affect the rebinding process, upon removal of template, successive washings of polymer with deionized water were carried out until pH ≅ 7.0. The blank polymer (NIP, non imprinted polymer) was synthesized similar to MIP, but without template.
2.4. Preparation of Suspension for Electrode Modification
The suspension used for glassy carbon electrode modification was prepared from 10 mg of MIP, 10 mg of MWCNT, and 1.0 mL of DMF. This suspension was placed in an ultrasonic bath for 5 min, and 10.0 μL of sonicated suspension was then dripped onto the surface of a glassy carbon electrode (GCE) and kept at rest at room temperature to volatilize the solvent. The same procedure was carried out for the blank polymer (NIP).
2.5. Optimization of Experimental Parameters
Firstly, to evaluate the influence of electrode modification on the determination of CAR, cyclic voltammograms (CVs) were recorded in the potential window varying from −0.7 to 0.5 V using the unmodified glassy carbon electrode (GCE), GCE modified with MWCNT, and GCE modified with MIP and MWCNT. After that, cyclic voltammograms were performed, varying the concentration of MIP in suspension (50%, 60%, 65%, and 70% (m/m) with respect to MWCNT). Then, the influence of Nafion was evaluated in order to obtain a better fixation of the suspension on the surface of GCE. The influence of pH (7.0–9.0) on the analytical response of the modified sensor was investigated by using 0.1 mol·L−1 Britton–Robinson (BR) buffer. Subsequently, the effect of BR concentration was studied in the range from 0.05 to 0.30 mol·L−1, while the influence of KCl concentration was evaluated from 0.10 to 1.00 mol·L−1.
3. Results
3.1. Characterization of MIP and NIP
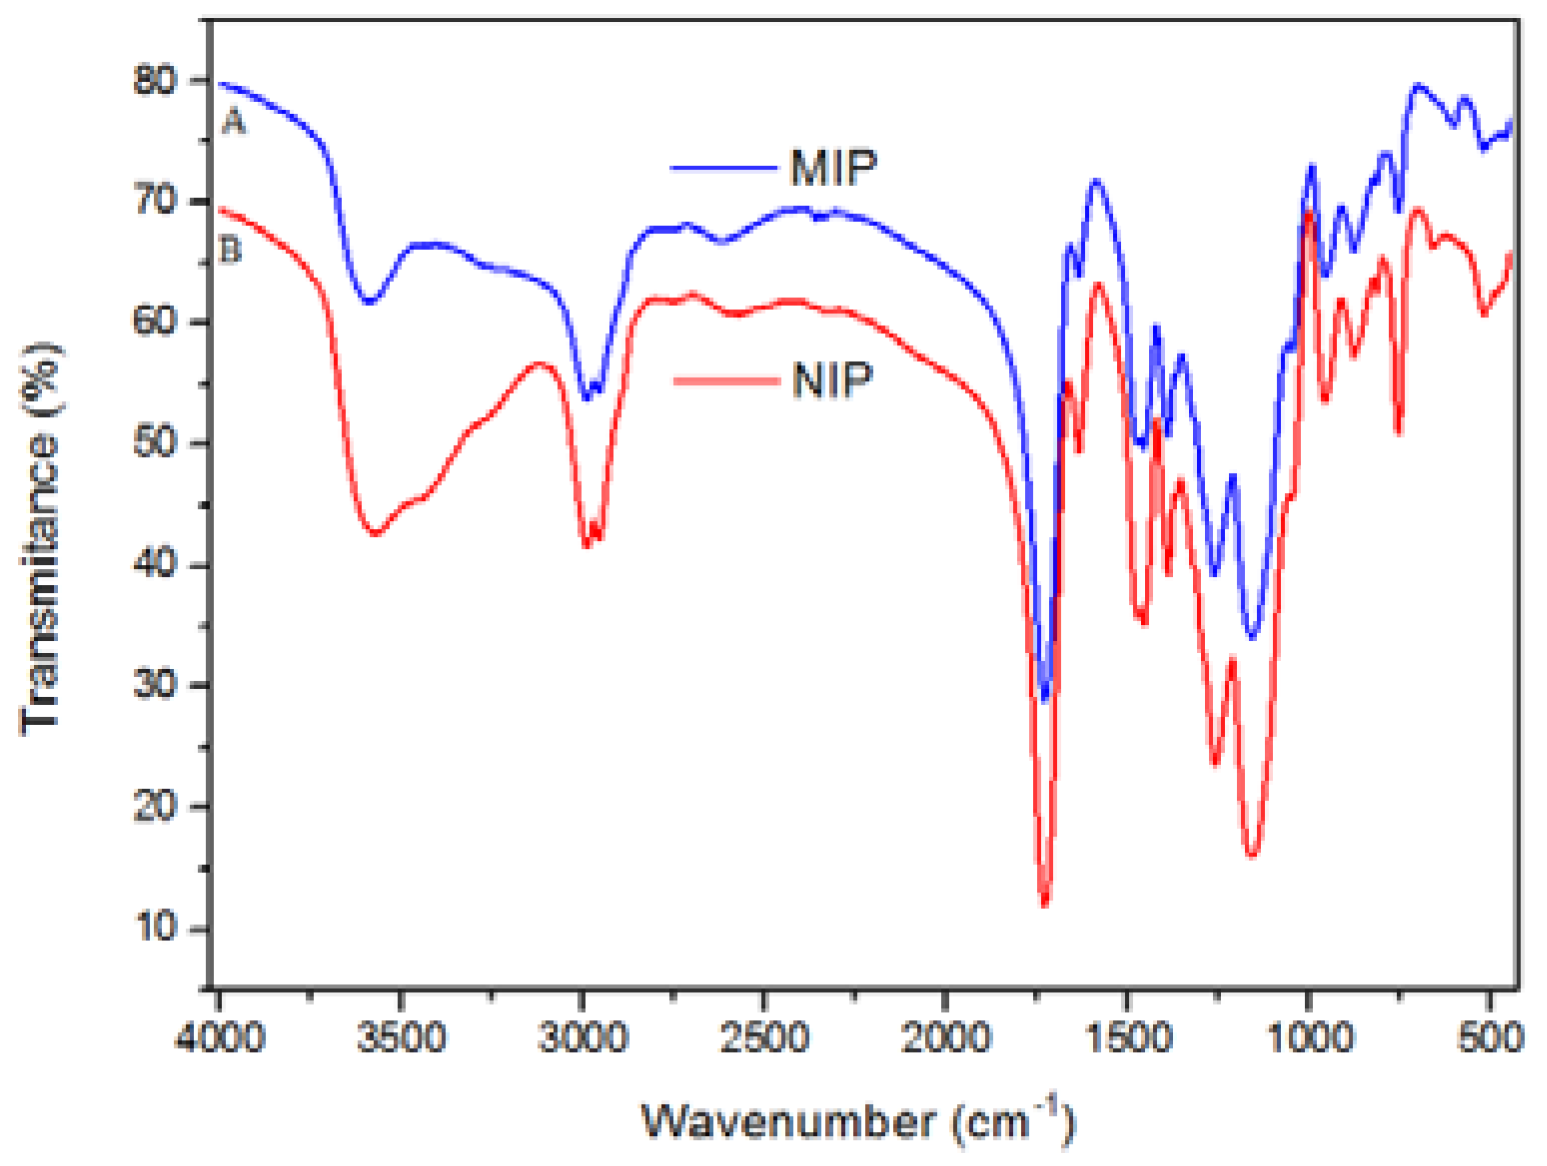
FT-IR was carried out to evaluate the presence of functional groups in the polymers. In
Figure 2, one can observe the presence of a similar chemical composition for MIP and NIP. This observation is explained taking into account that both materials were synthesized using the same reagents, except for the addition of template to MIP. The band at 1649 cm
−1 was attributed to sp
2 hybridized carbon stretching, which was believed to be from unsaturated reagents that have not been consumed or by OH deformation from adsorbed water. The band at 1729 cm
−1 is characteristic of carboxyl stretch from methacrylic acid, and the band at 3563 cm
−1 is ascribed to hydroxyl stretch. The band at 1264 cm
−1 can be assigned to stretching of COOH from methacrylic acid, while the band at 1160 cm
−1 is attributed to O–C(O)–C from segments of ethylene glycol dimethylacrylate (EGDMA) [
32].
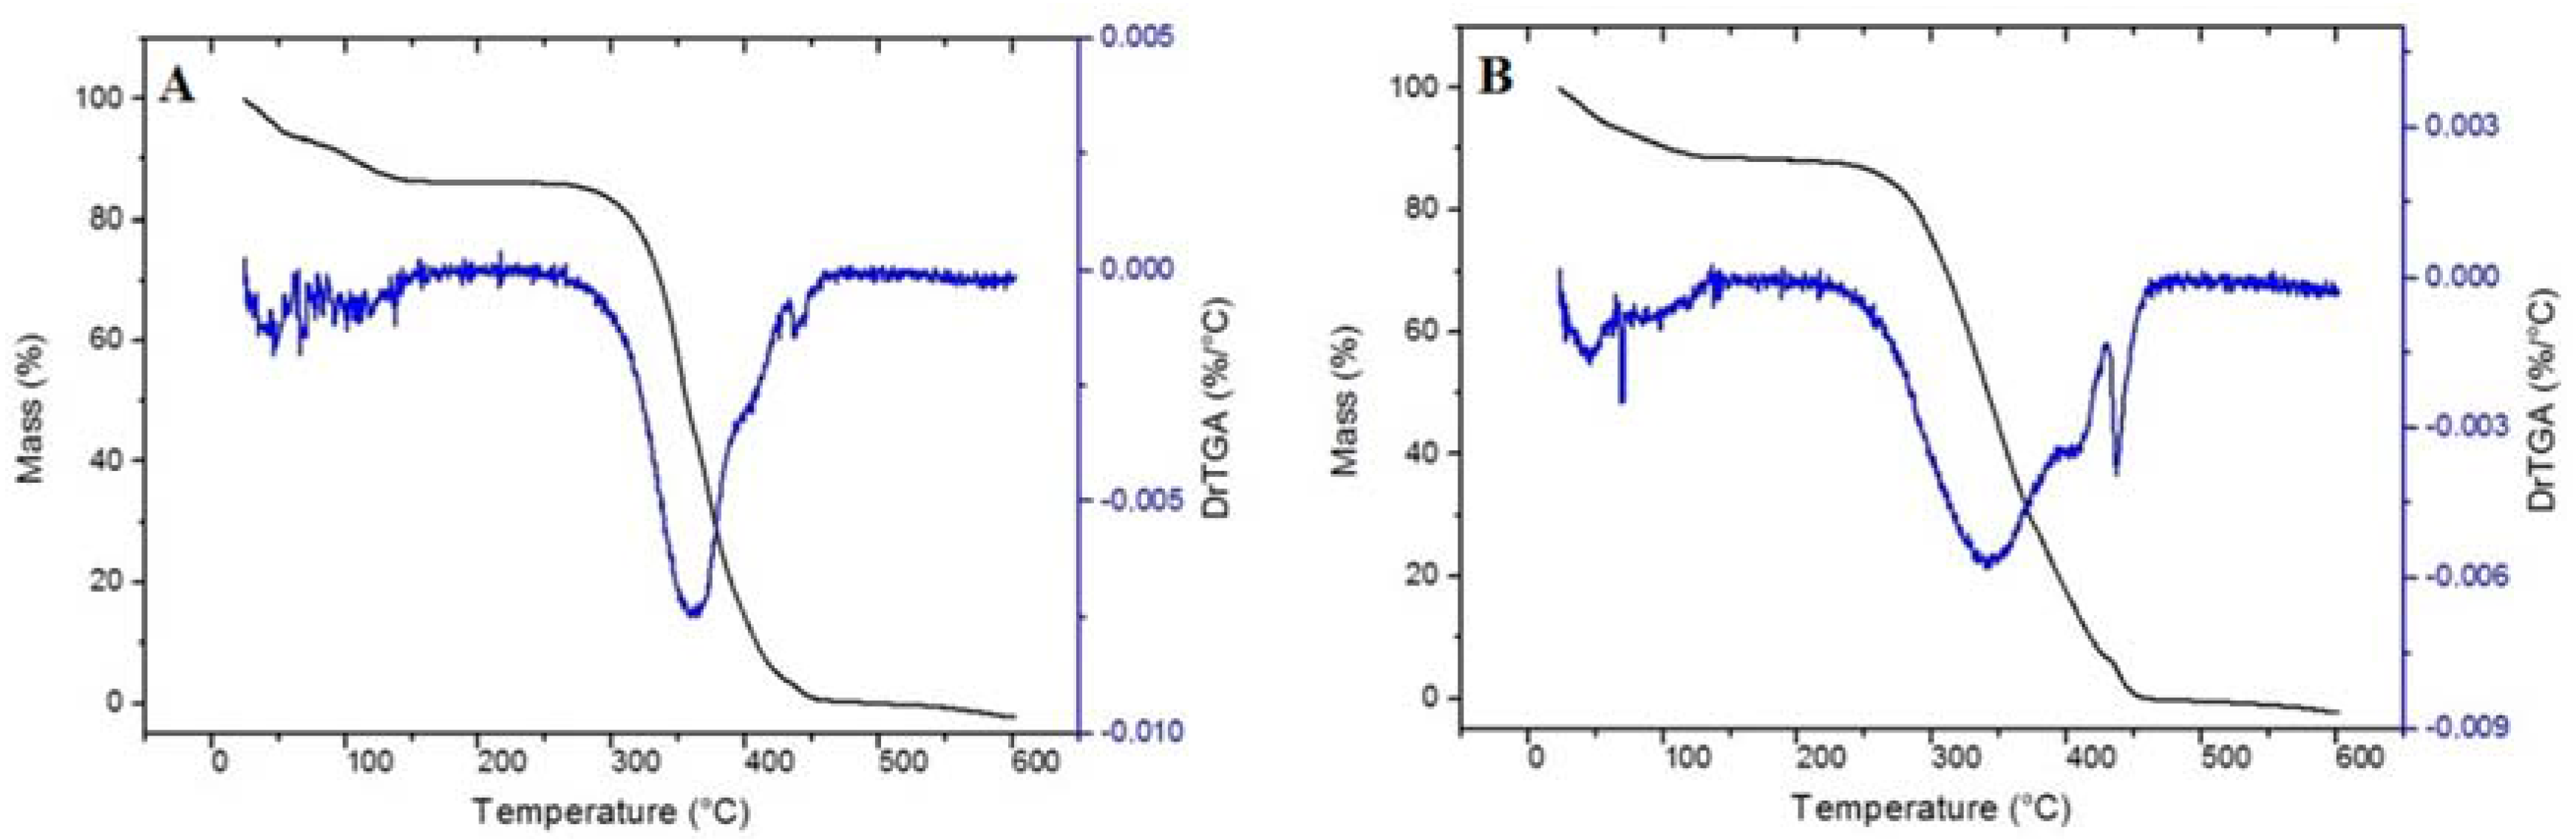
Thermo gravimetric analysis (TGA) evaluated the thermal stability of the materials. As may be observed in
Figure 3, TG curves for MIP and NIP have the same event of mass loss. The first region was around 100 °C, which might be related to the evaporation of water and/or solvent (chloroform) not consumed during the synthesis. A large weight loss was observed from 300 to 450 °C, which is attributed to decomposition of the methacrylic acid segment of the polymeric matrix as well as the decomposition of EGDMA [
33].Therefore, the achieved results demonstrated that the polymer is thermally stable at operating temperature.
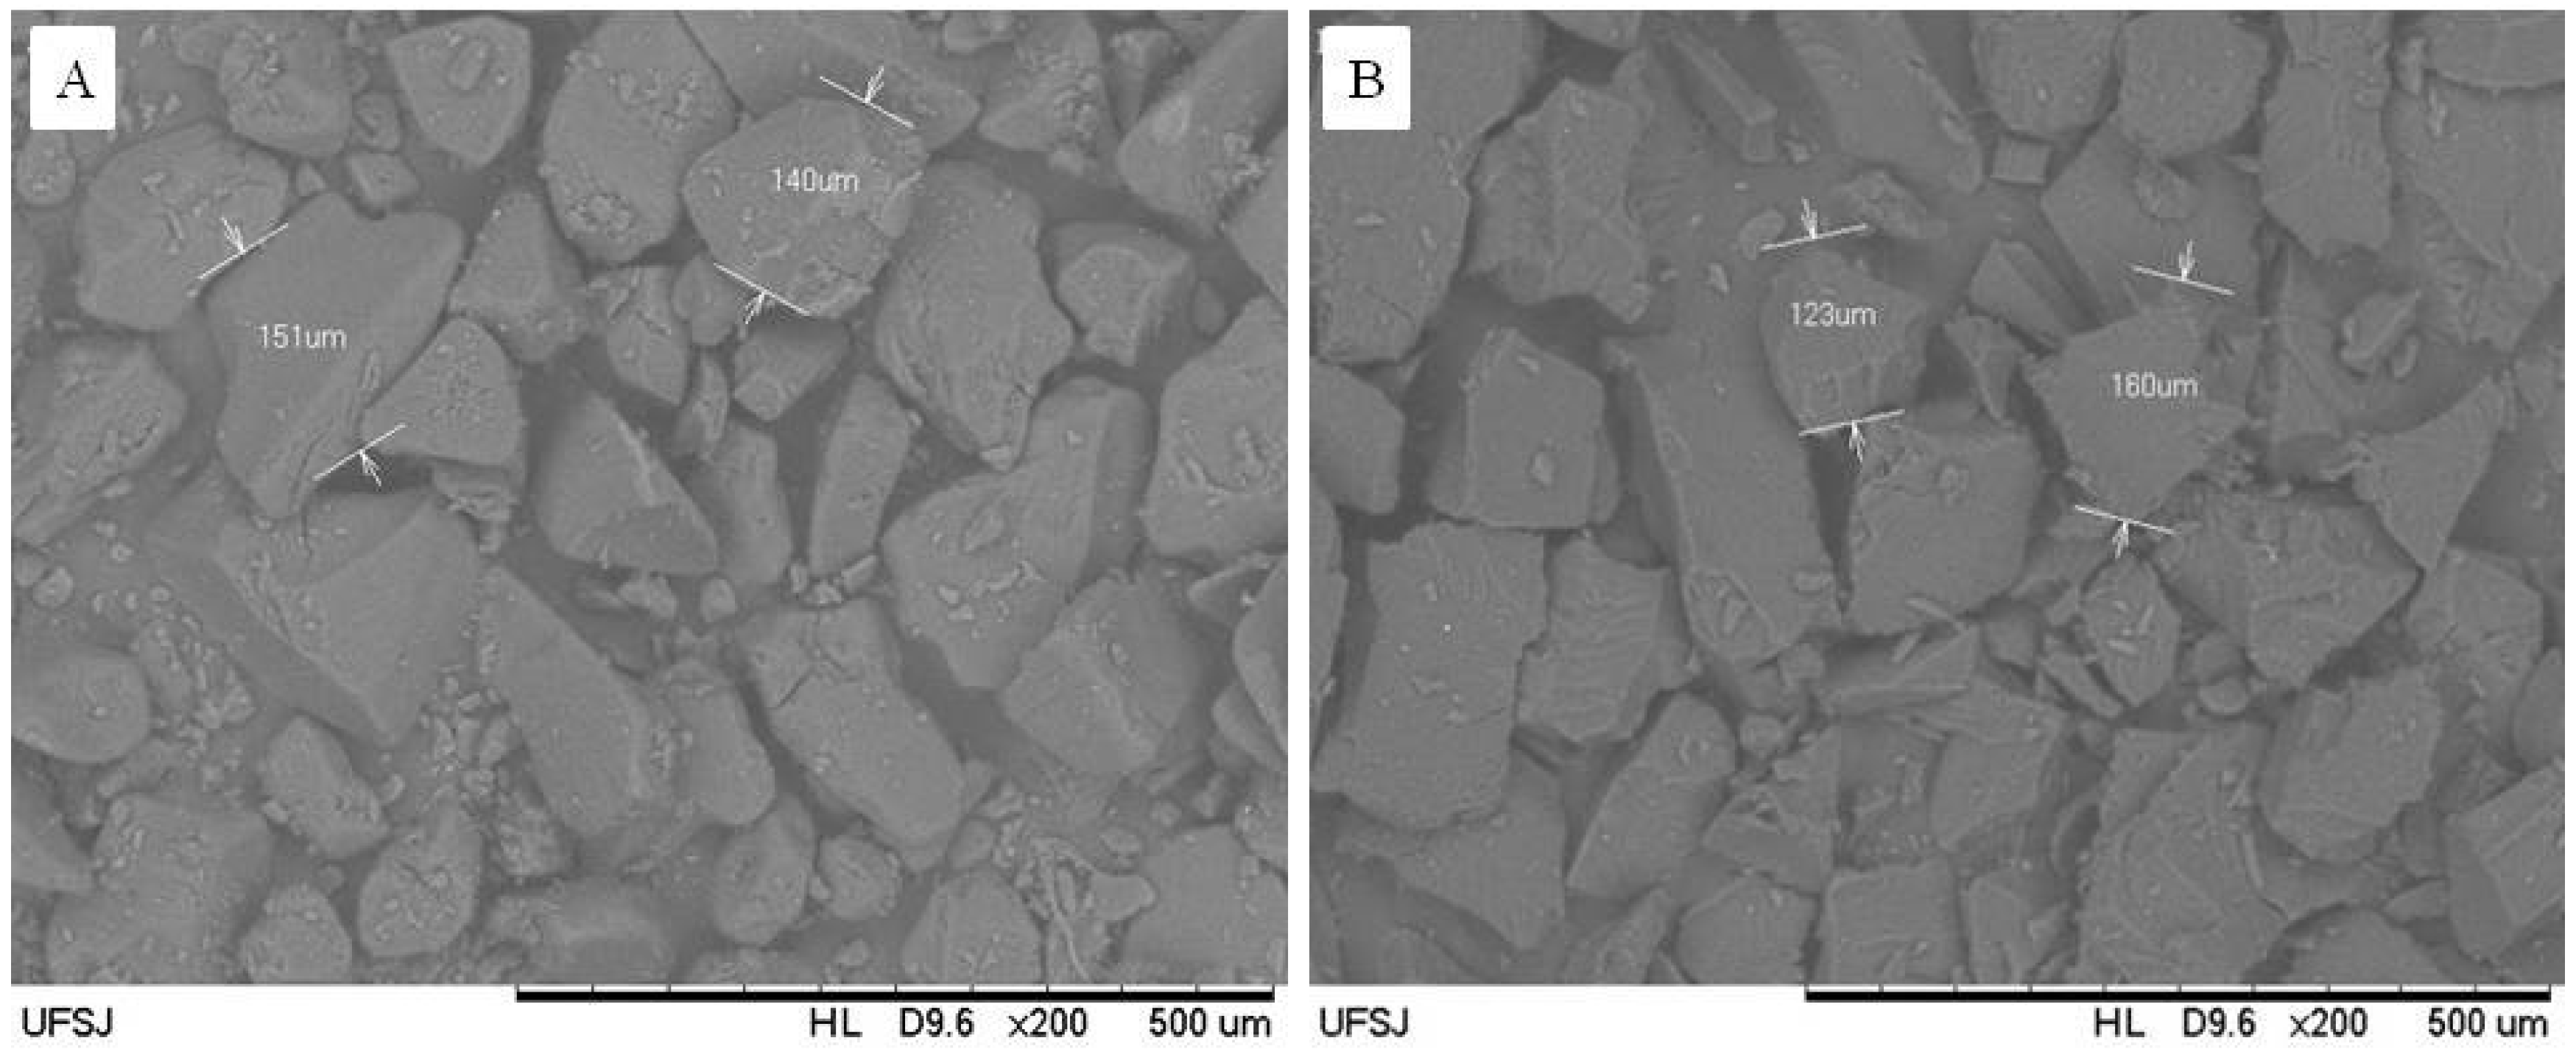
SEM images provided an analysis of morphological structure of MIP and NIP. As shown in
Figure 4, micrographs of MIP and NIP did not show any significant differences from one another, thus demonstrating that template did not influence the morphological features of MIP. Such a result indicates that the improved performance of MIP compared to NIP is attributed to imprinted sites and not morphological features. Analyzing
Figure 4, one can note the materials have irregular surface, composed of particles with non uniform sizes, which may result in the material adsorptive capacity. This morphological profile is very common for polymers synthesized by the bulk method.
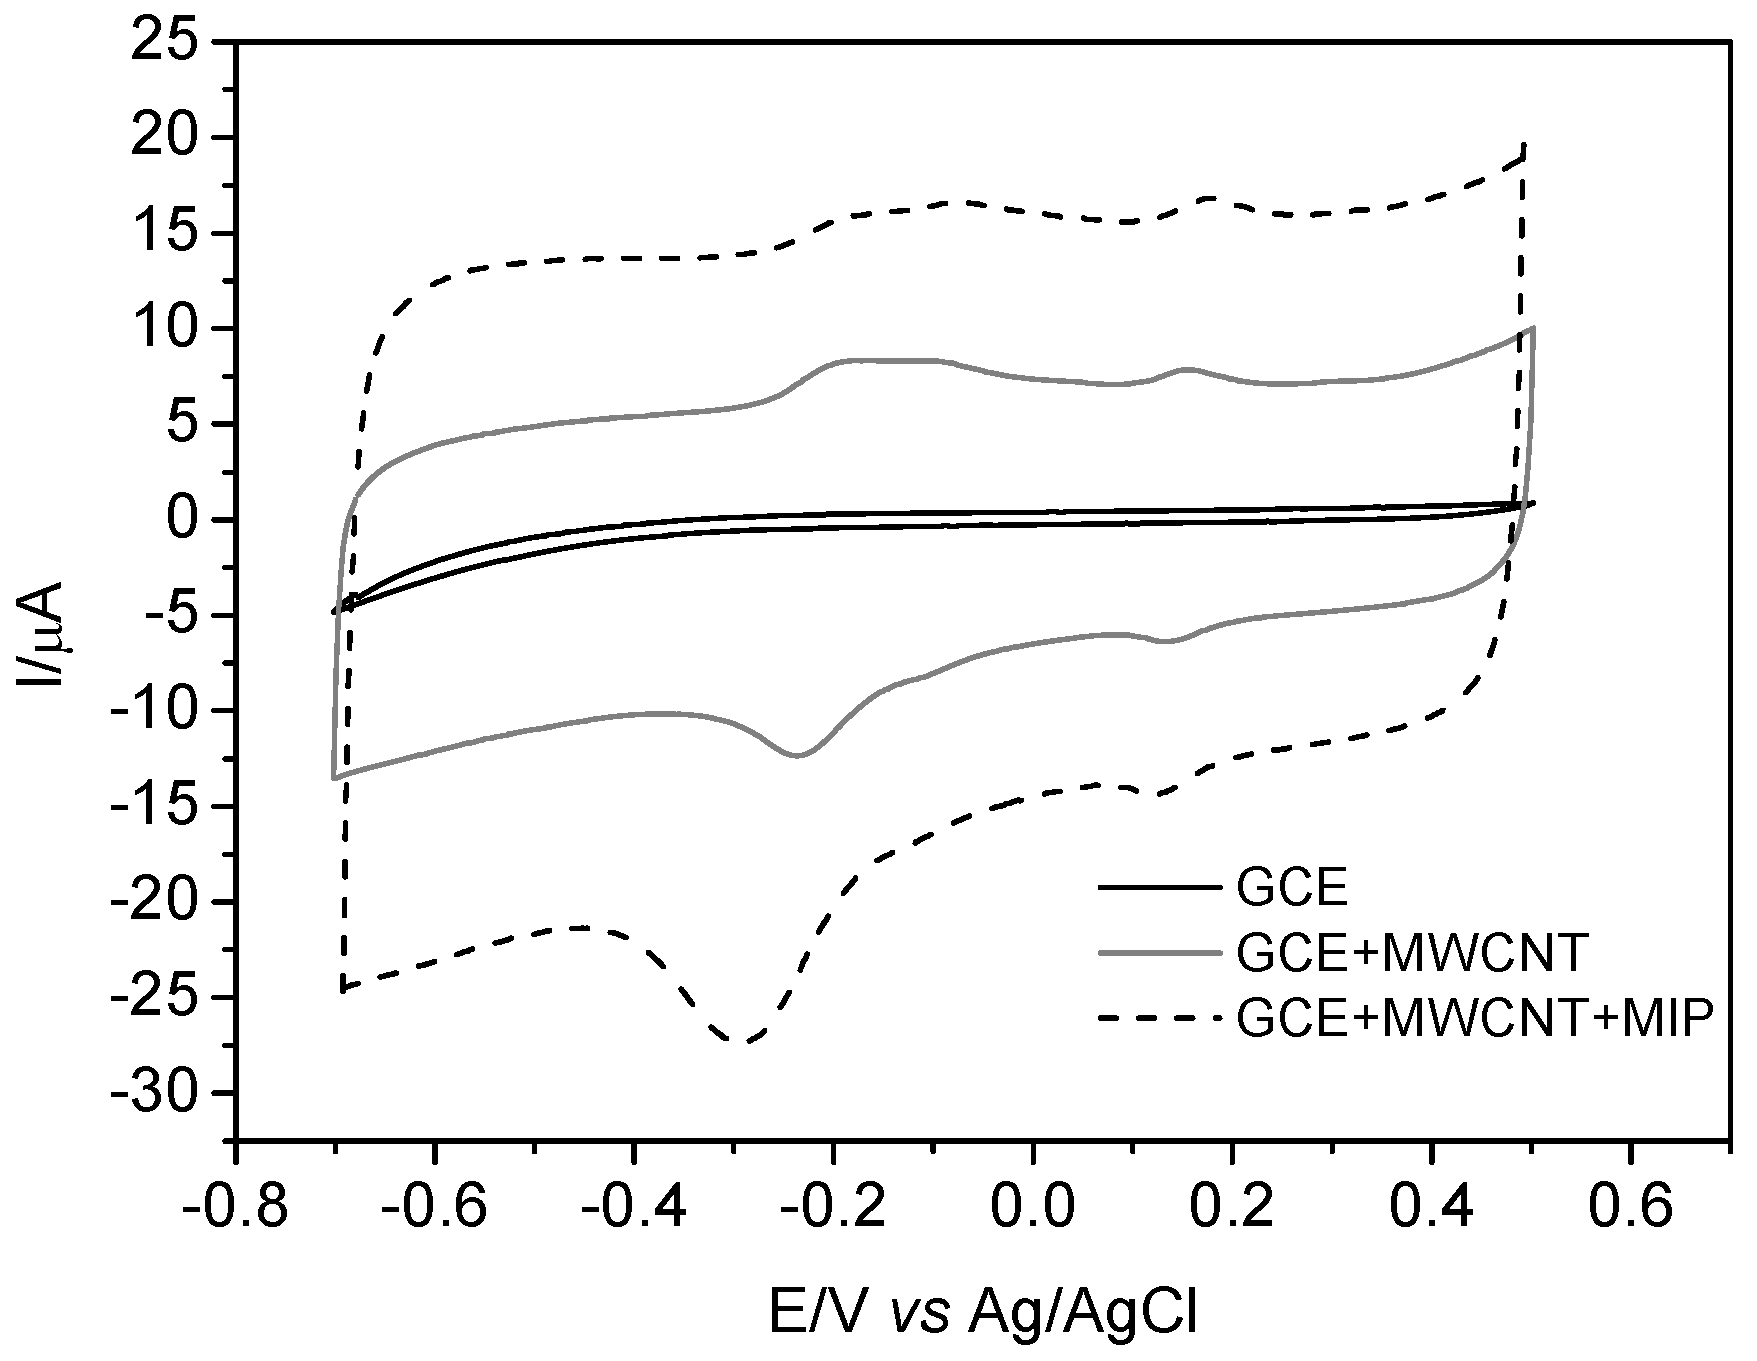
3.2. Electrochemical Behavior of GCE-MIP-MWCNT and GCE-NIP-MWCNT towards the Reduction of Carvedilol
Figure 5 shows the cyclic voltammogram of CAR recorded with GCE, GCE modified with MWCNT, and GCE modified with MIP and MWCNT. As observed, there is an increase of cathodic peak current for carvedilol when using the bare electrode modified with MIP and MWCNT. This result is attributed to the synergic effect of MWCNT, which assists in the transfer of electrons, and the MIP, making the working electrode more selective for CAR. Moreover, the presence of two redox pairs can be observed, which was reported by other authors such as Dogan and Ozkan [
34] and Rofouei et al. [
35]. On the other hand, it is well known that the electrooxidation of CAR is irreversible, thus the presence of MIP and MWCNT may improve the reversibility of the CAR redox process. However, this behavior requires further study.
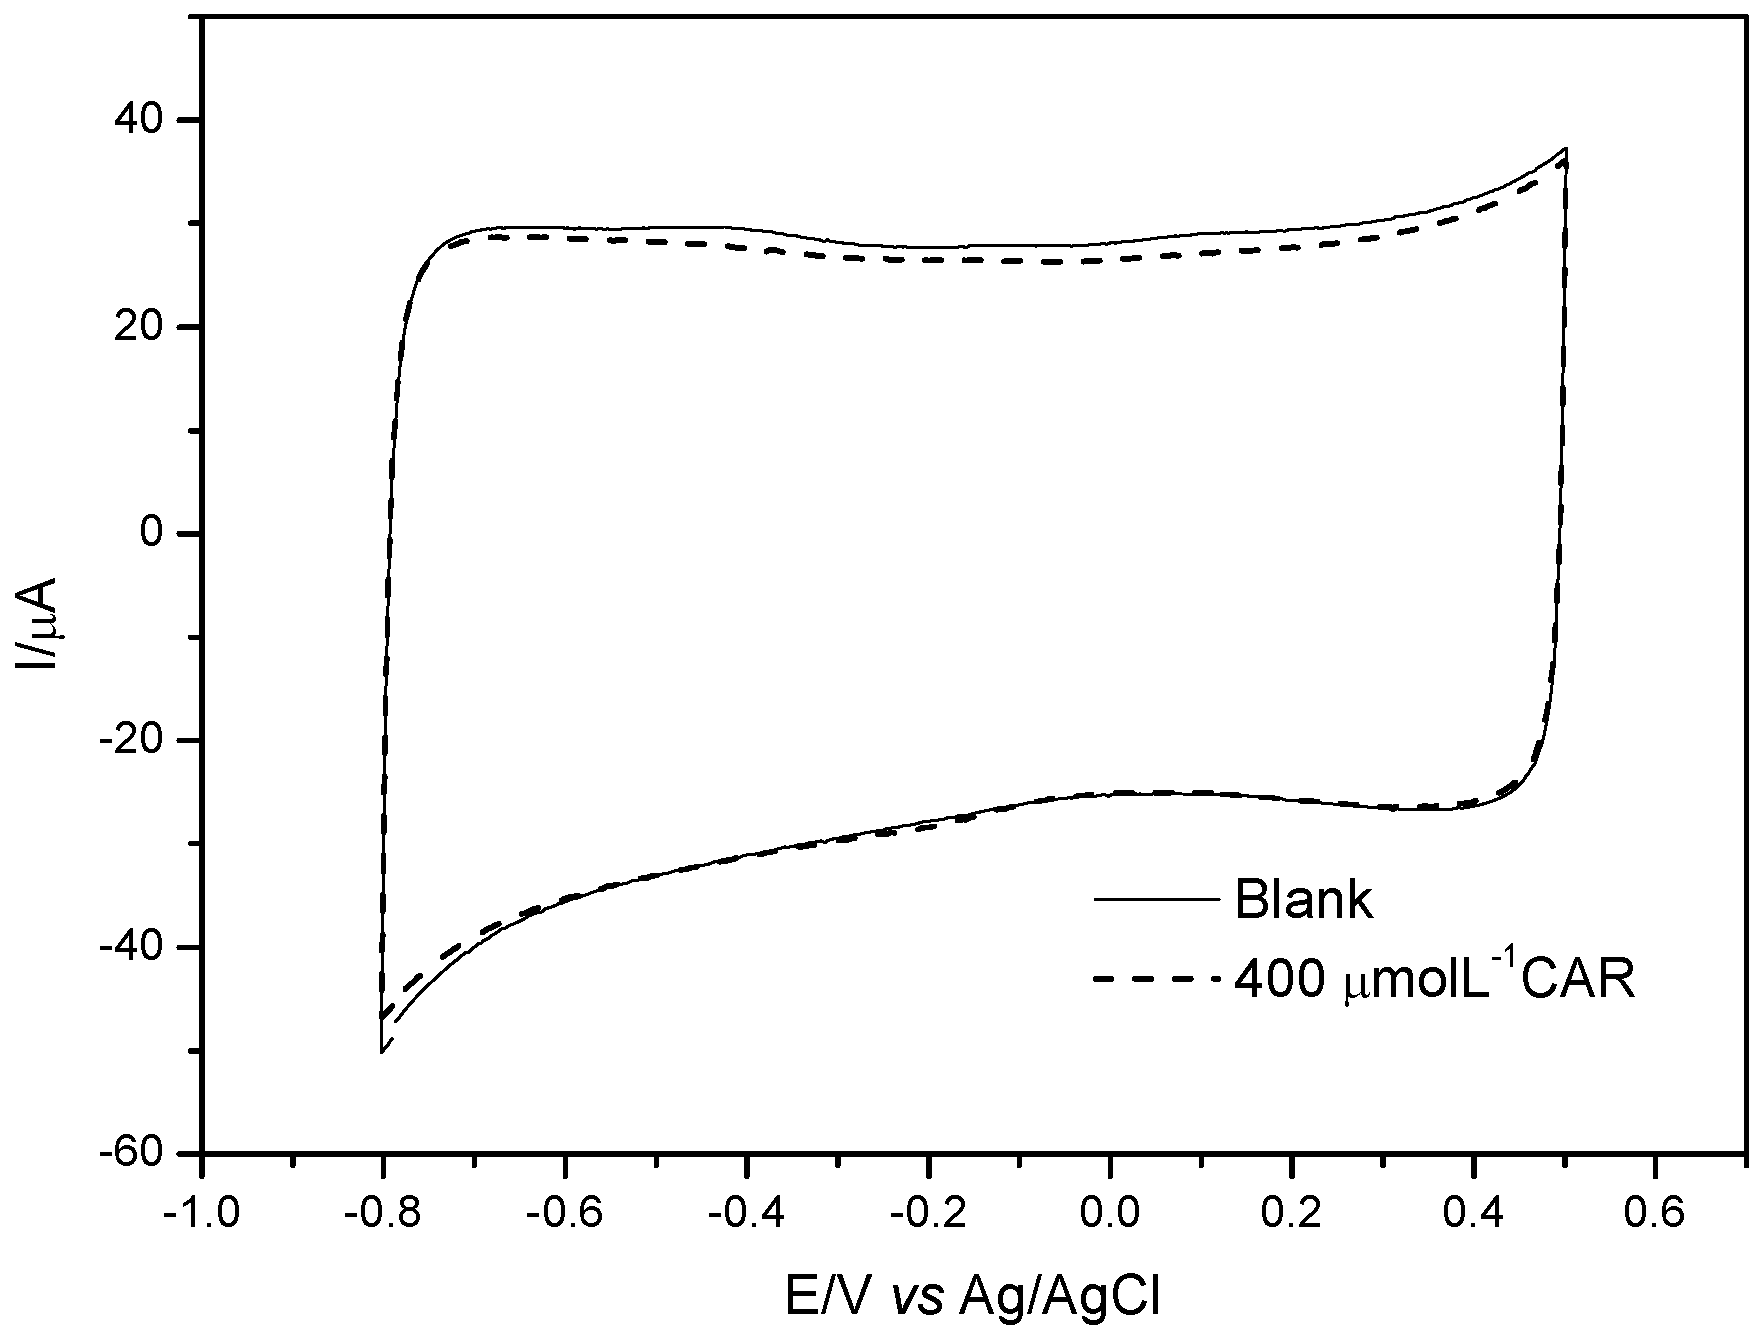
In order to evaluate the selectivity of the MIP, records of cyclic voltammograms were carried in absence and presence of CAR using the modified electrode with NIP (non imprinted polymer). As can be seen from
Figure 6, no response to CAR was observed, thus indicating the MIP plays an important role on the electrochemical recognition of CAR.
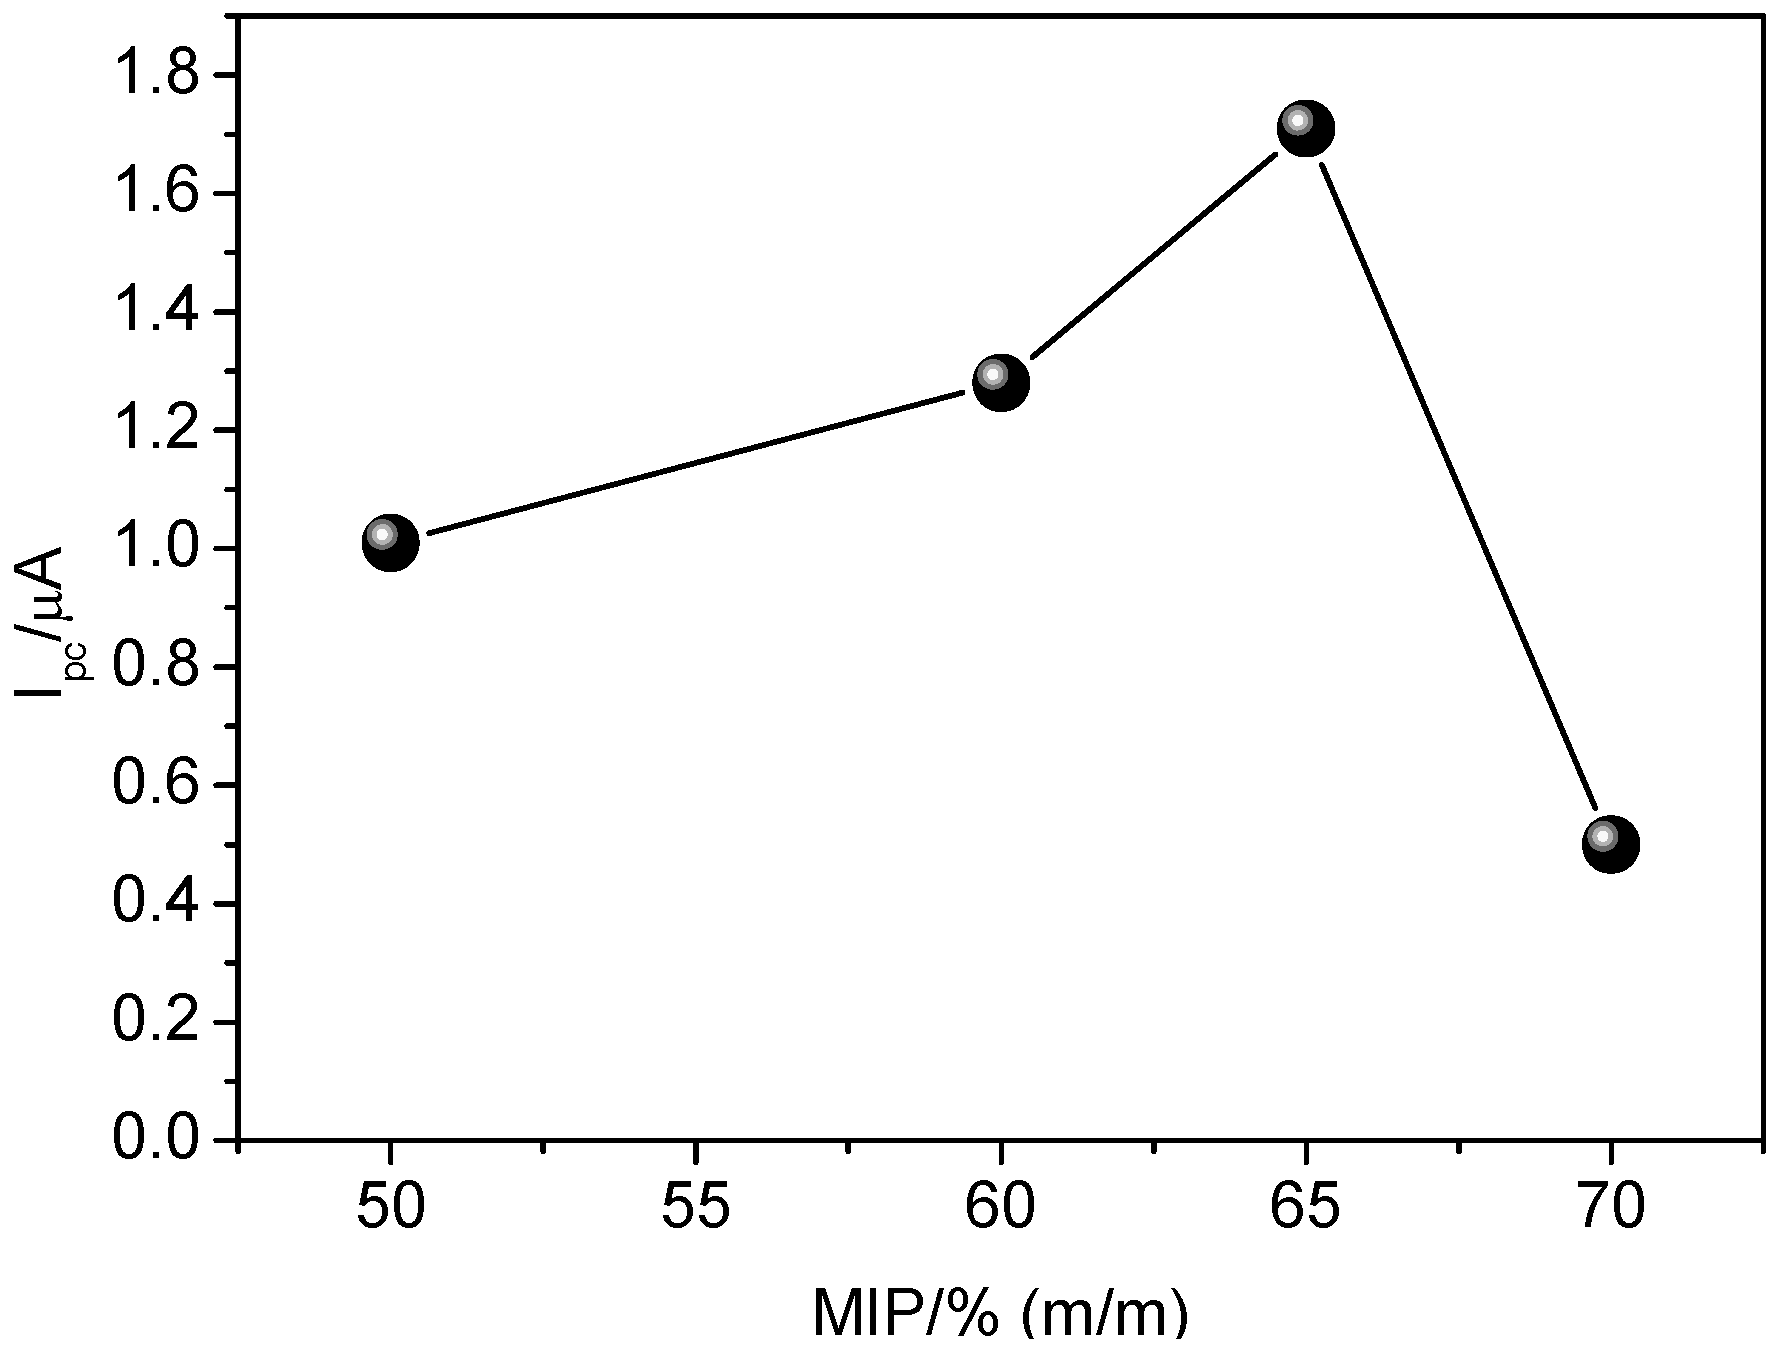
Considering the superior electrochemical response to carvedilol when using the GCE modified with MIP and MWCNT, the influence of MIP proportion (50%–70%, m/m) in the suspension was evaluated. As observed from
Figure 7, higher analytical signal was achieved by using 65% (m/m) of MIP in the suspension. When using 70% (m/m), the analytical signal was drastically decreased, most likely due to blocking of electron flow, since MIP is a nonconductive material. Also observed was a swelling effect and low physical stability of MIP from the surface of the glassy carbon electrode. Therefore, the proportion of 65% (m/m) MIP was used for further experiments.
The influence of Nafion
® 5% (m/v) on the performance of the sensor was also evaluated. Nafion
® is a polymeric resin with excellent properties, such as chemical, mechanical, and thermal stability, selectivity for different cations, and high conductivity [
36,
37]. This polymer has been widely used for the fixation of particles onto electrode surface. However, due to its high mechanical strength, it can act as a barrier, thus hindering the diffusion of CAR towards the working electrode, resulting in decreased current variation.
Table 1 shows the influence of volume of Nafion
® deposited onto the modified electrode. As observed, the insertion of Nafion
® onto the surface decreases the analytical signal. Therefore, the modification of glassy carbon electrode with MIP and MWCNT was carried out in the absence of Nafion
®.
3.3. Influence of pH on the Performance of the Sensor
The influence of pH on the analytical signal of CAR was evaluated in the range of 7.0–9.0, using 0.1 mol·L
−1 Britton-Robinson buffer. As seen in
Figure 8, the analytical signals were obtained were better in the alkaline range (8.5–9.0), thus pH 8.5 was adopted for further experiments. This result can be explained by the proximity of pH in relation to CAR pKa, which is 7.831. At pH 8.5, there exist two forms of CAR in aqueous medium, 36.4% in its molecular form and 63.6% in its protonated form, while at pH 9.0, 64.4% is in its molecular form and 35.5% in its protonated form. At very low pH values, formation of deprotonated species of CAR is favored. From these results, it is possible to infer that interaction of CAR with binding sites of MIP may take place by both hydrogen bonding and electrostatic attraction. Moreover, as reported in literature [
34,
35], alkaline pH values between 8.0 and 11.0 promote greater deprotonation in species and, consequently, higher current variation (∆I).
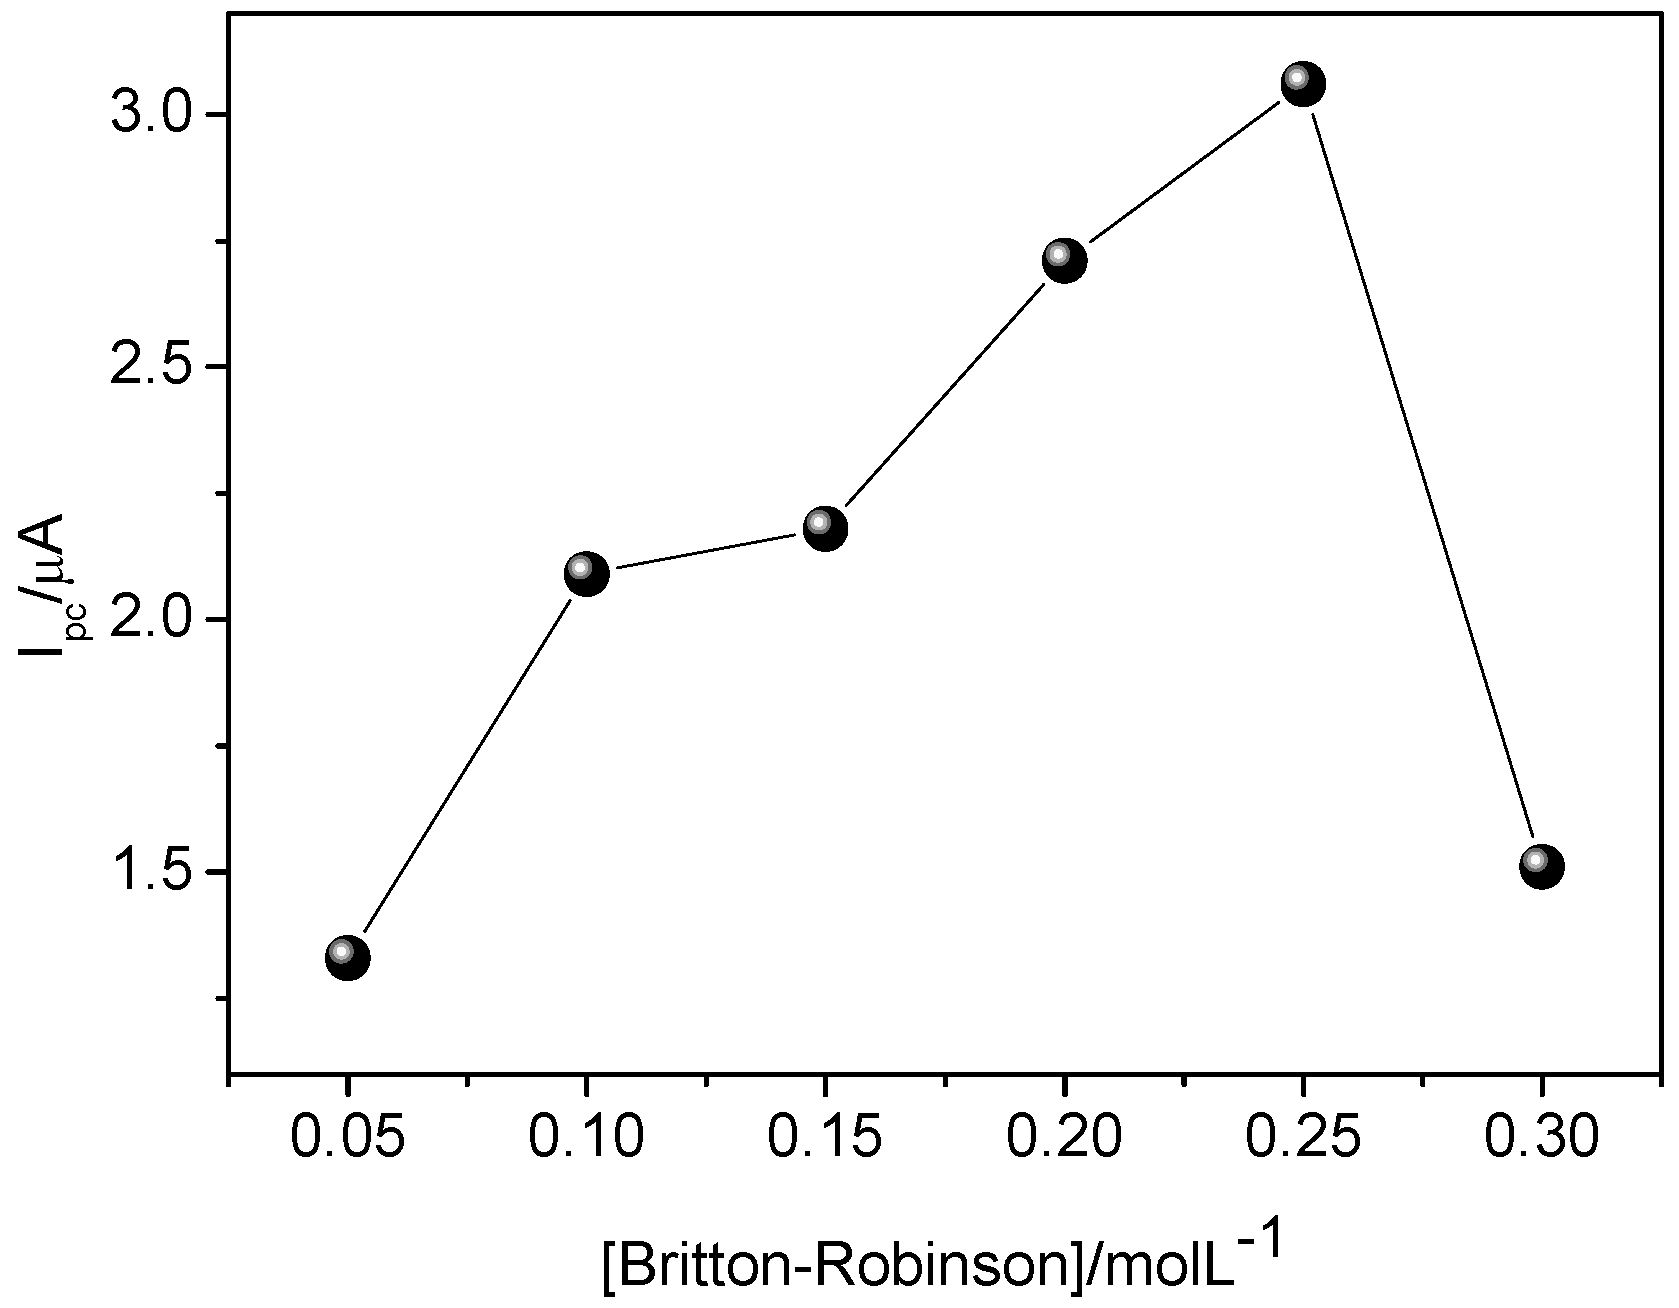
3.4. Concentration of Britton-Robinson Buffer Solution
In order to assess the best sensor response regarding different concentrations of Britton–Robinson solution, a study was conducted at different concentrations (0.05, 0.01, 0.15, 0.20, 0.25, and 0.30 mol·L
−1). The greater variation in current occurred at electrolyte concentration of 0.25 mol·L
−1.
Figure 9 shows an increase of current variation up to 0.25 mol·L
−1, then a decrease. This is probably due to the gradual increase of charge carriers up to 0.25 mol·L
−1, and above this value, the charge carriers may block sites of MIP, thus decreasing current variation. This result can be rationalized by bearing in mind that interaction of CAR with binding sites of MIP may also take place by electrostatic attraction, as reported in the aforementioned studies regarding the influence of pH. Therefore, it seems that using higher buffer concentration decreases the interaction between CAR and the binding sites of MIP.
3.5. Influence of KCl Solution
Different concentrations of KCl solution (0.1, 0.2, 0.3, 0.5, 1.0 mol·L−1) were evaluated, aiming to increase the mass transport of the bulk solution to the working electrode surface. The best analytical response was observed for 0.1 mol·L−1 KCl, at which a larger current variation (∆I) was achieved. At higher concentrations of KCl, a decrease in current variation (∆I) is observed. This probably occurs because in the presence of a large concentration of ions, the access to the MIP cavity by analyte of interest can be hindered, leading to a reduction of current variation (∆I).
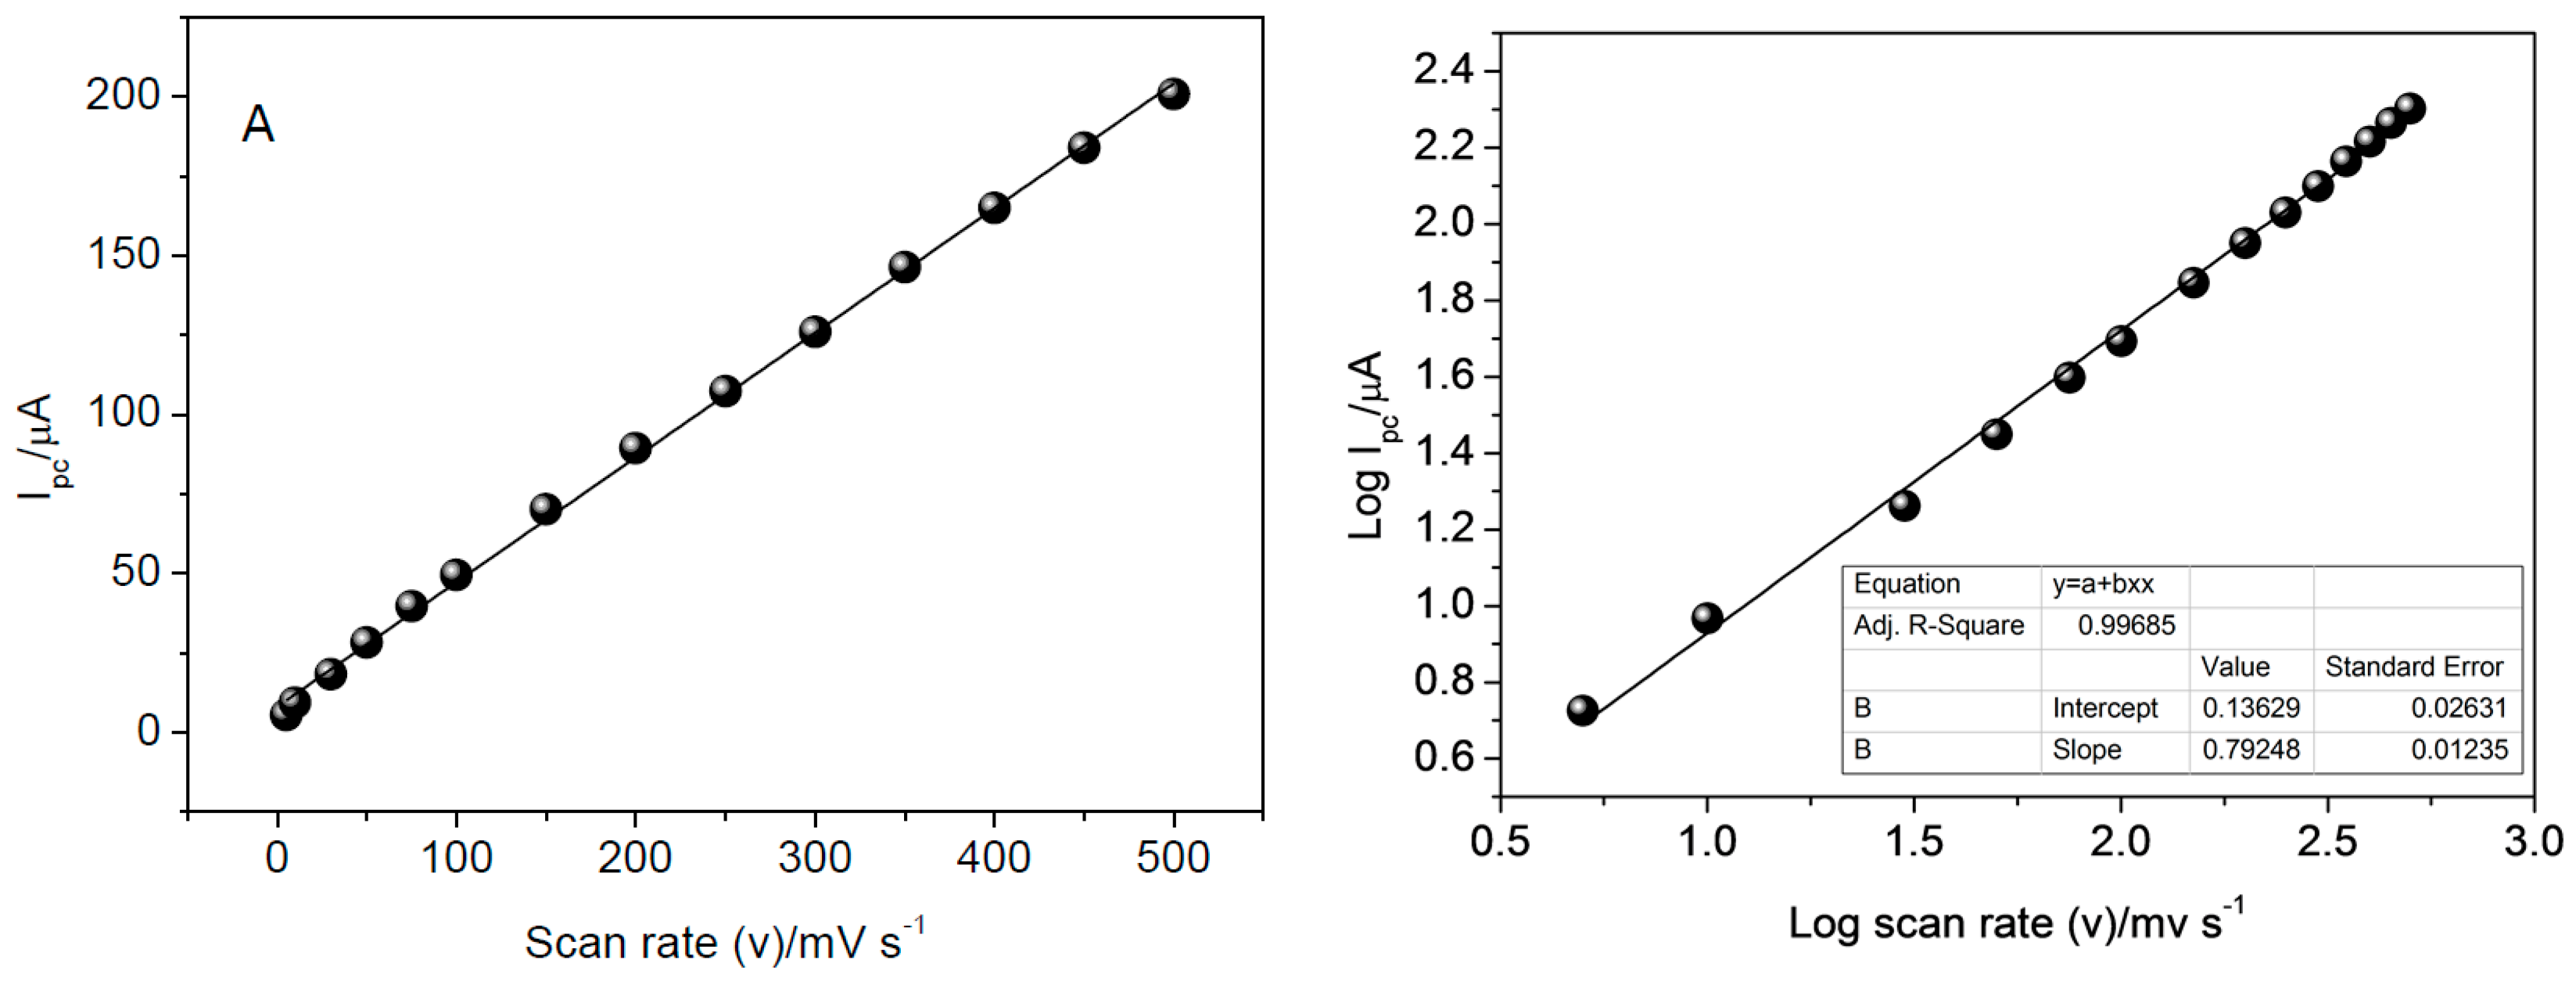
3.6. Influence of Scan Rate
The influence of scan rate on the reduction of CAR was evaluated from 5.0 to 500 mV·s
−1 (
Figure 10). Data used for construction of graphs were obtained from CV analysis in 0.25 mol·L
−1 Britton-Robinson buffer solution (pH 8.5) and 0.1 mol·L
−1 KCl solution. The linear relationship obtained suggests the reduction process is controlled by adsorption.
To confirm that the process is controlled by adsorption, the relation between log peak current and log scan rate was evaluated, as shown in
Figure 10b. Based on this, the process was characterized as being controlled by adsorption, since the value obtained for the slope, 0.7924, tends to the theoretical value of 1, which expresses an ideal reaction controlled by adsorption, as has been documented by literature [
34,
38].
3.7. Final Analytical Conditions
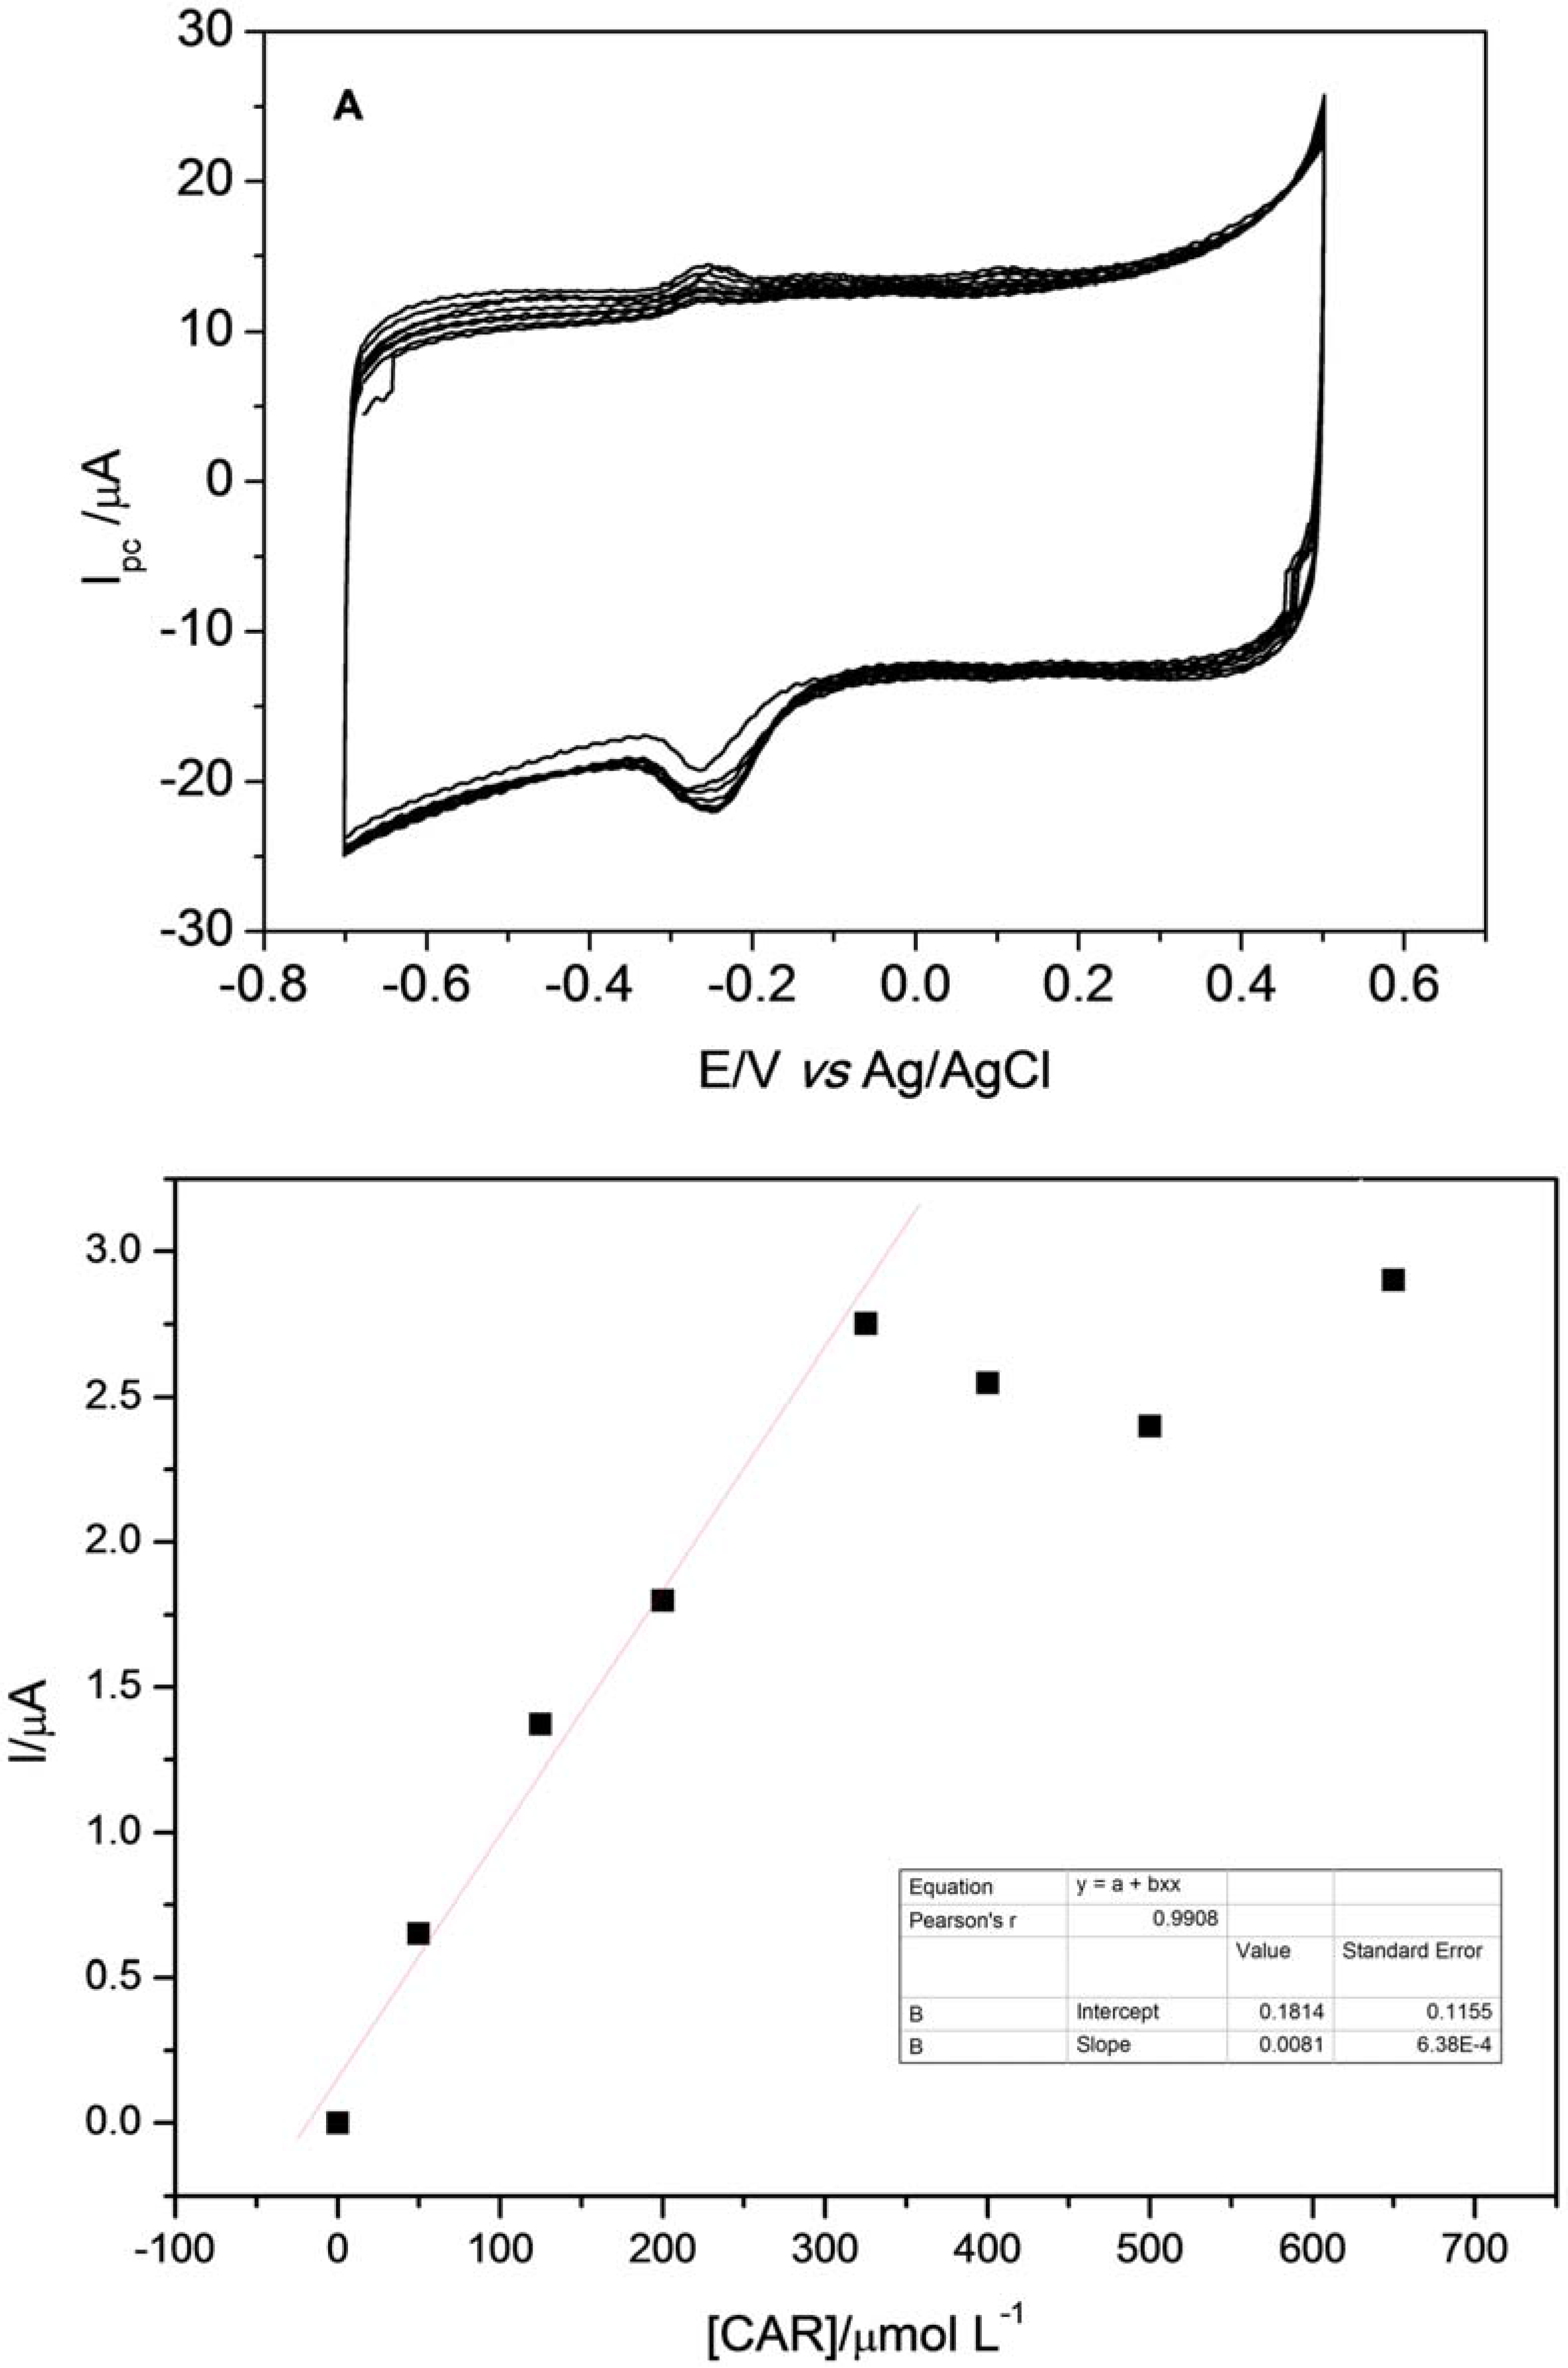
After optimization of experimental parameters, it was possible to build the analytical curve with subsequent additions of 0.05 mol·L
−1 of CAR. Voltammograms obtained with subsequent additions of CAR in the electrochemical cell containing 0.25 mol·L
−1 Britton-Robinson buffer at pH 8.5 and 0.1 mol·L
−1 KCl solution are depicted in
Figure 11A. As can be observed in
Figure 11b, analyte additions have a good linearity between 50 and 325 µmol·L
−1 of CAR, showing a decline after fifth addition, demonstrating that the reduction process of CAR occurs through adsorption. This behavior is confirmed by what was observed in the previous study. The calibration curve obtained for determination of CAR showed a sensitivity of 0.008 µA·L·µmol
−1.
Limits of detection and quantification of the method were calculated employing the method based on the analytical curve parameters (ICH, 1995) [
39]. In this method, the limit of detection (LD) can be expressed by Equation (1) and the limit of quantification (LQ) by Equation (2):
where s is the estimated standard deviation of background and a is the slope of the curve. The value of s was found to be 0.0432 µA, thus allowing us to obtain LD and LQ equal to 16.14 mmol·L
−1 and 53.8 mmol·L
−1, respectively.
The proposed sensor showed a linear response in the concentration range from 50–325 mmol·L−1, with a linear coefficient of 0.9755 (n = 8).The precision of the present method, as assessed for repeatability (n = 10), was very satisfactory at 3.8% (relative standard deviation, RSD) for the concentration of 250 µmol·L−1 of CAR. Moreover, the repeatability of sensor preparation was evaluated on 10 different days and cyclic voltammograms were recorded under optimum condition using 250 µmol·L−1 of CAR. The RSD value regarding the cathodic peak current of CAR is 4.7%, which clearly demonstrates a well-controlled experimental method, with good repeatability for the sensor preparation.
In order to assess the performance of the proposed sensor, works regarding the determination of carvedilol through sensors were sought in the literature. Dogan and Ozkan [
34] conducted a study where they determined carvedilol by using a glassy carbon electrode. The electrode exhibited linear response for carvedilol in the concentration range of 0.2–20 µmol·L
−1 and showed a limit of detection of 0.0021 µmol·L
−1.
Rofouei et al. [
35] performed another study for carvedilol determination. In this work, they built an electrode modified with ordered mesoporous carbon for determination of carvedilol in medicines and biological fluids. The sensor presented a working range for carvedilol concentrations from 0.1 to 23 mmol·L
−1. Limit of detection was found to be 0.034 µmol·L
−1 in Britton–Robinson solution, pH 8.
Lastly, Soleymanpour and Ghasemian [
40] performed a study for determination of carvedilol. They determined carvedilol using a carbon-paste electrode based on the incorporation of a carvedilol-phosphotungstate complex. This sensor showed a linear response for CAR in concentration range of 0.3–1000 µmol·L
−1 and a limit of detection of 0.15 µmol·L
−1.
As observed, the previously developed methods have presented lower limits than the one herein obtained. Despite this finding, one should note that high detectability for pharmaceutical analysis is not imperative; on the contrary, the use of simple, quick, and economic methods play a more important role. In addition, in our proposed method, cyclic voltammetry was used as an analytical technique, which is naturally less sensitive than amperometry and pulse voltammetric techniques.
3.8. Evaluation of Interfering
Selectivity is one of the most important characteristics of a sensor based on MIP. In order to evaluate the selectivity of the sensor towards other molecules, cyclic voltammograms for CAR at 400 μmol·L
−1 concentration in the presence of potentially interfering electroactive molecules at 4000 μmol·L
−1 concentration were recorded under optimum conditions. According to the results shown in
Table 2, it can be observed that the sensor does not respond to the majority of molecules in the region employed for determination of CAR. Electrochemical responses were observed only for L-cysteine and L-ascorbic acid, which is attributed to the oxidation and/or reduction of these compounds in the carbon matrix of the sensor. Although some interferences have been observed, the application of the method in pharmaceutical samples can be successfully carried out, once L-cysteine and L-ascorbic acid are not found in tables of CAR.
The selectivity of the proposed method was also evaluated by the addition of excipients usually present in pharmaceutical formulations (sucrose, microcrystalline cellulose, povidove, croscarmellose sodium, silicon oxide, magnesion stearate, red ferric oxide, and talc). The carvedilol/excipient concentration ratio studied in the present study was 1:10 (m/m) and the analytical signals were compared with those in the absence of each excipient. From the achieved results, no interference was observed, thus allowing us to conclude that the proposed method proves will be successfully applied to pharmaceutical formulation.
3.9. Application of Proposed Method
The proposed sensor was applied for determination of CAR in pharmaceutical samples (Carvedilol, 3.125 mg, Biosintética
®) under optimized conditions.
Table 3 illustrates a comparison between the value shown on the label and the result obtained using the proposed sensor. Good recovery of CAR can be observed. In order to check statistical differences between results, a Student
t-test with a confidence level of 95% was applied to the t-value was found to be 3.56, which is lower than the critical value of 4.30, demonstrating that there is no difference between the two values. The result demonstrates that the MIP-based sensor is an excellent alternative for carvedilol determination, featuring a rapid and inexpensive preparation.


