Communication

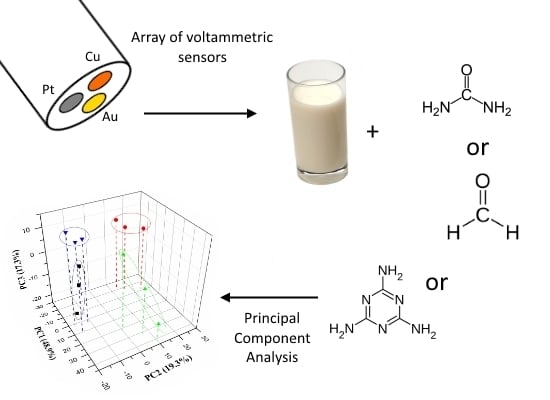
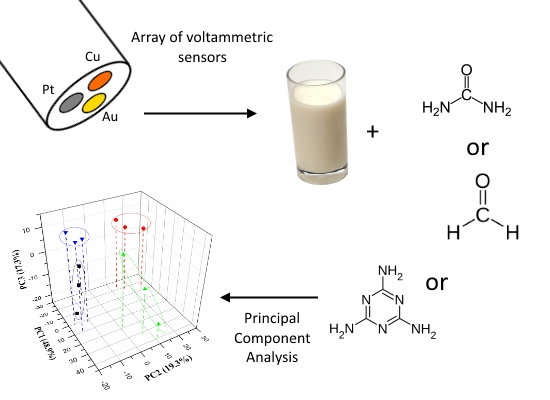
Voltammetric Electronic Tongue for Discrimination of Milk Adulterated with Urea, Formaldehyde and Melamine

by
Lígia Bueno
,
William R. De Araujo
,
Maiara O. Salles
,
Marcos Y. Kussuda
and
Thiago R. L. C. Paixão
*
Instituto de Química, Universidade de São Paulo, São Paulo 05508-000, SP, Brazil
*
Author to whom correspondence should be addressed.
These authors contributed equally to this work.
Chemosensors 2014, 2(4), 251-266; https://doi.org/10.3390/chemosensors2040251
Submission received: 29 August 2014 / Revised: 16 October 2014 / Accepted: 27 October 2014 / Published: 14 November 2014

Abstract

:
We report the fabrication of a voltammetric electronic tongue for the detection and discrimination of harmful substances intentionally added to milk to increase its shelf life or imitate protein content. The electronic tongue consisted of three working electrodes composed of platinum, gold, and copper. The measurement principles involved the extraction of information from cyclic voltammograms recorded in unadulterated and adulterated milk. The extracted data were analysed using principal component analysis and the contaminants were successfully differentiated from one another in a score plot. Electrochemical quartz crystal microbalance analysis was used to investigate the electrode response in order to understand the mechanism by which the tongue could discriminate between the samples. It was found that the electrochemical formation and dissolution of platinum and gold oxides, and the reduction of a copper-melamine ionic pair formed at the surface of the copper electrode were the main factors responsible for discrimination. In addition, the electronic tongue was capable of identifying adulterations in different types of milk (whole, skimmed, and semi-skimmed) and milk from different brands. The lowest concentration of adulterant that resulted in a good discrimination was 10.0, 4.16, and 0.95 mmol·L−1 for formaldehyde, urea, and melamine, respectively.

Graphical Abstract

1. Introduction

The number of people suffering from foodborne illnesses has been gradually increasing worldwide. One of the causes of these diseases is poisoning from food adulterated with illegal substances or those permitted by law but added in amounts that exceed the specified safety limit. Food poisoning can be caused by natural substances such as toxins or chemical contaminants. Apart from being an illegal practice, the health risks associated with food adulteration are high, leading to death in the most extreme cases [1]. Incidents of adulteration of food and drink are not uncommon in many parts of the world. With the ultimate aim of increasing sales profits, the addition of substances to increase the shelf life, enhance food yields or to mask another adulteration is an increasing and wide-ranging problem.
Milk is considered to be a complete food, containing high quantities of proteins, vitamins, and minerals. Additionally, natural milk without any preservative is perishable and has a relatively short lifetime. It also offers an ideal environment for microorganism growth, and can be an effective vehicle for spreading foodborne diseases such as salmonellosis, brucellosis, listeriosis, and tuberculosis [2]. Unlike some other foods and drinks, the addition of preservatives to enhance the shelf life of milk is prohibited [3]. For this reason, preservatives present in milk are designated as contaminants.
With the increasing demand for dairy products and the necessity for reducing losses in industrial production due to poor quality materials, the requirement for high quality milk has increased. One of the major problems associated with obtaining high quality products is milk tampering [1]. This issue affects both industry and consumers in terms of product quality and food safety. Therefore, the authentication of food quality has become a major challenge to be overcome [4]. For both economic and public health reasons, it is important to identify instances of fraudulent labelling, which indicates a food product is of a higher quality than it actually is [5].
In the most recent case of milk adulteration in Brazil, water, urea, and formaldehyde were detected in thousands of litres of milk. Many producers add water to milk to increase the volume of the product, which results in a loss of nutritional value. To compensate for this loss, while retaining the physical characteristics of the milk, urea is occasionally added [6,7]. The standard method by which authorities analyse the total protein present in milk is the Kjeldahl method, which quantifies the total nitrogen content of the sample rather than protein itself. As urea comprises more than 40% nitrogen, the addition of this adulterant can interfere with the results obtained during protein analysis, which masks the milk dilution process. Urea can be found in unadulterated milk in a concentration of 180–400 mg·L−1 (~3–6 mmol·L−1) [8,9,10] with an upper limit of 700 mg·L−1 (~11 mmol·L−1) [10,11]. Above this concentration, urea can lead to severe health problems such as kidney damage, indigestion, and cancer [10]. Urea can be added to diluted milk in various forms including urine or agricultural compounds. In the latter, urea is a component of crop fertilisers, which often contain formaldehyde, a product considered as a carcinogen by the World Health Organisation (WHO) and the International Agency for Research on Cancer [12].
The most widely publicised case of milk adulteration occurred in China in 2008. Melamine (1,3,5-triazine-2,4,6-triamine) was added to milk [13,14,15] at a ratio of ~2500 mg of melamine to 1 kg of milk powder [16]. Considering that it is possible to dissolve 26 g of powder milk in 200 mL of water (information obtained from product labels), this amount of melamine gave a concentration of 2.6 mmol·L−1. In another incident, melamine was added to animal food in the USA, resulting in the contamination of animal meat with this compound [17]. Melamine is an organic compound that is tolerant to heat, and along with formaldehyde, is used in the manufacture of highly heat-resistant polymers and resins. It is also used in flame retardant products and owing to its high nitrogen content (66 wt %), it is transformed into nitrogen gas when burned or charred, which can cause suffocation [18]. Because of the high nitrogen content of melamine, it has been used as an adulterant, like urea, in food products to apparently increase the protein content [15,19]. However, the ingestion of melamine can be extremely dangerous. For example, when melamine is ingested in levels above those regulated by health organisations (2.5 mg·kg−1 of body weight in the USA), it causes kidney malfunction [6,20].
Formaldehyde is used in the production of resins (such as sterilizing agents and preservatives), as a component found in cleaning products and cosmetics, and for embalming anatomical tissues. Formaldehyde poses a great health risk to those who handle or ingest it because it attacks the respiratory system, eyes, and skin. Recent research has shown that formaldehyde is responsible for up to a 34% increase in the possibility of a normal person to develop multiple sclerosis; individuals who have been exposed to formaldehyde for at least 10 years are four times more likely to develop this disease when compared to an average person. Formaldehyde can be found naturally in fresh and commercial milks at amounts of 0.027 and 0.164 mg/kg, respectively [21]. The addition of 1 mL of this compound to a gallon of milk, to give a final concentration of 7.2 mmol·L−1, can preserve the milk for one week [22].
Several techniques have been used to detect adulterants in milk, such as high-performance liquid chromatography-mass spectrometry (HPLC-MS), gas chromatography-mass spectrometry (GC-MS), surface-enhanced Raman spectroscopy (SERS) [23,24,25,26], and enzyme-linked immunosorbent assays (ELISAs) [15,27]. However, these techniques are generally time consuming, require expensive instrumentation, and often require a pre-concentration step. In addition, these techniques cannot be miniaturized or allow rapid analysis, both of which are necessary for use in the field. Recently, capillary electrophoresis, optical and colorimetric methods have been developed for the detection of melamine in milk. However, most of these techniques require complex instrumentation or give inaccurate results, which greatly limits their application both in the laboratory and in field studies [15]. Another drawback of using optical and colorimetric techniques to directly measure milk samples is the long sample pre-treatment step necessary to remove interferences, such as protein [28,29]. Moreover, owing to the emulsion characteristics of the samples analysed, the fat and protein content dispersed in milk can result in light scattering during the quantification and discrimination process for optical measurements.
As an alternative approach, electrochemical techniques are relatively easy to operate, allow the use of low-cost materials for the fabrication of sensors, and enable quantification and discrimination between samples in a short time, without the necessity to circumvent the problems reported for optical and colorimetric techniques. The use of electrochemical sensors has been previously reported for food and beverage analysis [30,31,32,33]. We now demonstrate the fabrication of an array of electrochemical sensors that, with the aid of chemometric tools (electronic tongue) [34], are able to distinguish between unadulterated milk samples and those containing urea, formaldehyde or melamine contaminants.

2. Experimental Section

2.1. Chemicals, Materials, and Samples

All solid reagents were of analytical grade and used without further purification. Acetic acid, formaldehyde, and sodium acetate were purchased from Merck (Darmstadt, Germany). Melamine was purchased from Sigma–Aldrich (Steinheim, Germany), and urea was obtained from Fluka Chemika (Switzerland). Acetate buffer (pH 4.5) was prepared in de-ionised water, which was processed through a water purification system (Direct-Q® 5 Ultrapure Water Systems, Millipore, MA, USA). Milk samples (Parmalat®, Elegê®, and Qualitá®) were obtained at local markets. Adulteration of the milk samples was accomplished by mixing proper amounts of solid reagents (melamine or urea), or a standard solution of formaldehyde to the milk samples with final concentrations of 0.95, 4.16, and 10.0 mmol·L−1, respectively. The concentration of each adulterant was selected by reducing the concentration values systematically until we verified a wrong placement in the categories analysed in the score plot and in the hierarchical cluster analysis. Hence, beyond these concentrations, the differentiation between the contaminants could not be performed. Our working concentration range was 0.95–95 mmol·L−1 for melamine, 4.16–1250 mmol·L−1 for urea, and 10–3000 mmol·L−1·for formaldehyde. All samples were measured in random order to minimize possible error due to memory effect of the electrode surfaces.

2.2. Electrodes and Instrumentation

Electrochemical measurements were obtained using a PalmSens (Palm Instruments BV, Houten, The Netherlands) equipped with a multiplexer module with data acquisition software provided by the manufacturer (PSTrace 2.4 version). Commercial gold, custom-made copper, and commercial platinum electrodes were used as working electrodes. More details on the fabrication of the custom-made copper electrode can be found in the literature [35]. A custom-made Ag/AgCl(KCl sat) electrode was constructed as previously reported by Pedrotti et al. [36] and used as a reference electrode, whilst the auxiliary electrode was made of platinum or gold wire. All of the working electrodes were polished using an alumina suspension (1 µm, Alfa Aesar, MA, USA) with a microcloth polishing pad between each electrochemical measurement and washed thoroughly with de-ionised water in order to minimize possible error due to fouling of the electrode surface.

2.3. Electrochemical Quartz Crystal Microbalance (EQCM) Measurements

Electrochemical Quartz Crystal Microbalance (EQCM) measurements were obtained using the EQCM module of an AUTOLAB PGSTAT 128N (Autolab, Eco Chemie, Utrecht, The Netherlands) with data acquisition software provided by the manufacturer (NOVA 1.9 version). All experiments were carried out using a three electrode system: the working electrode was a gold 6 MHz AT-cut piezoelectric quartz crystal with a diameter of 7 mm and a piezoactive electrode area of 0.385 cm2; the reference electrode was a custom-made Ag/AgCl(KCl sat) electrode [36]; the auxiliary electrode was a gold wire. A commercially available 2 mL electrochemical cell provided by Metrohm–Autolab B.V. (Autolab, Eco Chemie, Utrecht, The Netherlands) was used. The cell was constructed from polypropylene and designed specifically for EQCM measurements; the quartz crystal was fixed on the bottom of the cell between two O-rings whilst the reference and auxiliary electrodes were placed on the cover of the cell, which contained two holes to fix the electrodes. Acetate buffer (pH 4.5) was used as the supporting electrolyte and the experiments were carried out at room temperature (25 °C). All voltammograms, as well as the frequency measurements were obtained using a scan rate of 50 mV·s1 (a slower experiment was conducted and compared with the results of Section 2.4), a step potential of 10 mV and by increasing the concentration of the adulterant 10 times. These modifications in the voltammetric parameters compared with those described in Section 2.4 were made for a better characterization of the physicochemical process that occurs on the surface of the electrodes.

2.4. Electrochemical Analysis

All voltammetric measurements were carried out in a 10 mL beaker by immersing the three electrode system directly into 5 mL milk samples at room temperature (25 °C) without any pre-treatment. Before each measurement, all working electrodes were polished using an alumina suspension (1 µm) with a microcloth polishing pad and the electrode surface was washed thoroughly with de-ionised water. After the cleaning process, each working electrode, as well as the reference (custom-made Ag/AgCl(KCl sat) electrode [36]) and auxiliary (platinum wire) electrodes were placed in the electrochemical cell containing the adulterated or unadulterated milk sample. Subsequently, three cyclic voltammograms were recorded sequentially using a PalmSens potentiostat equipped with a multiplexer module for each working electrode using the following potential program: −0.5–1.6 V for the platinum and gold working electrodes, and −0.8–0.1 V for the copper electrode. All voltammograms were obtained using a scan rate of 100 mV·s−1 and a step potential of 10 mV.

2.5. Chemometric Analyses

Principal component analysis (PCA) and hierarchical cluster analysis (HCA) were performed using Statistica 12.0 software (StatSoft Inc., Tulsa, OK, USA). Current values obtained from all cyclic voltammograms measured using the working electrodes immersed in the milk samples were used as input data for the chemometric analyses. This gave a matrix of 1020 columns and 12 rows (Scheme S1 in Supplementary Material illustrates how the data were organized previously to the chemometric analysis). A mean-centering and unit scaling pre-processing technique was applied to the datasets.

3. Results and Discussion

3.1. Electrochemical Studies in a Whole Milk Sample

Initially, cyclic voltammograms were recorded using three different working electrodes: gold, platinum, and copper, using a sample of Elegê® (BRF S.A.–Entreposto Usina, Teutônia, RS, Brazil) whole milk, in the absence and presence of a single adulterant at several concentrations until the following concentrations were attained: 10.0, 4.16, and 0.95 mmol·L−1 for formaldehyde, urea, and melamine, respectively. These are the lower concentrations of each adulterant that show detectable changes in the chemometrical approach in the adulterated and unadulterated milk sample voltammograms. As outlined in the materials and methods section, two different potential windows were used for the three electrodes: with gold and platinum working electrodes, a potential window of −0.5–1.6 V was used and for the copper electrode, the voltammograms were recorded from −0.8–0.1 V. The choices of the potential windows were based on two main reasons: (i) the necessity to acquire a large quantity of information; and (ii) the caution to prevent an electrochemical process that could overlay with other electrochemical data arising from the sample. In other words, it is necessary to record the voltammogram using the widest potential window possible, so that a greater quantity of electrochemical information from the sample can be recorded, thereby increasing the chance of a good discrimination being obtained by the chemometrical tools. However, there must be upper and lower potential limits for all three electrodes. At more negative potentials than the working ones; H+ is reduced at the electrode surface, and thus hydrogen bubbles can be formed on the electrode interfering with the results. In addition, when H+ is reduced, the current values increase rapidly, making the observation of other redox processes difficult. At the upper potential limits, water can be oxidized and a rapid increase in current could be a problem. It was noteworthy that it was important to go up to 0.1 V with the copper electrode to form copper ions that can react with melamine, which will be explained later.
As shown in Figure 1A, the platinum working electrode gave very similar voltammograms for the unadulterated and adulterated milk samples. In all the samples evaluated, the formation of platinum oxides can be observed from ~0.8 V [37]. However, in the presence of formaldehyde, (Figure 1A1) the oxide formation occurs in large scale compared with results obtained in the presence of melamine (Figure 1A2) and urea (Figure 1A3). The voltammograms obtained using the gold electrode (Figure 1B), can be seen to exhibit one oxidation peak at ~1.2 V, which was attributed to the formation of gold oxides, with the reduction of these compounds during the forward scan evident at ~0.5 V [37]. Both peaks are diminished in the presence of all three contaminants, with the effect being more pronounced for melamine and urea, which indicates passivation of the electrode surface by the adulterants. With the copper electrode (Figure 1C), the voltammograms demonstrate metal oxidation at a potential of ~0.0 V, forming copper ions in solution that are readily reduced at the electrode surface at −0.2 V. The formation of the copper ions occurred to a greater extent and at a less positive potential in the presence of urea (Figure 1C3). In addition, a reduction current can be observed at −0.2 to −0.8 V for the melamine contaminated milk sample (Figure 1C2). This process was attributed to the reduction of an ionic pair formed between melamine and the copper ions where additional information can be found in the literature [38]. During the potential sweep at positive values (E > 0), copper ions are released into the sample at a potential of ~0.0 V, forming an in situ ionic pair between the copper ions and melamine. In the backward scan, a broad faradaic signal due to the reduction of the species formed was associated with a slow adsorption step of the ionic pair. This mechanism has been previously used and explained in detail by de Araujo and Paixão using EQCM measurements [38].
The effects of formaldehyde, melamine, and urea contamination on the voltammograms were also evaluated for skimmed and semi-skimmed milk samples (Figure S1 and S2, Supplementary material), and similar results were obtained. Minor differences were observed and attributed to the different fat contents of each type of milk [31].
Figure 1. (A) Cyclic voltammograms recorded directly on commercial (Elegê®) whole milk sample using platinum; (B) gold; and (C) copper working electrodes, in the absence (dashed lines) and presence (full lines) of 10.0 mmol·L−1 of formaldehyde (1), 0.95 mmol·L−1 of melamine (2), and 4.16 mmol·L−1 of urea (3). Scan rate = 100 mV·s−1.
Chemosensors 02 00251 g001

3.2. EQCM Studies

To understand the effect of each adulterant on the voltammetric behaviour recorded using the gold electrodes, EQCM experiments were conducted in an acetate buffer solution (pH 4.5). The electrolyte solution was chosen in order to avoid the effects of other species present in the milk sample such as fat and protein, which could be adsorbed onto the electrodes surface. The frequency variations along with the voltammograms were recorded for the whole milk samples containing formaldehyde, melamine or urea at a final concentration of 9.5 mmol·L−1. Two well-defined peaks were observed and are shown in Figure S3A (Supplementary material): an oxidation peak at 1.3 V and a reduction peak at 0.6 V. These were attributed to the formation and subsequent reduction of gold oxides, as previously reported [37]. Both the oxidation and reduction peaks diminished in the presence of all the adulterants, with the effect being more pronounced in the oxidation peak. Figure S3B (Supplementary material) shows that the crystal frequency changed at the point where each of the redox processes occurred. A drop in the frequency (mass increase) was observed at the same potential at which the oxidation peak appeared in the voltammogram. This effect was most evident for the unadulterated milk, whilst in the presence of the adulterants, the frequency drop was more discrete. Likewise, at the same potential, as the reduction peak appeared, a gain in frequency (mass loss) at ~0.6 V in the backward scan was observed for each adulterated milk sample. This gain in frequency occurred to a greater extent for the unadulterated sample. The oxidation peak was attributed to the formation of gold oxides; with a decrease of the drop in frequency (the smaller the mass gain), lesser electrode surface was prompted to form oxides. This indicates that the gold surface was passivized by the adulterants, hindering the formation of the oxides. This explanation could be extended to the platinum electrode, as the formation of oxides was also evident. As Figure S3B (Supplementary material) clearly shows that the adulterants have different effects on the gold surface, with melamine being the most passivizing of the three adulterants used.

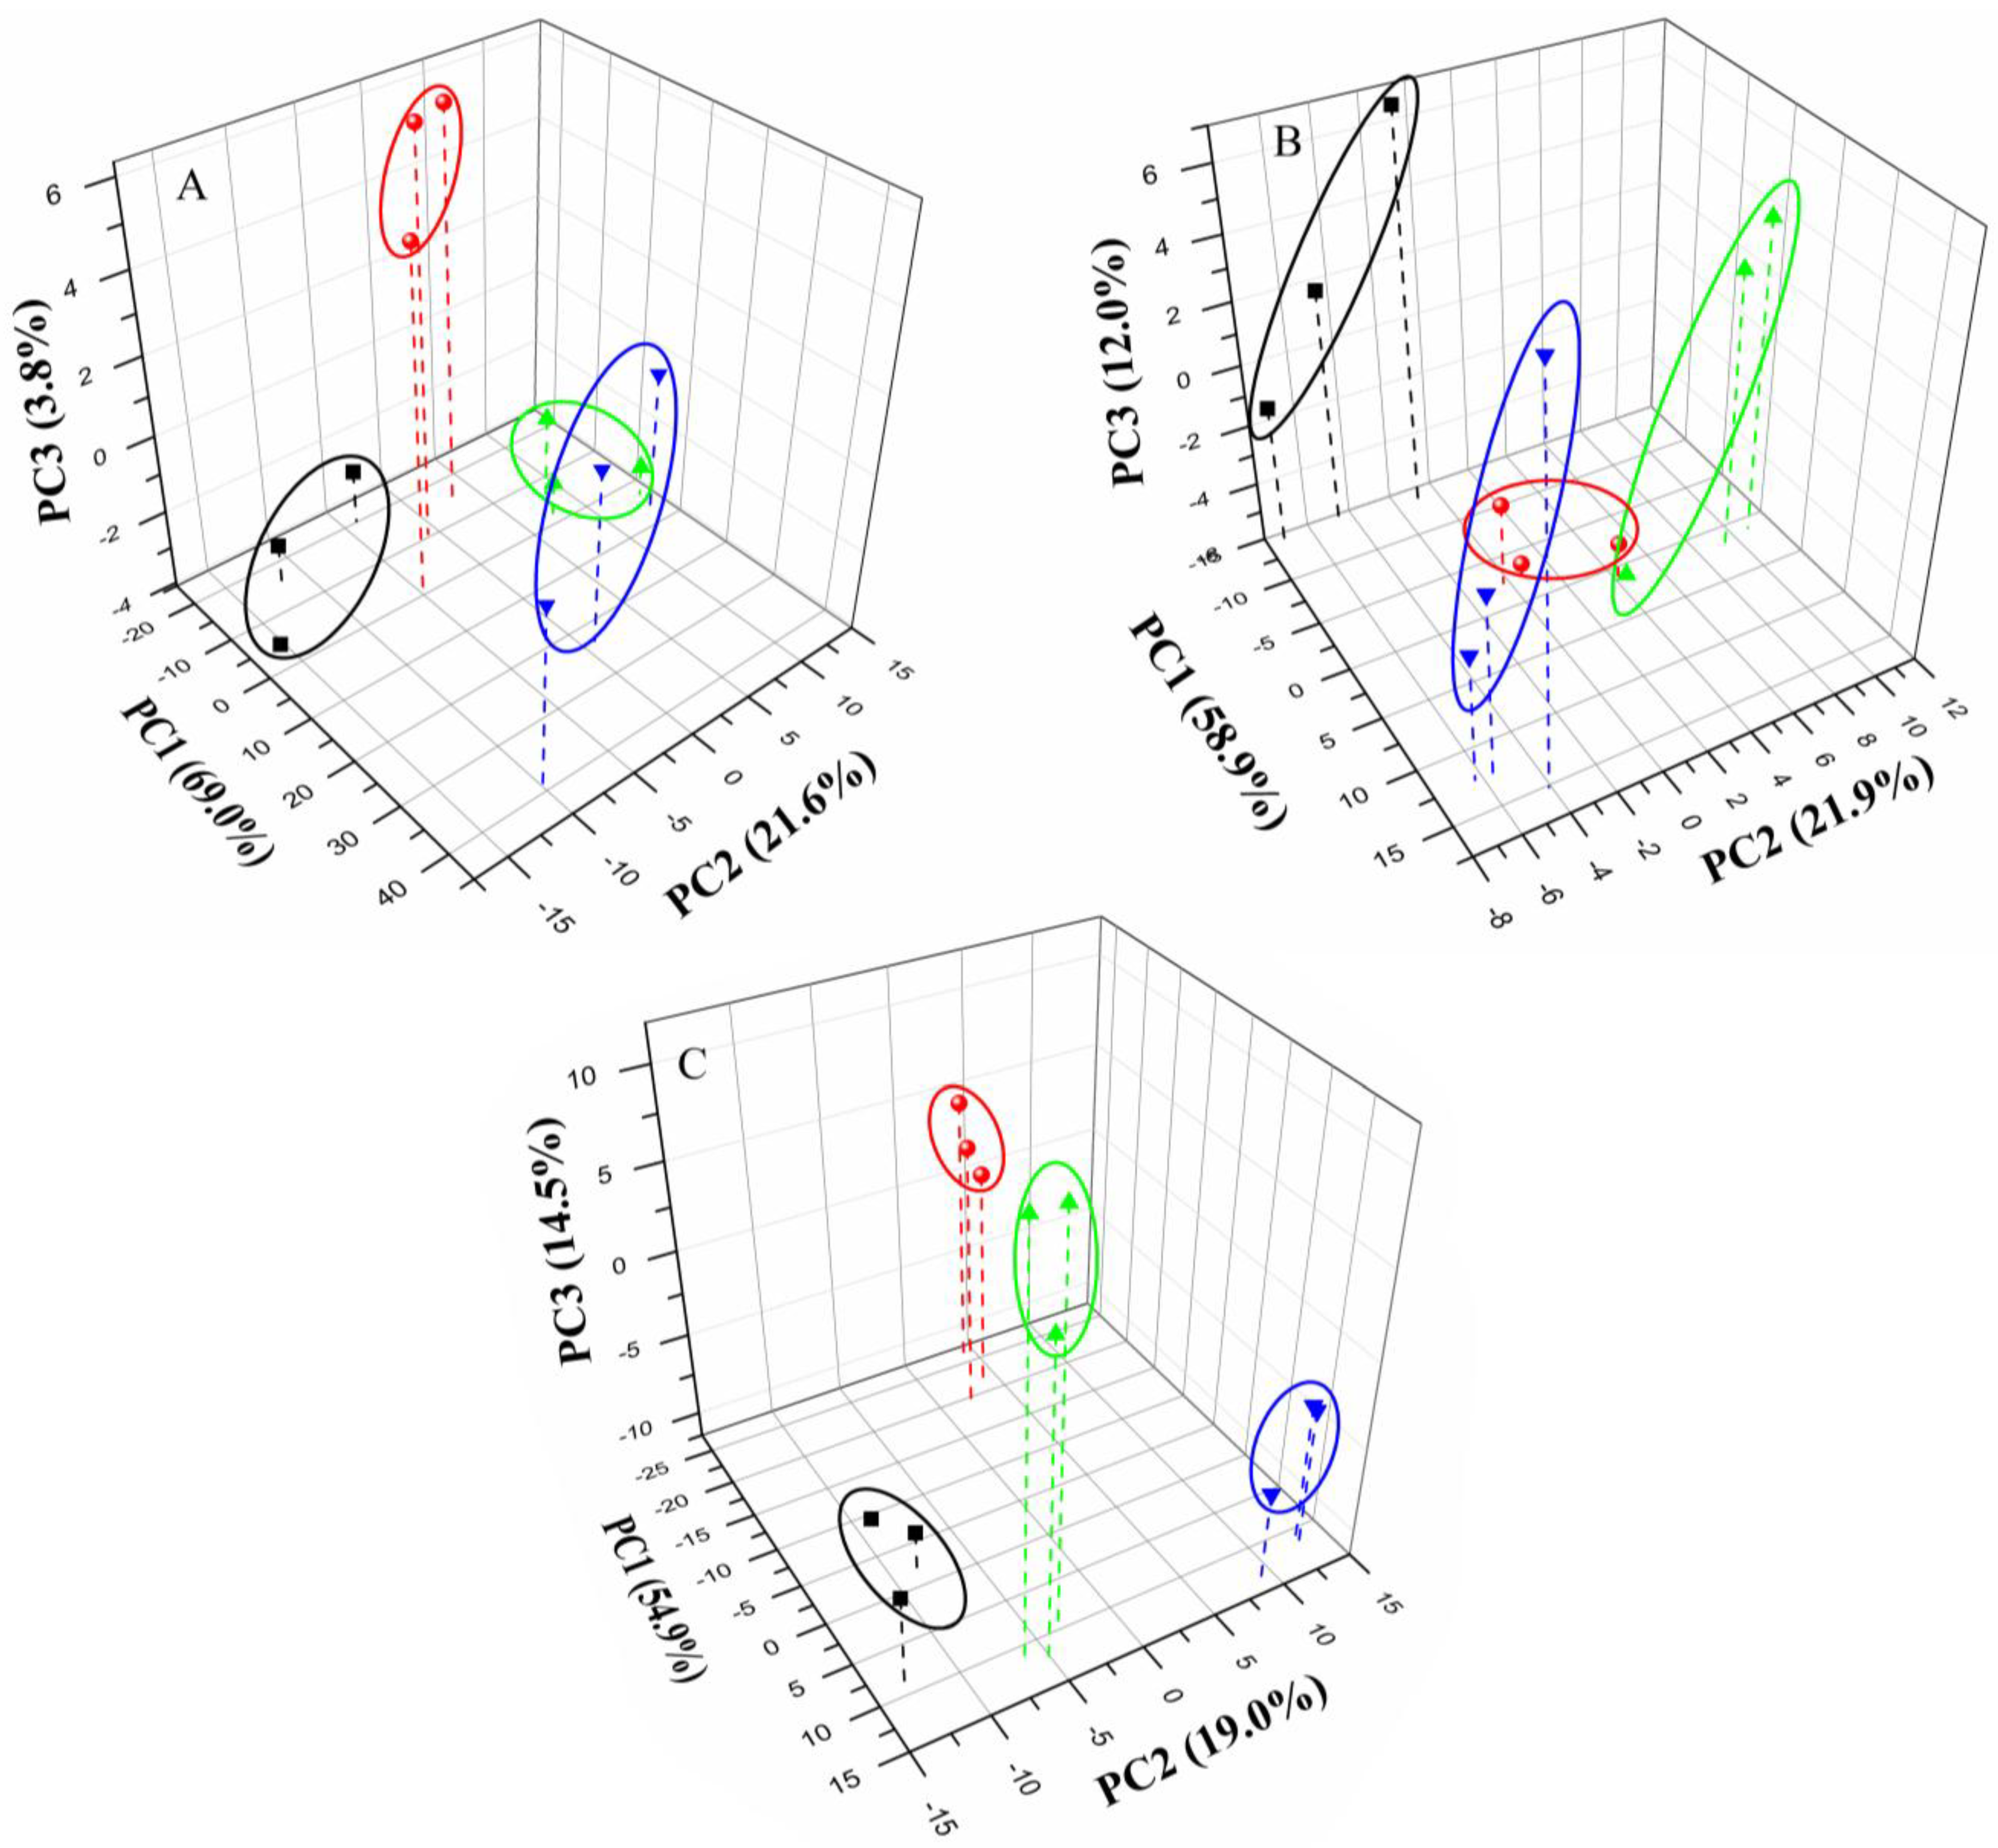
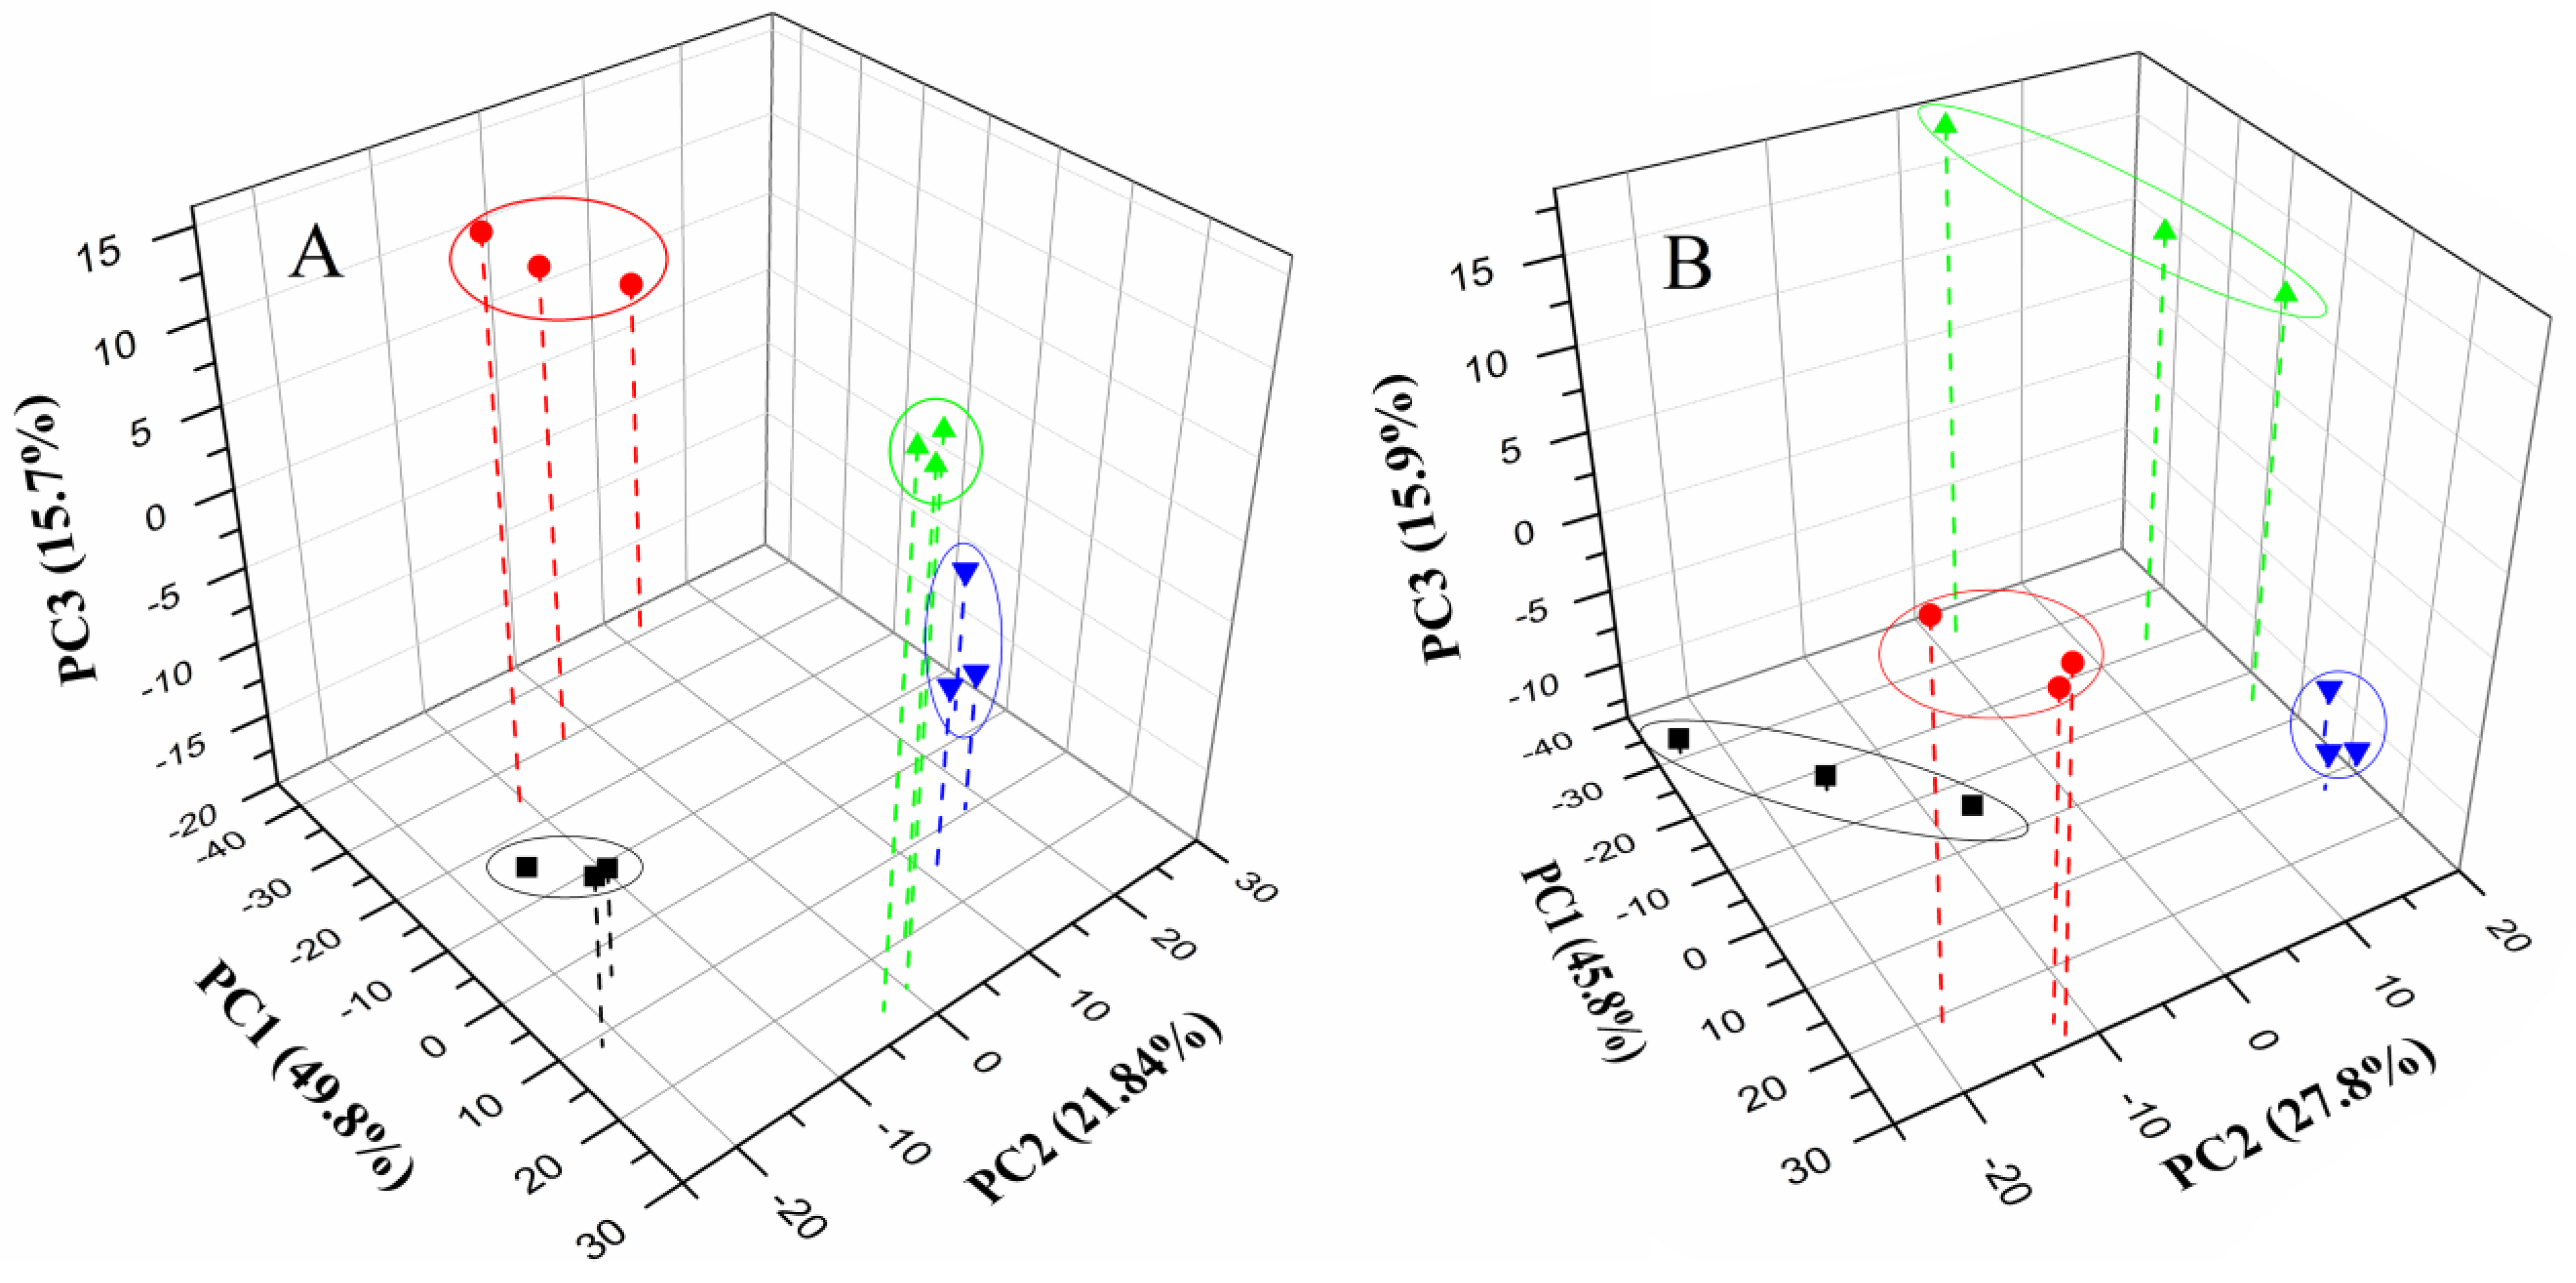
3.3. Discrimination of Milk Samples

The current values obtained from the voltammograms measured using the three different working electrodes in the presence of the three adulterants in whole milk samples were used as input data for the chemometric tools, PCA (Figure 2), and HCA (Figure S4, Supplementary material). Figure 2 presents the PCA analysis for each individual working electrode. In all plots, we see that the non-adulterated samples are always clustered together, which is in contrast to the adulterated samples. For the gold electrode, several of the adulterated samples were not grouped correctly (Figure S4A, Supplementary material), making it impossible to clearly separate out the adulterants, in particular, the urea and melamine. This was attributed to the fact that the voltammograms for melamine and urea obtained using the gold electrode (Figure 1B2,B3, respectively) were so similar that the chemometric tool could not distinguish them from one another.
When using the copper electrode (Figure 2B), the samples adulterated with melamine can be clearly differentiated from the other milk samples. This behaviour can be explained by the formation of an ionic pair between melamine and copper that was reduced between −0.2 V and −0.8 V, as explained earlier. In addition, it was not possible to distinguish between some samples adulterated with formaldehyde from those containing urea, demonstrating that this electrode alone is not sufficient for discriminating between the contaminated samples (Figure S4B, Supplementary material).
The results obtained using the platinum electrode (Figure 2C) show successful differentiation between all of the samples. Despite this apparent good discrimination, when HCA was performed (Figure S4C, Supplementary material) the results demonstrated that the three samples from pure milk were wrongly classified by the PCA, which means that the method had an error of 25% (i.e., three samples out of 12 samples were incorrect). The HCA using the other two electrodes are shown in Figure S1A, S1B (found in the Supplementary material), and the gold and copper electrodes showed errors of 8.3% (one sample out of 12 samples), i.e., one sample of the adulterated milk with melamine and 16.7% (two samples out of 12 samples), i.e., one sample of pure milk and another for formaldehyde adulteration, respectively.
As it was not possible to discriminate between the samples with the individual current signals from each electrode, the use of a combination of signals was proposed in order to achieve good separation between the adulterated and unadulterated samples, in addition to distinguishing between the three contaminants. Figure 3 shows the PCA plot obtained using the combined current values from the gold, platinum, and copper electrodes, with and without adulterants. A clear separation between the unadulterated samples and each adulterant was observed. This result was verified by the HCA (Figure S5, Supplementary material), where no samples were wrongly grouped and demonstrated that the combination of the results from the information extracted by all three electrodes could be used to discriminate between unadulterated milk samples and those adulterated with formaldehyde, melamine or urea.
Figure 2. A Principal component analysis (PCA) score 3D plots of commercial (Elegê®) whole milk samples, unadulterated (black squares), and adulterated with 10.0 mmol·L−1 of formaldehyde (red circles), 0.95 mmol·L−1 of melamine (blue up triangles), and 4.16 mmol·L−1 of urea (green down triangles) using the current data obtained using (A) gold, (B) copper, and (C) platinum working electrodes and a Ag/AgCl(KCl sat) reference electrode. Samples were analysed in triplicate.
Chemosensors 02 00251 g002
Figure 3. PCA score 3D plots of commercial (Elegê®) whole milk samples, unadulterated (black squares), and adulterated with 10.0 mmol·L−1 of formaldehyde (red circles), 0.95 mmol·L−1 of melamine (blue up triangles), and 4.16 mmol·L−1 of urea (green down triangle). Samples were analysed in triplicate.
Chemosensors 02 00251 g003
A loading plot was constructed in order to determine which variable extracted by each electrode was responsible for the discrimination between the adulterants (Figure S6, Supplementary material). As expected from this analysis of the voltammetric profiles, the variables responsible for the identification of melamine were related to the copper-working electrode, which formed a unique ionic pair with this contaminant, along with the gold electrode, which was highly passivized by it. The variable extracted from using the gold working electrode was also responsible for the separation of samples adulterated with urea from those containing the other contaminants. The variables extracted from using the platinum electrode were identified as being responsible for the discrimination of the samples adulterated with formaldehyde. The results from the loading plot with the PCAs and HCAs from each electrode individually were compared (Figure 2 and Figure S6, Supplementary material, respectively) and it was found that the urea and melamine adulterated samples were located close to one another using the gold electrode (Figure 2A and Figure S6A, Supplementary material, respectively), demonstrating why the data from this electrode were responsible for the discrimination between these samples. As mentioned earlier, in the PCA from the copper electrode (Figure 2B), the melamine samples are located at a distance from the others, which indicates that the copper electrode plays an important role in the discrimination of melamine and was confirmed by the loading plot. In Figure 2C, it can be seen that when using the platinum electrode, the formaldehyde samples were all clustered at a distance from the other samples and again demonstrates the agreement between the results obtained from the individual PCAs and those obtained by combining the information extracted from all of the working electrodes.
Experiments were also performed on skimmed and semi-skimmed milk samples contaminated with the same three adulterants. Figure 4 shows the tri-dimensional graphs of these milk samples, with each belonging to the same brand (Elegê®). The score plots for each type of milk indicated that the non-adulterated samples could be distinguished from the adulterated samples and could also be separated by each adulterant. Samples containing the same adulterant can be located in distinct regions of the graphs for each type of milk; however, the extracted variable responsible for the identification of each adulterant was found to be the same, but with a greater or lesser significance. These differences were attributed to the different percentages of fat in each type of milk causing diverse interactions between the samples and the electrodes [31].
Two different brands of milk (Parmalat® (Laticínios Bom Gosto S.A. Usina de Beneficiamento, Tapejara, RS, Brazil) and Qualitá® (Usina de Beneficiamento de Leite da Cooperativa dos Suinocultores de Encantado Ltda, Arroio do Meio, RS, Brazil) were evaluated to assess the accuracy of the methodology, with whole, skimmed, and semi-skimmed samples for each brand being investigated. The results obtained (Figures S7 and S8, Supplementary material) displayed the same pattern of separation as those obtained from the Elegê® brand, indicating that the proposed method was not limited to a single brand or type of milk. Therefore, we have shown as a proof of concept that an electronic tongue with three different working electrodes can be used as a rapid method for screening milk adulteration with urea, formaldehyde, and melamine. An important point should be highlighted; if the milk content of each adulterant was higher than proposed in this work, the discrimination process could be performed as described by the proposed method (Figure S9, Supplementary material). However, if we treat samples with different concentrations, for example, milk samples containing: melamine at 0.95 mmol·L−1 and 95 mmol·L−1; urea at 4.16 mmol·L−1 and 41.6 mmol·L−1; and formaldehyde at 10 mmol·L−1 and 100 mmol·L−1, the discrimination process can be confusing (Figure S10, Supplementary material). As shown in Figure S10 the data values for each adulterant in two different levels do not result in clear discrimination, showing that the data extracted are dependent of the concentration and not only by the species analysed.
In order to circumvent this problem, a local technique transformation [39] can be applied. It is important to highlight that we are assuming that the voltammetric current extracted from the data set in the working range studied has a linear relationship between current and concentration for each potential value (Ei), I E i = k c a d u l t e r a n t . Using the local technique approach, the response of each individual sensor is divided by i I E i 2 . This process forces the distribution of current signals for each electrode to be located on a hypersphere of the unit value. Hence, this process will remove the effect of concentrations, provided that all current signals extracted by each sensor in the array have the same concentration dependence.
After this normalization process is applied to the extracted data (Figure S11, Supplementary material), the score plot changes significantly when compared with the score plot in the absence of the normalization process (Figure S10, Supplementary material) and shows that the principal component in the local technique transformation have separation amongst the adulterants studied without the effect of concentration.
In the literature, procedures for the quantification of the same adulterants used in this work have been reported previously and they have a better efficiency of detecting the adulterants than the procedure developed in our work [6,28,29,40,41,42]. However, none of the previous work involved analysis of all three adulterants (melamine, formaldehyde, and urea) together, compared to the procedure presented here, which is an analytical method to discriminate milk adulteration by melamine, formaldehyde, and urea, by making the measurements directly on the sample. In addition, the concentration used in this study for melamine (0.95 mmol·L−1) is below the intake of melamine regulated by USA health organisation (2.5 mg/kg of body weight; considering a person of 70 kg and a consumption of 1 litre of milk, this would result in a concentration of 1.25 mmol·L−1) [6,20] and is also lower than the amount used to adulterate milk powder in China (2.6 mmol·L−1) [16]. With respect to addition of formaldehyde, concentrations of 7.2 mmol·L−1 are founded in order to preserve the milk for one week [22]. Hence, our detection efficiency would be sufficient to discriminate milk samples adulterated with this chemical compound. The minimum urea concentration evaluated (4.16 mmol·L−1) is within the range of concentration typically found in milk (~3–6 mmol·L−1) [10] and is lower than the toxic concentration (~11 mmol·L−1) [10]. It has also been reported that adulteration with urea and melamine is only economically viable if the minimum concentration of each adulterant is 15 and 7 mmol·L−1, respectively [4], a larger concentration than that shown here.
Figure 4. PCA 3D plots of commercial (Elegê®) milk samples, unadulterated (black squares), and adulterated with 10.0 mmol·L−1 of formaldehyde (red circles), 0.95 mmol·L−1 of melamine (blue up triangles), and 4.16 mmol·L−1 of urea (green down triangles). Skimmed milk (A) and semi-skimmed milk (B). Samples were analysed in triplicate.
Chemosensors 02 00251 g004

4. Conclusions

We have demonstrated the ability to combine voltammetric signals recorded using different working electrodes as the input data for unsupervised pattern recognition methods (PCA and HCA) for the fast and efficient pattern screening of milk adulteration with urea, formaldehyde, and melamine. The proposed voltammetric electronic tongue utilised simple metallic electrodes and was able to discriminate between the three contaminants at concentrations above 10.0, 4.16, and 0.95 mmol·L−1 for formaldehyde, urea, and melamine, respectively. The limits of discrimination achieved are higher than those reported in the literature, including the single quantification and electrochemical techniques reported by Cao et al. [43] and Trivedi et al. [10], who reported limits of detection of 9.6 × 10⁻⁹ mol·L−1 for melamine and 2.5 × 10⁻⁵ mol·L−1 for urea. To the best of our knowledge, no studies have analysed formaldehyde content in milk samples using electrochemical sensors. In contrast, the proposed method was developed without a pre-treatment step and the three adulterants were analysed together, rather than individually. Similar to our approach, Cortón et al. [6] proposed a simultaneous chemometric discrimination using voltammetric signals for urea and melamine achieving limits of discrimination of 121.4 g·L−1 (2 mol·L−1) and 85 mg·L−1 (0.7 mmol·L−1) for urea and melamine, respectively. It is important to highlight that the limit of discrimination for urea is higher than that proposed in this work and similar for the melamine discrimination. Furthermore, with our system, it is possible to detect simultaneously these three processes of adulteration with limits of discrimination below the tolerable intake dose recommended by the health organisations and those found in real cases, in which fraudsters use large quantities of adulterants, like in China [16]. Different brands of milk and those with different fat contents were analysed using this methodology, demonstrating that the proposed electronic tongue has great potential for differentiating between adulterations in a wide variety of milk.

Acknowledgments

The authors are grateful to Fundação de Amparo à Pesquisa do Estado de São Paulo (FAPESP; grant numbers 2011/23355-3, 2012/12106-5, 2011/11115-8, and 2011/19903-5), Coordenação de Aperfeiçoamento de Pessoal de Nível Superior (CAPES), and Conselho Nacional de Desenvolvimento Científico e Tecnológico (CNPq; grant numbers 470919/2011-6 and 302700/2011-0) for financial support.

Author Contributes

The present work is designed to pursuit Paixão’ Lab goals, development of electronic tongues for analytical applications. The other Authors effectively achieved the experimental facts towards goal attainment. All Authors wrote the manuscript, discussed the results and commented on the manuscript.

Conflicts of Interest

The authors declare no conflicts of interest.

References

  1. Spink, J.; Moyer, D.C. Defining the public health threat of food fraud. J. Food Sci. 2011, 76, R157–R163. [Google Scholar] [CrossRef] [PubMed]
  2. Fuca, N.; Pasta, C.; Impoco, G.; Caccamo, M.; Licitra, G. Microstructural properties of milk fat globules. Int. Dairy J. 2013, 31, 44–50. [Google Scholar] [CrossRef]
  3. Wilbey, R.A. Milk Quality. Int. J. Dairy Technol. 1996, 49, 36–36. [Google Scholar] [CrossRef]
  4. Abernethy, G.; Higgs, K. Rapid detection of economic adulterants in fresh milk by liquid chromatography-tandem mass spectrometry. J. Chromatogr. A 2013, 1288, 10–20. [Google Scholar] [CrossRef] [PubMed]
  5. Veloso, A.C.A.; Teixeira, N.; Ferreira, I.M.P.L.V.O.; Ferreira, M.A. Detecção de Adulterações em Produtos Alimentares Contendo Leite e/ou Proteínas Lácteas. Quim. Nova 2002, 25, 609–615. (In Portuguese) [Google Scholar] [CrossRef]
  6. Hilding-Ohlsson, A.; Fauerbach, J.A.; Sacco, N.J.; Celina Bonetto, M.; Corton, E. Voltamperometric Discrimination of Urea and Melamine Adulterated Skimmed Milk Powder. Sensors 2012, 12, 12220–12234. [Google Scholar] [CrossRef] [PubMed]
  7. Rani, R.; Medhe, S.; Raj, K.R.; Srivastava, M.M. High performance thin layer chromatography for routine monitoring of adulterants in milk. Natl. Acad. Sci. Lett. 2012, 35, 309–313. [Google Scholar] [CrossRef]
  8. Jonker, J.S.; Kohn, R.A.; Erdman, R.A. Using milk urea nitrogen to predict nitrogen excretion and utilization efficiency in lactating dairy cows. J. Dairy Sci. 1998, 81, 2681–2692. [Google Scholar] [PubMed]
  9. Sharma, R.; Rajput, Y.S.; Kaur, S.; Tomar, S.K. A method for estimation of urea using ammonia electrode and its applicability to milk samples. J. Dairy Res. 2008, 75, 466–470. [Google Scholar] [CrossRef] [PubMed]
  10. Trivedi, U.B.; Lakshminarayana, D.; Kothari, I.L.; Patel, N.G.; Kapse, H.N.; Makhija, K.K.; Patel, R.B.; Panchal, C.J. Potentiometric biosensor for urea determination in milk. Sens. Actuators B Chem. 2009, 140, 260–266. [Google Scholar] [CrossRef]
  11. Nikoleli, G.-P.; Nikolelis, D.P.; Methenitis, C. Construction of a simple optical sensor based on air stable lipid film with incorporated urease for the rapid detection of urea in milk. Anal. Chim. Acta 2010, 675, 58–63. [Google Scholar] [CrossRef] [PubMed]
  12. Souza, A.D.; Devi, R. Cytokinesis blocked micronucleus assay of peripheral lymphocytes revealing the genotoxic effect of formaldehyde exposure. Clin. Anat. 2014, 27, 308–312. [Google Scholar] [CrossRef] [PubMed]
  13. Ellis, D.I.; Brewster, V.L.; Dunn, W.B.; Allwood, J.W.; Golovanov, A.P.; Goodacre, R. Fingerprinting food: Current technologies for the detection of food adulteration and contamination. Chem. Soc. Rev. 2012, 41, 5706–5727. [Google Scholar] [CrossRef] [PubMed]
  14. Li, L.; Li, B.; Cheng, D.; Mao, L. Visual detection of melamine in raw milk using gold nanoparticles as colorimetric probe. Food Chem. 2010, 122, 895–900. [Google Scholar] [CrossRef]
  15. Su, H.; Fan, H.; Ai, S.; Wu, N.; Fan, H.; Bian, P.; Liu, J. Selective determination of melamine in milk samples using 3-mercapto-1-propanesulfonate-modified gold nanoparticles as colorimetric probe. Talanta 2011, 85, 1338–1343. [Google Scholar] [CrossRef] [PubMed]
  16. Xin, H.; Stone, R. Chinese probe unmasks high-tech adulteration with melamine. Science 2008, 322, 1310–1311. [Google Scholar] [CrossRef] [PubMed]
  17. Dorne, J.L.; Doerge, D.R.; Vandenbroeck, M.; Fink-Gremmels, J.; Mennes, W.; Knutsen, H.K.; Vernazza, F.; Castle, L.; Edler, L.; Benford, D. Recent advances in the risk assessment of melamine and cyanuric acid in animal feed. Toxicol. Appl. Pharmacol. 2013, 270, 218–229. [Google Scholar] [CrossRef] [PubMed]
  18. Tsai, T.-H.; Thiagarajan, S.; Chen, S.-M. Detection of melamine in milk powder and human urine. J. Agric. Food Chem. 2010, 58, 4537–4544. [Google Scholar] [CrossRef] [PubMed]
  19. Helrich, K. Official Methods of Analysis of the Association of Official Analytical Chemists, 15th ed.; Association of Official Analytical Chemists Inc.: Arlington, MA, USA, 1990. [Google Scholar]
  20. Liang, X.; Wei, H.; Cui, Z.; Deng, J.; Zhang, Z.; You, X.; Zhang, X.-E. Colorimetric detection of melamine in complex matrices based on cysteamine-modified gold nanoparticles. Analyst 2011, 136, 179–183. [Google Scholar] [CrossRef] [PubMed]
  21. Kaminski, J.; Atwal, A.S.; Mahadevan, S. Determination of formaldehyde in fresh and retail milk by liquid column chromatography. J. AOAC Int. 1993, 76, 1010–1013. [Google Scholar] [PubMed]
  22. Torell, D.T. Adding formalin to milk helps in raising orphan lambs. Calif. Agric. 1972, 26, 8–10. [Google Scholar]
  23. Cheng, Y.; Qin, J.; Lim, J.; Chan, D.E.; Kim, M.S.; Chao, K. An investigation of FT-Raman spectroscopy for quantification of additives to milk. In Sensing for Agriculture and Food Quality and Safety IV; Kim, M.S., Tu, S.I., Chao, K., Eds.; SPIE: Baltimore, MD, USA, 2012. [Google Scholar] [CrossRef]
  24. He, B.; Liu, R.; Yang, R.; Xu, K. Adulteration detection in milk using infrared spectroscopy combined with two-dimensional correlation analysis. In Optical Diagnostics and Sensing X: Toward Point-of-Care Diagnostics; Cote, G.L., Ed.; SPIE: San Francisco, CA, USA, 2010. [Google Scholar] [CrossRef]
  25. Qin, J.; Chao, K.; Kim, M.S. Detecting multiple adulterants in dry milk using Raman chemical imaging. In Sensing for Agriculture and Food Quality and Safety IV; Kim, M.S., Tu, S.I., Chao, K., Eds.; SPIE: Baltimore, MD, USA, 2012. [Google Scholar] [CrossRef]
  26. Czerwenka, C.; Muller, L.; Lindner, W. Detection of the adulteration of water buffalo milk and mozzarella with cow’s milk by liquid chromatography-mass spectrometry analysis of beta-lactoglobulin variants. Food Chem. 2010, 122, 901–908. [Google Scholar] [CrossRef]
  27. Krska, R.; Becalski, A.; Braekevelt, E.; Koerner, T.; Cao, X.L.; Dabeka, R.; Godefroy, S.; Lau, B.; Moisey, J.; Rawn, D.F.K.; et al. Challenges and trends in the determination of selected chemical contaminants and allergens in food. Anal. Bioanal. Chem. 2012, 402, 139–162. [Google Scholar] [CrossRef] [PubMed]
  28. Yang, L.M.; Huo, D.Q.; Jiang, Y.H.; Hou, C.J.; Zhang, S.Y. Monitoring the adulteration of milk with melamine: A visualised sensor array approach. Food Addit. Contam. Part A Chem. 2013, 30, 786–795. [Google Scholar] [CrossRef]
  29. Xing, H.B.; Zhan, S.S.; Wu, Y.G.; He, L.; Zhou, P. Sensitive colorimetric detection of melamine in milk with an aptamer-modified nanogold probe. RSC Adv. 2013, 3, 17424–17430. [Google Scholar] [CrossRef]
  30. Bueno, L.; Paixão, T.R.L.C. A single platinum microelectrode for identifying soft drink samples. Int. J. Electrochem. 2012, 2012. [Google Scholar] [CrossRef]
  31. Paixão, T.R.L.C.; Bertotti, M. Fabrication of disposable voltammetric electronic tongues by using Prussian Blue films electrodeposited onto CD-R gold surfaces and recognition of milk adulteration. Sens. Actuator B Chem. 2009, 137, 266–273. [Google Scholar] [CrossRef]
  32. Dias, L.A.; Peres, A.M.; Vilas-Boas, M.; Rocha, M.A.; Estevinho, L.; Machado, A. An electronic tongue for honey classification. Microchim. Acta 2008, 163, 97–102. [Google Scholar] [CrossRef]
  33. Legin, A.; Rudnitskaya, A.; Seleznev, B.; Vlasov, Y.; Velikzhanin, V. Electronic tongue for recognition of flesh food. In Artificial Chemical Sensing: Olfaction and the Electronic Nose; Stetter, J.R., Penrose, W.R., Eds.; The Electrochemical Society, Inc.: Pennington, NJ, USA, 2001; Volume 2001, pp. 76–81. [Google Scholar]
  34. Vlasov, Y.; Legin, A.; Rudnitskaya, A.; di Natale, C.; D’Amico, A. Nonspecific sensor arrays (“electronic tongue”) for chemical analysis of liquids (IUPAC Technical Report). Pure Appl. Chem. 2005, 77, 1965–1983. [Google Scholar] [CrossRef]
  35. Paixão, T.R.L.C.; Corbo, D.; Bertotti, M. Amperometric determination of ethanol in beverages at copper electrodes in alkaline medium. Anal. Chim. Acta 2002, 472, 123–131. [Google Scholar] [CrossRef]
  36. Pedrotti, J.J.; Angnes, L.; Gutz, I.G.R. Miniaturized reference electrodes with microporous polymer junctions. Electroanalysis 1996, 8, 673–675. [Google Scholar] [CrossRef]
  37. Juodkazis, K.; Juodkazyte, J.; Juodiene, T.; Lukinskas, A. Determination of Au (III) in the surface layers formed anodically on the gold electrode. J. Electroanal. Chem. 1998, 441, 19–24. [Google Scholar] [CrossRef]
  38. De Araujo, W.R.; Paixão, T.R.L.C. Use of copper electrode for melamine quantification in milk. Electrochim. Acta 2014, 117, 379–384. [Google Scholar] [CrossRef]
  39. Hierlemann, A.; Gutierrez-Osuna, R. Higher-order chemical sensing. Chem. Rev. 2008, 108, 563–613. [Google Scholar] [CrossRef] [PubMed]
  40. Finete, V.D.M.; Gouvea, M.M.; Marques, F.F.D.; Netto, A.D.P. Is it possible to screen for milk or whey protein adulteration with melamine, urea and ammonium sulphate, combining Kjeldahl and classical spectrophotometric methods? Food Chem. 2013, 141, 3649–3655. [Google Scholar] [CrossRef] [PubMed]
  41. Jawaid, S.; Talpur, F.N.; Sherazi, S.T.H.; Nizamani, S.M.; Khaskheli, A.A. Rapid detection of melamine adulteration in dairy milk by SB-ATR-Fourier transform infrared spectroscopy. Food Chem. 2013, 141, 3066–3071. [Google Scholar] [CrossRef] [PubMed]
  42. Santos, P.M.; Pereira-Filho, E.R.; Rodriguez-Saona, L.E. Rapid detection and quantification of milk adulteration using infrared microspectroscopy and chemometrics analysis. Food Chem. 2013, 138, 19–24. [Google Scholar] [CrossRef] [PubMed]
  43. Cao, Q.; Zhao, H.; Zeng, L.; Wang, J.; Wang, R.; Qiu, X.; He, Y. Electrochemical determination of melamine using oligonucleotides modified gold electrodes. Talanta 2009, 80, 484–488. [Google Scholar] [CrossRef] [PubMed]

