
Study on the Detection Characteristics and Response Mechanism of SnS2-Based Sensors for SO2 and SOF2

1
School of Detroit Green Technology, Hubei University of Technology, Wuhan 430068, China
2
College of Economics and Business Foreign Languages, Wuhan Technology and Business University, Wuhan 430065, China
3
Hubei Engineering Research Center for Safety Monitoring of New Energy and Power Grid Equipment, Hubei University of Technology, Wuhan 430068, China
4
School of Electrical Engineering and Automation, Wuhan University, Wuhan 430072, China
*
Author to whom correspondence should be addressed.
Chemosensors 2022, 10(12), 526; https://doi.org/10.3390/chemosensors10120526
Submission received: 14 November 2022
/
Revised: 30 November 2022
/
Accepted: 6 December 2022
/
Published: 11 December 2022
(This article belongs to the Special Issue Application and Advance of Gas Sensors)
Abstract
:Based on the wide application of sulfur hexafluoride (SF6) gas in the power industry, the analysis and detection of its decomposition components have become important technical means for state detection and fault evaluation of gas-insulated equipment. The gas-sensitive characteristics and adsorption mechanism of the SnS2 sensor for SO2 and SOF2 gases were investigated using SO2 and SOF2, the main SF6 decomposition components, as the target detection gases. SnS2 gas-sensitive materials and components were prepared, and the temperature response, concentration response, response recovery and stability of the SnS2 sensor for the two SF6 decomposition components were tested based on the gas-sensitive test platform. The results demonstrate that the sensor had the best working performance at 200 °C, with obvious response and ideal recovery for both target gases and good stability in a certain time. Based on the first principle, the SnS2 surface structure model and the target gas adsorption model were established, and the adsorption mechanism was analyzed in terms of frontier molecular orbital theory to verify the correctness of the gas-sensitive test results. The gas-sensitive test analysis and simulation calculation can provide data basis and theoretical support for the study of SF6 decomposition components detected by gas sensors.
1. Introduction
The excellent insulation and arc extinguishing properties of SF6 gas have made it important and widely used in power systems [1,2,3,4,5]. With the improvement of the voltage level of the power systems, the partial discharge (PD) and partial over-thermal (POT) phenomenon inside SF6-insulated power equipment has gradually become an important cause of insulation failure [6]. Moreover, POT or PD will cause part of the SF6 gas to decompose into a variety of low-fluorine sulfides, which will also react with micro-oxygen and micro-water to generate a series of stable products, such as SO2, H2S, SOF2, SO2F2, HF, etc., thus accelerating insulation aging, affecting the safe operation of equipment and threatening the health and safety of staff [7,8]. At present, there are various PD monitoring methods such as the pulse current method, ultrasonic method and ultra-high-frequency method [9] at home and abroad, but they all have limitations and cannot meet the needs of modern monitoring [10]. Based on the causal relationship between PD and POT and the SF6 gas decomposition phenomenon [11,12], the analysis and detection technology of SF6 gas decomposition components has gradually become a research hotspot since the 1990s [13,14,15]. Among them, the gas sensor method has been studied extensively [16,17,18,19].
On the one hand, there is a problem of cross-interference in the development of gas sensing for mixed gas detection, i.e., the presence of other gases can affect the detection results of the target gas, and on the other hand, the shortcomings of existing gas-sensitive materials themselves also limit the development of gas-sensitive sensing. For the former, the solution using micro-gas-sensing arrays with artificial intelligence algorithms has been proposed, and for the latter, finding new gas-sensitive materials or modifying existing materials has become the path of development. In this paper, a new gas-sensitive material for detecting SF6 decomposition components is proposed for the second type of problem. The metal sulfide tin disulfide (SnS2) is an N-type semiconductor material with a graphene-like layer structure, and its narrow bandwidth and band gap give it special optical and electrical properties, making SnS2 widely studied in the fields of photocatalysis, biomaterials and gas sensors [20,21,22]. At this stage, many scholars have studied the gas adsorption properties of SnS2. Experimentally, Kim et al. [23] prepared a two-dimensional SnS2 material based on the high-energy ball milling method, and the results showe that this material could achieve a sensitivity of more than 2000% for NO2 gas at 250 °C with response recovery times of 6 s and 40 s, respectively. In terms of theory, based on density functional theory, Cui et al. [24] investigated SnS2 containing S vacancies and its adsorption properties for CO and C2H2 gases, and the results showe that both CO and C2H2 molecules could be physically adsorbed on the S vacancies of the SnS2 monolayer, and stronger adsorption performance could be identified in the CO system, in which the adsorption energy was calculated as −0.76 eV.
In summary, it can be seen that SnS2 materials demonstrate excellent gas-sensitive performance. However, experimental studies on SnS2 gas sensors at this stage are more limited to common gaseous molecules as target adsorption gases, such as NH3, NO, NO2, etc. The gas-sensitive performance of SF6 decomposition components is less explored and is still at a preliminary stage. Among the many SF6 gas decomposition components, SO2 gas has a high content and is one of the main decomposition products, and SOF2 is colorless and highly toxic and is one of the typical decomposition products [25,26]. To add to this, the National Institute of Occupational Safety and Health (NIOSH) recommends the short-term exposure limit (STET) value of SO2 as 5 ppm, and the Occupational Safety and Health Administration (OSHA) stipulates the permissible exposure limit (PEL) value of SOF2 as 2.5 mg/m3, which is about 0.7 ppm. Therefore, the detection of these two gases is of necessary research value. Based on the hydrothermal method and screen printing, SnS2 gas-sensitive materials and gas-sensitive sensors were prepared, and the gas-sensitive properties such as temperature response, concentration response, response recovery, sensitivity and stability for SO2 and SOF2 gases were tested. In terms of theoretical calculations, the surface structure model and target gas adsorption model of SnS2 were established based on Materials Studio software, and the adsorption mechanism of SnS2 on SO2 and SOF2 was verified at the micro-level. The results provide experimental and technical support for the fault detection of gas-insulated equipment.
2. Experimental Section
2.1. Preparation of SnS2 Material
SnS2 gas-sensitive materials were prepared by hydrothermal method. A total of 0.5 mL of hydrochloric acid (HCl, 36~38 wt%) was diluted with 10 mL of deionized water to obtain an aqueous solution of hydrochloric acid. A total of 1 mmol (225 mg) SnCl2·2H2O was weighed and dissolved in the above HCl aqueous solution, and the above mixed solution was stirred magnetically for 1 h, and then an appropriate amount of deionized water was added to obtain 40 mL of mixed Solution I. A total of 8 mmol (610 mg) thiourea (NH2CSNH2) was weighed and dissolved in the above mixed Solution I, and the above mixed solution was stirred magnetically for 1 h to obtain the mixed Solution II. The above mixed Solution II was placed in an autoclaved reaction and stored in a thermostat at 150 °C for 36 h. After the reactor cooled naturally to room temperature, the solid product was separated by centrifugation at 6000 r/min and washed by centrifugation with deionized water and anhydrous ethanol six times alternately. The solid product was dried in a thermostat at 60 °C for 8 h to finally obtain yellow powdered SnS2.
2.2. Preparation of SnS2 Gas Sensor
The gas sensor used alumina ceramic as the substrate and platinum, a precious metal, as the electrode conducting material. The electrode consists of two electrodes: the heating electrode on the outer ring and the gas-sensitivity test interdigital electrode on the inner ring. The SnS2 nanomaterials were evenly coated on the surface of the test electrode, and the specific steps were: The resistance between the electrodes was tested by the multimeter to ensure that the two electrodes were completely insulated from each other. The interdigital electrode was cleaned with deionized water and anhydrous ethanol alternately by ultrasonication six times to ensure that the electrode surfaces were free of impurities. A total of 0.2 g of the above SnS2 powder was mixed with 0.2 g of ethylene glycol solution, which was ultrasonically dispersed for 0.5 h to form a mixture. The above mixture was applied to the surface of the interdigital electrode through the screen-printing mesh with a squeegee. The coated interdigital electrode was placed in a vacuum at 180 °C for 6 h.
2.3. Construction of Gas-Sensitive Test Platform and Experimental Process
The gas-sensitive test platform was composed of four parts: the target gas to be tested, the dynamic gas distribution system, the gas-sensitive test and analysis system and the exhaust gas treatment system, which were connected by a 6 mm outer diameter gas tube. The target gases to be measured were SO2 and SOF2 gases, and the background gas was He. The dynamic gas distribution system adopted a GC500-multi-functional dynamic gas distribution instrument, which could precisely configure the concentration of the target gas to be measured and control the gas output flow rate to maintain 500 mL/min during the experiment. The gas-sensitive tester was composed of two parts: a four- channel gas-sensitive performance tester and an upper computer. The four-channel gas-sensitivity tester could collect data and send them back to the upper computer, which could visualize the output of the data returned and realize the temperature control and optical excitation control of the gas-sensitive tester.
The idea of this experiment was: first, the temperature response and recovery characteristics of the SnS2 gas sensor to two SF6 decomposition components were tested to determine the optimal operating temperature of the sensor, and then the concentration-response characteristics, sensitivity and long-term stability of the sensor for the two target gases were tested at this temperature.
The specific steps were:
- (1)
- The device was connected, and the gas tightness of the device was checked.
- (2)
- He was introduced to flush the gas chamber to ensure that no other gases exist inside the gas chamber.
- (3)
- The initial resistance value of the SnS2 gas sensor at room temperature (23 °C) and in a pure He background was measured, recorded as R1. A specific concentration of a single target gas was introduced, where SO2 gas was tested at 150 ppm, while SOF2 gas was set at 50 ppm due to the difficulty of purchasing raw materials for the production of this gas, and only 50 ppm of standard gas could be purchased. After the sensor resistance was stabilized, the value was recorded as Rgas. Finally, the air chamber was cleaned by He, and when the resistance stabilized again, the value was recorded as R2.
The response performance S was defined as:
The recovery performance R was defined as:
According to the definition of the formula, the greater the difference between the response value of the sensor to the target gas and “1”, the better its response performance, and the smaller the gap between the recovery value and “1”, the better its recovery performance.
- (4)
- The operating temperature gradient was set to: 50 °C, 100 °C, 150 °C, 200 °C, 250 °C, 300 °C and 350 °C, and Step 3 was repeated. The temperature response characteristics of the sensor to the target gas were combined with the recovery of the sensor resistance value to determine its optimal operating temperature.
- (5)
- At the optimal operating temperature, the response values of the sensor to different concentrations of a single target gas were tested (where the concentration gradients were set to 150 ppm, 100 ppm, 50 ppm, 30 ppm and 10 ppm for SO2 gas, and 50 ppm, 40 ppm, 30 ppm, 20 ppm and 10 ppm for SOF2 gas). The concentration–response characteristics of the sensor to the target gas were explored in relation to the response concentration, and the dynamic characteristics of the sensor such as response time, recovery time, sensitivity and stability were analyzed. The response time is the time required for the sensor resistance to reach 90% of its final stable value after the target gas to be measured is introduced. Additionally, the recovery time is the time required for the sensor resistance to return to 90% of the initial resistance value after stopping the target gas to be switched to He.
3. Results and Discussion
3.1. Micro-Structure and Characterization of SnS2
The XRD pattern of SnS2 nanomaterial is shown in Figure 1. Among the diffraction peaks of the sample, the stronger peaks are 14.9° (001), 28.2° (100), 32.9° (101), 41.8° (102) and 46.0° (110), which correspond to the peak positions of the standard card, indicating that the sample is the SnS2 material. Additionally, the strong and sharp diffraction peaks in the XRD pattern indicate that the material has good crystallinity. In addition, the diffraction peaks on the crystalline plane of the sample (00 c) increase in intensity, indicating that the sample is a lamellar structure and stacked along the c-axis.
Figure 2a shows the FESEN image of the SnS2 material, and Figure 2b,c shows the TEM images of different positions of the SnS2 material. It can be seen in the combined two types of representational images that the SnS2 exhibits irregular flakes, and the planar dimensions of the nanosheets are between a few hundred nanometers and a few micro-meters, and the thickness is about tens to hundreds of nanometers.
The XPS characterization results of SnS2 nanomaterials are shown in Figure 3. As shown in Figure 3a, Sn 3d and S 2p are located in the range of 480~500 eV and 160~170 eV, respectively. The scan patterns of Sn 3d and S 2p are shown in Figure 3b,c. Sn 3d in Figure 3b shows two distinct peaks at 487 eV and 495 eV, corresponding to Sn 3d5/2 and Sn 3d3/2 in the +4 valence state, respectively. S 2p is shown in Figure 3c with two peaks at 162 eV and 163 eV corresponding to S 2p3/2 and S 2P1/2, respectively. The XPS characterization results prove that the SnS2 samples prepared above were of good purity and basically free of other impurity elements.
3.2. Gas Sensitivity of the Sensor to SF6 Decomposition Components
3.2.1. Optimum Operating Temperature of SnS2 Gas Sensor
For the resistive-type gas sensor based on SnS2 nanomaterials prepared above, the optimal operating temperature for the two SF6 decomposition components was first required to be determined. The two gases to be measured were: 150 ppm SO2 gas and 50 ppm SOF2 gas. The test temperature gradients were: 23 °C, 50 °C, 100 °C, 150 °C, 200 °C, 250 °C, 300 °C and 350 °C (since the limit temperature of the gas tester is 400 °C, the upper limit of the test temperature was set as 350 °C to protect the normal operation of the equipment).
The temperature–response characteristics of the sensor to the two target gases at specific concentrations are shown in Figure 4. The gas-sensitivity test procedure was performed as described in Section 2.3, and the response values were calculated according to Equation (1). As can be seen from the figure, the SnS2 gas sensor did not show a significant response to the two target gases at room temperature. When the operating temperature increased, the resistance of the sensor when detecting the two target gases showed a decreasing trend, and its response value showed an increasing trend with the increase in the operating temperature. The trend of the response value is shown as follows: it continues to increase in the range of 23~200 °C, with little difference at 200 °C and 250 °C, and continues to increase at 300 °C and above. However, it was found through several tests that the recovery performance of the sensor becomes significantly worse at 300°C and above, as shown in Figure 5.
As can be seen from the figure, the recovery time of the SnS2 gas sensor for both SO2 and SOF2 gases is around 40 s when the operating temperature is at 200 °C and 250 °C, but when the operating temperature is at 300 °C and above, its resistance cannot recover to the initial state. Since the difference between the response values of the SnS2 gas sensor for the two target gases at 200 °C and 250 °C is not significant, and considering that the working temperature of the sensor should be as low as possible, the working temperature of 200 °C was determined for the subsequent concentration gradient test experiment.
3.2.2. SnS2 Gas Sensor Response
For gas sensors, there is a close relationship between their response values and target gas concentrations, and the study of the relationship between them is of great importance for the calculation of sensor detection accuracy and detection range. The response characteristics of the sensor at 200 °C for two target gases with different concentrations of the target are shown in Figure 6. The whole gas-sensitivity test experiment was a dynamic process. The concentration gradients of SO2 gas were 150 ppm, 100 ppm, 50 ppm, 30 ppm and 10 ppm, and the concentration gradients of SOF2 gas were 50 ppm, 40 ppm, 30 ppm, 20 ppm and 10 ppm.
As can be seen from Figure 6a, the response performance and recovery performance of the SnS2 gas sensor for SO2 gas at different concentrations are good, with a response time of about 60 s and a recovery time of about 40 s, and its resistance value is always able to recover to the initial state. As can be seen from Figure 6b, the response time and recovery time of the SnS2 gas sensor for SOF2 gas at different concentrations are basically the same as those for SO2 gas, and its resistance value can always be recovered to about 95% of the initial resistance. When the concentration of the target gas decreases, the response value of the sensor also decreases. At the above concentration gradients, the response values of the SnS2 gas sensor were approximately 1.94, 1.58, 1.22, 1.14 and 1.06 for SO2 and 1.25, 1.20, 1.16, 1.12 and 1.07 for SOF2, in that order.
The linear fitting curves of the response values of the SnS2 gas sensor for the two target gases at different concentration gradients are shown in Figure 7. The linear fit functions of the sensor for different concentrations of SO2 and SOF2 gases were y = 6.43 × 10⁻³ + 0.95 and y = 4.40 × 10⁻³ + 1.03, respectively, and with linear correlation coefficient R2, values were 0.990 and 0.998, which were greater than 0.990, i.e., the responses of the SnS2 gas sensor to the two target gases within their respective concentration gradients showed good linearity. Based on the above analysis, it can be seen that the concentration of the decomposition products of a single SF6 gas can be roughly deduced from the response value of the sensor in a certain concentration range.
3.2.3. Sensitivity of SnS2 Gas Sensor
The sensitivity of the sensor is the ratio of the change in the response of the sensor Δy to the change in the gas concentration Δx. In this study, the sensitivity can be regarded as the slope of the fitted curve between the response value of the sensor and the gas concentration. From the calculation results in the previous subsection, it can be seen that the sensor had a higher sensitivity of 6.43 × 10⁻³/ppm for SO2 gas and a lower sensitivity of 4.40 × 10⁻³/ppm for SOF2 gas, and the sensitivity size comparison was: SO2 > SOF2.
To investigate whether SF6 gas would interfere with the sensor detection results in practical applications, the response of SnS2 to 100% SF6 was tested, and the results are shown in Figure 8. In the three sets of tests, all response values of the SnS2 sensor for pure SF6 gas were approximately 1.02, and it was initially inferred from the experimental data that the presence of SF6 would not affect the detection of SF6 decomposition components by the sensor in the actual tests.
3.2.4. Long-Term Stability of SnS2 Gas Sensor
Long-term stability is an important parameter for evaluating the performance of a sensor and an important basis for determining the reliability of the sensor test results. To verify the stability of the SnS2 gas sensor, a 10-day stability test was conducted at 200 °C on SO2 gas at a concentration of 150 ppm and SOF2 gas at a concentration of 50 ppm, as shown in Figure 9. The response values of the SnS2 gas sensor for both target gases fluctuated to varying degrees over the 10-day period, but the fluctuations remained within a certain range. Taking the response value on the first day as the benchmark, the maximum deviation of the sensor was 2.06% for SO2 gas and 3.20% for SOF2 gas over the following 9 days. The result indicates that the SnS2 gas sensor has good stability and can reliably detect the decomposition products of SF6 gas within a certain period of time.
Table 1 shows the performance of SnS2 sensors and other nanomaterial sensors at this stage in the detection of SF6 decomposition into components—SO2 and SOF2 gases. Compared with carbon nanotube and graphene materials, the SnS2 sensor has a higher response and better recovery performance, although it operates at a higher temperature. Compared with the TiO2 nanotube material, the SnS2 sensor has a lower response to SO2, but it has a faster response recovery. In conclusion, the SnS2 material prepared in this paper has higher responsiveness and better response recovery characteristics for the detection of SF6 decomposition components—SO2 and SOF2—compared with other gas-sensitive materials.
3.3. Response Mechanism Analysis of SnS2 Gas Sensor to SF6 Decomposition Components
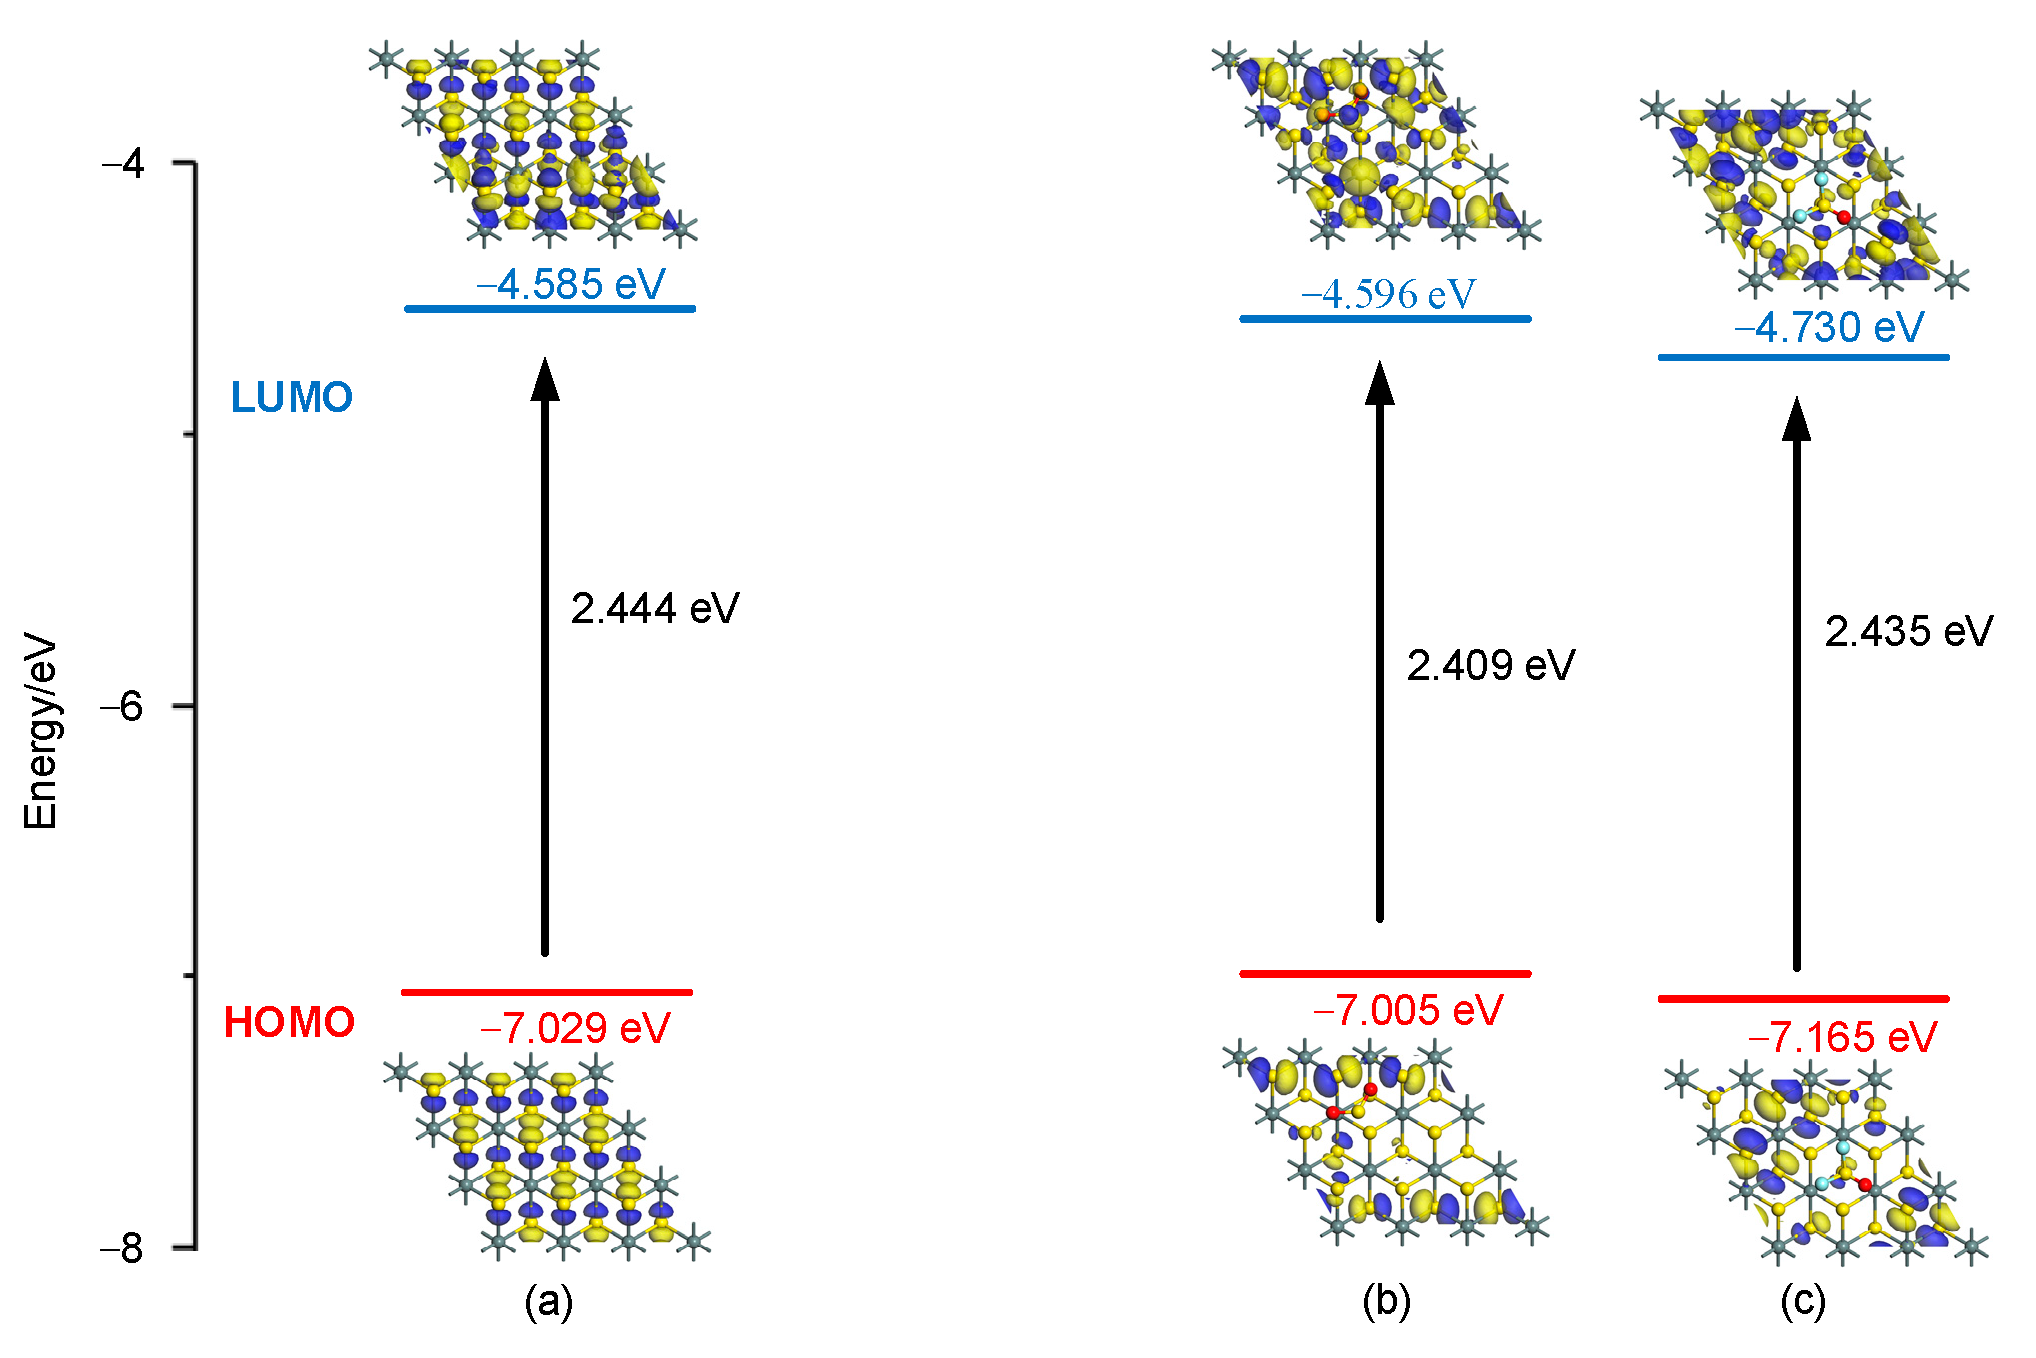
The gas-sensitive mechanism of SnS2 gas sensors is mainly derived from the adsorption of gas molecules on the SnS2 structure, as well as the interactions, energy gap changes and charge transfer that exist during the adsorption process. In the frontier molecular orbital theory, the energy difference between the highest occupied molecular orbital (HOMO) and the lowest unoccupied molecular orbital (LUMO) is called the energy gap value. The magnitude of the value can reflect the ease of electron transfer between HOMO and LUMO, which is reflected in the strength of the conductivity of the adsorption system on a macroscopic scale. In general, the smaller the energy gap, the lower the resistivity of the adsorption system [30,31,32,33,34].
The model is calculated and analyzed based on the Dmol3 module of Materials Studio. The Perdew–Burke–Ernzehof (PBE) function in the generalized gradient approximation (GGA) was chosen for the exchange-correlation generalization function. The p-orbit polarization double numerical polarization (DNP) was used for the atomic orbital basis group. The DFT semi-core pseudopotential (DSSP) was used for the inner electron processing, and the Hirshfeld method was used to analyze the change in system charge. The cutoff radius was set to 5.0 Å. The energy convergence criterion for the self-consistent calculation of the electronic structure was 1 × 10⁻⁶ Ha. The convergence criteria for the geometry optimization were: the energy difference between the two geometrical optimizations was less than 1.0 × 10⁻⁵ Ha, the force per atom was less than 0.002 Ha/Å and the maximum displacement distance per atom was less than 0.005 Å [28,35,36,37,38].
The molecular models of the two gases were first established and geometrically optimized to obtain the stable SO2 and SOF2 molecular models, as shown in Figure 10a,b. Then, the bulk phase structure of SnS2 was obtained through the Materials Project database, and the SnS2 surface structure model was established on its basis, with top and side views shown in Figure 10c. Finally, the gases were approached to the SnS2 surface structure adsorption sites with different atoms and different angles to construct a variety of initial adsorption structures, and the best adsorption structure models for SO2 and SOF2 gas molecules on the SnS2 surface structure were obtained by comparing the adsorption energy magnitudes after geometric optimization, as shown in Figure 11.
The distribution of frontier molecular orbitals and the corresponding energies of the SnS2 surface structure before and after the adsorption of two SF6 decomposition components were calculated, as shown in Figure 12. It can be seen that after the adsorption of the two SF6 decomposition components on the surface structure of SnS2, the distribution of the frontier orbitals changed significantly. HOMO and LUMO were no longer uniformly distributed, and their energy gaps were reduced to different degrees, as shown by the fact that after the adsorption of SO2 and SOF2, the energy gaps of the SnS2 surface structure were reduced from the original 2.444 eV to 2.409 eV and 2.435 eV, respectively.
In conclusion, the energy gap of the SnS2 surface structure decreased after the adsorption of two SF6 decomposition components, and the smaller the energy gap, the smaller the resistivity of the adsorption system, which verified the reduction in resistance of the gas-sensitive test experiments.
4. Conclusions
The SnS2 gas sensor was prepared for SO2 and SOF2 gases, and the gas-sensitive properties of the target gases were investigated from a macroscopic perspective. Meanwhile, the gas-sensitive adsorption properties were studied from a microscopic perspective based on the first principle. The gas-sensitive mechanism of the interaction between gas-sensitive materials and gases was investigated by combining gas-sensitive experiments and theoretical calculations. The conclusions are as follows:
- (1)
- The best working temperature of the SnS2 sensor for two SF6 decomposition components is 200 °C, and it has high linearity in gas-sensitive performance tests of 10~150 ppm and 10~50 ppm, respectively, with a linear correlation coefficient greater than 0.990.
- (2)
- The sensor is more sensitive to SO2 gas than SOF2 gas at the optimum operating temperature and showed excellent long-term stability in the subsequent 10-day stability test.
- (3)
- The gas-sensitive adsorption model was established, and the distribution of frontier molecular orbitals and the corresponding energies before and after the adsorption of the gas were calculated. The energy gap of the SnS2 surface structure decreased to different degrees after the adsorption of both target gases, which was consistent with the experimental results of the decrease in resistance after the adsorption of SnS2 gas.
Author Contributions
Conceptualization, S.T.; Funding acquisition, S.T.; Investigation, J.Y., J.W. and Y.L.; Methodology, Y.L.; Resources, M.H., S.T. and J.W.; Supervision, S.T.; Validation, C.L. and M.H.; Visualization, C.L. and M.H.; Writing—original draft, C.L. and J.Y.; Writing—review & editing, M.H. and S.T. All authors have read and agreed to the published version of the manuscript.
Funding
This research was funded by [the Key Research and Development Program of Hubei Province, China] grant number [2020BAA022].
Institutional Review Board Statement
Not applicable.
Informed Consent Statement
Not applicable.
Data Availability Statement
Not applicable.
Conflicts of Interest
The authors declare no conflict of interest.
References
- Panchenko, A.N.; Tarasenko, V.F.; Beloplotov, D.V.; Panchenko, N.A.; Lomaev, M.I. Diffuse discharges in SF6 and mixtures of SF6 with H2, formed by nanosecond voltage pulses in non-uniform electric field. High Volt. 2018, 3, 316–322. [Google Scholar] [CrossRef]
- Li, Y.; Zhang, X.; Zhang, J.; Fu, M.; Zhuo, R.; Luo, Y.; Chen, D.; Xiao, S. Experimental study on the partial discharge and AC breakdown properties of C4F7N/CO2 mixture. High Volt. 2019, 4, 12–17. [Google Scholar] [CrossRef]
- Wu, Y.J.; Ding, D.; Wang, Y.; Zhou, C.; Lu, H.; Zhang, X. Defect recognition and condition assessment of epoxy insulators in gas insulated switchgear based on multi-information fusion. Measurement 2022, 190, 10. [Google Scholar] [CrossRef]
- Khan, B.; Saleem, J.; Khan, F.; Faraz, G.; Ahmad, R.; Ur Rehman, N.; Ahmad, Z. Analysis of the dielectric properties of R410A gas as an alternative to SF6 for high-voltage applications. High Volt. 2019, 4, 41–48. [Google Scholar] [CrossRef]
- Wang, Y.; Ding, D.; Zhang, Y.; Yuan, Z.; Tian, S.; Zhang, X. Research on infrared spectrum characteristics and detection technology of environmental-friendly insulating medium C5F10O. Vib. Spectrosc. 2022, 118, 103336. [Google Scholar] [CrossRef]
- Foruzan, E.; Akmal, A.A.S.; Niayesh, K.; Lin, J.; Sharma, D.D. Comparative study on various dielectric barriers and their effect on breakdown voltage. High Volt. 2018, 3, 51–59. [Google Scholar] [CrossRef]
- Zhang, X.X.; Liu, J.C.; Wang, J.; Wang, Z. Detection of SF6 decomposition components by pristine and Cr-doped GaN based on the first-principles theory. Comput. Theor. Chem. 2021, 1205, 113431. [Google Scholar] [CrossRef]
- Zhang, X.; Yao, Q.; Tang, J.; Sun, C.; Wan, L. Current status and development of gas component analysis for SF6 Discharge decomposition. High Voltage Eng. 2008, 04, 664–669+747. (In Chinese) [Google Scholar]
- Zhang, L.; Han, X.; Li, J. Partial discharge detection and analysis of needle-plane defect in SF6 under negative oscillating lightning impulse voltage based on UHF method. IEEE Trans. Dielectr. Electr. Insul. 2017, 24, 296–303. [Google Scholar] [CrossRef]
- Zhang, D.; Li, J.; Hui, D. Coordinated control for voltage regulation of distribution network voltage regulation by distributed energy storage systems. Prot. Control. Mod. Power Syst. 2018, 3, 35–42. [Google Scholar] [CrossRef]
- Tang, J.; Zeng, F.; Zhang, X.; Yao, Q.; He, J.; Hou, X. Correlation analysis between formation process of SF6 decomposed components and partial discharge qualities. IEEE Trans. Dielectr. Electr. Insul. 2013, 20, 864–875. [Google Scholar] [CrossRef]
- Liu, Y.; Zhou, Q.; Mi, H.; Wang, J.; Zeng, W. Gas-sensing mechanism of Cr doped SnP3 monolayer to SF6 partial discharge decomposition components. Appl. Surf. Sci. 2021, 546, 149084. [Google Scholar] [CrossRef]
- Yin, X.; Dong, L.; Wu, H.; Ma, W.; Zhang, L.; Yin, W.; Xiao, L.; Jia, S.; Tittel, F.K. Ppb-level H2S detection for SF6 decomposition based on a fiber-amplified telecommunication diode laser and a background-gas-induced high-Q photoacoustic cell. Appl. Phys. Lett. 2017, 111, 031109. [Google Scholar] [CrossRef] [Green Version]
- Dong, M.; Zhang, C.; Ren, M.; Albarracín, R.; Ye, R. Electrochemical and infrared absorption spectroscopy detection of SF6 decomposition products. Sensors 2017, 17, 2627. [Google Scholar] [CrossRef] [Green Version]
- Cui, H.; Zhang, X.; Zhang, J.; Zhang, Y. Nanomaterials-based gas sensors of SF6 decomposed species for evaluating the operation status of high-voltage insulation devices. High Volt. 2019, 4, 242–258. [Google Scholar] [CrossRef]
- Zhang, D.; Wu, J.; Li, P.; Cao, Y. Room-temperature SO2 gas-sensing properties based on a metal-doped MoS2 nanoflower: An experimental and density functional theory investigation. J. Mater. Chem. A 2017, 5, 20666–20677. [Google Scholar] [CrossRef]
- Cui, H.; Zhang, X.; Zhang, G.; Tang, J. Pd-doped MoS2 monolayer: A promising candidate for DGA in transformer oil based on DFT method. Appl. Surf. Sci. 2019, 470, 1035–1042. [Google Scholar] [CrossRef]
- Zhang, D.Z.; Tong, J.; Xia, B.K. Humidity-sensing properties of chemically reduced graphene oxide/polymer nanocomposite film sensor based on layer-by-layer nano self-assembly. Sens. Actuators B Chem. 2014, 197, 66–72. [Google Scholar] [CrossRef]
- Zhang, D.; Sun, Y.E.; Li, P.; Zhang, Y. Facile Fabrication of MoS2-Modified SnO2 Hybrid Nanocomposite for Ultrasensitive Humidity Sensing. ACS Appl. Mater. 2016, 8, 14142–14149. [Google Scholar] [CrossRef]
- Qin, H.; Feng, C.; Luan, X.; Yang, D. First-principles investigation of adsorption behaviors of small molecules on penta-graphene. Nanoscale Res. Lett. 2018, 13, 264. [Google Scholar] [CrossRef]
- Wang, J.; Zhang, X.; Liu, L.; Wang, Z. Adsorption of SF6 Decomposition Products by the S Vacancy Structure and Edge Structure of SnS2: A Density Functional Theory Study. ACS Omega 2021, 6, 28131–28139. [Google Scholar] [CrossRef] [PubMed]
- Guo, S.; Yang, D.; Zhang, S.; Dong, Q.; Li, B.; Tran, N.; Li, Z.; Xiong, Y.; Zaghloul, M.E. Development of a Cloud-Based Epidermal MoSe2 Device for Hazardous Gas Sensing. Adv. Funct. Mater. 2019, 29, 1900138. [Google Scholar] [CrossRef]
- Kim, Y.H.; Phan, D.T.; Ahn, S.; Nam, K.H.; Park, C.M.; Jeon, K.J. Two-dimensional SnS2 materials as high-performance NO2 sensors with fast response and high sensitivity. Sens. Actuators B Chem. 2018, 255, 616–621. [Google Scholar] [CrossRef]
- Cui, H.; Jia, P.; Peng, X.; Li, P. Adsorption and sensing of CO and C2H2 by S-defected SnS2 monolayer for DGA in transformer oil: A DFT study. Mater. Chem. Phys. 2020, 249, 123006. [Google Scholar] [CrossRef]
- Zhang, X.; Wang, J.; Chen, D.; Liu, L. The adsorption performance of harmful gas on Cu doped WS2: A First-principle study. Mater 2021, 28, 102488. [Google Scholar] [CrossRef]
- Zhang, G.Z.; Wang, Z.T.; Zhang, X.X. Theoretical screening into Ru-doped MoS2 monolayer as a promising gas sensor upon SO2 and SOF2 in SF6 insulation devices. Mol. Phys. 2022, 120, 8. [Google Scholar] [CrossRef]
- Zhang, X.X.; Liu, W.T.; Tang, J.; Xiao, P. Study on PD detection in SF6 using multi-wall carbon nanotube films sensor. IEEE Trans. Dielectr. Electr. Insul. 2010, 17, 833–838. [Google Scholar] [CrossRef]
- Zhang, X.X.; Yu, L.; Hu, W.H.; Hu, W. Experimental Sensing and Density Functional Theory Study of H2S and SOF2 Adsorption on Au-Modified Graphene. Adv. Sci. 2015, 2, 1500101. [Google Scholar] [CrossRef]
- Zhang, X.; Yu, L.; Tie, J.; Dong, X. Gas sensitivity and sensing mechanism studies on Au-doped TiO2 nanotube arrays for detecting SF6 decomposed components. Sensors 2014, 14, 19517–19532. [Google Scholar] [CrossRef] [Green Version]
- Chen, D.; Zhang, X.; Tang, J.; Cui, H.; Pi, S.; Cui, Z. Adsorption of SF6 decomposed products over ZnO(101̅0): Effects of O and Zn vacancies. ACS Omega. 2018, 3, 18739–18752. [Google Scholar] [CrossRef] [Green Version]
- Wang, J.; Zhang, X.; Liu, L.; Wang, Z. Dissolved gas analysis in transformer oil using Ni-Doped GaN monolayer: A DFT study. Superlattices Microstruct. 2021, 159, 107055. [Google Scholar] [CrossRef]
- Liu, W.; Qiu, X.; Song, Y.; Zhang, X.; Tian, S.; Liu, L. Adsorption behaviour of CF4 and COF2 gas on the GaN monolayer doped with Pt catalytic: A first-principles study. Surf. Sci. 2022, 719, 6. [Google Scholar] [CrossRef]
- Wan, Q.; Xu, Y.; Chen, X.; Xiao, H. Exhaled gas detection by a novel Rh-doped CNT biosensor for prediagnosis of lung cancer: A DFT study. Mol. Phys. 2018, 116, 2205–2212. [Google Scholar] [CrossRef]
- Chen, D.; Tang, J.; Zhang, X.; Cui, H.; Li, Y. Sulfur dioxide adsorbed on pristine and Au dimer decorated γ-graphyne: A density functional theory study. Appl. Surf. Sci. 2018, 458, 781–789. [Google Scholar] [CrossRef]
- Cui, H.; Zhang, G.; Zhang, X.; Tang, J. Rh-doped MoSe2 as toxic gas scavenger: A first-principles study. Nanoscale Adv. 2019, 1, 772–780. [Google Scholar] [CrossRef] [PubMed] [Green Version]
- Chen, D.; Zhang, X.; Cui, H.; Tang, J.; Pi, S.; Cui, Z.; Li, Y.; Zhang, Y. High selectivity n-type InSe monolayer toward decomposition products of sulfur hexafluoride: A density functional theory study. Appl. Surf. Sci. 2019, 479, 852–862. [Google Scholar] [CrossRef]
- Cui, H.; Zhang, X.; Li, Y.; Chen, D.; Zhang, Y. First-principles insight into Ni-doped InN monolayer as a noxious gases scavenger. Appl. Surf. Sci. 2019, 494, 859–866. [Google Scholar] [CrossRef]
- Sharma, A.; Khan, M.S.; Husain, M.; Khan, M.S.; Srivastava, A. Sensing of CO and NO on Cu-doped MoS2 monolayer based single electron transistor: A first principles study. IEEE Sens. J. 2018, 18, 2853–2860. [Google Scholar] [CrossRef]
Figure 1.
XRD patterns of nanometer SnS2.
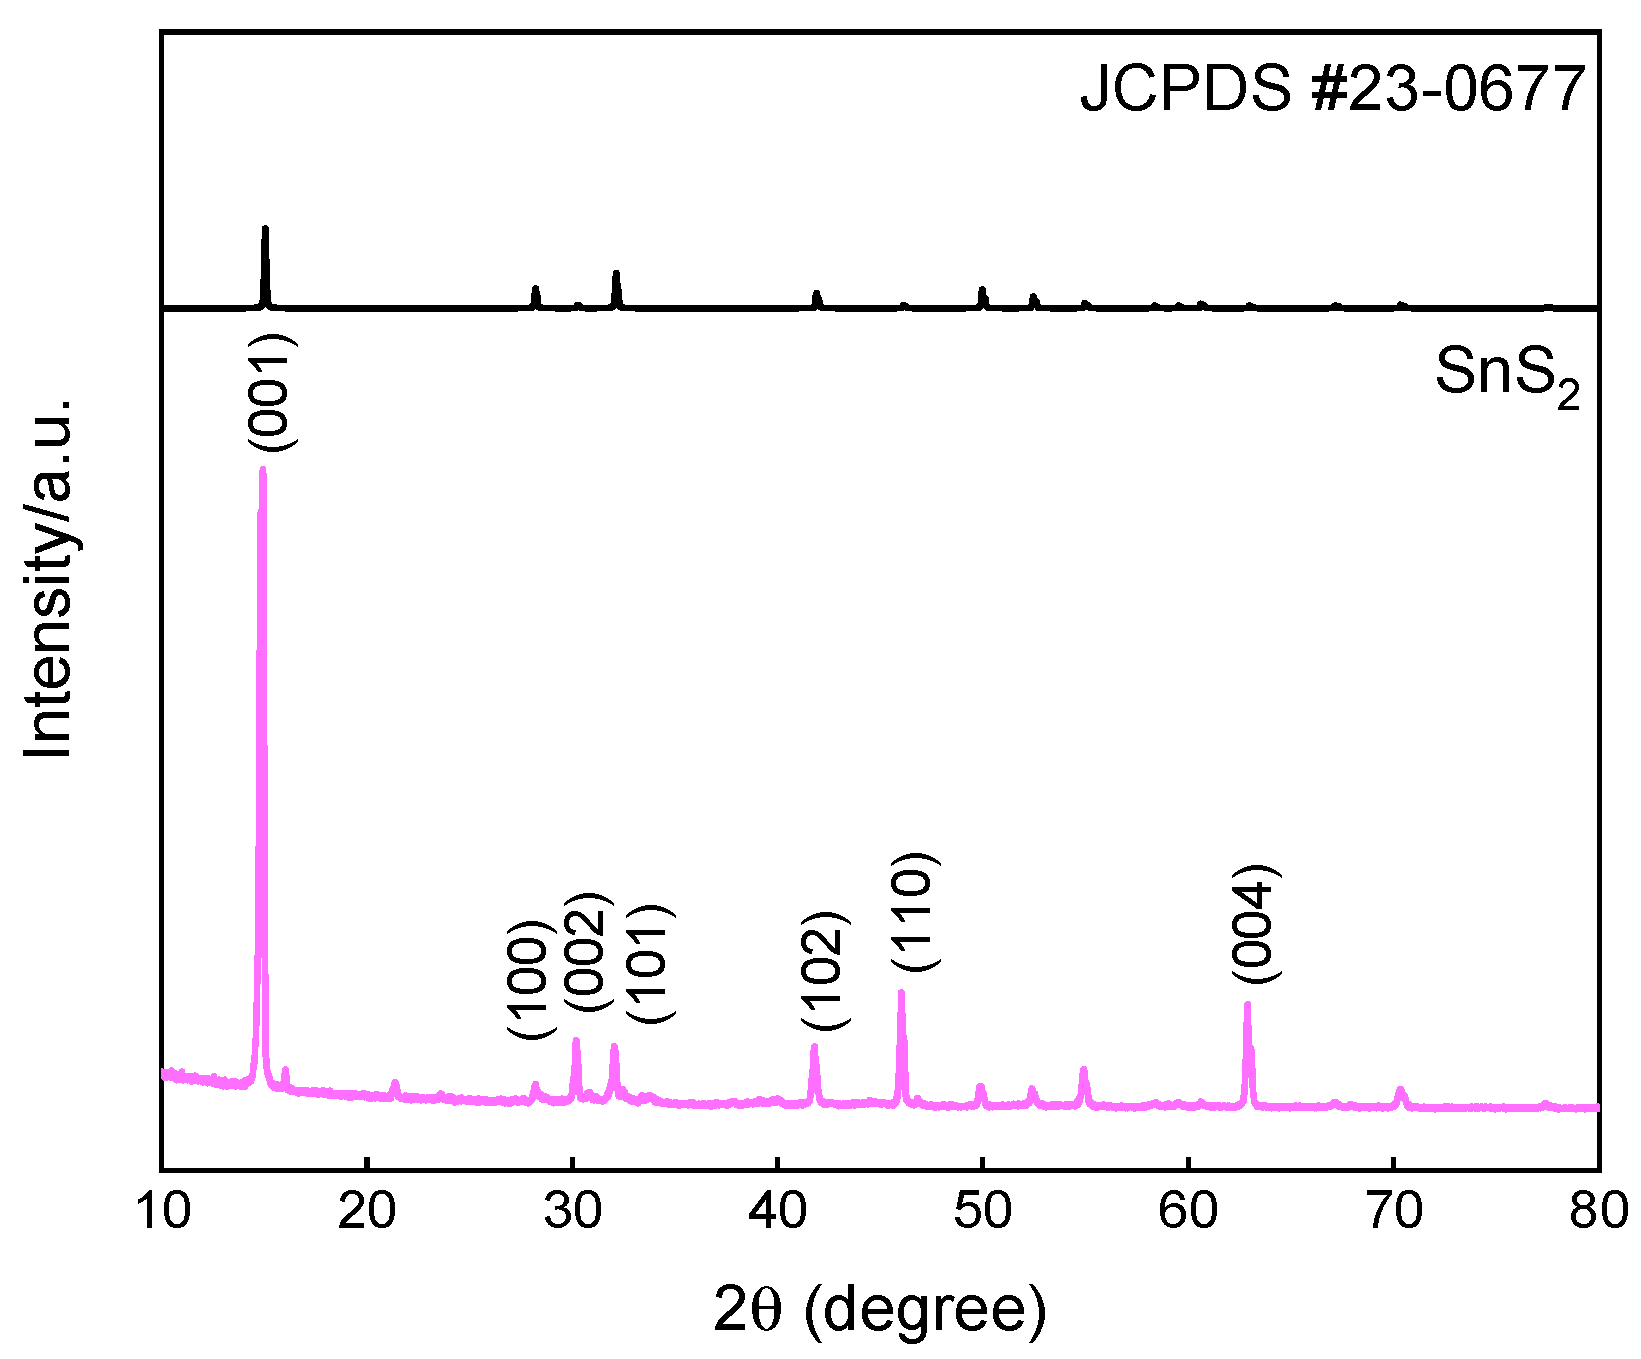
Figure 2.
The characterizations of nanometer SnS2 (a) FESEM (b,c) TEM.
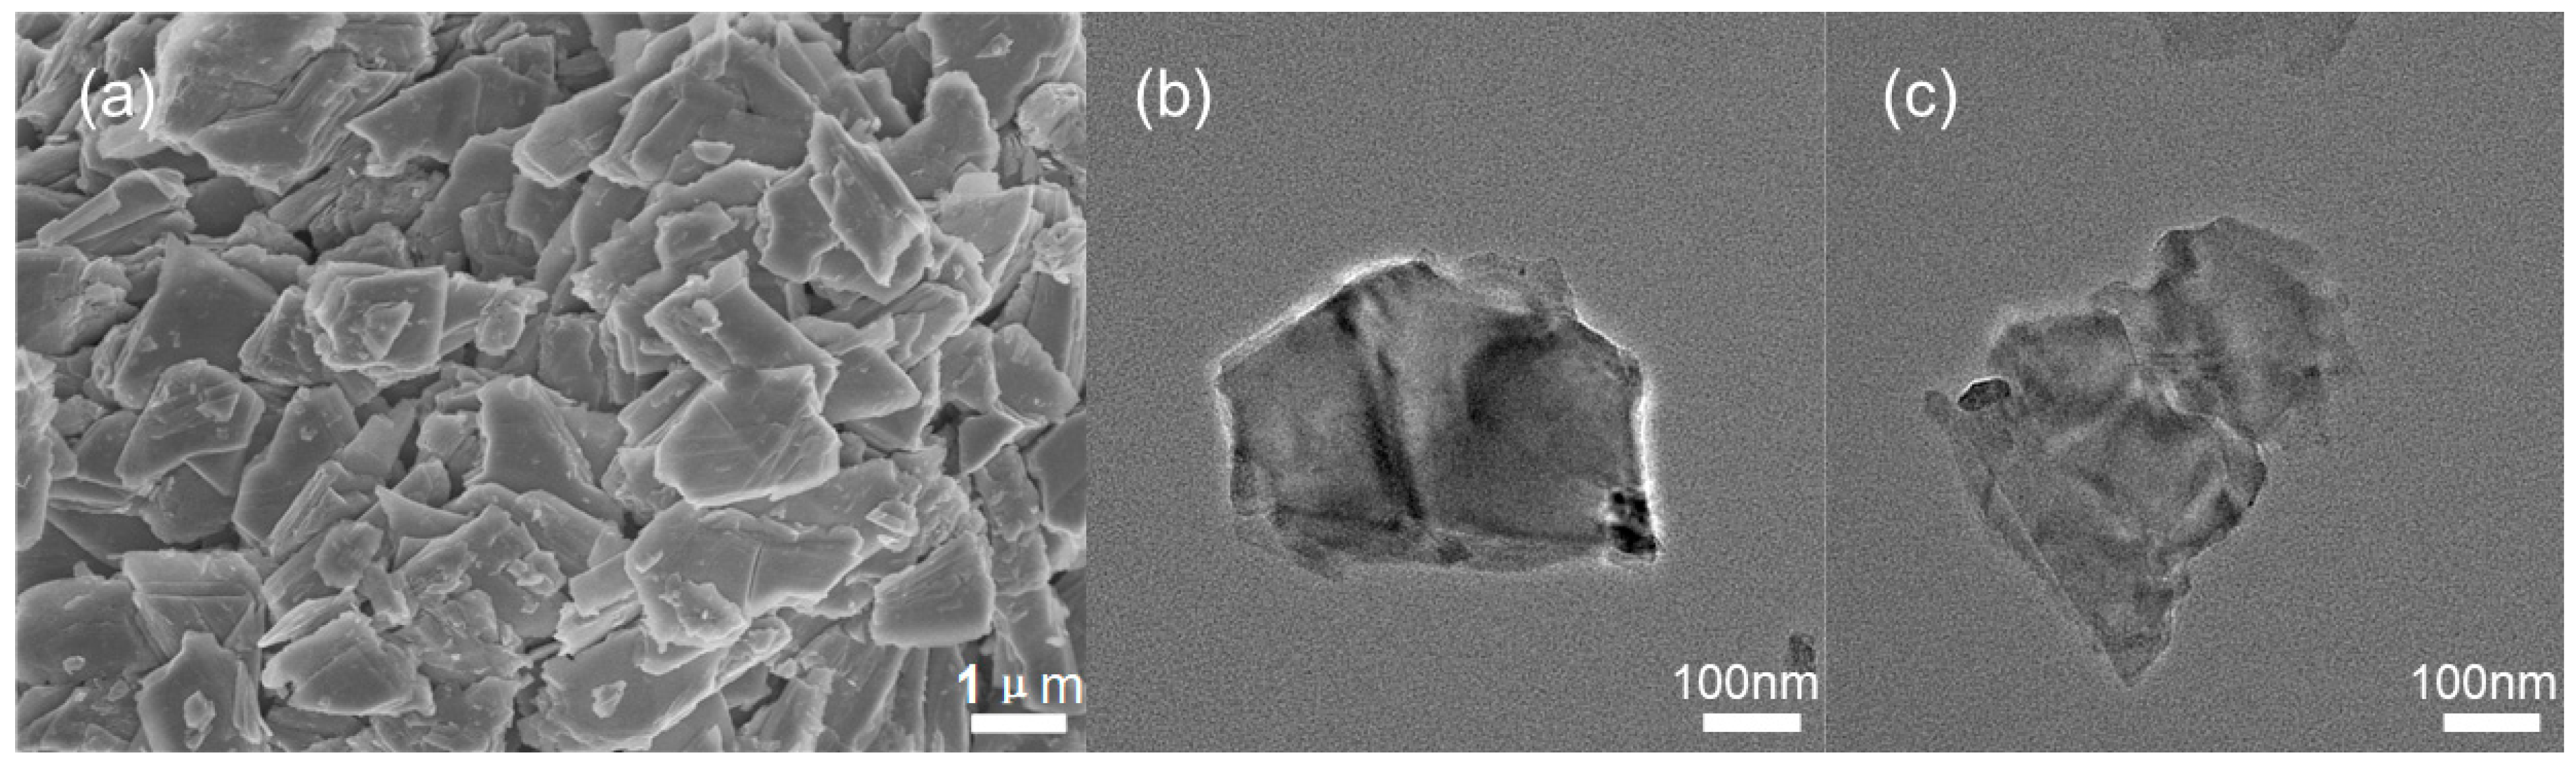
Figure 3.
XPS characterization of nano-SnS2; (a) full-spectrum scan results of nano-SnS2; (b) Sn element spectrum; (c) S element spectrum.
Figure 3.
XPS characterization of nano-SnS2; (a) full-spectrum scan results of nano-SnS2; (b) Sn element spectrum; (c) S element spectrum.

Figure 4.
Temperature response characteristics of sensor to two SF6 decomposition components: (a) 150 ppm SO2; (b) 50 ppm SOF2.
Figure 4.
Temperature response characteristics of sensor to two SF6 decomposition components: (a) 150 ppm SO2; (b) 50 ppm SOF2.

Figure 5.
Recovery characteristics of the sensor to two SF6 decomposition components: (a) 150 ppm SO2; (b) 50 ppm SOF2.
Figure 5.
Recovery characteristics of the sensor to two SF6 decomposition components: (a) 150 ppm SO2; (b) 50 ppm SOF2.

Figure 6.
Concentration–response characteristics of the sensor to SF6 decomposition components. (a) SO2; (b) SOF2.
Figure 6.
Concentration–response characteristics of the sensor to SF6 decomposition components. (a) SO2; (b) SOF2.

Figure 7.
Response–concentration relationship of the sensor to SF6 decomposition components: (a) 150 SO2; (b) 50 SOF2.
Figure 7.
Response–concentration relationship of the sensor to SF6 decomposition components: (a) 150 SO2; (b) 50 SOF2.
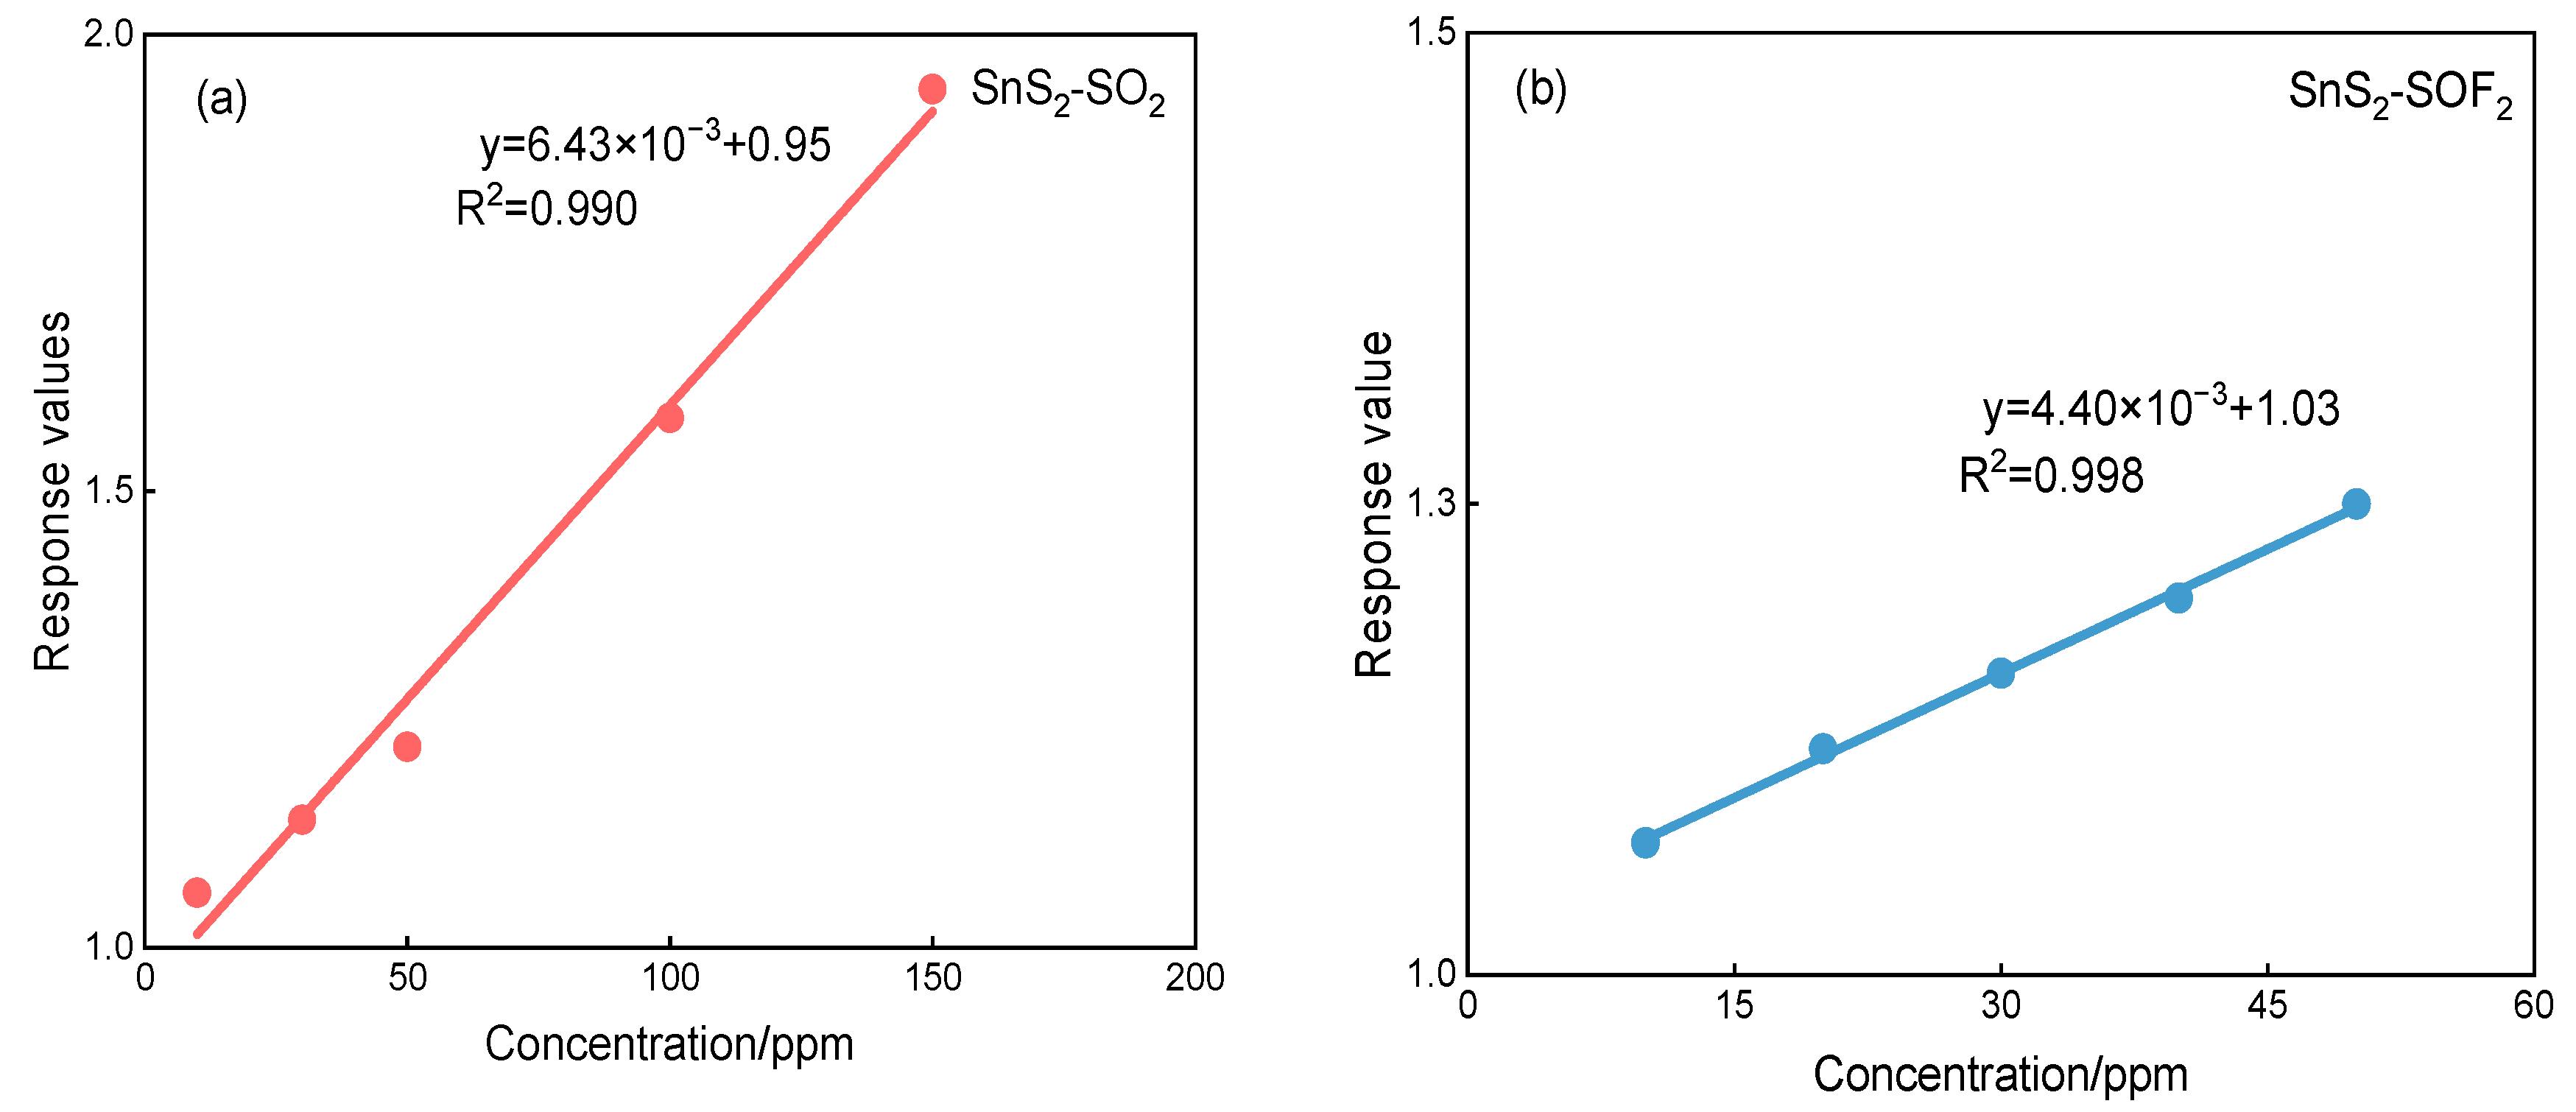
Figure 8.
The response curve of the SnS2 sensor to SF6.

Figure 9.
Long-term stability of SnS2 gas sensor.

Figure 10.
Structural model. (a) SO2 molecular structure; (b) SOF2 molecular structure; (c) SnS2 surface structure.
Figure 10.
Structural model. (a) SO2 molecular structure; (b) SOF2 molecular structure; (c) SnS2 surface structure.
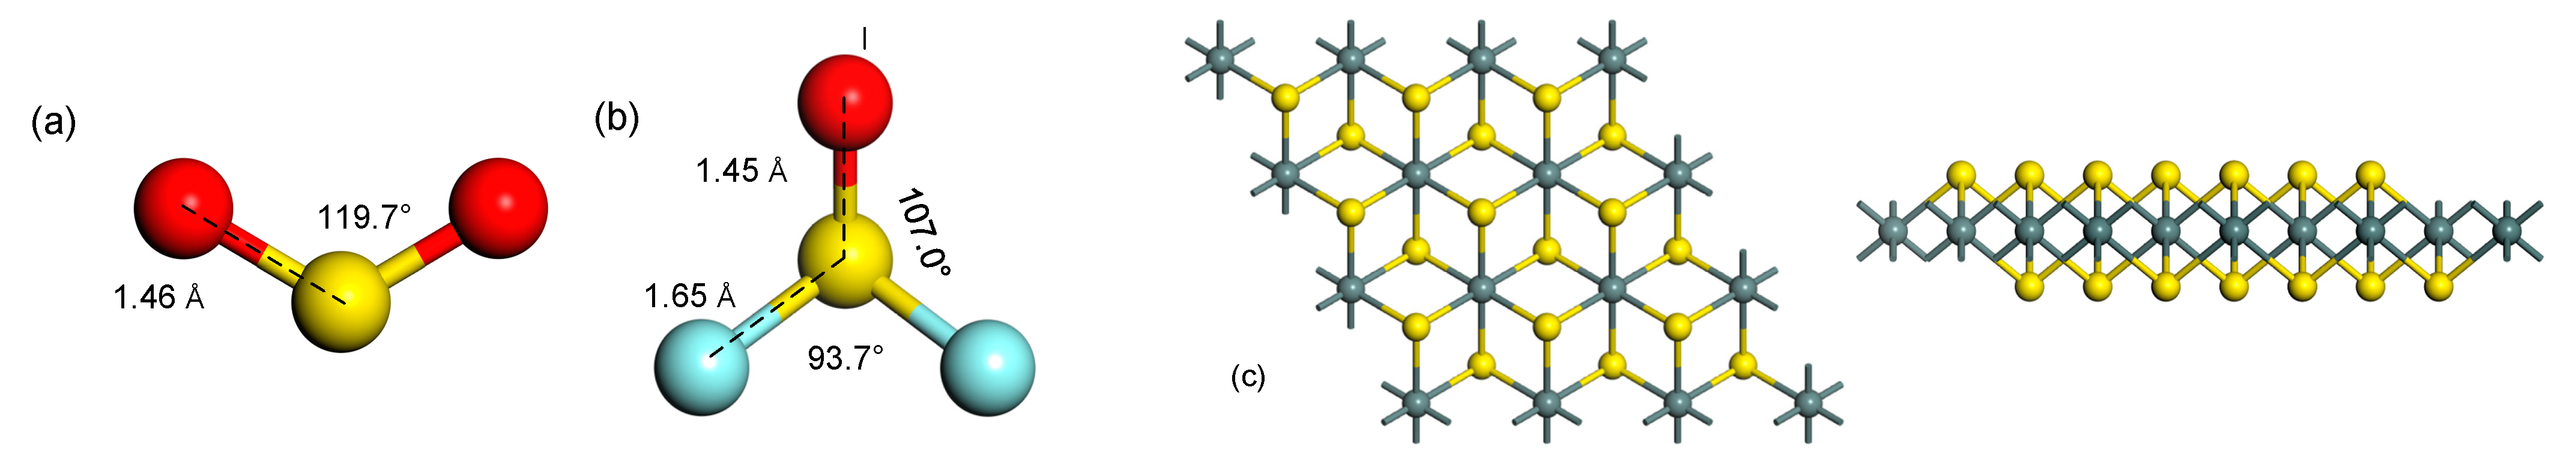
Figure 11.
The most stable adsorption structure of the two gases on the SnS2 surface structure. (a) SO2 adsorption system; (b) SOF2 adsorption system.
Figure 11.
The most stable adsorption structure of the two gases on the SnS2 surface structure. (a) SO2 adsorption system; (b) SOF2 adsorption system.
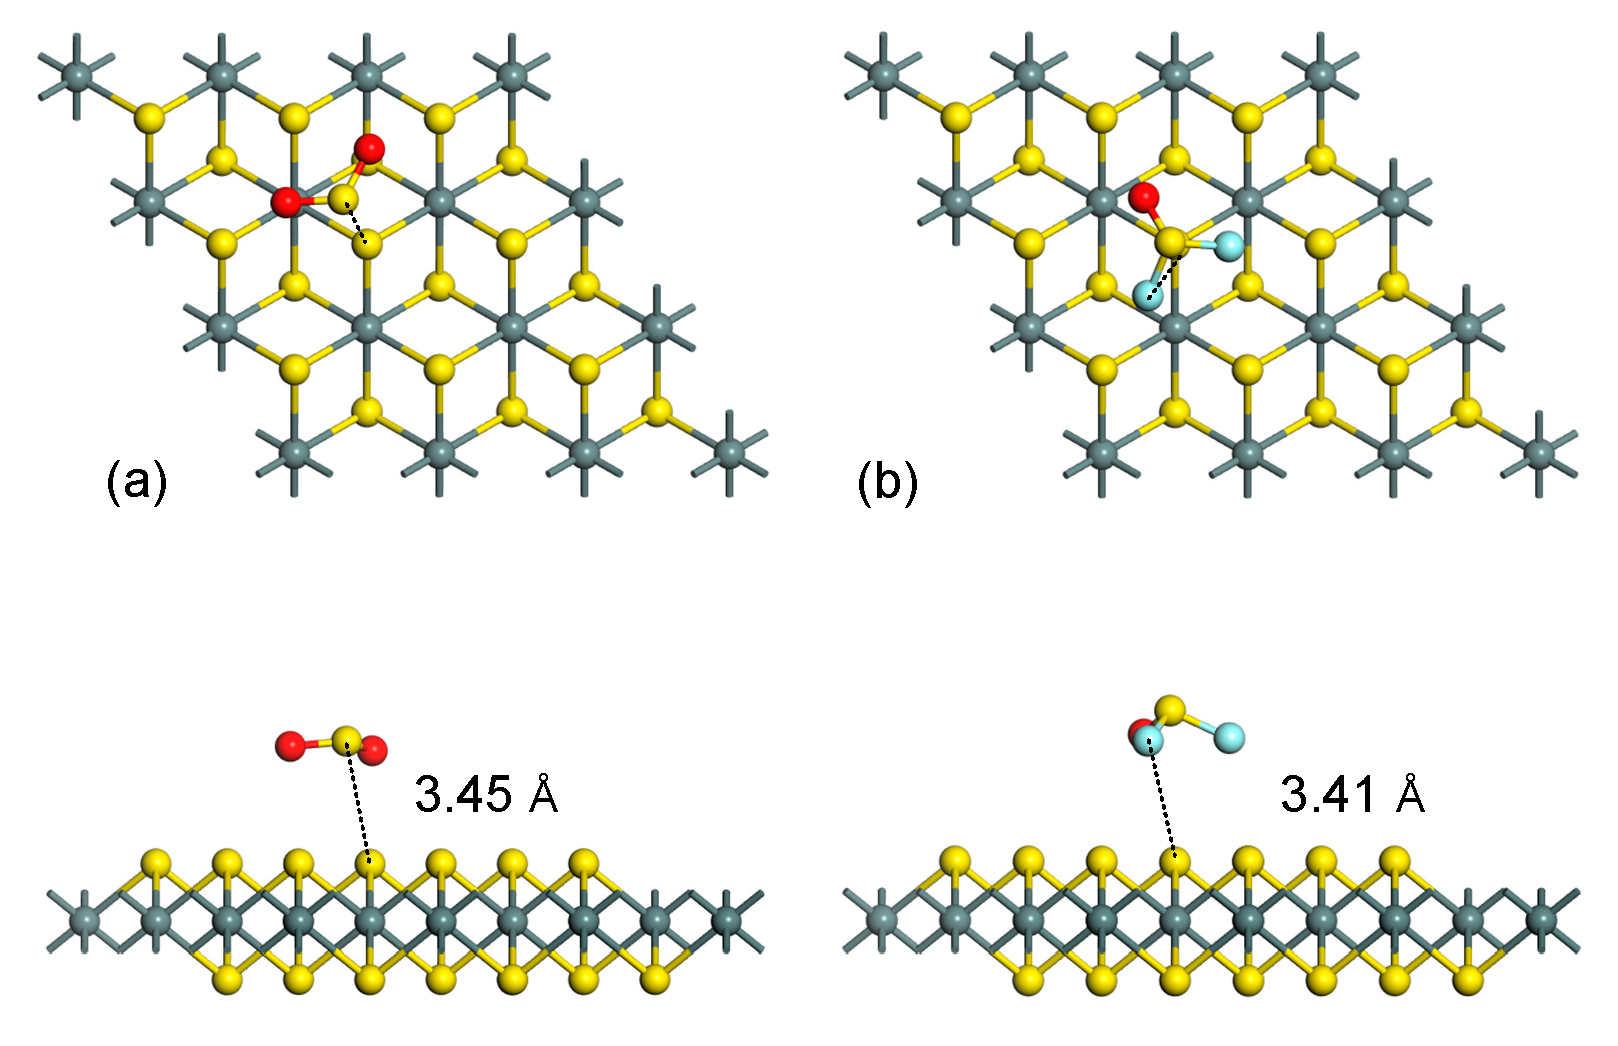
Figure 12.
Frontier molecular orbital distribution. (a) SnS2 surface structure; (b) the surface structure of SnS2 adsorbed SO2; (c) the surface structure of SnS2 adsorbed SOF2.
Figure 12.
Frontier molecular orbital distribution. (a) SnS2 surface structure; (b) the surface structure of SnS2 adsorbed SO2; (c) the surface structure of SnS2 adsorbed SOF2.

Table 1.
Comparison of recent pristine sensing materials of detecting SF6 decompositions.
| Gas-Sensitive Materials | Test Components | Response | Operating Temperature | Response Recovery Time | Background Gases |
|---|---|---|---|---|---|
| Carbon Nanotubes [27] | SOF2 | −1.6% (20 ppm) | room temperature | ~1000 s/– | He |
| Graphene [28] | SOF2 | −0.4% (50 ppm) | room temperature | ~160 s/– | N2 |
| TiO2 Nanotubes [29] | SO2 | −75% (50 ppm) | 180℃ | ~500 s/– | N2 |
| SOF2 | −8% (50 ppm) | 200℃ | –/– | N2 | |
| SnS2 | SO2 | 1.22 (50 ppm) | 200℃ | 60 s/40 s | He |
| SOF2 | 1.12 (20 ppm) | 200℃ | 60 s/40 s | He |
Publisher’s Note: MDPI stays neutral with regard to jurisdictional claims in published maps and institutional affiliations. |
© 2022 by the authors. Licensee MDPI, Basel, Switzerland. This article is an open access article distributed under the terms and conditions of the Creative Commons Attribution (CC BY) license (https://creativecommons.org/licenses/by/4.0/).
Share and Cite
MDPI and ACS Style
Li, C.; He, M.; Tian, S.; Yuan, J.; Wang, J.; Li, Y. Study on the Detection Characteristics and Response Mechanism of SnS2-Based Sensors for SO2 and SOF2. Chemosensors 2022, 10, 526. https://doi.org/10.3390/chemosensors10120526
AMA Style
Li C, He M, Tian S, Yuan J, Wang J, Li Y. Study on the Detection Characteristics and Response Mechanism of SnS2-Based Sensors for SO2 and SOF2. Chemosensors. 2022; 10(12):526. https://doi.org/10.3390/chemosensors10120526
Chicago/Turabian StyleLi, Chengjun, Mengyang He, Shuangshuang Tian, Jiawei Yuan, Jincong Wang, and Yi Li. 2022. "Study on the Detection Characteristics and Response Mechanism of SnS2-Based Sensors for SO2 and SOF2" Chemosensors 10, no. 12: 526. https://doi.org/10.3390/chemosensors10120526
Note that from the first issue of 2016, this journal uses article numbers instead of page numbers. See further details here.