Network Analysis of a Membrane-Enriched Brain Proteome across Stages of Alzheimer’s Disease

 , , and
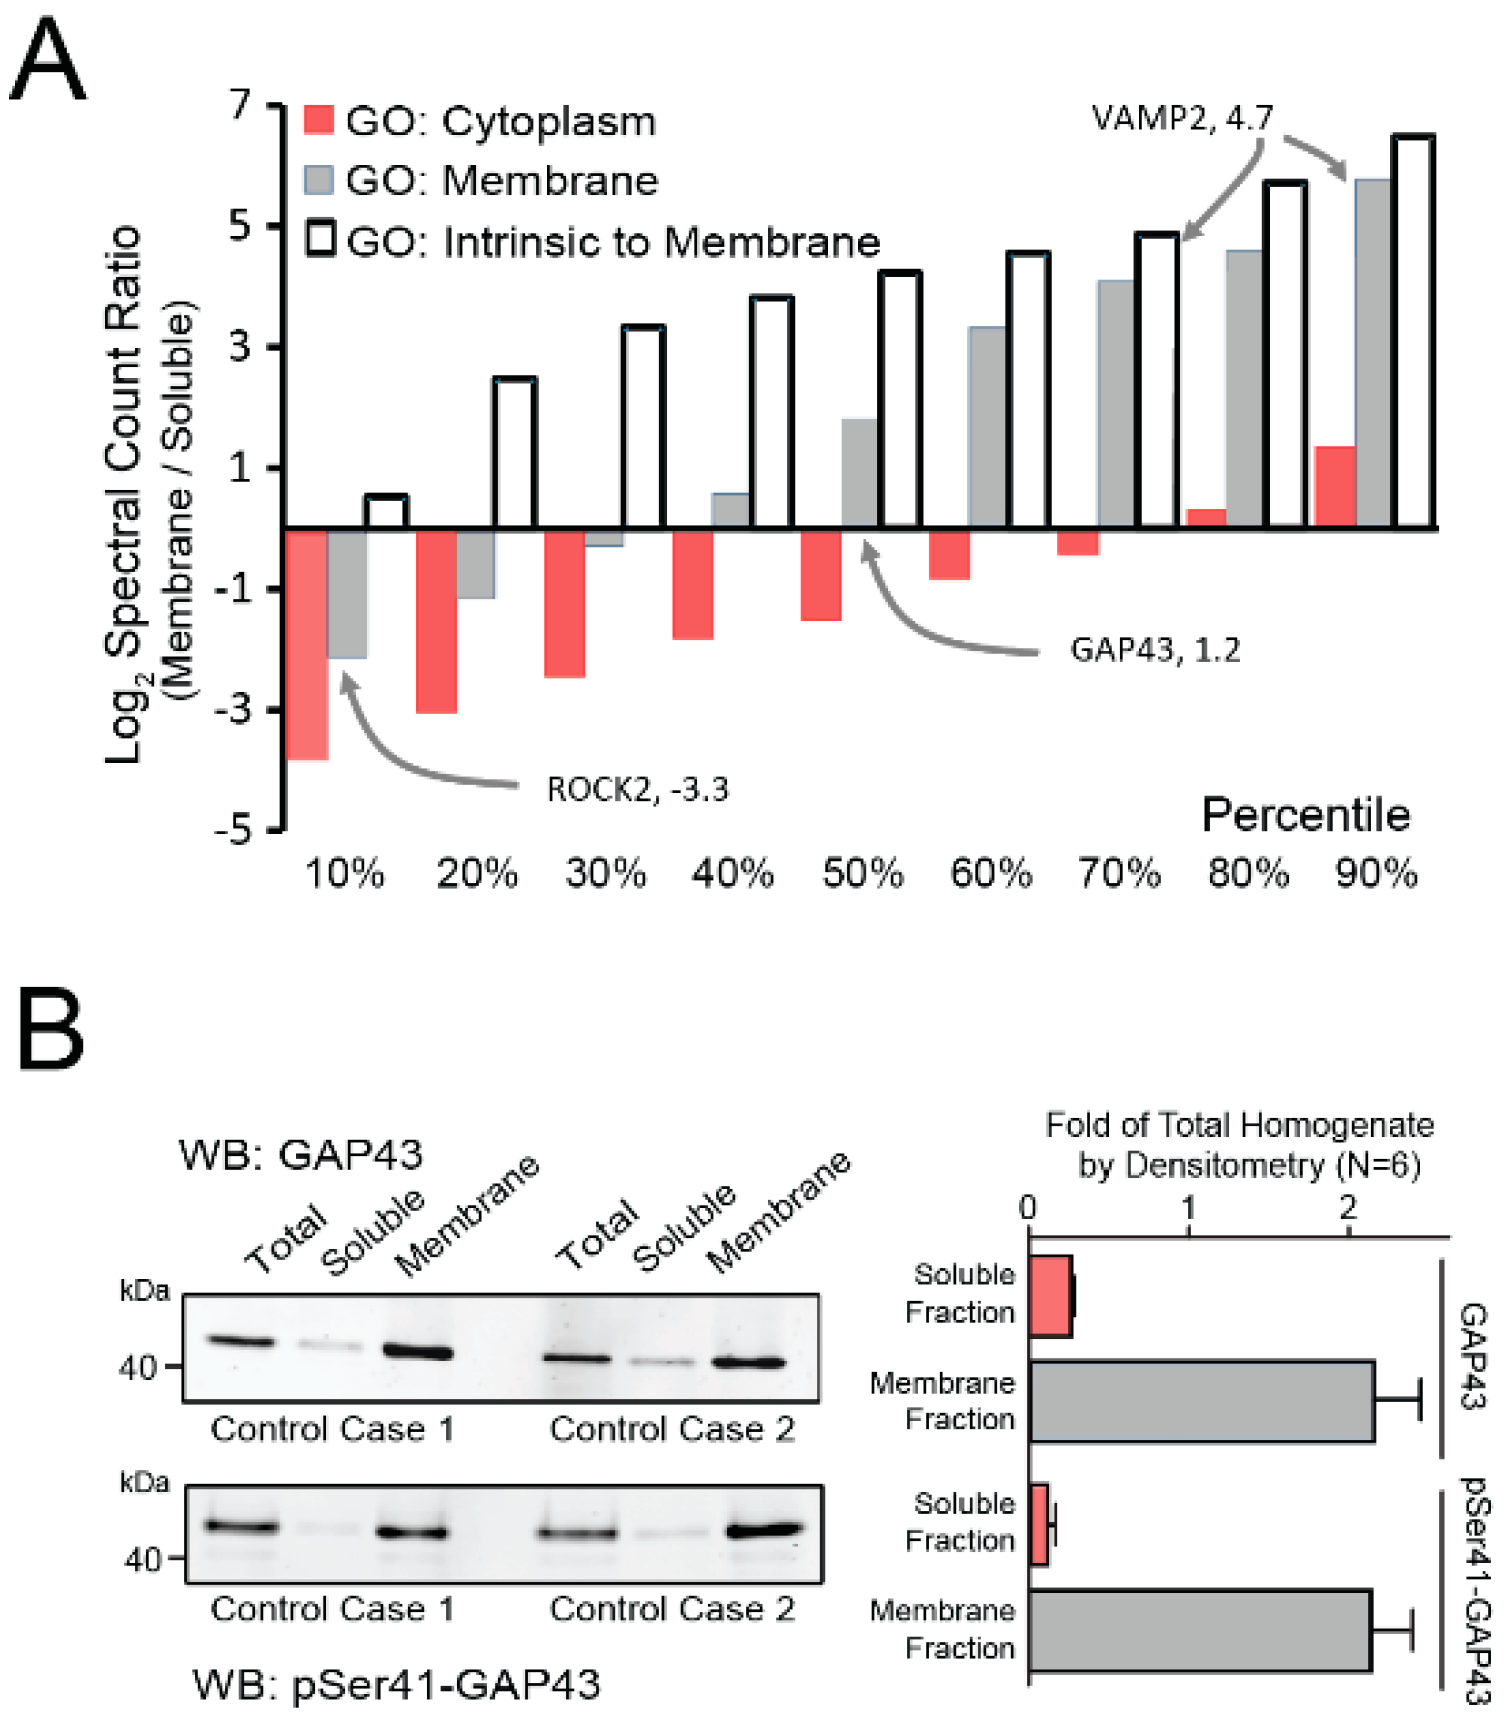
Abstract
1. Introduction
2. Materials and Methods
2.1. Case Selection
2.2. Membrane Enrichment
2.3. Mass Spectrometry Based Proteomics
2.4. Differential Expression
2.5. Weighted Protein Correlation Network Analysis (WPCNA)
2.6. Cell Type Enrichment
2.7. Gene Ontology (GO) Enrichment
2.8. Immunoblotting
2.9. Over-Representation Analysis for Unfractionated and Membrane Protein Networks
2.10. Data and Software Availability
3. Results
3.1. Brain Fractionation Demonstrates Membrane Protein Enrichment
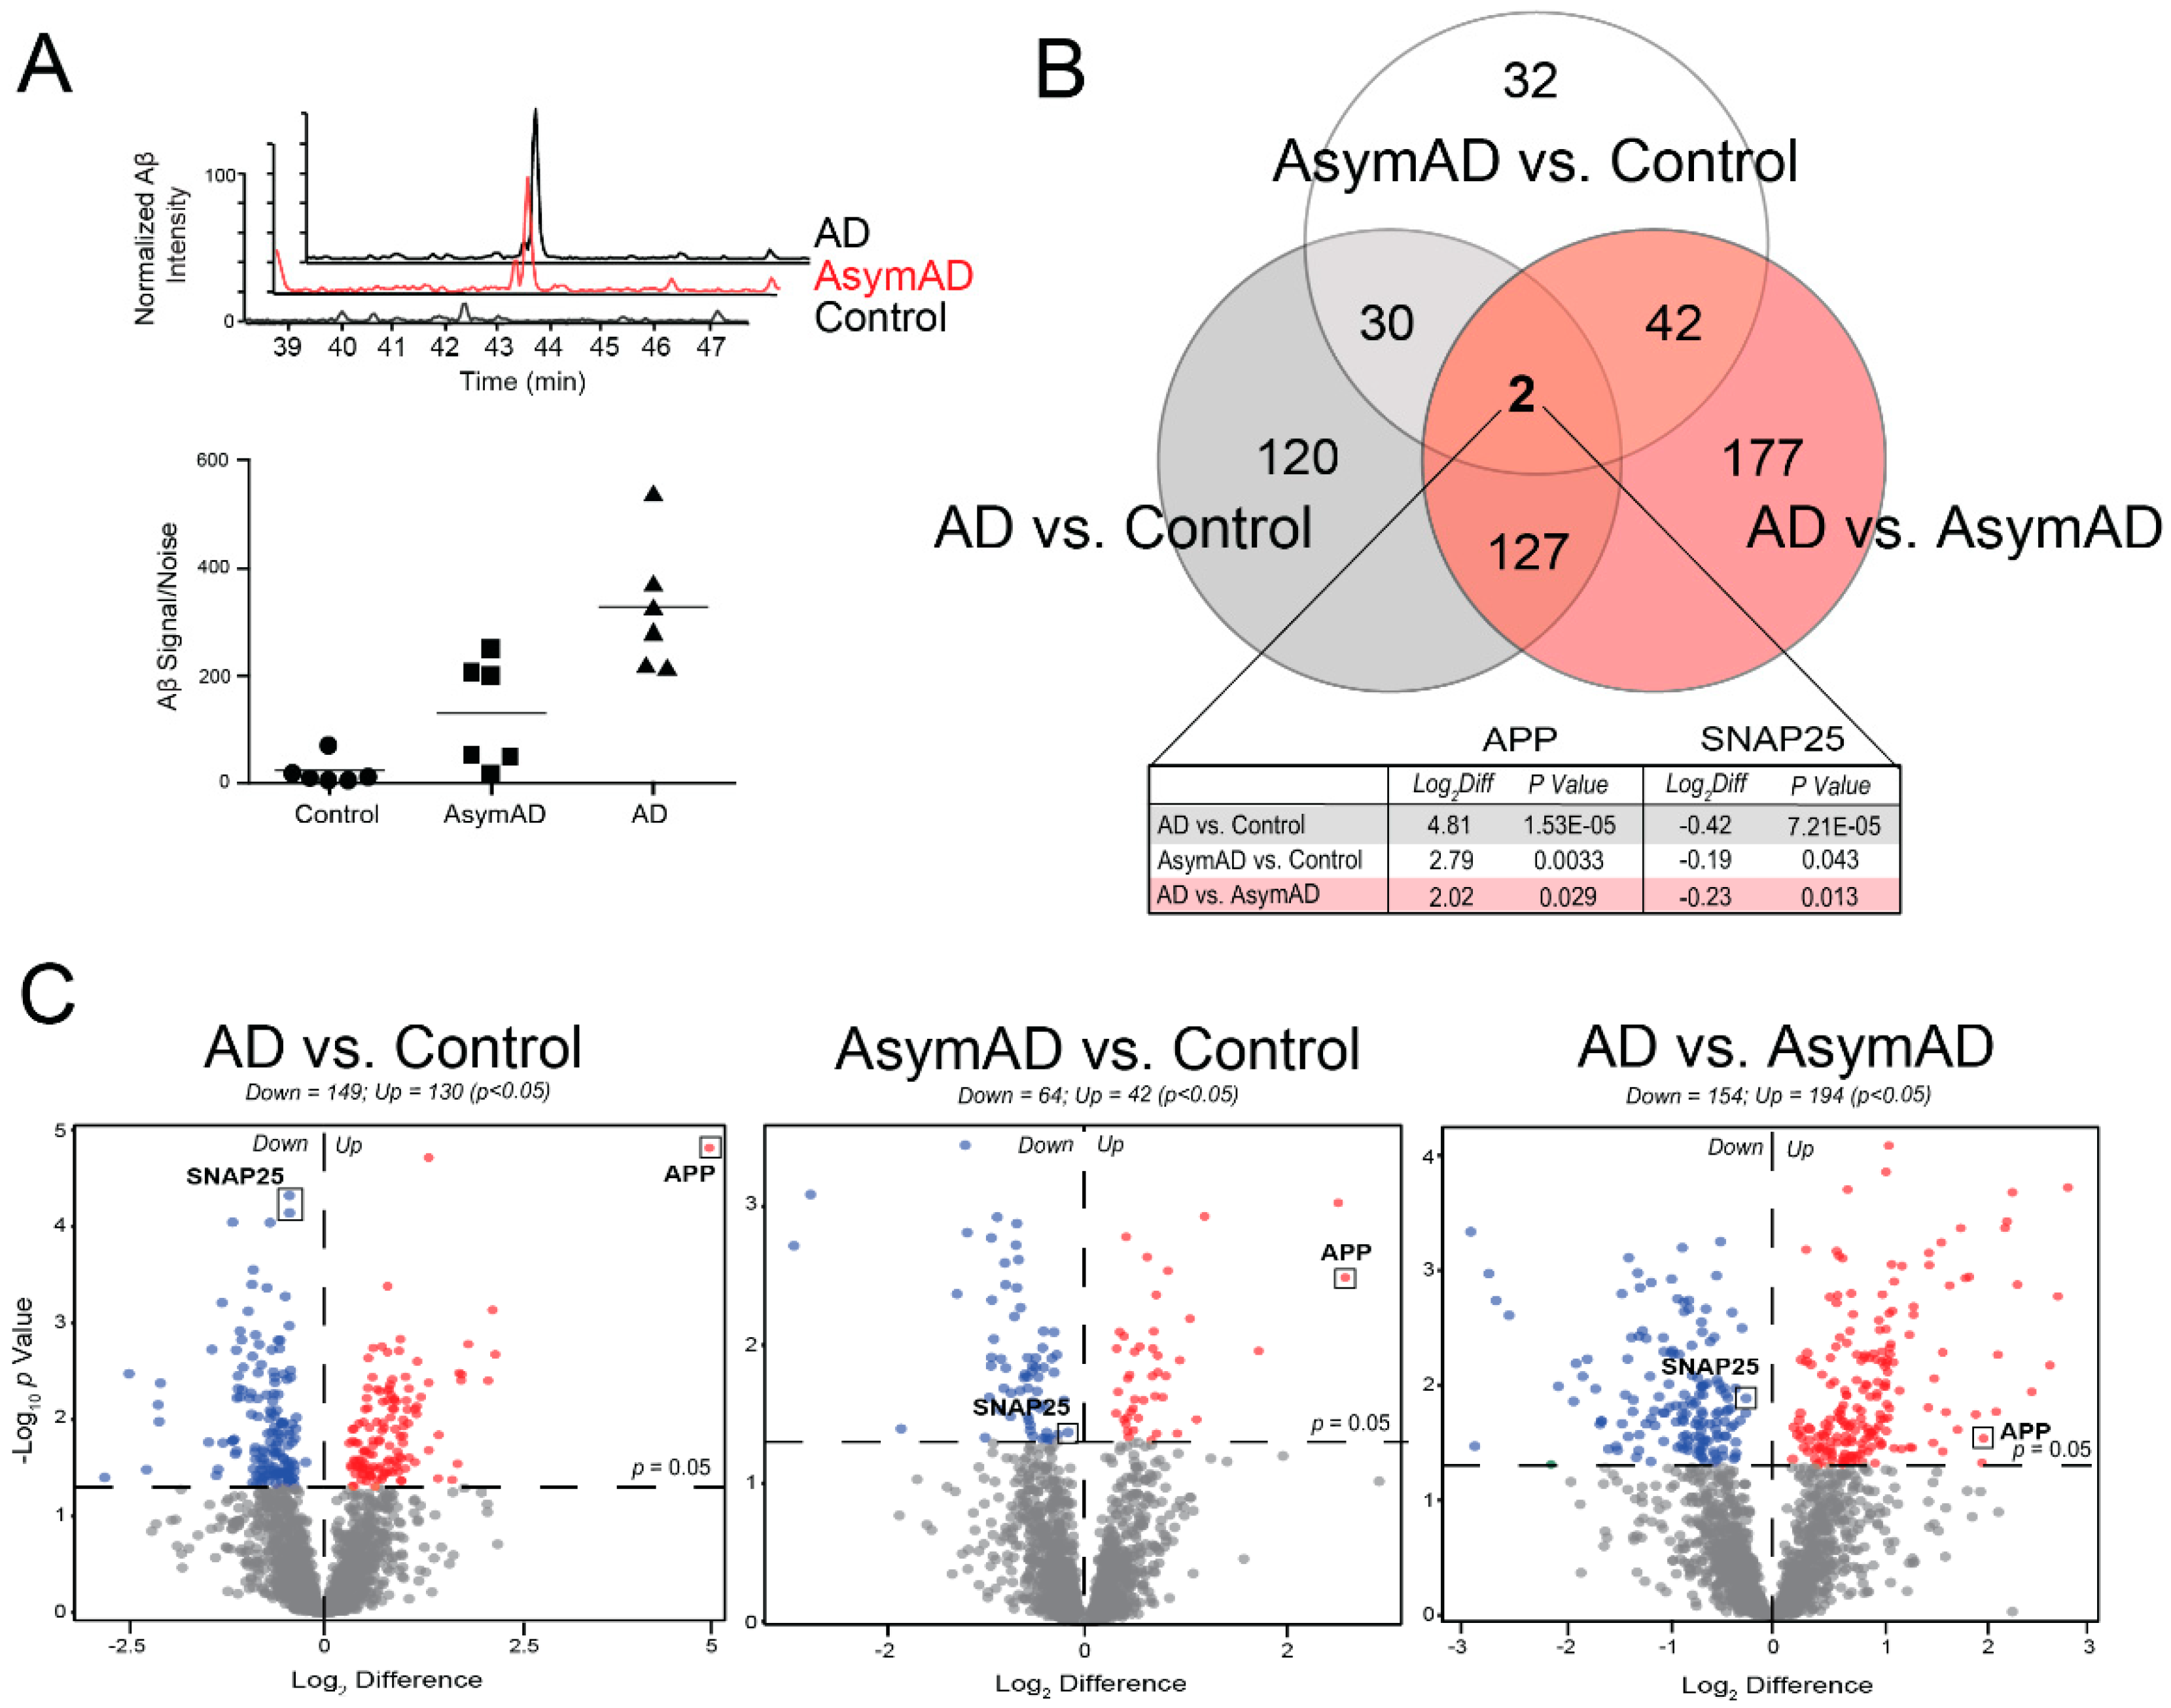
3.2. Proteomic Analysis Reveals Differential Protein Abundance Across Alzheimer’s Disease Stages
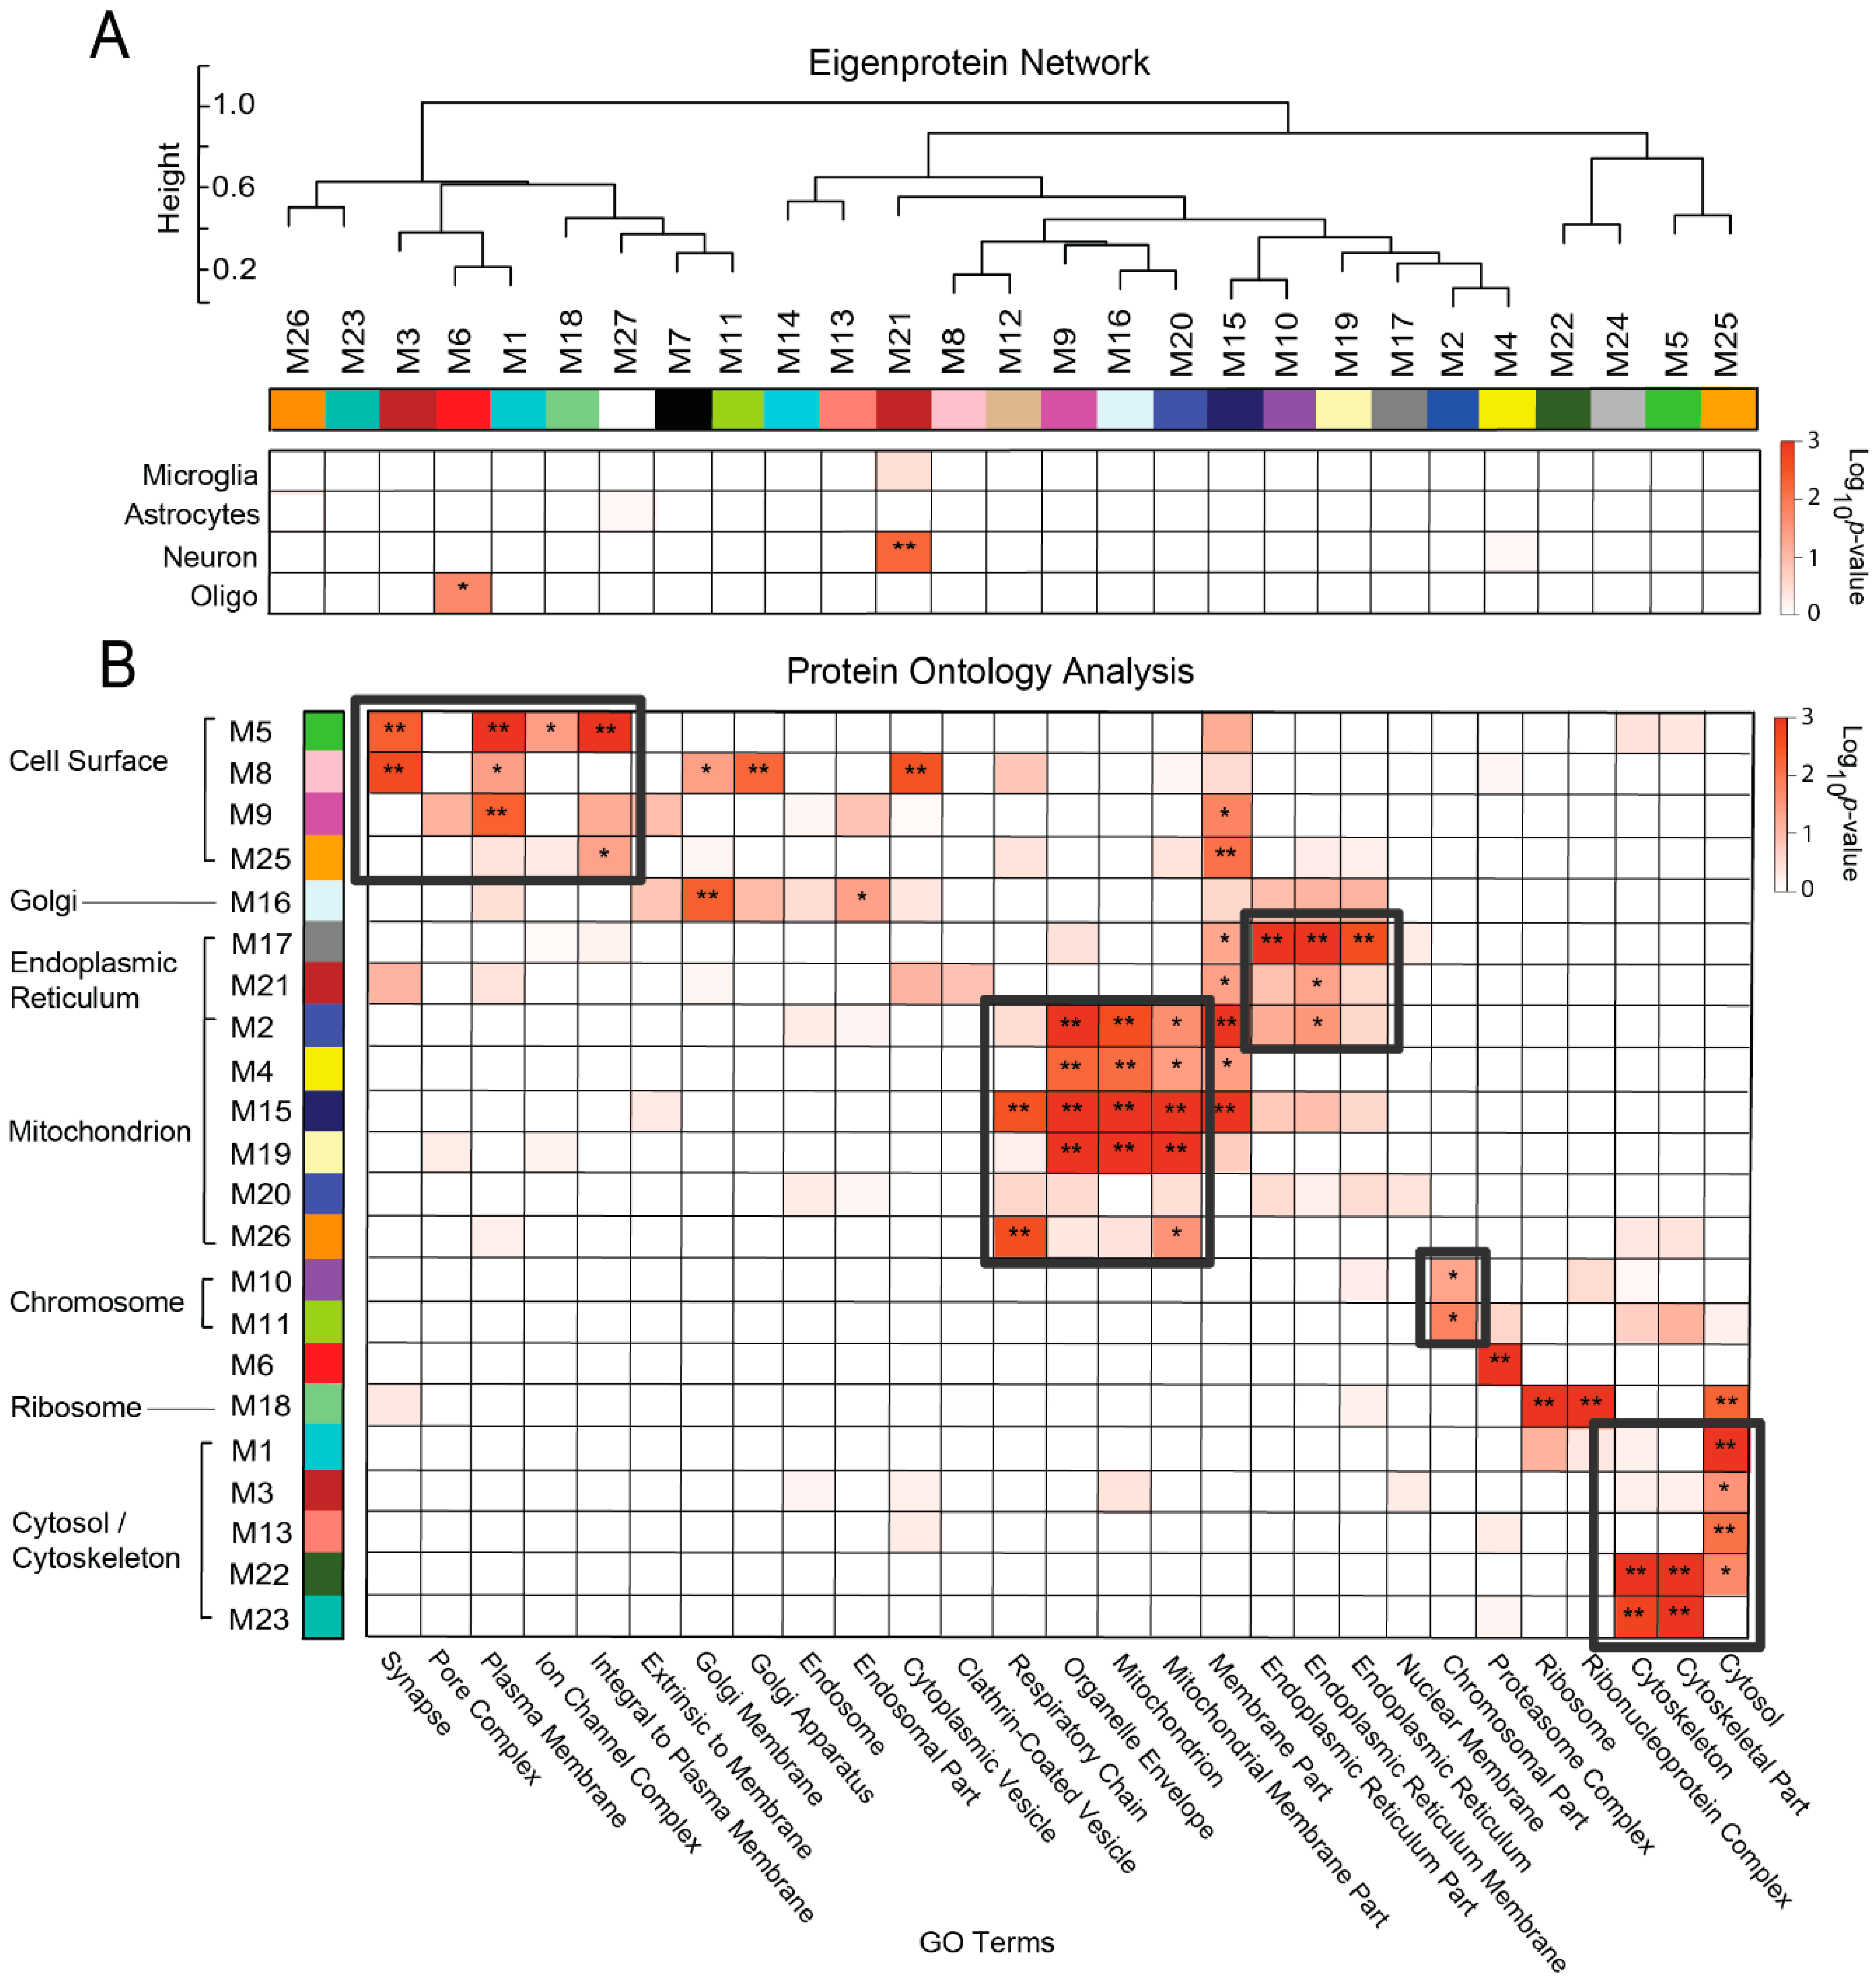
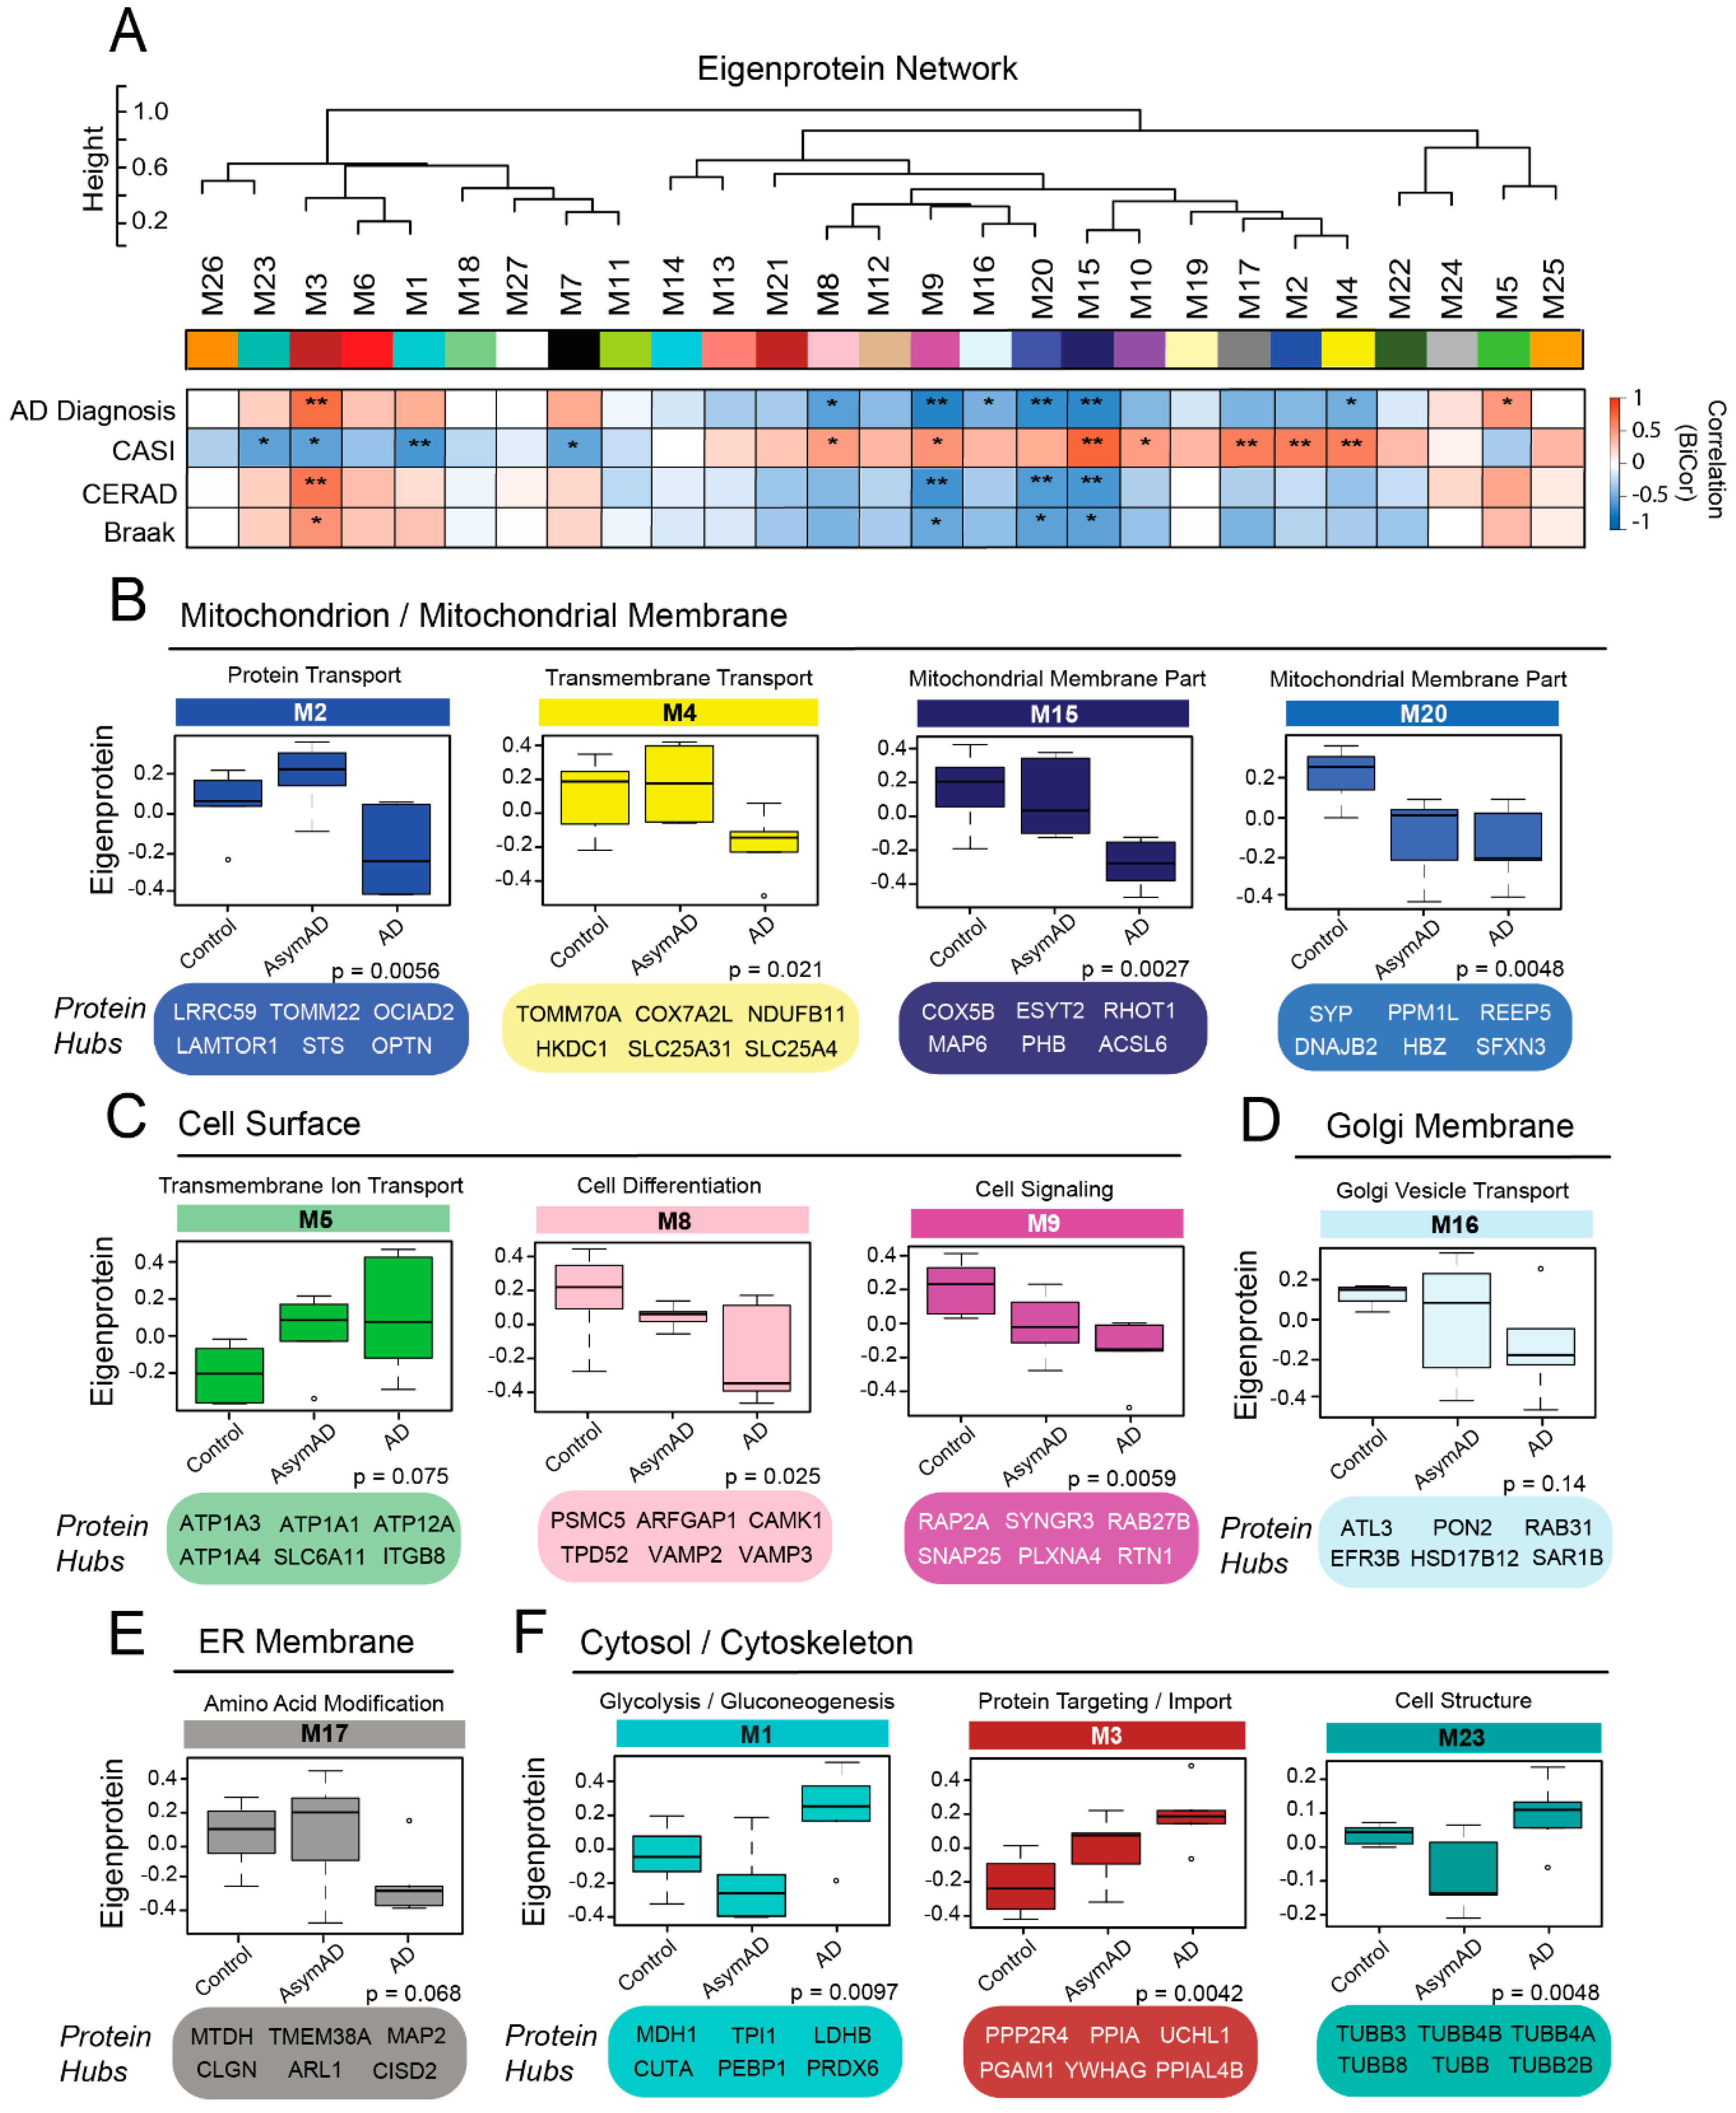
3.3. Protein Co-Expression Network Analysis Yields Modules Organized by Membrane-Associated Cellular Compartments
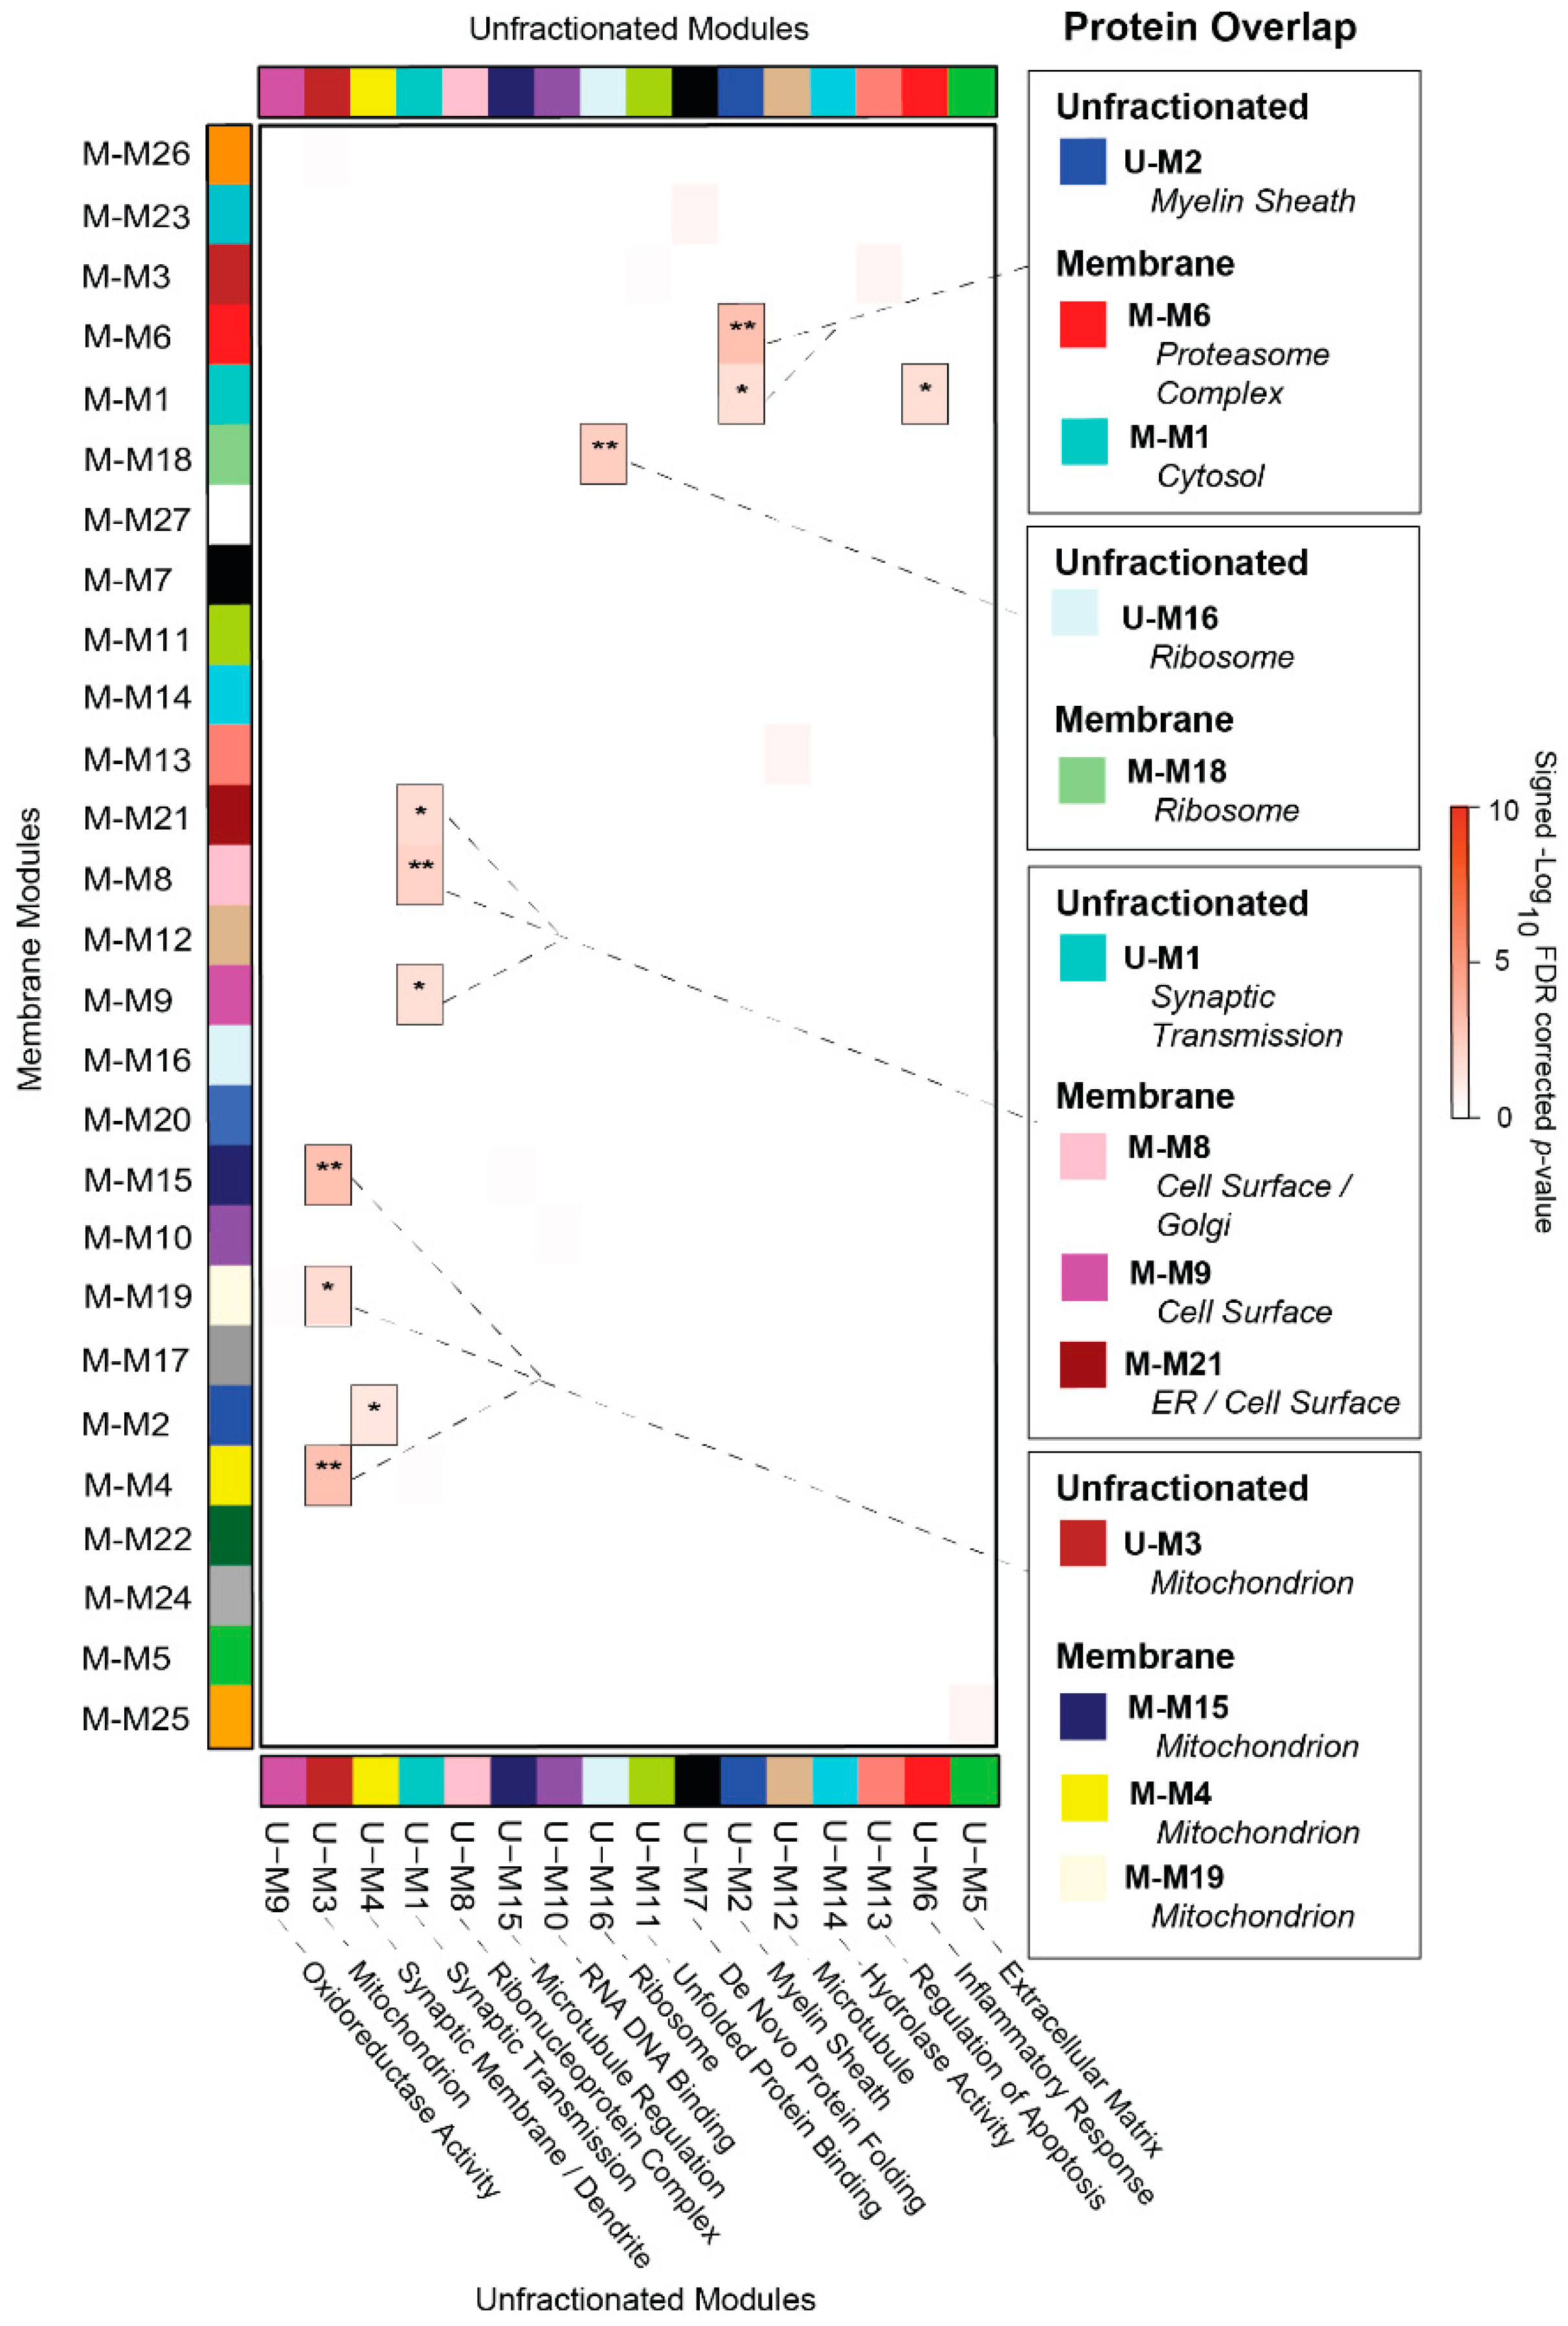
3.4. Overlap Analysis Demonstrates Differences in Module Composition between Unfractionated and Membrane-Associated AD Networks
3.5. Membrane-Derived Modules Demonstrate Links to Clinical and Pathological Phenotypes of Alzheimer’s Disease
4. Discussion
Supplementary Materials
Author Contributions
Funding
Conflicts of Interest
References
- Querfurth, H.W.; LaFerla, F.M. Alzheimer’s Disease. N. Engl. J. Med. 2010, 362, 329–344. [Google Scholar] [CrossRef] [PubMed]
- Sperling, R.A.; Aisen, P.S.; Beckett, L.A.; Bennett, D.A.; Craft, S.; Fagan, A.M.; Iwatsubo, T.; Jack, C.R.; Kaye, J.; Montine, T.J.; et al. Toward defining the preclinical stages of Alzheimer’s disease: Recommendations from the National Institute on Aging-Alzheimer’s Association workgroups on diagnostic guidelines for Alzheimer’s disease. Alzheimers Dement. 2011, 7, 280–292. [Google Scholar] [CrossRef] [PubMed]
- Bennett, D.A.; Schneider, J.A.; Arvanitakis, Z.; Kelly, J.F.; Aggarwal, N.T.; Shah, R.C.; Wilson, R.S. Neuropathology of older persons without cognitive impairment from two community-based studies. Neurology 2006, 66, 1837–1844. [Google Scholar] [CrossRef] [PubMed]
- Troncoso, J.C.; Cataldo, A.M.; Nixon, R.A.; Barnett, J.L.; Lee, M.K.; Checler, F.; Fowler, D.R.; Smialek, J.E.; Crain, B.; Martin, L.J.; et al. Neuropathology of preclinical and clinical lateonset Alzheimer’s disease. Ann. Neurol. 1998, 43, 673–676. [Google Scholar] [CrossRef] [PubMed]
- Driscoll, I.; Troncoso, J. Asymptomatic Alzheimer’s disease: A prodrome or a state of resilience? Curr. Alzheimer Res. 2011, 8, 330–335. [Google Scholar] [CrossRef] [PubMed]
- Nelson, P.T.; Alafuzoff, I.; Bigio, E.H.; Bouras, C.; Braak, H.; Cairns, N.J.; Castellani, R.J.; Crain, B.J.; Davies, P.; Del Tredici, K.; et al. Correlation of Alzheimer Disease Neuropathologic Changes with Cognitive Status: A Review of the Literature. J. Neuropathol. Exp. Neurol. 2012, 71, 362–381. [Google Scholar] [CrossRef] [PubMed]
- Miller, J.A.; Oldham, M.C.; Geschwind, D.H. A Systems Level Analysis of Transcriptional Changes in Alzheimer’s Disease and Normal Aging. J. Neurosci. 2008, 28, 1410–1420. [Google Scholar] [CrossRef]
- Coppola, G. The OMICs: Applications in Neuroscience; Oxford University Press: Oxford, UK; New York, NY, USA, 2014. [Google Scholar]
- Seyfried, N.T.; Dammer, E.B.; Swarup, V.; Nandakumar, D.; Duong, D.M.; Yin, L.; Deng, Q.; Nguyen, T.; Hales, C.M.; Wingo, T.; et al. A Multi-network Approach Identifies Protein-Specific Co-expression in Asymptomatic and Symptomatic Alzheimer’s Disease. Cell Syst. 2017, 4, 60–72. [Google Scholar] [CrossRef]
- Johnson, E.C.B.; Dammer, E.B.; Duong, D.M.; Yin, L.; Thambisetty, M.; Troncoso, J.C.; Lah, J.J.; Levey, A.I.; Seyfried, N.T. Deep proteomic network analysis of Alzheimer’s disease brain reveals alterations in RNA binding proteins and RNA splicing associated with disease. Mol. Neurodegener. 2018, 13, 52. [Google Scholar] [CrossRef]
- Wingo, A.P.; Dammer, E.B.; Breen, M.S.; Logsdon, B.A.; Duong, D.M.; Troncosco, J.C.; Thambisetty, M.; Beach, T.G.; Serrano, G.E.; Reiman, E.M.; et al. Large-scale proteomic analysis of human brain identifies proteins associated with cognitive trajectory in advanced age. Nat. Commun. 2019, 10, 1619. [Google Scholar] [CrossRef]
- Dai, J.; Johnson, E.C.B.; Dammer, E.B.; Duong, D.M.; Gearing, M.; Lah, J.J.; Levey, A.I.; Wingo, T.S.; Seyfried, N.T. Effects of APOE Genotype on Brain Proteomic Network and Cell Type Changes in Alzheimer’s Disease. Front. Mol. Neurosci. 2018, 11, 454. [Google Scholar] [CrossRef]
- Umoh, M.E.; Dammer, E.B.; Dai, J.; Duong, D.M.; Lah, J.J.; Levey, A.I.; Gearing, M.; Glass, J.D.; Seyfried, N.T. A proteomic network approach across the ALS-FTD disease spectrum resolves clinical phenotypes and genetic vulnerability in human brain. EMBO Mol. Med. 2018, 10, 48–62. [Google Scholar] [CrossRef]
- Sonnen, J.A.; Larson, E.B.; Haneuse, S.; Woltjer, R.; Li, G.; Crane, P.K.; Craft, S.; Montine, T.J. Neuropathology in the Adult Changes in Thought Study: A Review. J. Alzheimers Dis. 2009, 18, 703–711. [Google Scholar] [CrossRef]
- Kukull, W.A.; Higdon, R.; Bowen, J.D.; McCormick, W.C.; Teri, L.; Schellenberg, G.D.; Van Belle, G.; Jolley, L.; Larson, E.B. Dementia and Alzheimer disease incidence: A prospective cohort study. Arch. Neurol. 2002, 59, 1737–1746. [Google Scholar] [CrossRef]
- Mirra, S.S.; Heyman, A.; McKeel, D.; Sumi, S.M.; Crain, B.J.; Brownlee, L.M.; Vogel, F.S.; Hughes, J.P.; van Belle, G.; Berg, L. The Consortium to Establish a Registry for Alzheimer’s Disease (CERAD). Part II. Standardization of the neuropathologic assessment of Alzheimer’s disease. Neurology 1991, 41, 479–486. [Google Scholar] [CrossRef]
- Braak, H.; Braak, E. Neuropathological stageing of Alzheimer-related changes. Acta Neuropathol. 1991, 82, 239–259. [Google Scholar] [CrossRef]
- Dickerson, B.C.; Bakkour, A.; Salat, D.H.; Feczko, E.; Pacheco, J.; Greve, D.N.; Grodstein, F.; Wright, C.I.; Blacker, D.; Rosas, H.D.; et al. The cortical signature of Alzheimer’s disease: Regionally specific cortical thinning relates to symptom severity in very mild to mild AD dementia and is detectable in asymptomatic amyloid-positive individuals. Cereb. Cortex 2009, 19, 497–510. [Google Scholar] [CrossRef]
- Donovan, L.E.; Higginbotham, L.; Dammer, E.B.; Gearing, M.; Rees, H.D.; Xia, Q.; Duong, D.M.; Seyfried, N.T.; Lah, J.J.; Levey, A.I. Analysis of a membrane enriched proteome from post-mortem human brain tissue in Alzheimer’s disease. Proteom. Clin. Appl. 2012, 6, 201–211. [Google Scholar] [CrossRef]
- Seyfried, N.T.; Huysentruyt, L.C.; Atwood, J.A., 3rd; Xia, Q.; Seyfried, T.N.; Orlando, R. Up-regulation of NG2 proteoglycan and interferon-induced transmembrane proteins 1 and 3 in mouse astrocytoma: A membrane proteomics approach. Cancer Lett. 2008, 263, 243–252. [Google Scholar] [CrossRef]
- Donovan, L.E.; Dammer, E.B.; Duong, D.M.; Hanfelt, J.J.; Levey, A.I.; Seyfried, N.T.; Lah, J.J. Exploring the potential of the platelet membrane proteome as a source of peripheral biomarkers for Alzheimer’s disease. Alzheimers Res. Ther. 2013, 5, 32. [Google Scholar] [CrossRef]
- Zangi, R.; Zhou, R.; Berne, B.J. Urea’s Action on Hydrophobic Interactions. J. Am. Chem. Soc. 2009, 131, 1535–1541. [Google Scholar] [CrossRef]
- Seyfried, N.T.; Gozal, Y.M.; Donovan, L.E.; Herskowitz, J.H.; Dammer, E.B.; Xia, Q.; Ku, L.; Chang, J.; Duong, D.M.; Rees, H.D.; et al. Quantitative analysis of the detergent-insoluble brain proteome in frontotemporal lobar degeneration using SILAC internal standards. J. Proteome Res. 2012, 11, 2721–2738. [Google Scholar] [CrossRef]
- Elias, J.E.; Gygi, S.P. Target-decoy search strategy for increased confidence in large-scale protein identifications by mass spectrometry. Nat. Methods 2007, 4, 207–214. [Google Scholar] [CrossRef]
- Xu, P.; Duong, D.M.; Peng, J. Systematical Optimization of Reverse-phase Chromatography for Shotgun Proteomics. J. Proteome Res. 2009, 8, 3944–3950. [Google Scholar] [CrossRef]
- Dammer, E.B.; Duong, D.M.; Diner, I.; Gearing, M.; Feng, Y.; Lah, J.J.; Levey, A.I.; Seyfried, N.T. A Neuron Enriched Nuclear Proteome Isolated from Human Brain. J. Proteome Res. 2013, 12, 3193–3206. [Google Scholar] [CrossRef]
- Gozal, Y.M.; Duong, D.M.; Gearing, M.; Cheng, D.; Hanfelt, J.J.; Funderburk, C.; Peng, J.; Lah, J.J.; Levey, A.I. Proteomics analysis reveals novel components in the detergent-insoluble subproteome in Alzheimer’s disease. J. Proteome Res. 2009, 8, 5069–5079. [Google Scholar] [CrossRef]
- Jones, D.R.; Wu, Z.; Chauhan, D.; Anderson, K.C.; Peng, J. A nano Ultra-Performance Liquid Chromatography–High Resolution Mass Spectrometry Approach for Global Metabolomic Profiling and Case Study on Drug-Resistant Multiple Myeloma. Anal. Chem. 2014, 86, 3667–3675. [Google Scholar] [CrossRef]
- Silva, J.C.; Gorenstein, M.V.; Li, G.Z.; Vissers, J.P.; Geromanos, S.J. Absolute quantification of proteins by LCMSE: A virtue of parallel MS acquisition. Mol. Cell. Proteom. 2006, 5, 144–156. [Google Scholar] [CrossRef]
- MacDonald, M.L.; Favo, D.; Garver, M.; Sun, Z.; Arion, D.; Ding, Y.; Yates, N.; Sweet, R.A.; Lewis, D.A. Laser capture microdissection–targeted mass spectrometry: A method for multiplexed protein quantification within individual layers of the cerebral cortex. Neuropsychopharmacology 2019, 44, 743–748. [Google Scholar] [CrossRef]
- Zambon, A.C.; Gaj, S.; Ho, I.; Hanspers, K.; Vranizan, K.; Evelo, C.T.; Conklin, B.R.; Pico, A.R.; Salomonis, N. GO-Elite: A flexible solution for pathway and ontology over-representation. Bioinformatics 2012, 28, 2209–2210. [Google Scholar] [CrossRef]
- Bayés, À.; Collins, M.O.; Galtrey, C.M.; Simonnet, C.; Roy, M.; Croning, M.D.R.; Gou, G.; Van De Lagemaat, L.N.; Milward, D.; Whittle, I.R.; et al. Human post-mortem synapse proteome integrity screening for proteomic studies of postsynaptic complexes. Mol. Brain 2014, 7, 88. [Google Scholar] [CrossRef]
- Mueller, T.M.; Kim, P.; Meador-Woodruff, J.H. Fractionation of Subcellular Compartments from Human Brain Tissue. Methods Mol. Biol. 2019, 1941, 201–223. [Google Scholar]
- Roy, M.; Sorokina, O.; Skene, N.; Simonnet, C.; Mazzo, F.; Zwart, R.; Sher, E.; Smith, C.; Armstrong, J.D.; Grant, S.G.N. Proteomic analysis of postsynaptic proteins in regions of the human neocortex. Nat. Neurosci. 2018, 21, 130–138. [Google Scholar] [CrossRef]
- Gauthier-Kemper, A.; Igaev, M.; Sündermann, F.; Janning, D.; Brühmann, J.; Moschner, K.; Reyher, H.-J.; Junge, W.; Glebov, K.; Walter, J.; et al. Interplay between phosphorylation and palmitoylation mediates plasma membrane targeting and sorting of GAP43. Mol. Boil. Cell 2014, 25, 3284–3299. [Google Scholar] [CrossRef]
- Shimohama, S.; Kamiya, S.; Taniguchi, T.; Akagawa, K.; Kimura, J. Differential Involvement of Synaptic Vesicle and Presynaptic Plasma Membrane Proteins in Alzheimer’s Disease. Biochem. Biophys. Res. Commun. 1997, 236, 239–242. [Google Scholar] [CrossRef]
- Furuya, T.; Silva, P.; Payão, S.; Bertolucci, P.; Rasmussen, L.; De Labio, R.; Braga, I.; Chen, E.; Turecki, G.; Mechawar, N.; et al. Analysis of SNAP25 mRNA expression and promoter DNA methylation in brain areas of Alzheimer’s Disease patients. Neuroscience 2012, 220, 41–46. [Google Scholar] [CrossRef]
- Miller, J.A.; Horvath, S.; Geschwind, D.H. Divergence of human and mouse brain transcriptome highlights Alzheimer disease pathways. Proc. Natl. Acad. Sci. USA 2010, 107, 12698–12703. [Google Scholar] [CrossRef]
- Oldham, M.C.; Konopka, G.; Iwamoto, K.; Langfelder, P.; Kato, T.; Horvath, S.; Geschwind, D.H. Functional organization of the transcriptome in human brain. Nat. Neurosci. 2008, 11, 1271–1282. [Google Scholar] [CrossRef]
- Voineagu, I.; Wang, X.; Johnston, P.; Lowe, J.K.; Tian, Y.; Horvath, S.; Mill, J.; Cantor, R.M.; Blencowe, B.J.; Geschwind, D.H. Transcriptomic Analysis of Autistic Brain Reveals Convergent Molecular Pathology. Nature 2011, 474, 380–384. [Google Scholar] [CrossRef]
- Zhang, B.; Gaiteri, C.; Bodea, L.-G.; Wang, Z.; McElwee, J.; Podtelezhnikov, A.A.; Zhang, C.; Xie, T.; Tran, L.; Dobrin, R.; et al. Integrated systems approach identifies genetic nodes and networks in late-onset Alzheimer’s disease. Cell 2013, 153, 707–720. [Google Scholar] [CrossRef]
- Raj, T.; Shulman, J.M.; Keenan, B.T.; Chibnik, L.B.; Evans, D.A.; Bennett, D.A.; Stranger, B.E.; De Jager, P.L. Alzheimer Disease Susceptibility Loci: Evidence for a Protein Network under Natural Selection. Am. J. Hum. Genet. 2012, 90, 720–726. [Google Scholar] [CrossRef] [PubMed]
- Sharma, K.; Schmitt, S.; Bergner, C.G.; Tyanova, S.; Kannaiyan, N.; Manrique-Hoyos, N.; Kongi, K.; Cantuti, L.; Hanisch, U.-K.; Philips, M.-A.; et al. Cell type- and brain region-resolved mouse brain proteome. Nat. Neurosci. 2015, 18, 1819–1831. [Google Scholar] [CrossRef] [PubMed]
- Takemoto-Kimura, S.; Suzuki, K.; Horigane, S.-I.; Kamijo, S.; Inoue, M.; Sakamoto, M.; Fujii, H.; Bito, H. Calmodulin kinases: Essential regulators in health and disease. J. Neurochem. 2017, 141, 808–818. [Google Scholar] [CrossRef] [PubMed]
- Csordas, G.; Weaver, D.; Hajnoczky, G. Endoplasmic Reticulum-Mitochondrial Contactology: Structure and Signaling Functions. Trends Cell Biol. 2018, 28, 523–540. [Google Scholar] [CrossRef] [PubMed]
- Shephard, F.; Greville-Heygate, O.; Marsh, O.; Anderson, S.; Chakrabarti, L. A mitochondrial location for haemoglobins—Dynamic distribution in ageing and Parkinson’s disease. Mitochondrion 2014, 14, 64–72. [Google Scholar] [CrossRef] [PubMed]
- Roberts, B.R.; Ryan, T.M.; Bush, A.I.; Masters, C.L.; Duce, J.A. The role of metallobiology and amyloid-beta peptides in Alzheimer’s disease. J. Neurochem. 2012, 120 (Suppl. 1), 149–166. [Google Scholar] [CrossRef] [PubMed]
- Heinzen, E.L.; Arzimanoglou, A.; Brashear, A.; Clapcote, S.J.; Gurrieri, F.; Goldstein, D.B.; Jóhannesson, S.H.; Mikati, M.A.; Neville, B.; Nicole, S.; et al. Distinct neurological disorders with ATP1A3 mutations. Lancet Neurol. 2014, 13, 503–514. [Google Scholar] [CrossRef]
- Desler, C.; Lillenes, M.S.; Tønjum, T.; Rasmussen, L.J. The Role of Mitochondrial Dysfunction in the Progression of Alzheimer’s Disease. Curr. Med. Chem. 2018, 25, 5578–5587. [Google Scholar] [CrossRef]


© 2019 by the authors. Licensee MDPI, Basel, Switzerland. This article is an open access article distributed under the terms and conditions of the Creative Commons Attribution (CC BY) license (http://creativecommons.org/licenses/by/4.0/).
Share and Cite
Higginbotham, L.; Dammer, E.B.; Duong, D.M.; Modeste, E.; Montine, T.J.; Lah, J.J.; Levey, A.I.; Seyfried, N.T. Network Analysis of a Membrane-Enriched Brain Proteome across Stages of Alzheimer’s Disease. Proteomes 2019, 7, 30. https://doi.org/10.3390/proteomes7030030
Higginbotham L, Dammer EB, Duong DM, Modeste E, Montine TJ, Lah JJ, Levey AI, Seyfried NT. Network Analysis of a Membrane-Enriched Brain Proteome across Stages of Alzheimer’s Disease. Proteomes. 2019; 7(3):30. https://doi.org/10.3390/proteomes7030030
Chicago/Turabian StyleHigginbotham, Lenora, Eric B. Dammer, Duc M. Duong, Erica Modeste, Thomas J. Montine, James J. Lah, Allan I. Levey, and Nicholas T. Seyfried. 2019. "Network Analysis of a Membrane-Enriched Brain Proteome across Stages of Alzheimer’s Disease" Proteomes 7, no. 3: 30. https://doi.org/10.3390/proteomes7030030
APA StyleHigginbotham, L., Dammer, E. B., Duong, D. M., Modeste, E., Montine, T. J., Lah, J. J., Levey, A. I., & Seyfried, N. T. (2019). Network Analysis of a Membrane-Enriched Brain Proteome across Stages of Alzheimer’s Disease. Proteomes, 7(3), 30. https://doi.org/10.3390/proteomes7030030