Towards Understanding Non-Infectious Growth-Rate Retardation in Growing Pigs


Abstract
1. Introduction
2. Material and Methods
2.1. Characterization of Animals
2.2. PCV2 Detection
2.3. Salivary Marker Measurements
2.4. Two-Dimensional Gel Electrophoresis (2DE)
2.5. Sodiumdodecyl Sulphate Polyacrylamide Gel Electrophoresis (SDS-PAGE)
2.6. MS Identification of SDS-PAGE Bands and 2DE Spots
2.7. Protein Identification by MALDI-TOF/TOF Mass Spectrometry
2.8. Protein Identification by Q Exactive HF Orbitrap Mass Spectrometry
2.9. Protein Quantification by Western Blot
3. Results
3.1. PCV2 Detection
3.2. Salivary Measurements
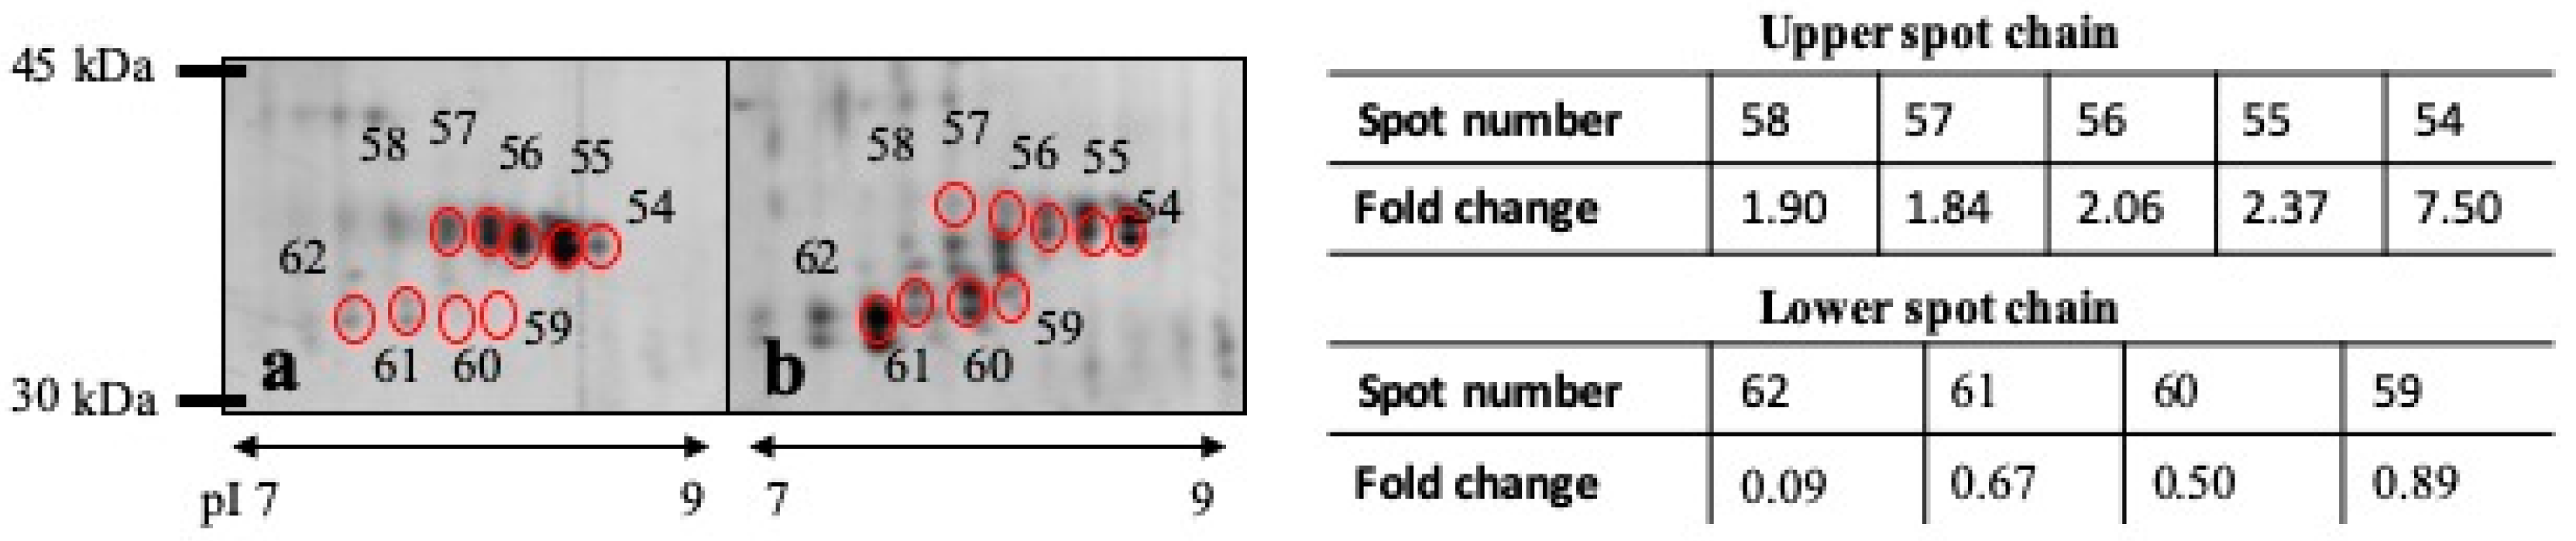
3.3. DE Analysis
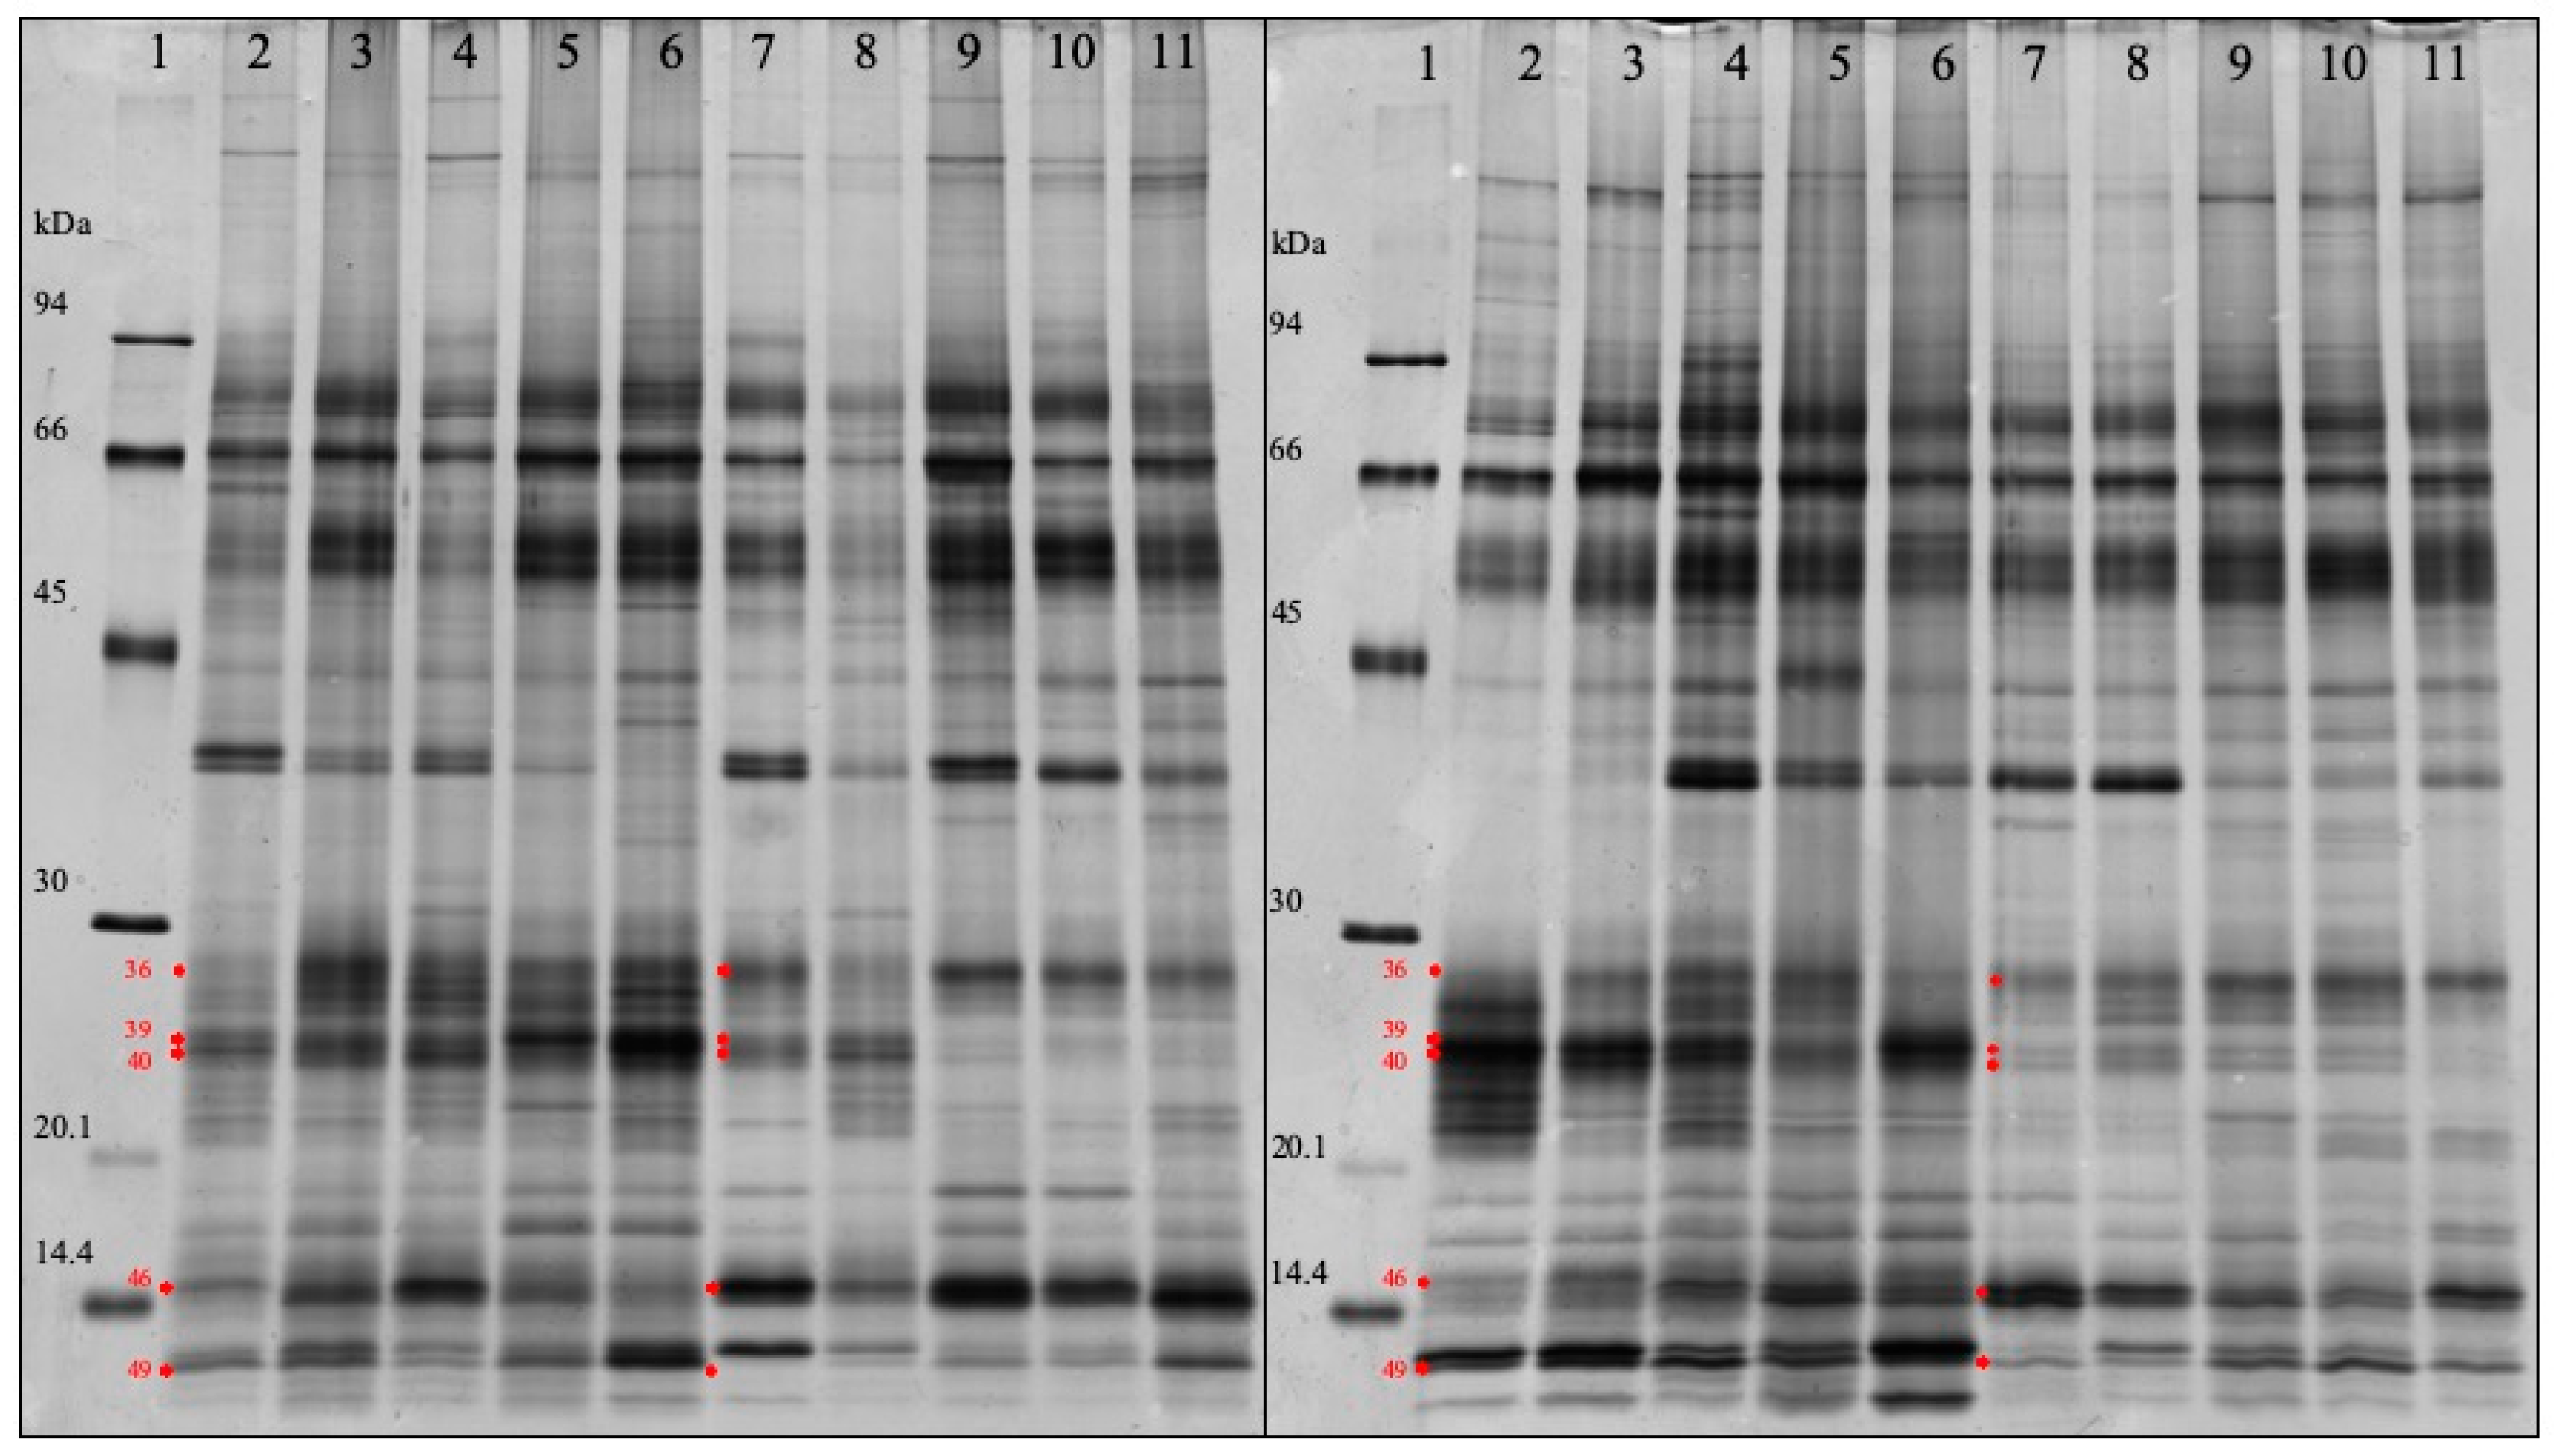
3.4. SDS-PAGE Analysis
4. Discussion
Supplementary Materials
Author Contributions
Funding
Conflicts of Interest
References
- Caravaca Rodríguez, F.P.; CastelGenís, J.M.; Guzman Guerrero, J.L.; Delgado Pertíñez, M.; Mena Guerrero, Y.; Alcalde Aldea, M.J.; González Redondo, P. (Eds.) Bases fisiológicas del crecimiento. In Bases de la Producción Animal; Universidad de Sevilla and Universidad de Córdoba: Sevilla, Spain, 2005. [Google Scholar]
- Vázquez-Gómez, M.; García-Contreras, C.; Torres-Rovira, L.; Pesantez, J.L.; González-Añover, P.; Gómez-Fidalgo, E.; Sánchez-Sánchez, E.; Ovilo, C.; Isabel, B.; Astiz, S.; et al. Polyphenols and IUGR pregnancies: Maternal hydroxyl tyrosol supplementation improves prenatal and early-postnatal growth and metabolism of theoffspring. PLoS ONE 2017, 12, e0177593. [Google Scholar] [CrossRef]
- Thomson, J.R.; Friendship, R.M. Digestive System. In Diseases of Swine, 10th ed.; Zimmerman, J.J., Karriker, L.A., Ramirez, A., Schwartz, K.J., Stevenson, G.W., Eds.; John Wiley and Sons: London, UK, 2012; pp. 199–226. [Google Scholar]
- Pierozan, C.R.; Agostini, P.S.; Gasa, J.; Novais, A.K.; Dias, C.P.; Santos, R.S.K.; Pereira, M.; Nagi, J.G.J.; Alves, B.; Silva, C.A. Factors affecting the daily feed intake and feed conversion ratio of pigs in grow-finishing units: The case of a company. Porcine Health Manag. 2016, 2, 7. [Google Scholar] [CrossRef][Green Version]
- Li, Y.; Li, F.; Duan, Y.; Guo, Q.; Wang, W.; Wen, C.; Huang, X.; Yin, Y. The protein and energy metabolic response of skeletal muscle to the low-protein diets in growing pigs. J. Agric. Food Chem. 2017, 65, 8544–8551. [Google Scholar] [CrossRef]
- Agostini, P.S.; Fahey, A.G.; Manzanilla, E.G.; O’Doherty, J.V.; De Blas, C.; Gasa, J. Management factors affecting mortality, feed intake and feed conversion ratio of grow-finishing pigs. Animal 2014, 8, 1312–1318. [Google Scholar] [CrossRef]
- Averós, X.; Brossard, L.; Dourmad, J.Y.; De Greef, K.H.; Edwards, S.A.; Meunier-Salaün, M.C. Meta-analysis on the effects of the physical environment, animal traits, feeder and feed characteristics on the feeding behaviour and performance of growing-finishing pigs. Animal 2012, 6, 1275–1289. [Google Scholar] [CrossRef]
- Patterson, R.; Nevel, A.; Diaz, A.V.; Martineau, H.M.; Demmers, T.; Browne, C.; Mavrommatis, B.; Werling, D. Exposure to environmental stressors result in increased viral load and further reduction of production parameters in pigs experimentally infected with PCV2b. Vet. Microbiol. 2015, 177, 261–269. [Google Scholar] [CrossRef]
- Johansen, M.; Nielsen, M.; Dahl, J.; Svensmark, B.; Bækbo, P.; Kristensen, C.S.; Hjulsager, C.K.; Jensen, T.K.; Ståhl, M.; Larsen, L.E.; et al. Investigation of the association of growth rate in grower-finishing pigs with the quantification of Lawsoniaintracellularis and porcine circovirus type 2. Prev. Vet. Med. 2013, 108, 63–72. [Google Scholar] [CrossRef]
- Gutiérrez, A.M.; De La Cruz-Sánchez, E.; Montes, A.; Sotillo, J.; Gutiérrez-Panizo, C.; Fuentes, P.; Tornel, P.L.; Cabezas-Herrera, J. Easy and non-invasive disease detection in pigs by adenosine deaminase activity determinations in saliva. PLoS ONE 2017, 12, e0179299. [Google Scholar] [CrossRef]
- Eddicks, M.; Koeppen, M.; Willi, S.; Fux, R.; Reese, S.; Sutter, G.; Stadler, J.; Ritzmann, M. Low prevalence of porcine circovirus type 2 infections in farrowing sows and corresponding pre-suckling piglets in southern German pig farms. Vet. Microbiol. 2016, 187, 70–74. [Google Scholar] [CrossRef]
- Gutiérrez, A.M.; Escribano, D.; Fuentes, M.; Cerón, J.J. Circadian pattern of acute phase proteins in the saliva of growing pigs. Vet. J. 2013, 196, 167–170. [Google Scholar] [CrossRef]
- Gutiérrez, A.M.; Martínez-Subiela, S.; Cerón, J.J. Evaluation of an immunoassay for determination of haptoglobin concentration in various biological specimens from swine. Am. J. Vet. Res. 2009, 70, 691–696. [Google Scholar] [CrossRef] [PubMed]
- Sánchez, J.; García, A.; Ruiz, J.M.; Montes, A.M.; Cabezas-Herrera, J.; Ros-Lara, S.; De la Cruz, E.; Gutiérrez, A.M. Porcine Breed, Sex, and Production Stage Influence the Levels of Health Status Biomarkers in Saliva Samples. Front. Vet. Sci. 2019, 6, 32. [Google Scholar] [CrossRef] [PubMed]
- Fuentes, M.; Tecles, F.; Gutiérrez, A.; Otal, J.; Martínez-Subiela, S.; Cerón, J.J. Validation of an automated method for salivary alpha-amylase measurements in pigs (Sus scrofadomesticus) and its application as a stress biomarker. J. Vet. Diagn. Investig. 2011, 23, 282–287. [Google Scholar] [CrossRef] [PubMed]
- Gutiérrez, A.M.; Montes, A.; Gutiérrez-Panizo, C.; Fuentes, P.; De La Cruz-Sánchez, E. Gender influence on the salivary protein profile of finishing pigs. J. Proteom. 2018, 178, 107–113. [Google Scholar]
- Miller, I.; Crawford, J.; Gianazza, E. Protein stains for proteomic applications: Which. when. why? Proteomics 2006, 6, 5385–5408. [Google Scholar] [CrossRef] [PubMed]
- Bradford, M.M. A rapid and sensitive method for the quantitation of microgram quantities of protein utilizing the principle of protein-dye binding. Anal. Biochem. 1976, 72, 248–254. [Google Scholar] [CrossRef]
- Jiménez, C.R.; Huang, L.; Qiu, Y.; Burlingame, A.L. In-gel digestion of proteins for MALDI-MS fingerprint mapping. Curr. Protoc. Protein Sci. 2001, 14, 16.4.1–16.4.5. [Google Scholar]
- Shevchenko, A.; Wilm, M.; Vorm, O.; Mann, M. Mass spectrometric sequencing of proteins from silver-stained polyacrylamide gels. Anal. Chem. 1996, 68, 850–858. [Google Scholar] [CrossRef]
- Uniprot. Available online: http://www.uniprot.org/ (accessed on 24 June 2019).
- Loebel, D.; Scaloni, A.; Paolini, S.; Fini, C.; Ferrara, L.; Breer, H.; Pelosi, P. Cloning, post-translational modifications, heterologous expression and ligand-binding of boar salivary lipocalin. Biochem. J. 2000, 350, 369–379. [Google Scholar] [CrossRef]
- Spinelli, S.; Vincent, F.; Pelosi, P.; Tegoni, M.; Cambillau, C. Boar salivary lipocalin. Three-dimensional X-ray structure and androsterol/androstenone docking simulations. Eur. J. Biochem. 2002, 269, 2449–2456. [Google Scholar] [CrossRef]
- Meslin, C.; Brimau, F.; Nagnan-Le Meillour, P.; Callebaut, I.; Pascal, G.; Monget, P. The evolutionary history of the SAL1 gene family in eutherian mammals. BMC Evol. Biol. 2011, 11, 148. [Google Scholar] [CrossRef] [PubMed]
- Criado, L.; Arroyo, K.; Valent, D.; Bassols, A.; Miller, I. Characterization of pig saliva proteins and identification of lipocalin-1 as a marker of transport stress. In Proceedings of the EuPA 2015 (24–26.6.15); University of Milan: Milan, Italy, 2015; p. 56. [Google Scholar]
- Parkkila, S.; Parkkila, A.K.; Lehtola, J.; Reinilä, A.; Södervik, H.J.; Rannisto, M.; Rajaniemi, H. Salivary carbonic anhydrase protects gastroesophageal mucosa from acid injury. Dig. Dis. Sci. 1997, 42, 1013–1019. [Google Scholar] [CrossRef] [PubMed]
- Leinonen, J.; Parkkila, S.; Kaunisto, K.; Koivunen, P.; Rajaniemi, H. Secretion of carbonic anhydrase isoenzyme VI (CA VI) from human and rat lingual serous von Ebner’s glands. J. Histochem. Cytochem. 2001, 49, 657–662. [Google Scholar] [CrossRef] [PubMed]
- Sok, J.; Wang, X.Z.; Batchvarova, N.; Kuroda, M.; Harding, H.; Ron, D. CHOP-Dependent stress-inducible expression of a novel form of carbonic anhydrase VI. Mol. Cell. Biol. 1999, 19, 495–504. [Google Scholar] [CrossRef] [PubMed]
- Escribano, D.; Gutiérrez, A.M.; Martínez Subiela, S.; Tecles, F.; Cerón, J.J. Validation of three commercially available immunoassays for quantification of IgA, IgG, and IgM in porcine saliva samples. Res. Vet. Sci. 2012, 93, 682–687. [Google Scholar] [CrossRef] [PubMed]
- Hesselager, M.O.; Codrea, M.C.; Sun, Z.; Deutsch, E.W.; Bennike, T.B.; Stensballe, A.; Bundgaard, L.; Moritz, R.L.; Bendixen, E. The Pig PeptideAtlas: A resource for systems biology in animal production and biomedicine. Proteomics 2016, 16, 634–644. [Google Scholar] [CrossRef] [PubMed]


| Analyte | Control Pigs * | Pigs with GRR * | p Value |
|---|---|---|---|
| CRP (ng/mL) | 3.51 (2.42–12.82) | 17.94 (2.42–32.26) | 0.2225 |
| Hp (µg/mL) | 0.45 (0.30–0.77) | 0.42 (0.23–0.96) | 0.9575 |
| ADA (U/L) | 269.7 (171.5–344.9) | 245.5 (82.53–619.3) | 0.9502 |
| TAC (M trolox equivalents/mL) | 0.66 (0.24–0.90) | 0.49 (0.35–1.25) | 0.6685 |
| CRP | ADA | TAC | Amylase | |
|---|---|---|---|---|
| Hp | 0.63 * | −0.22 | 0.14 | 0.31 |
| CRP | −0.46 * | 0.44 * | 0.49 * | |
| ADA | −0.69 * | −0.13 | ||
| TAC | 0.09 |
| Spot Number a | p Value | Protein Name | Known Function b | Fold Change c | MW |
|---|---|---|---|---|---|
| 42 | 0.0018 | Ig lambda chain C region | Miscellaneous in the humoral immunity | 1.795 | 27 kDa |
| 156 | 0.0068 | Double-headed protease inhibitor submandibular gland-like | Hydrolase, protease activity | 0.593 | 14 kDa |
| 24 | 0.0080 | Odorant-bindingprotein | Chemical odorants binding | 0.338 | 24 kDa |
| 157 | 0.0087 | Ig lambda chain C region | Miscellaneous in the humoral immunity | 2.072 | 27 kDa |
| 62 | 0.0126 | Carbonicanhydrase VI | Carbonate dehydratase activity, zinc ion binding | 0.094 | 33 kDa |
| 7 | 0.0127 | Salivarylipocalin | Pheromonebinding | 0.468 | 14 kDa |
| 45 | 0.0132 | Ig lambda chain C region | Miscellaneous in the humoral immunity | 1.594 | 27 kDa |
| 50 | 0.0272 | IgA heavy chain constant region | Antigen binding in the humoral immunity | 1.656 | 27 kDa |
| 32 | 0.0374 | Salivarylipocalin | Pheromonebinding | 0.452 | 25 kDa |
| 54 | 0.0383 | Carbonicanhydrase VI | Carbonate dehydratase activity, zinc ion binding | 7.509 | 36 kDa |
| 55 | 0.0492 | Carbonicanhydrase VI | Carbonate dehydratase activity, zinc ion binding | 2.370 | 36 kDa |
| Spot ID | Accession | Protein Identified | MW [Da] | pI | Mascot Score | Nr of Peptides | Sequ. Cov % | m/z | Range | Peptide Score | Peptide Sequence |
|---|---|---|---|---|---|---|---|---|---|---|---|
| 7 | P81608 | Salivary lipocalin | 21.6 | 5.0 | 184.7 | 3 | 20.4 | 1291.5897 | 132–141 | 68.7 | K.TFQLMEFYGR.K |
| 1497.7441 | 153–164 | 64.8 | K.FVEICQQYGIIK.E | ||||||||
| 1938.9012 | 94–110 | 51.2 | K.VGDGVYTVAYYGENKFR.L | ||||||||
| 24 | P81245 | Odorant-binding protein | 17.7 | 4 | 607.8 | 6 | 54.1 | 1017.5580 | 51–58 | 52.4 | K.VYLNFFSK.E |
| 1408.7844 | 29–40 | 101.6 | K.IGENAPFQVFMR.S | ||||||||
| 1498.8065 | 16–28 | 124.7 | K.WITSYIGSSDLEK.I | ||||||||
| 1711.8749 | 1–15 | 81.4 | -.QEPQPEQDPFELSGK.W | ||||||||
| 2023.0754 | 121–137 | 143.1 | K.GTDIEDQDLEKFKEVTR.E | ||||||||
| 2297.2219 | 138–157 | 104.6 | R.ENGIPEENIVNIIERDDCPA.- | ||||||||
| 32 | P81608 | Salivary lipocalin | 21.6 | 5.0 | 469.4 | 5 | 26.2 | 898.5025 | 59–65 | 31.8 | R.VFVEHIR.V |
| 1291.6775 | 132–141 | 82.6 | K.TFQLMEFYGR.K | ||||||||
| 1497.7926 | 153–164 | 96.4 | K.FVEICQQYGIIK.E | ||||||||
| 1938.0475 | 94–110 | 115 | K.VGDGVYTVAYYGENKFR.L | ||||||||
| 1982.1818 | 149–164 | 143.6 | K.LKDKFVEICQQYGIIK.E | ||||||||
| 42 | P01846 | Ig lambda chain C region | 11.0 | 7.5 | 162.3 | 2 | 31.4 | 1632.8567 | 65–79 | 108.6 | K.YAASSYLALSASDWK.S |
| 1967.9933 | 80–97 | 53.7 | K.SSSGFTCQVTHEGTIVEK.T | ||||||||
| 45 | P01846 | Ig lambda chain C region | 11.0 | 7.5 | 127.5 | 2 | 31.4 | 1632.8024 | 65–79 | 58.9 | K.YAASSYLALSASDWK.S |
| 1966.9425 | 80–97 | 68.6 | K.SSSGFTCQVTHEGTIVEK.T | ||||||||
| 54 | B7X727 | Carbonic anhydrase VI | 36.3 | 6.2 | 230.1 | 3 | 8.8 | 1047.5925 | 56–64 | 21.2 | K.SVQYNPALR.A |
| 2267.1851 | 286–303 | 153.1 | R.SELHFYLNNIDNNLEYLR.R | ||||||||
| 2423.3125 | 286–304 | 55.7 | R.SELHFYLNNIDNNLEYLRR.V | ||||||||
| 55 | B7X727 | Carbonic anhydrase VI | 36.3 | 6.2 | 293.8 | 4 | 15.1 | 1047.6041 | 56–64 | 36 | K.SVQYNPALR.A |
| 1074.5952 | 258–265 | 30.3 | K.TIHNDYRR.T | ||||||||
| 1574.9181 | 133–145 | 85.6 | R.YVTEVHVVHYNSK.Y | ||||||||
| 2267.2771 | 286–303 | 141.9 | R.SELHFYLNNIDNNLEYLR.R | ||||||||
| 62 | B7X727 | Carbonic anhydrase VI | 36.3 | 6.2 | 470.6 | 6 | 24.9 | 1047.5475 | 56–64 | 30.7 | K.SVQYNPALR.A |
| 1074.5327 | 258–265 | 35.3 | K.TIHNDYRR.T | ||||||||
| 1167.4833 | 38–46 | 31.4 | R.EYPDCDGRR.Q | ||||||||
| 1574.7672 | 133–145 | 87.7 | R.YVTEVHVVHYNSK.Y | ||||||||
| 1965.8298 | 170–185 | 109.3 | K.DYAENTYYSDFISHLK.N | ||||||||
| 2699.2092 | 109–132 | 176.2 | K.QMHFHWGGAFSEISGSEHTIDGIR.Y |
| Spot ID | Accession | Description | Coverage [%] | # Peptides | # PSMs | # Unique Peptides | # AAs | MW [kDa] | calc. pI | Score Sequest HT: | # Peptides (by Search Engine): Sequest HT |
|---|---|---|---|---|---|---|---|---|---|---|---|
| 50 | K7ZRK0 | IgA heavy chain constant region (Fragment) | 15 | 4 | 17 | 4 | 341 | 36.6 | 6.13 | 28.67 | 4 |
| 156 | A0A287ATY8 | 62.7% ID with double-headed protease inhibitor. submandibular gland-like (Odobenus rosmarusdivergens) | 12 | 2 | 2 | 2 | 134 | 14.7 | 7.02 | 0 | 2 |
| 157 | P01846 | Iglambdachain C region | 30 | 5 | 48 | 4 | 260 | 27.5 | 7.65 | 119.64 | 5 |
| Band Number | p Value | Protein Name of the Top Hits | Fold Change a | MW (kDa) |
|---|---|---|---|---|
| 46 | 6.712440e-015 | Cystatin | 1.866 | 15.3 |
| 36 | 0.000441131 | Salivary lipocalin & Ig lambdachain | 1.558 | 27.8 |
| 49 | 0.000271945 | Protein S100A12 | 0.602 | 12.4 |
| 40 | 4.243557e-007 | Salivary lipocalin | 0.348 | 24.1 |
| 39 | 4.994833e-011 | Salivary lipocalin | 0.324 | 24.8 |
© 2019 by the authors. Licensee MDPI, Basel, Switzerland. This article is an open access article distributed under the terms and conditions of the Creative Commons Attribution (CC BY) license (http://creativecommons.org/licenses/by/4.0/).
Share and Cite
Gutiérrez, A.M.; Sotillo, J.; Schlosser, S.; Hummel, K.; Miller, I. Towards Understanding Non-Infectious Growth-Rate Retardation in Growing Pigs. Proteomes 2019, 7, 31. https://doi.org/10.3390/proteomes7030031
Gutiérrez AM, Sotillo J, Schlosser S, Hummel K, Miller I. Towards Understanding Non-Infectious Growth-Rate Retardation in Growing Pigs. Proteomes. 2019; 7(3):31. https://doi.org/10.3390/proteomes7030031
Chicago/Turabian StyleGutiérrez, Ana M., Juan Sotillo, Sarah Schlosser, Karin Hummel, and Ingrid Miller. 2019. "Towards Understanding Non-Infectious Growth-Rate Retardation in Growing Pigs" Proteomes 7, no. 3: 31. https://doi.org/10.3390/proteomes7030031
APA StyleGutiérrez, A. M., Sotillo, J., Schlosser, S., Hummel, K., & Miller, I. (2019). Towards Understanding Non-Infectious Growth-Rate Retardation in Growing Pigs. Proteomes, 7(3), 31. https://doi.org/10.3390/proteomes7030031