1. Introduction
Covalent phosphorylation constitutes nature’s most versatile and extensible mechanism for modulating the structural and functional properties of proteins [
1,
2,
3]. Among the families of enzymes that catalyze this important covalent modification event, the most prolific by far are the so-called “typical” eukaryotic protein kinases (ePKs) [
4]. Typical ePKs are found in all eukaryotes and most bacterial organisms [
5,
6,
7,
8]. In
Homo sapiens, typical ePKs account for >90% of the approximately five hundred members of the human “kinome” [
9].
What factors underly the prolific nature of the typical ePK paradigm? When and for what purposes did the regulatory potential inherent in this protein kinase family first become manifest? Although the first ePKs emerged prior to the divergence of the
Archaea and
Eucarya, these ancestral ePKs most closely resembled the so-called “atypical” ePKs, such as the p53-related protein kinase and the RIO (right open reading frame) protein kinases [
5,
10], which comprise only a minor proportion of the human kinome [
9]. Since the first available archaeal genome sequences encoded only atypical ePKs, it was initially believed that the typical ePKs emerged in the
Eucarya, from which they subsequently spread by horizontal gene transfer to the
Bacteria [
5,
7]. It was thus of considerable interest that as genome sequences continued to be accumulated, that open reading frames (ORF) encoding deduced typical ePKs were encountered in members of the
Archaea, specifically within the creanarchaeal branch of this domain.
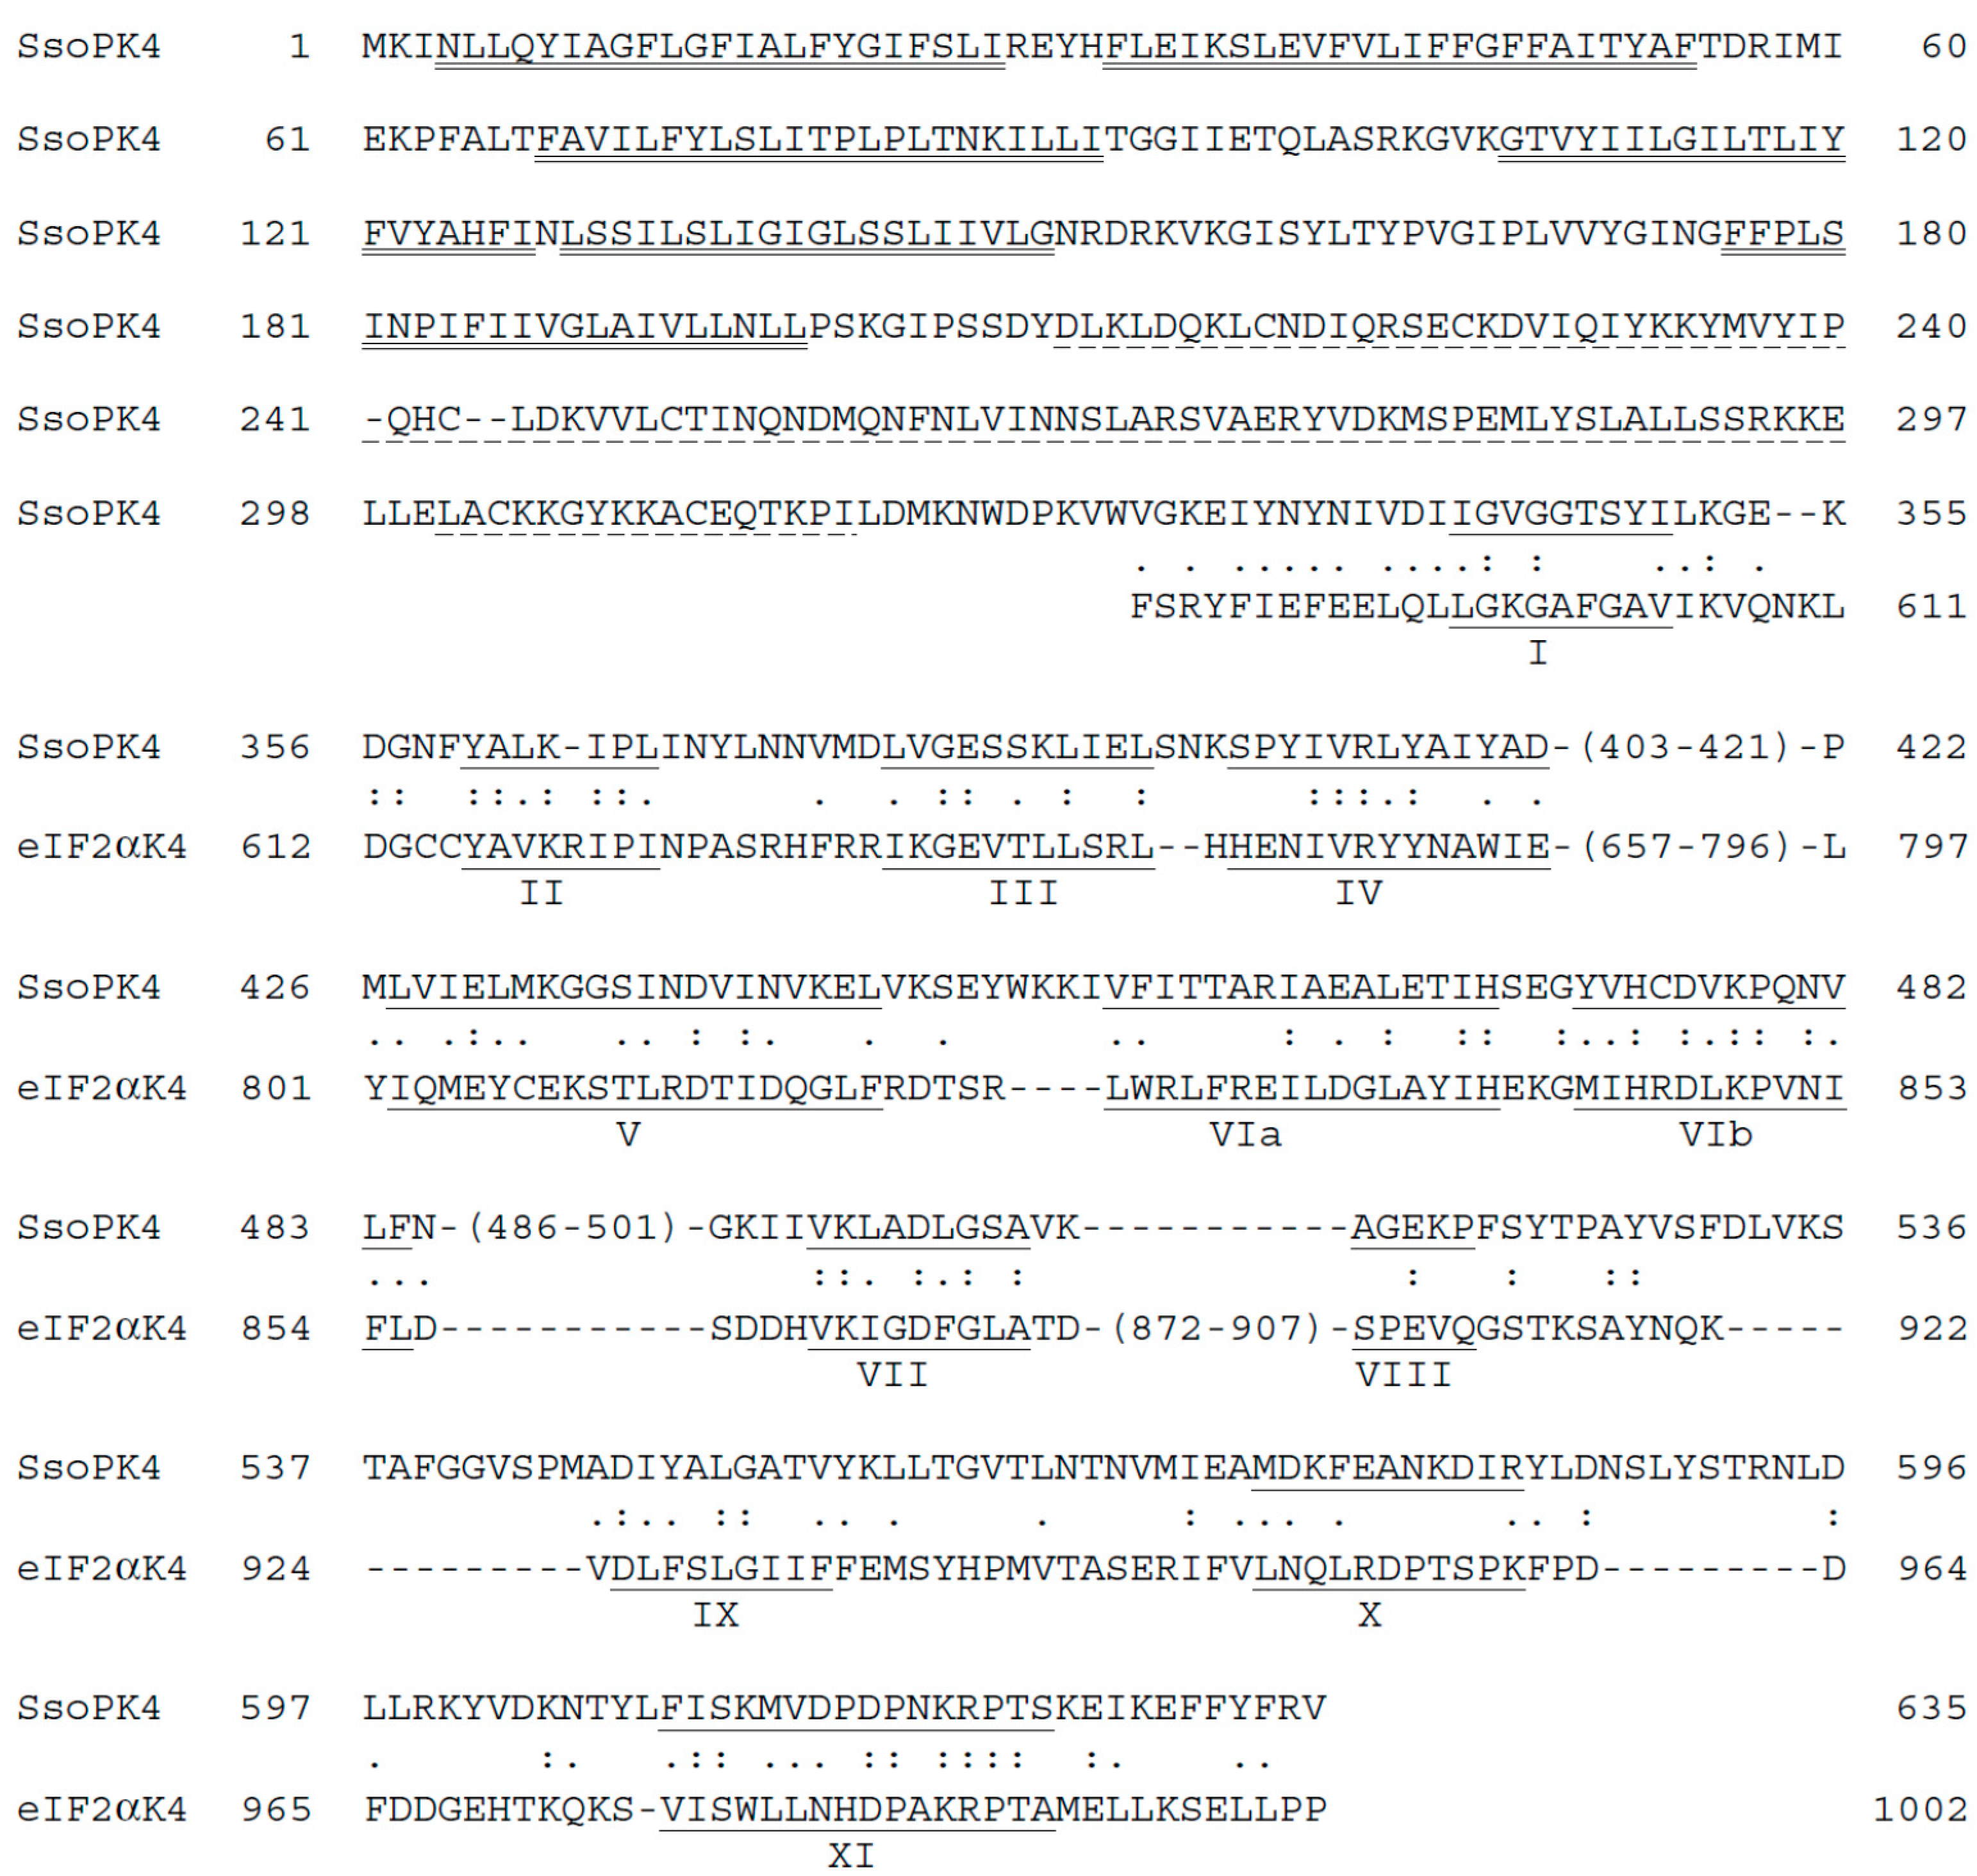
Intriguingly, the catalytic domains of the putative archaeal members of the typical ePK family bear a discernable resemblance to the set of typical ePKs responsible for phosphorylating eukaryotic translational initiation factor 2α (eIF2α). In the
Eucarya, the eIF2α kinases phosphorylate and inactivate eIF2α in response to indicators of stress such as amino acid limitation, viral infection, unfolded proteins,
etc. [
11,
12,
13]. Herein we describe the basic properties of a typical ePK from the
Archaea, SsoPK4 from the extreme hyperthermophile
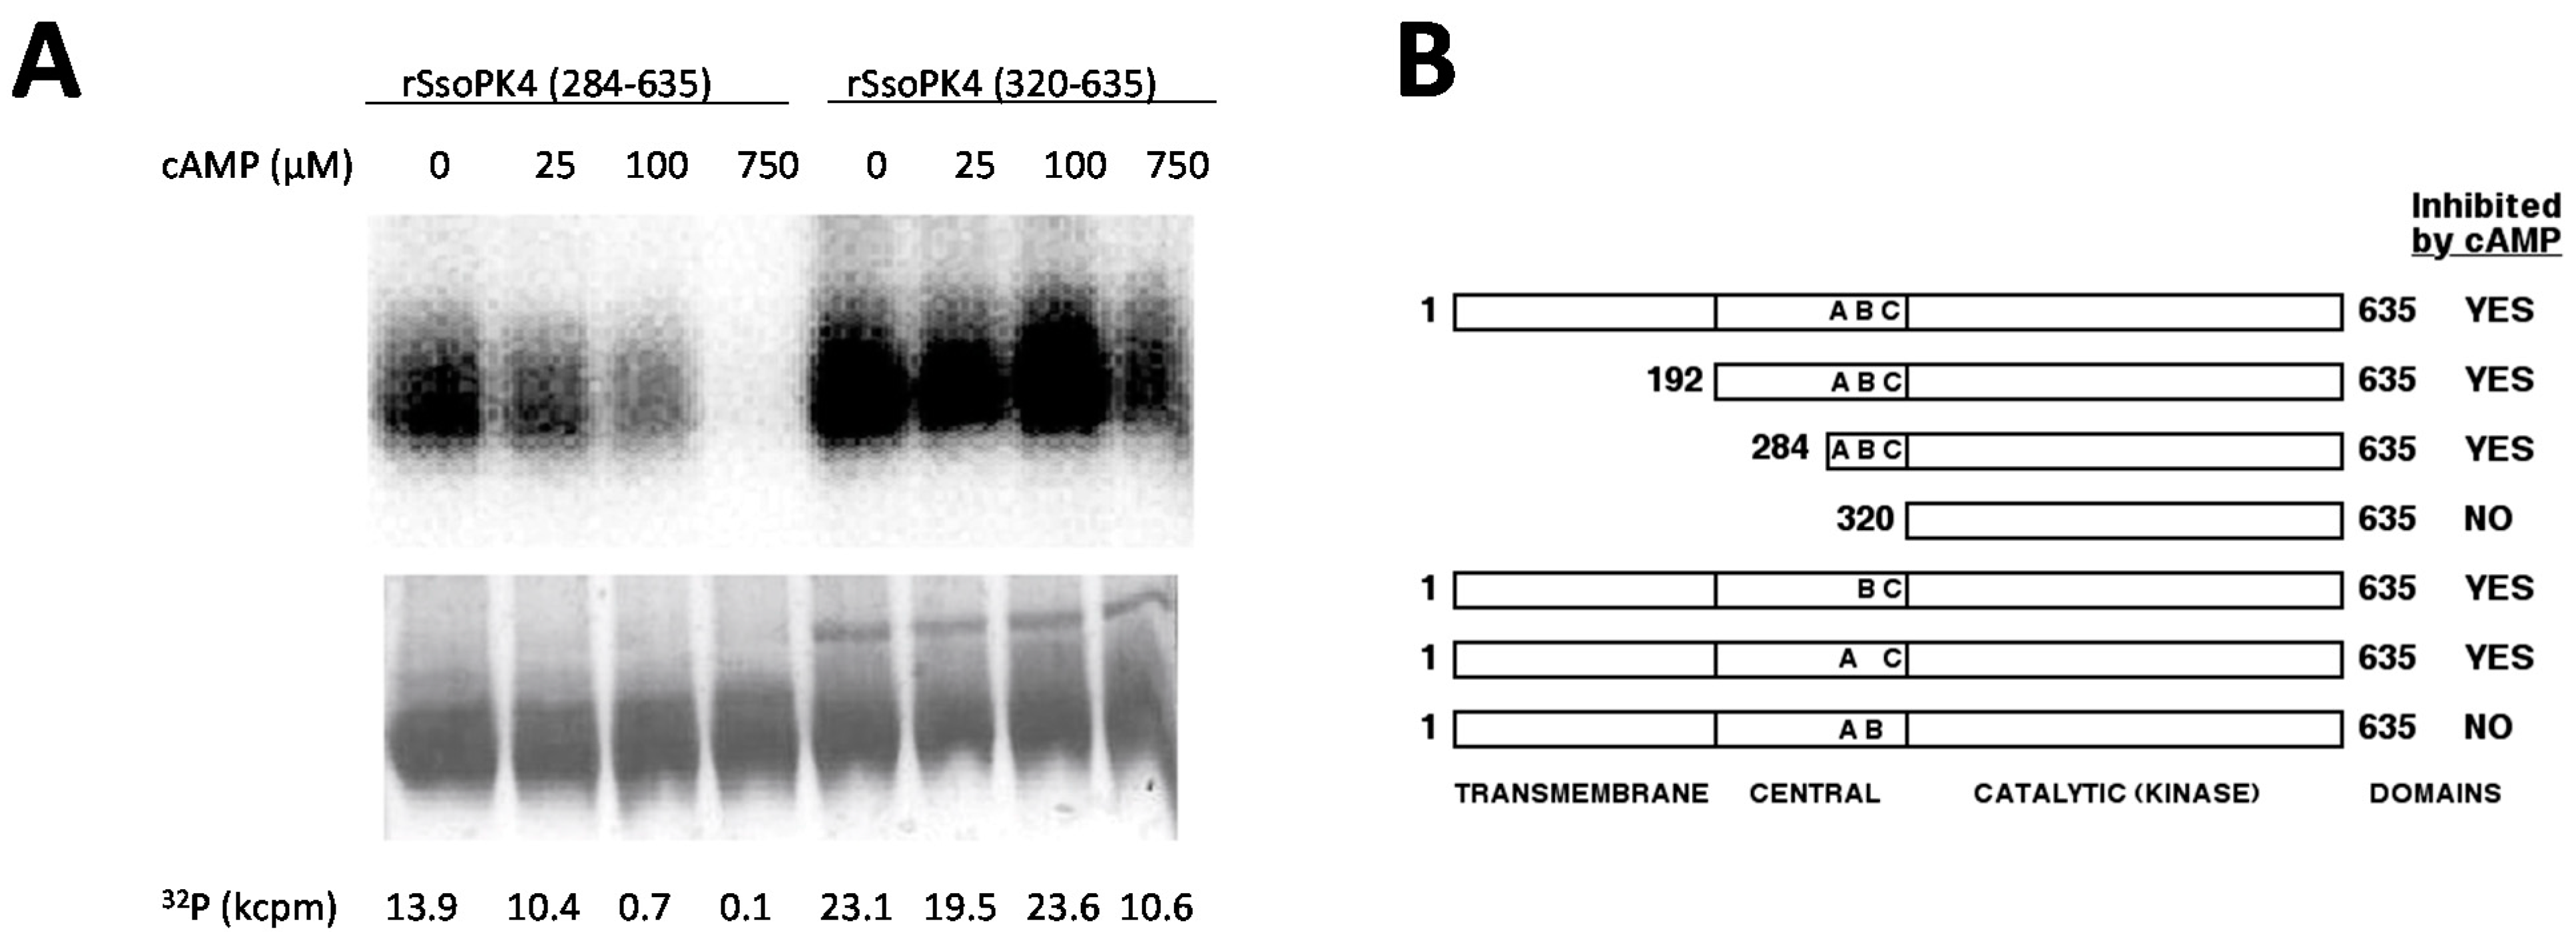
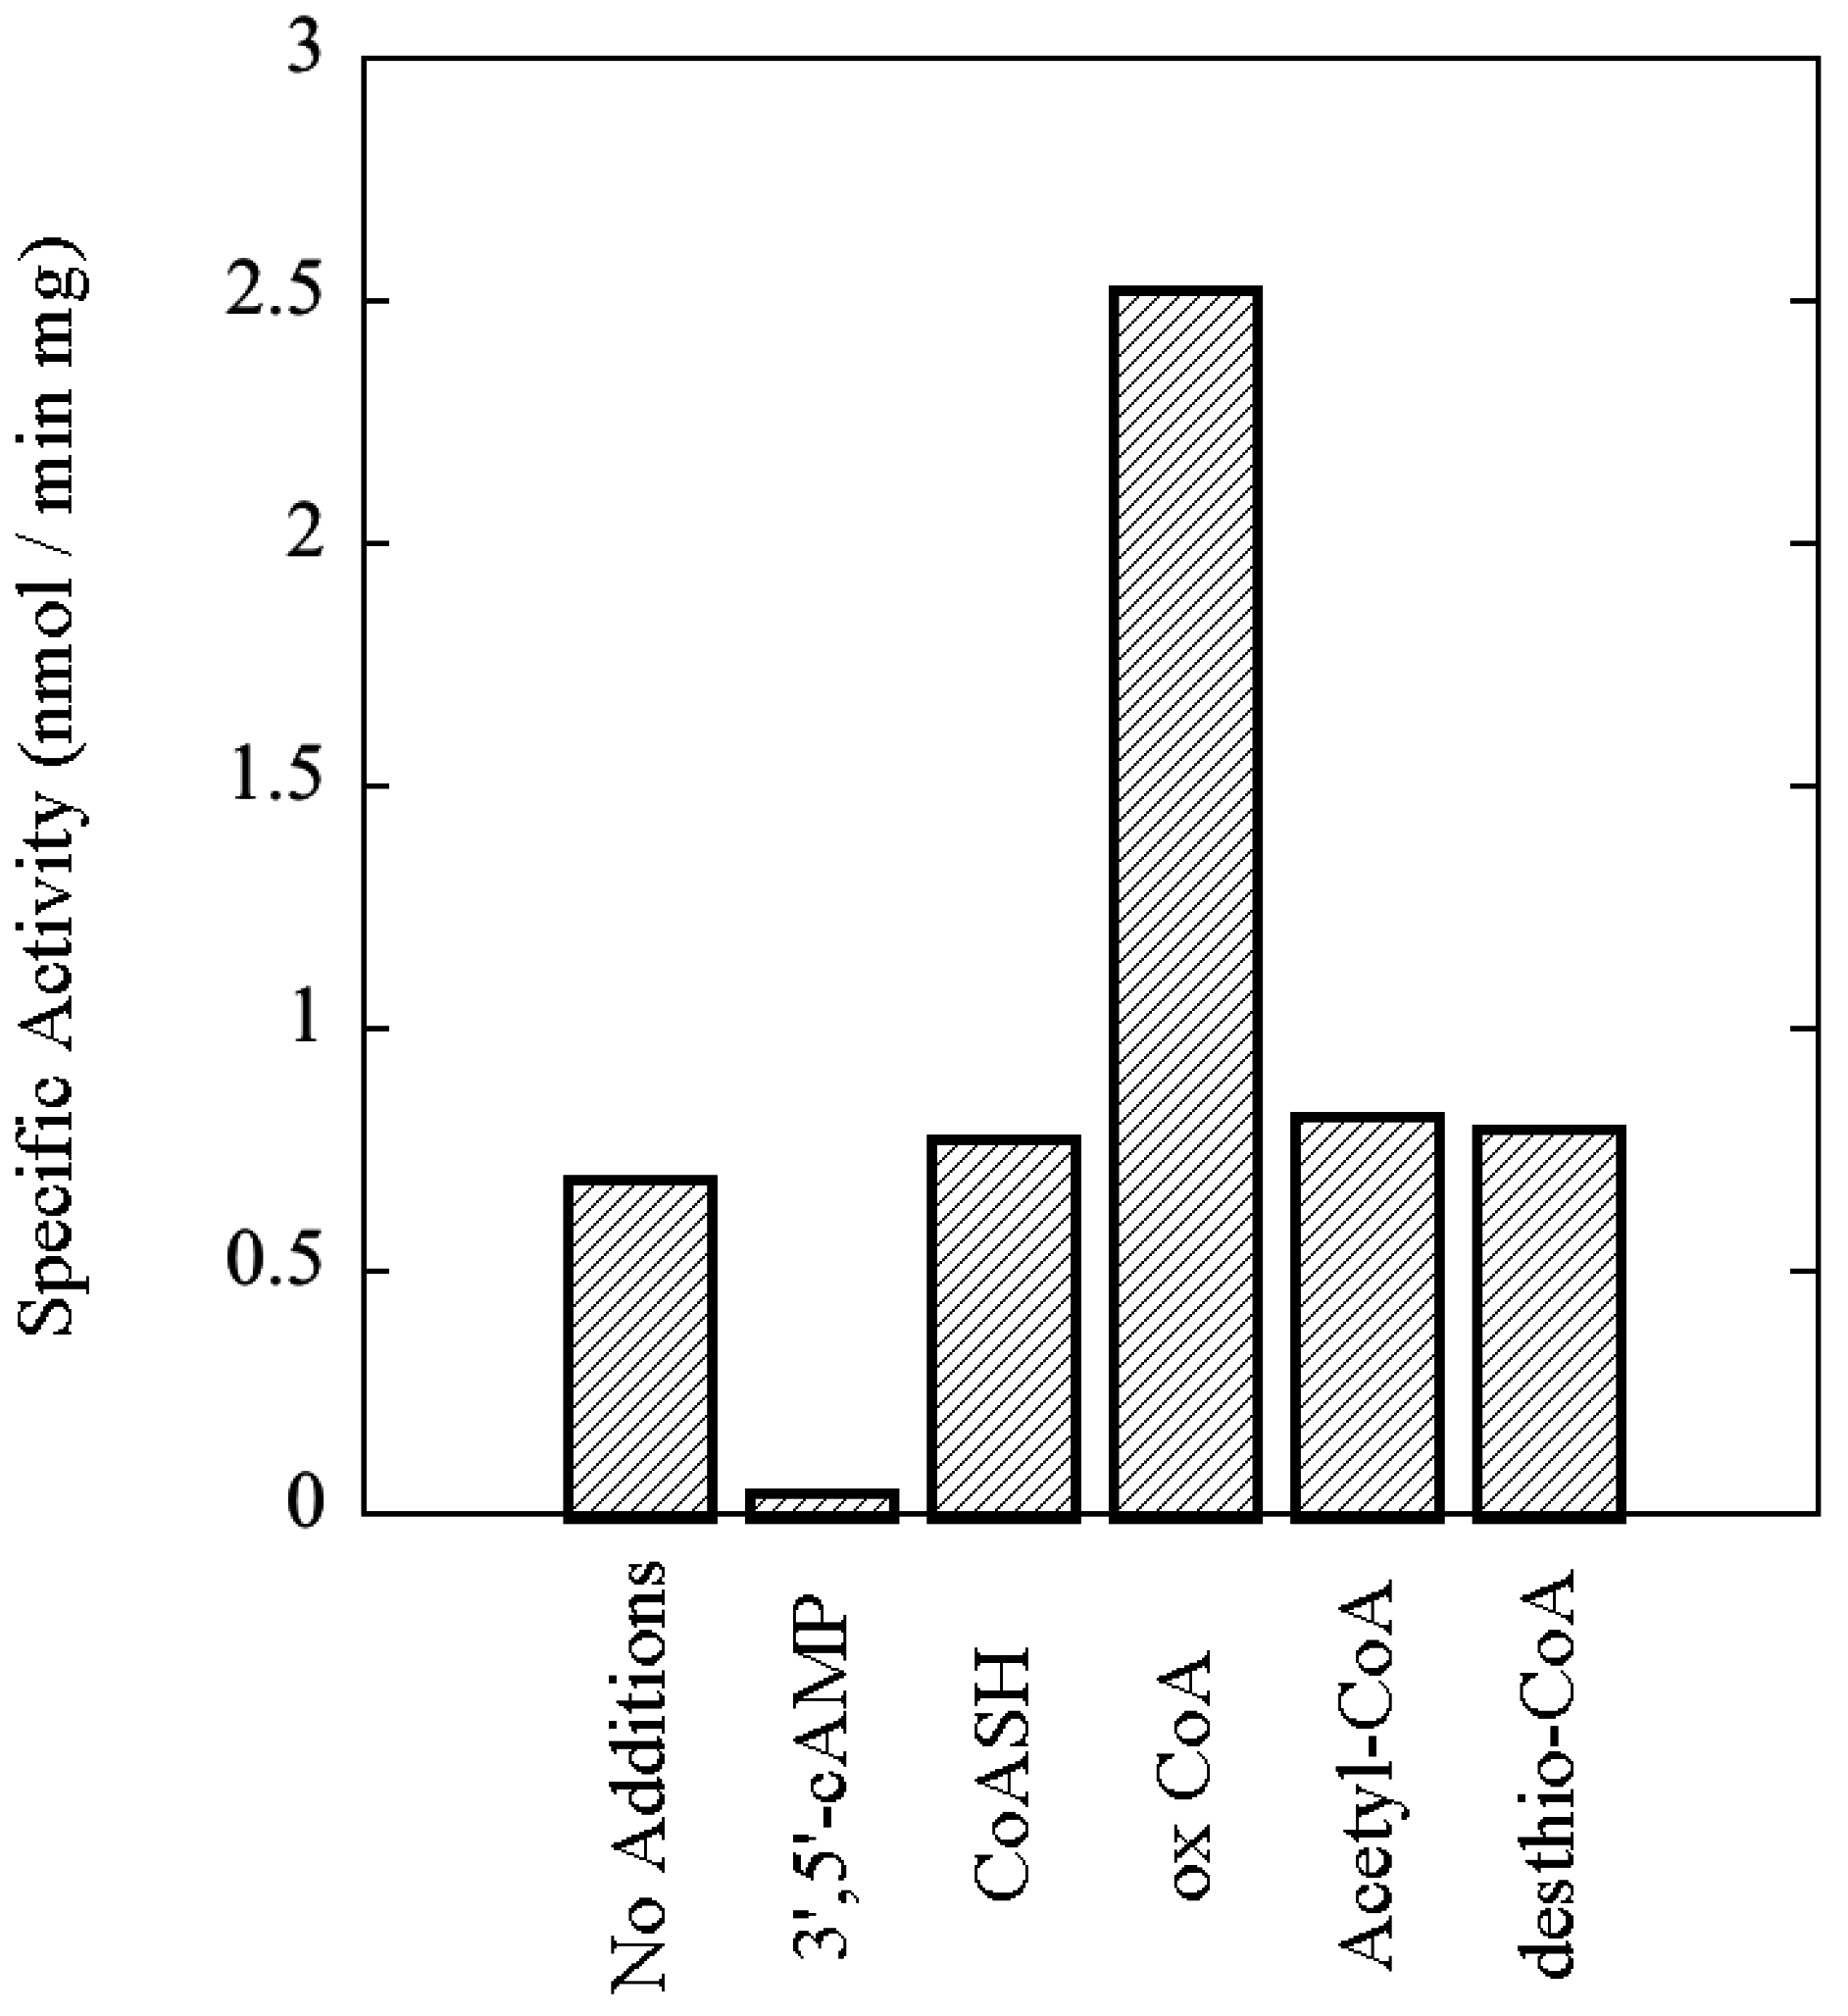
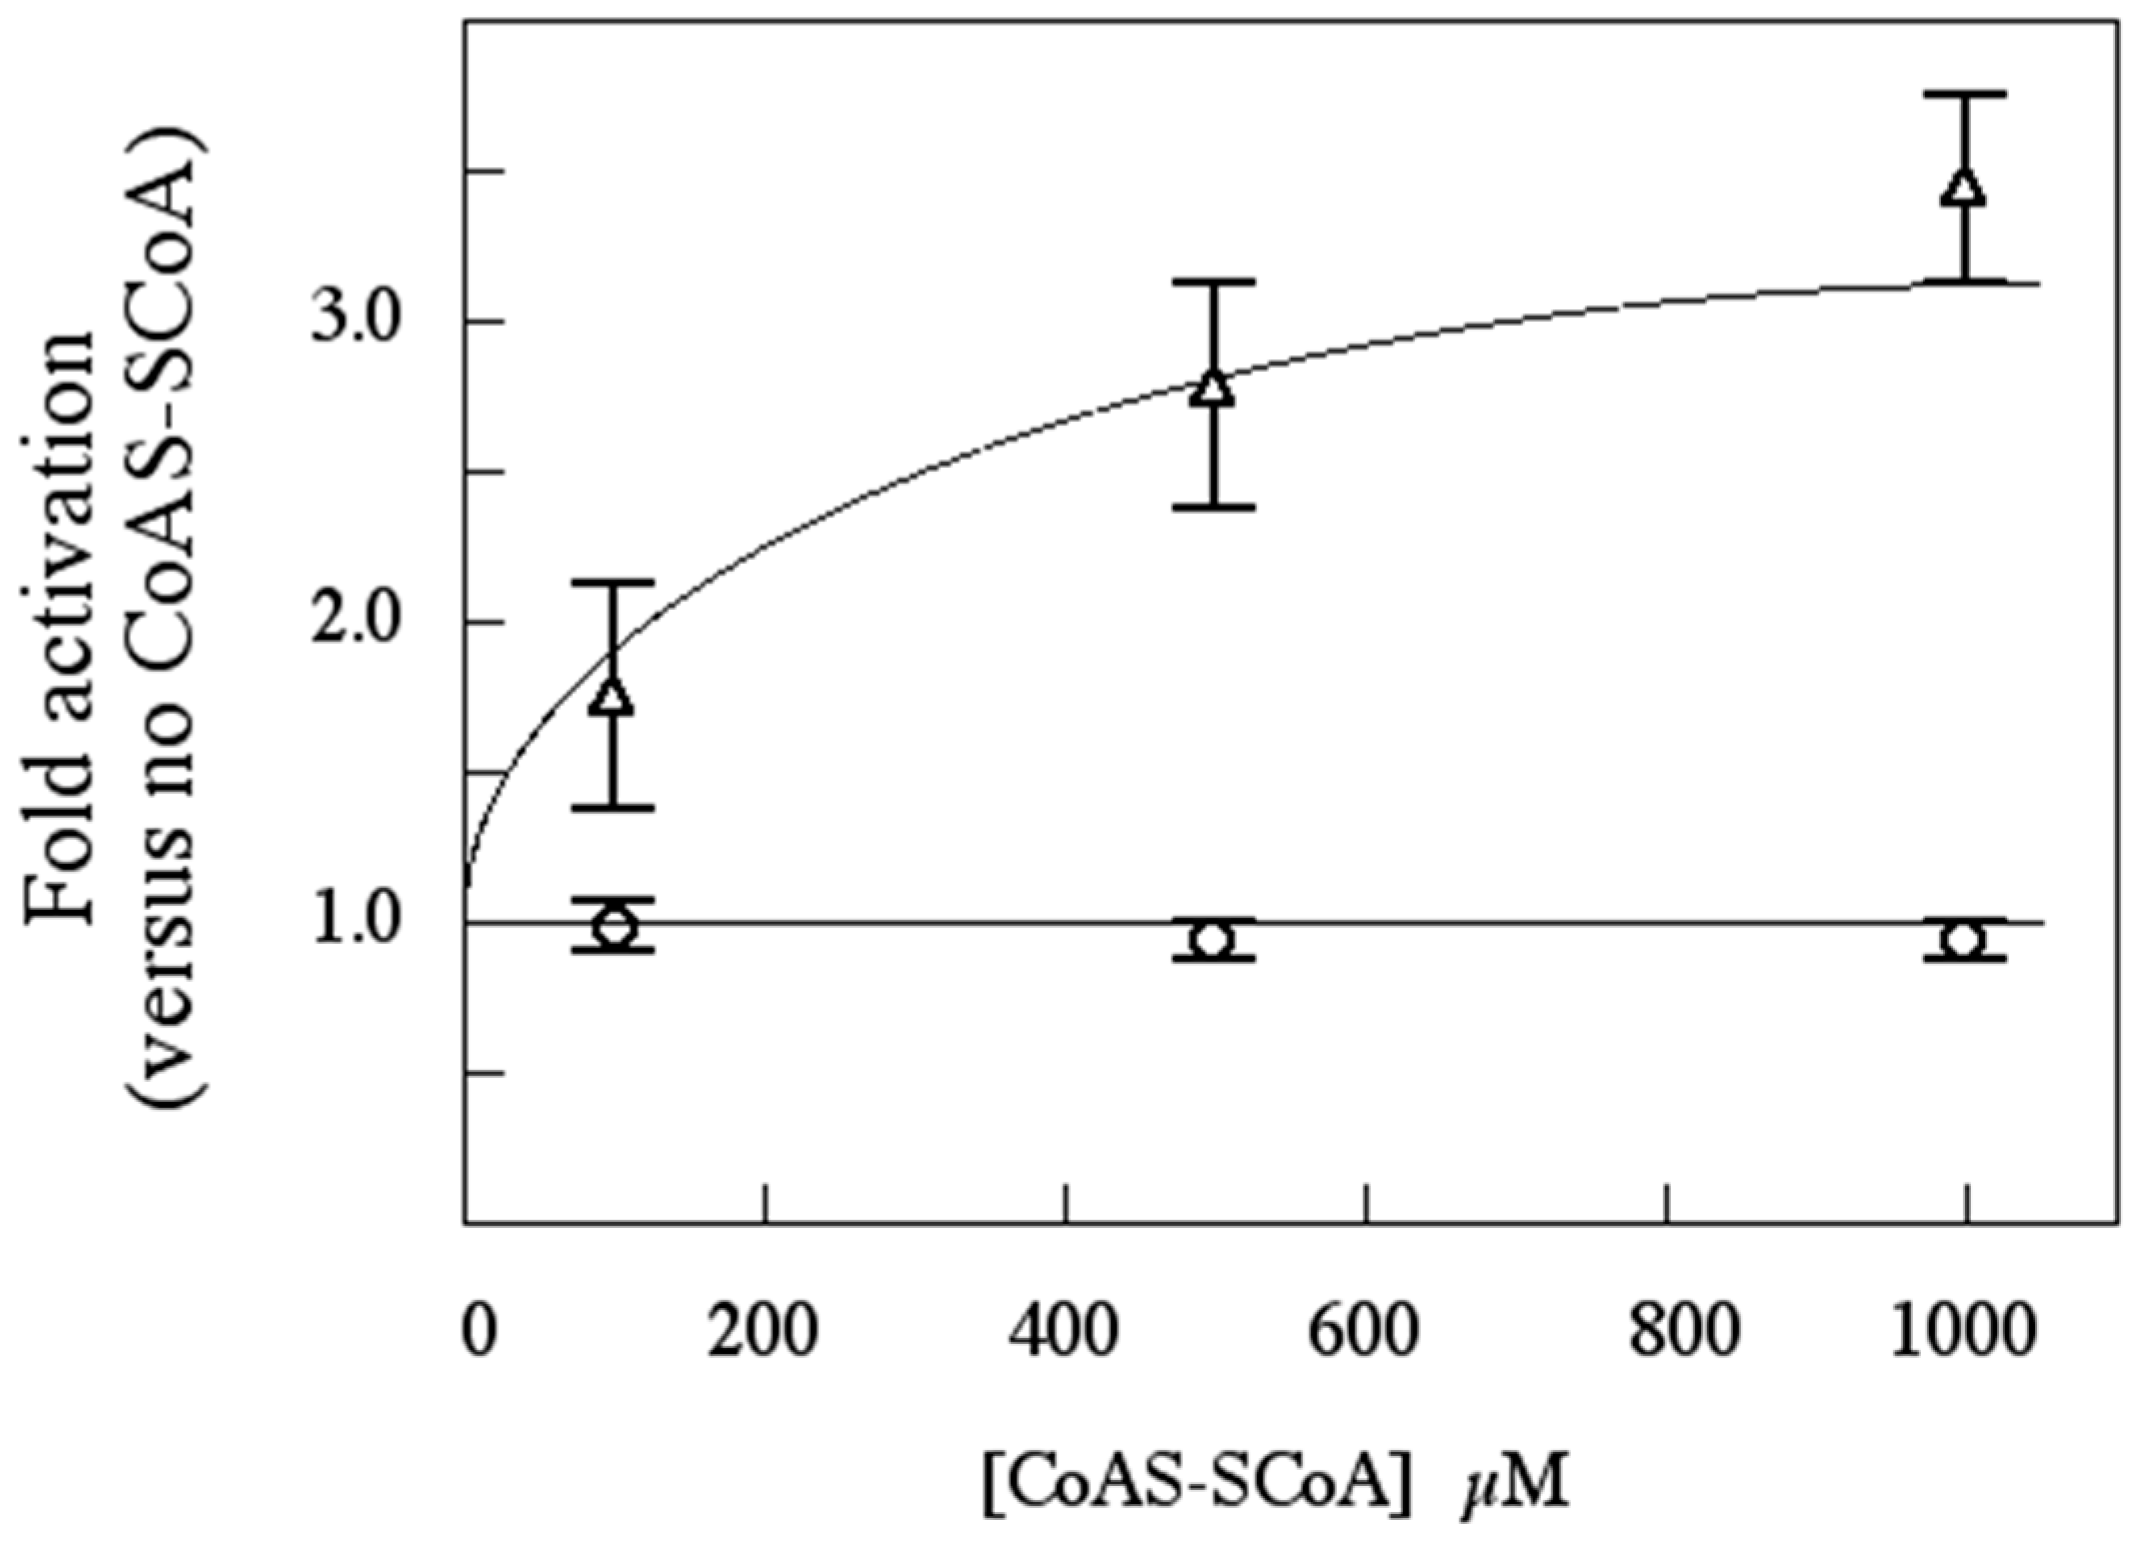
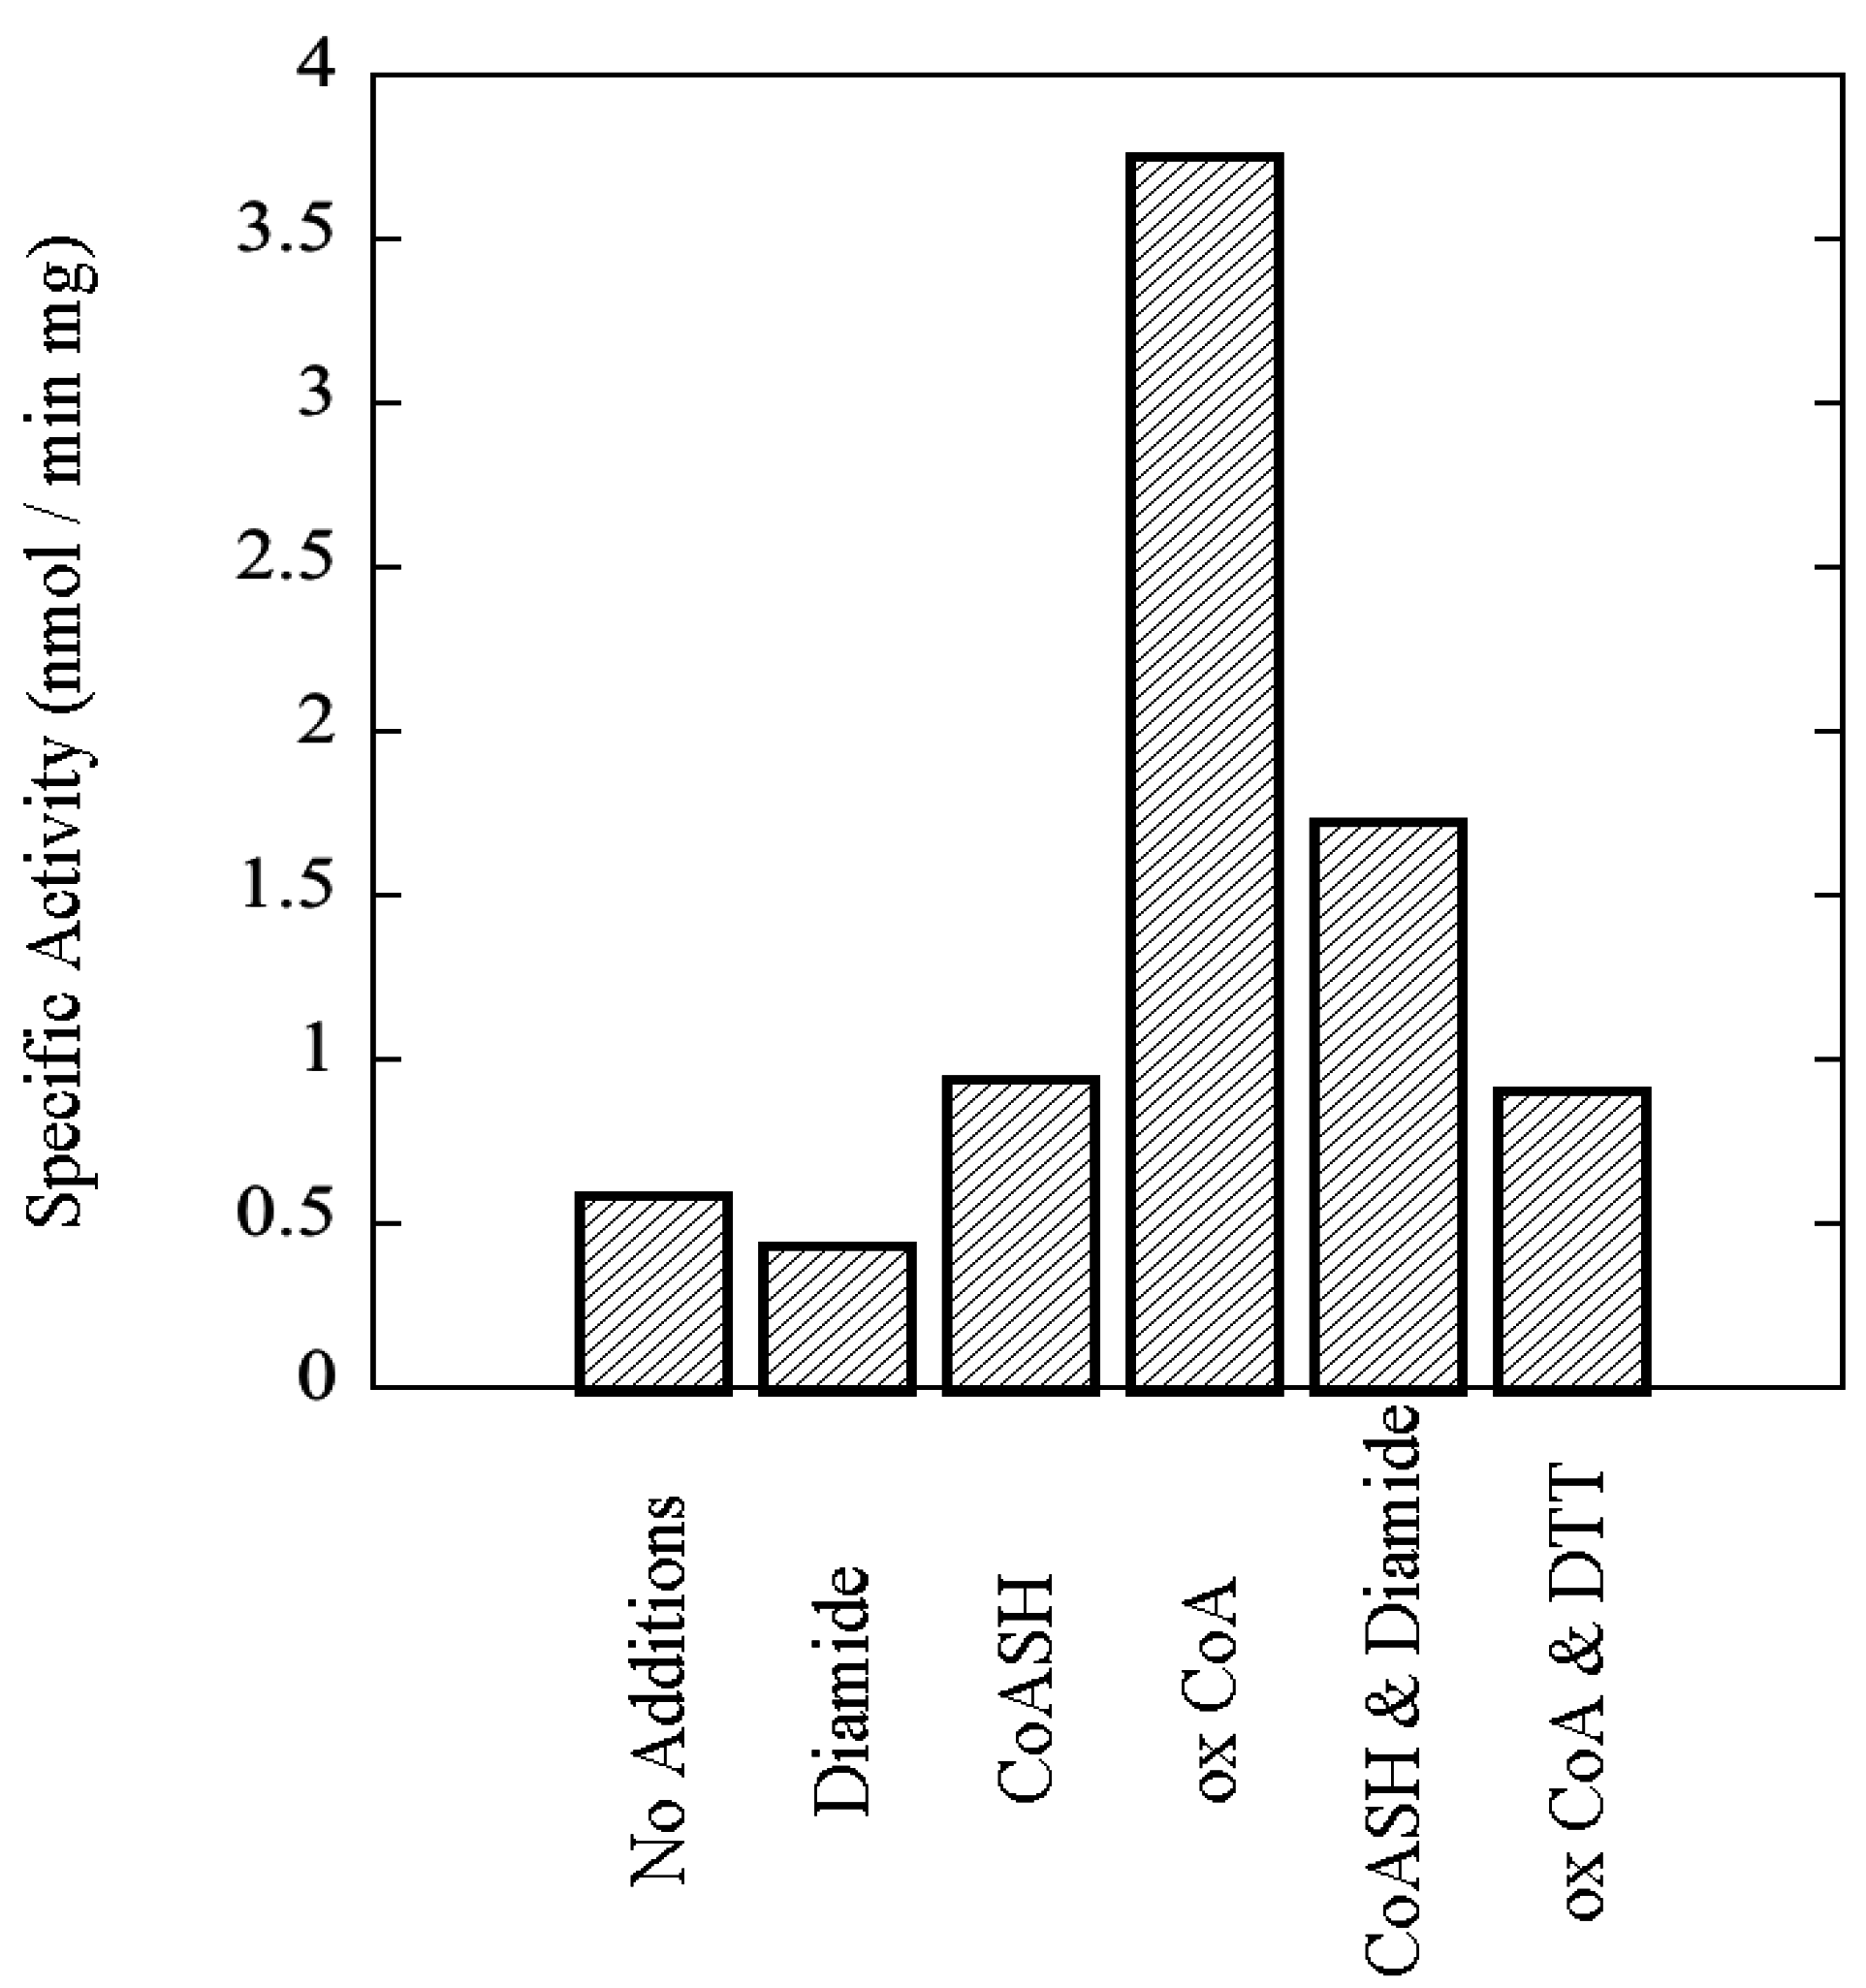
Sulfolobus solfataricus, including the effects of 3',5'-cAMP and oxidized Coenzyme A, an indicator of oxidative stress, upon its catalytic activity.
2. Experimental Section
2.1. Materials
Purchased materials included chelating Sepharose fast-flow from Amersham Biosciences (Piscataway, NJ, USA); sequencing grade trypsin from Promega (Madison, WI, USA); EDTA-free protease inhibitor cocktail from Boehringer-Mannheim (Indianapolis, IN, USA);
Pfu Turbo DNA Polymerase, BL21-CodonPlus (DE3)-RIL cells, and a Quik-Change II site-directed mutagenesis kit from Stratagene (LaJolla, CA, USA); QIAquick PCR purification and QIAprep spin miniprep kits from Qiagen (Valencia, CA, USA); expression vector pET-29b from Novagen (San Diego, CA, USA); genomic DNA from
Sulfolobus solfataricus P2 from the American Type Culture Collection (Manassas, VA, USA); OMIX C18 pipette tips from Varian Inc. (Palo Alto, CA, USA); Vivapure C18 microspin columns from VivaScience (Hanover, Germany); and histone type II-AS from calf thymus and oxidized Coenzyme A from Sigma-Aldrich (St. Louis, MO, USA).
Escherichia coli TOP10 cells and all oligonucleotides used in this study (
Table 1) were from Invitrogen (Carlsbad, CA, USA). All radiochemicals were purchased from Perkin Elmer Life Sciences (Waltham, MA, USA). Restriction enzymes were from New England Biolabs (Beverly, MA, USA). All other reagents were from Sigma-Aldrich (St. Louis, MO, USA) or Fisher Scientific (Pittsburgh, PA, USA).
Table 1.
Oligonucleotides used for this study.
Table 1.
Oligonucleotides used for this study.
| Name | Sequence (5ʹ to 3ʹ) | Purpose |
|---|
| SsoPK4/sso3182 |
| rSsoPK4 forward | AGTAATACCATGGCGATTAATCTGTTACAATAC | NcoI at M1 |
| rSsoPK4 reverse | CAGTATGTCGACTCTAAAGTAGAAAAACTCCTTTAT | SalI |
| rSsoPK4(198–635) | TTACTAACCATGGTTCCGAGCAAAGGAATACCTAG | NcoI at L197M |
| rSsoPK4(284–635) | CACCAGCCATGGTTCCGAGCAAAGGAATACCTAG | NcoI at M284 |
| rSsoPK4(320–635) | ATTTTAGCCATGGCGAACTGGGATCCTAAAGTATGGGTAGG | NcoI at M320 |
| rSsoPK4seq.fwd. | CCGAGCAAAGGAATACCTAG | sequencing |
| rSsoPK4 seq. rev. | ACATCGTTTATAGATCCACC | sequencing |
| D476A forward | GAGGGATATGTTCACTGTGCTGTAAAACCTCAAAATG | D476A |
| D476A reverse | CATTTTGAGGTTTTACAGCACAGTGAACATATCCCTC | D476A |
| K363A forward | GGGAATTTTTATGCTCTCGCGATACCGTTAATAAATTAC | K363A |
| K363A reverse | GTAATTTATTAACGGTATCGCGAGAGCATAAAAATTCCC | K363A |
| T606A forward | GAAAATACGTGGATAAAAATGCTTATCTCTTCATATCAAAAATGG | T606A |
| T606A reverse | CCATTTTTGATATGAAGAGATAAGCATTTTTATCCACGTATTTTC | T606A |
| S611A forward | GGATAAAAATACTTATCTCTTCATAGCAAAAATGGTAGATCCGG | S611A |
| S611A reverse | CCGGATCTACCATTTTTGCTATGAAGAGATAAGTATTTTTATCC | S611A |
| T606D forward | GAAAATACGTGGATAAAAATGATTATCTCTTCATATCAAAAATGG | T606D |
| T606D reverse | CCATTTTTGATATGAAGAGATAATCATTTTTTATCCACGTATTTTC | T606D |
| S611D forward | GGATAAAAATACTTATCTCTTCATAGACAAAATGGTAGATCCGG | S611D |
| S611D reverse | CCGGATCTACCATTTTGTCTATGAAGAGATAAGTATTTTTATCC | S611D |
| KKA forward | GCGTTATTATCGAGCAGAAACATAGAGCTATTAGAATTAGC | K295N/K296I |
| KKA reverse | GCTAATTCTAATAGCTCTATGTTTCTGCTCGATAATAACGC | K295N/K296I |
| KKB forward | CTATTAGAATTAGCATGTATAAACGGGTATAAGAAAGCTTG | K304I/K305N |
| KKB reverse | CAAGCTTTCTTATACCCGTTTATACATGCTAATTCTAATAG | K304I/K305N |
| KKC forward | CATGTAAAAAGGGGTATAACATAGCTTGTGAGCAGACTAAAC | K308N/K309I |
| KKC reverse | GTTTAGTCTGCTCACAAGCTATGTTATACCCCTTTTTACATG | K308N/K309I |
| S-tagT2A forward | GCCCAGATCTGGGTGCGCTGGTGCCAGCGG | T2A in S-tag |
| S-tagT2A reverse | CCGCGTGGCACCAGCGCACCAGATCTGGGC | T2A in S-tag |
| aIF2α/sso1050 |
| aIF2α forward | GGGTTACCATGGTTTACAGTAGAAGCAAACTACCCTCAG | NcoI at M1 |
| aIF2α reverse | CCTCATTTTCCGTCGACTTTCTTAACCACACTTATATCTACG | SalI |
| S262A forward | GAAGAAAACGTAGATATAGCTGTGGTTAAGAAAGTCGACAAG | S262A |
| S262A reverse | CTTGTCGACTTTCTTAACCACAGCTATATCTACGTTTTCTTC | S262A |
| S47A&S48A forward | GCCTTGGAGTGAAGTAACTACCAAATGGGTTAAGAATATAAGGG | S47A&S48A |
| S47A&S48A reverse | CCCTTATATTCTTAACCCATTTGGTAGTTACTTCACTCCAAGGC | S47A&S48A |
| S47T&S48T forward | GCCTTGGAGTGAAGTAAcTAcCAAATGGGTTAAGAATATAAGGG | S47T&S48T |
| S47T&S48T | CCCTTATATTCTTAACCCATTTGGTAGTTACTTCACTCCAAGGC | S47T&S48T |
2.2. Standard Procedures
Protein concentrations were determined by the method of Bradford [
14] using premixed reagent and a standardized solution of bovine serum albumin, both from Pierce Biotechnology, Inc. (Rockford, IL, USA). Sodium dodecyl sulfate (SDS) -polyacrylamide gel electrophoresis (PAGE) was performed as described by Laemmli [
15]. All gels were stained with Coomassie Blue as described by Fairbanks
et al. [
16]. DNA sequencing was performed by the core facility of the Virginia Bioinformatics Institute.
2.3. Cloning and Mutagenesis
Cloning, expression and purification of recombinant proteins was performed as described previously [
17]. Open reading frame (ORF)
sso3182 was amplified by PCR using 550 ng of
S. solfataricus P2 genomic DNA as template, primers rSsoPK4 forward and rSsoPK4 reverse (
Table 1), 10 pmol each, and 2.5 units of
Pfu Turbo DNA polymerase following the manufacturer’s recommendations with the exception that the reaction was supplemented with 2.5 mM MgCl
2. ORF
sso1050 was amplified using the identical procedure, with the exception that the primers used were aIF2α forward and aIF2α reverse (
Table 1). The resulting PCR products were purified using a QIAquick PCR purification kit. Purified PCR products were cloned into either the
NcoI/
SalI or
BamHI/
SalI sites (as indicated in
Table 1) of the expression vector pET-29b and the resulting plasmids used to transform competent
E. coli TOP10 cells. Several kanamycin-resistant colonies were selected and used to inoculate 3 mL portions of LB medium containing 100 µg/mL kanamycin. The cultures were incubated overnight, the cells harvested by centrifugation, and the plasmids isolated using a QIAprep spin miniprep kit according to the manufacturer’s protocols. DNA sequencing was performed to verify the presence of inserts and the fidelity of PCR amplification.
PCR products encoding N-terminally truncated versions of SsoPK4 were generated using the above procedure, with the exception that the appropriate “forward” primer was substituted for rSsoPK4 forward (
Table 1). Site-directed mutagenesis was performed using mutagenic primers listed in
Table 1 and a Quik-Change II site-directed mutagenesis kit according to the manufacturer’s protocol, with the exception that PCR reactions were supplemented with 2.5 mM MgCl
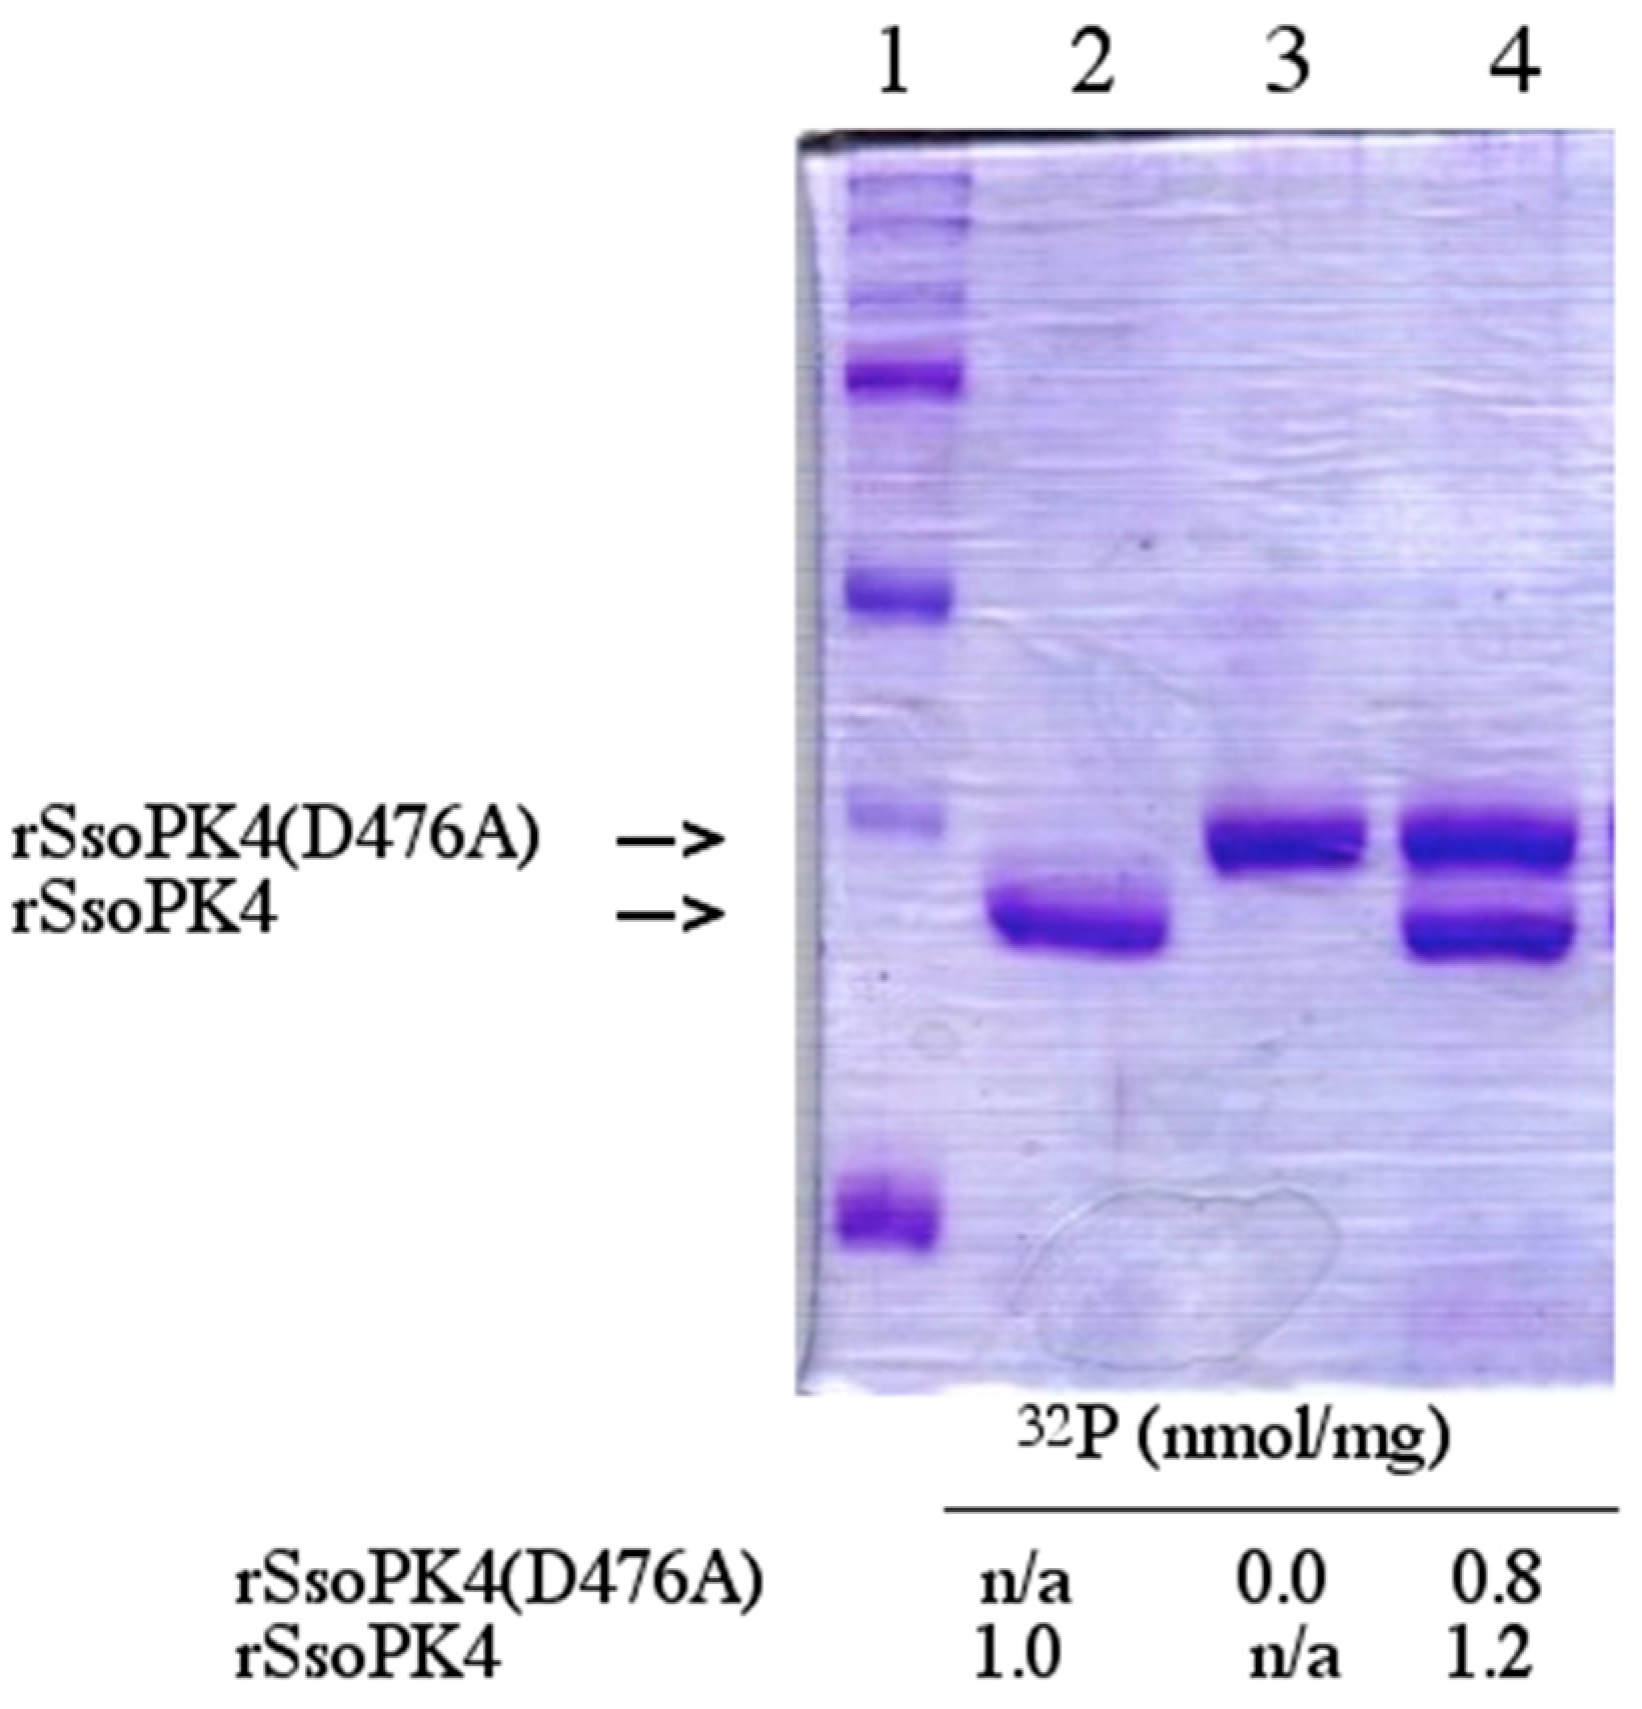
2. In order to eliminate the possibility of adventitious phosphorylation of the S-tag domain introduced by the vector, the codon for the Thr residue within it was altered to that for Ala using the primers S-tagT2A forward and S-tagT2A reverse. For assessment of trans-autophosphorylation, constructs of rSsoPK4(284–635) lacking the
S-tag were constructed by excising the insert from the original construct by incubation with
NdeI and
NcoI, filling in the resulting overhangs, and performing a blunt end ligation into the vector.
DNA encoding aIF2α (47T/48T/262A) was produced from aIF2α (s262A) using primers S47T&S48T forward and S47T&S48T reverse.
2.4. Expression and Purification of Recombinant Proteins
E. coli BL21-CodonPlus (DE3)-RIL cells were transformed with ~50 ng of the appropriate plasmid (see above) and cultured overnight at 37 °C, with shaking, in 5 mL of LB medium supplemented with 100 µg/mL kanamycin and 34 µg/mL chloramphenicol. The 5 mL culture was then used to inoculate 250 mL of LB medium supplemented with 100 µg/mL kanamycin, 34 µg/mL chloramphenicol, and 4 mM l-arginine. After incubating for 2 h at 37 °C with shaking, IPTG was added to a final concentration of 0.8 mM and the culture was incubated under the identical conditions for an additional 4 h. The cells were then harvested by centrifugation and stored at −80 °C until use.
Cell pellets were thawed on ice, then resuspended, by stirring, in 5 mL of 50 mM MOPS, pH 7.0, containing 150 mM NaCl, 20 mM imidazole, 250 µg/mL lysozyme, and EDTA-free protease inhibitor cocktail. Next, the cell suspensions were sonicated on ice 5 times, for periods of 30 s each, using a Branson Sonic Power Co. (Plainview, NY, USA) Model W185 Sonifier Cell Disruptor set on full power. The suspension was cooled on ice for one minute between each period of sonic disruption. Following sonic disruption, cell debris and any unbroken cells were removed from the crude lysate by centrifugation at 4000× g for 30 min at 4 °C. The supernatant liquid was incubated at 65 °C for 20 min, then placed on ice and allowed to cool. Precipitated proteins were removed by centrifugation at 4000× g for 20 min at 4 °C and the supernatant liquid saved.
The supernatant liquid was applied to a 1 mL column of chelating Sepharose fast-flow that had been charged with NiCl2 according to the manufacturer’s protocols and equilibrated in 50 mM MOPS, pH 7.0, containing 150 mM NaCl, and 20 mM imidazole. Following the application of the protein sample, the column was extensively washed with 25 mL of 50 mM MOPS, pH 7.0, containing 150 mM NaCl, and 20 mM imidazole. Adherent proteins were eluted by applying 5 mL of 50 mM MOPS, pH 7.0, containing 150 mM NaCl, and 500 mM imidazole. The resulting eluent was then brought to 95% saturation by the slow addition of 3.25 g ammonium sulfate with constant stirring. The solution was incubated on ice for 20 min. The mixture was then centrifuged at 10,000× g for 20 min at 4 °C and the supernatant liquid discarded. The protein pellet was dissolved in 0.5 to 1 mL of 50 mM MOPS, pH 7.0, containing 15% (v/v) glycerol and the solution divided into aliquots and stored at –80 °C until use. A 250 mL culture typically yielded 1 to 5 mg of recombinant protein.
2.5. Assay of Protein Kinase Activity
Protein kinase activity was routinely assayed by the filter paper method of Corbin and Reimann [
18] as modified by Lower and Kennelly [
19]. The final volume of the assays was typically 50 μL. The quantity of rSsoPK4 assayed ranged from 0.1 to 5.0 µg. Both MgCl
2 and MnCl
2 were included at a final concentration of 5 mM each. The final concentration of [γ-
32P]ATP was 100 μM. The specific activity of the [γ-
32P]ATP generally ranged from 2 to 5 × 10
15 cpm/mol. Phosphoacceptor proteins were generally present at a concentration of 0.5–1.0 µg/µL. The assay mixture was typically incubated for a period of 30 min to one hour at 65 °C in 50 mM MOPS pH 7.0. On occasion, the proteins within the assay mixture were resolved by SDS-PAGE in order to identify the specific polypeptides that were phosphorylated. Radiolabeled species were visualized using an Instant Imager from Packard (Downers Grove, IL, USA).
2.6. Sucrose Density Gradient Ultracentrifugation
The apparent molecular weight of rSsoPK4 was determined by sucrose density gradient ultracentrifugation via an adaptation of the method of Baxter-Gabbard [
20] using gradients formed from eleven mL of 50 mM MOPS, pH 7.0, containing an average of 10% (w/v) sucrose. rSsoPK4(284–635), 90 µg in a volume of 200 µL, was layered on top of the gradient and then centrifuged for 48 h at 109,000×
g at a temperature of 4 °C. Tubes containing the protein standards cytochrome c, ovalbumin, and bovine serum albumin—1 mg each, were run in parallel. Following centrifugation, the contents of each tube were collected as a series of fractions and protein concentrations determined by measuring OD
280 for the standards or the Bradford assay for rSsoPK4.
2.7. Phosphoamino Acid Analysis
SsoPK4: Following incubation with rSsoPK4(284–635) and [γ-
32P]ATP, the (auto)phosphorylation reaction was terminated by adding 12 µL of 4X Laemmli sample buffer and heating at 100 °C for 5 min. Proteins were then separated by SDS-PAGE and sections containing individual phosphoproteins excised and phosphoamino acid content analyzed following the method of Kamps and Sefton [
21].
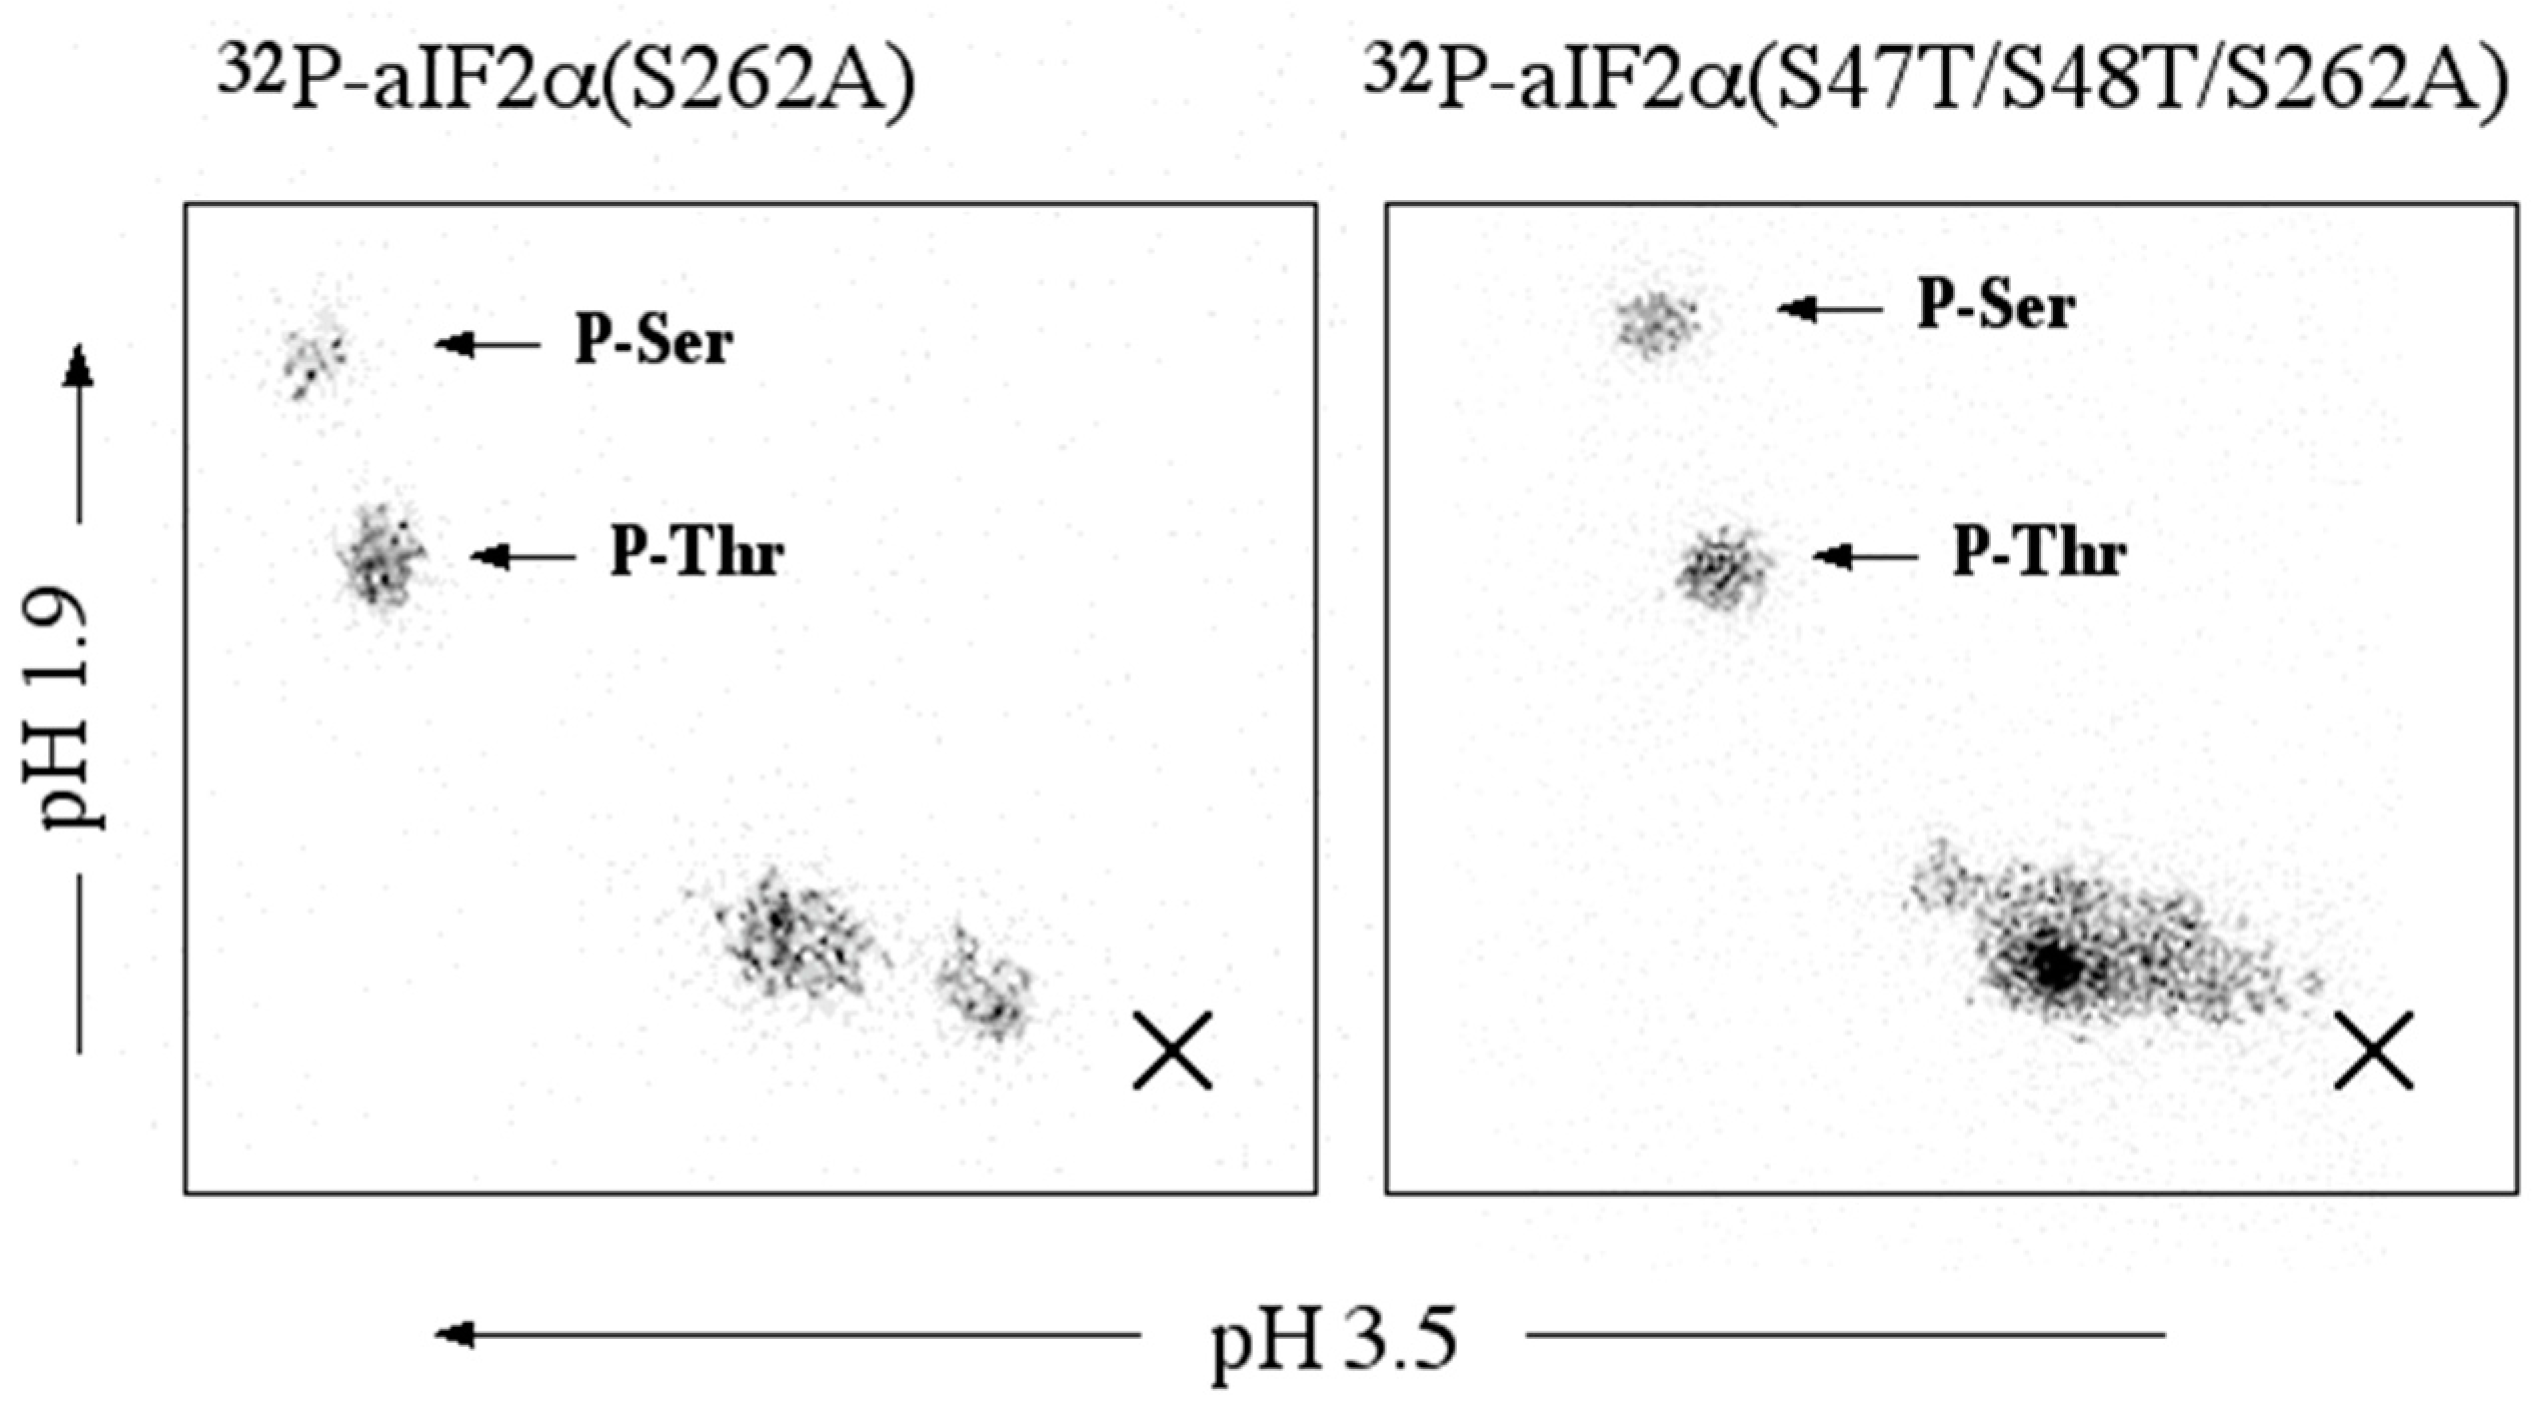
aIF2α: aIF2α, aIF2α (S262A), or aIF2α (S47T/S48T/S262A), 8.4 µg, were incubated for 45 min, at 65 °C in 36 µL of 50 mM MOPS, pH 7.0, containing 0.6 µg of rSsoPK4(284–635), 5 mM MgCl2, 5 mM MnCl2, and 30 µM [γ-32P]ATP. The specific radioactivity of the [γ-32P]ATP was ~3 × 10¹⁶ cpm/mol. At the end of the incubation period, 12 µL of 4X Laemmli sample buffer was added and the samples processed as described for SsoPK4.
2.8. Generation of Tryptic Peptides for MS Analysis
For
32P-labeled phosphoproteins from SDS-PAGE, trypsin digestion was conducted in gel as described previously [
17] with the exception that the reduction and alkylation steps were omitted and the recovery of tryptic peptides was improved by extraction using 2 volumes of 0.5% (v/v) TFA followed by agitation in a sonicating water bath for 15 min. The supernatant liquid was collected by centrifugation and added to the original digest solution. The extraction process was repeated using two volumes of 0.5% (v/v) TFA containing 20% (v/v) acetonitrile, then 0.5% (v/v) TFA containing 40% (v/v) acetonitrile and finally with 0.5% (v/v) TFA containing 60% (v/v) acetonitrile and extracts pooled.
For rSsoPK4(284–635) and aIF2α, the proteins were (auto)phosphorylated as described in
Section 2.7, above, with the exception that the final volume was increased to 200 µL and radiolabel was omitted. Reaction was terminated by the addition of four volumes of ice-cold methanol. The mixture was cooled at −80 °C for two hours and precipitated protein then collected by centrifugation at 12,000×
g for 3 min. The resultant pellet was washed twice with ice-cold methanol, air dried, then resuspended in freshly prepared 100 mM ammonium bicarbonate and digested. Sequencing-grade trypsin was added and proteolytic cleavage conducted as previously described [
17].
The tryptic digests were then applied to an aluminum hydroxide column following the metal oxide affinity chromatography to enrich for phosphorylated peptides as described in
Section 2.8 of Wolschin
et al. [
22]. TFA, 5% (v/v) was added to the predicted phosphopeptide fraction to a final concentration of 0.5% (v/v) and the pH adjusted to below 3.0 using 98% (v/v) formic acid. The acidified mixture was applied to a set of VivaPure C18 microspin columns and processed as described by the manufacturer with the exception that the columns were subject to 3 to 5 final washes with 5% (v/v) formic acid containing 2% (v/v) methanol to remove TFA. Adherent peptides were then eluted from the column with 5% (v/v) formic acid in 95% (v/v) methanol. Dilute samples were air dried to near dryness, then resuspended in approximately 5 µL of 5% (v/v) formic acid in 50% (v/v) methanol using a sonicating water bath for 15 min.
2.9. Clean-Up of Tryptic Peptides Using C18 Material
Salt removal from tryptic peptides utilized either OMIX C18 tips from Varian Inc. (Palo Alto, CA, USA) for those isolated from polyacrylamide gel slices or VivaPure C18 microspin columns from VivaScience (Hanover, Germany) for those isolated using metal oxide affinity chromatography. Following incubation in a 65 °C heat block for approximately 30 min to remove the acetonitrile, samples were adjusted to 0.5% TFA using 5% TFA. Where required, the pH was adjusted to below 3 using 98% formic acid.
Both the tips and the microspin columns were used as described by their respective manufacturers except for the following modifications to remove the TFA prior to mass spectrometric analysis. Following the aqueous washes containing TFA, the tip or column was washed 3 to 5 times using 5% formic acid in 2% methanol. Peptides were recovered by elution with 5% formic acid in 95% methanol. Dilute samples were air dried to near dryness followed by resuspension of the sample in approximately 5 microliters of 5% (v/v) formic acid in 50% (v/v) methanol and sonication in a sonicating water bath for 15 min.
2.10. Analysis of Tryptic Peptides by Mass Spectrometry
Mass spectrometric analysis was conducted utilizing a Finnigan TSQ Quantum Ultra AM mass spectrometer (Thermo Electron Corp., West Palm Beach, FL, USA) equipped with a nano-electrospray source from Proxeon (Odense, Denmark). A few microliters of sample mixture were loaded into a metal-coated borosilicate emitter tip (Proxeon, Odense, Denmark) that was then inserted into the source head. The sample was then delivered to the mass spectrometer by applying sufficient pressure via a glass syringe connected to the source head to see liquid at the tip of the emitter. Set-up and use of the nanospray source and mass spectrometer were as recommended by their respective manufacturers. Spray voltage was typically 650 to 750 V and the capillary temperature was 200 °C. Data were acquired using the Quantum Tune Master in positive ion mode in the profile state. Typically, MS data were collected for five minutes while scanning the first quadrapole with a 0.7 peak width from 450 to 1500 m/z using a 1.45 s scan time.
The QualBrowser application of the Xcalibur software was used to average the data. From this averaged MS data, random multiply-charged peaks, typically the most intense, were chosen for MS/MS analysis. MS/MS data were collected for 1–2 min using a 0.7 peak width on both quadrapoles 1 and 3 using a 1.45 s scan time and a range from 50 to 1500 m/z. Quadrapole 2 CID gas was set at 1.5 mTorr and collision energy was adjusted manually for optimum fragmentation—typically from 25 to 45 eV. Again the QualBrowser application of Xcalibur was used to average the data and generate a peak list. The peak list was edited using Microsoft Excel to remove noise (retaining only the 300–500 most intense peaks and removing the parent ion when necessary) and Microsoft Notepad and/or Microsoft Wordpad to add the required header information for subsequent searching using Mascot and merging MS/MS data from the same sample together into one text file.
The resulting peak lists were analyzed using Matrix Science’s (Boston, MA, USA) Mascot MS/MS ions search. Searches were conducted using the default instrument setting and parameters corresponding to trypsin digestion with up to two possible missed cleavages, an average peptide mass tolerance of ±2 Da, and a fragment ion mass tolerance of ±0.8 Da. The variable modification parameters selected included phosphorylation of threonine and serine residues and oxidation of methionine. The probability based MOWSE score for individual ions is −10 × Log(P), where P is the probability that the observed match is a random event. Protein scores are derived from ions scores as a non-probabilistic basis for ranking protein hits [
23]. All search results were verified manually.
For identification of the third site of autophosphorylation in rSsoPK4(284–635), 5% (v/v) was added directly to the tryptic digest to a final concentration of 0.5% (v/v) and the pH was adjusted to below 3.0 using 98% (v/v) formic acid. The acidified mixture was loaded into the autosampler of a Tempo NanoMDLC (Applied Biosystems, Foster City, CA, USA). Portions, 2 µL, of the acidified digest were loaded onto a 300 µm × 5 mm (5 micron particles with 100 angstrom pores) C18 PepMap 100 precolumn (Dionex, Sunnyvale, CA) at flow rate of 20 µL/min and the column washed for 10 min with a 95:5 mixture of solvent A, which consisted of 2% (v/v) HPLC-grade acetonitrile and 0.1% (v/v) formic acid in HPLC grade water and solvent B, which consists of 98% (v/v) HPLC-grade acetonitrile containing 0.1% (v/v) formic acid. After the precolumn was washed, it was placed in series with a 75 µm × 50 mm (5 micron particles with 300 angstrom pores) ProteoPep 2 column (New Objective Inc., Woburn, MA, USA) and the columns developed at a flow rate of 0.25 µL/min as follows: 95:5 solvent A: solvent B for 10 min; a linear increase to 80:20 solvent A: solvent B over five minutes; a linear increase to 65:35 solvent A: solvent B over a period of 15 min; a linear increase to 5:95 solvent A: solvent B over 5 min; then 95% (v/v) solvent B for two minutes before returning to the initial conditions of 5:95 solvent A: solvent B. Portions of the eluent were introduced into 4000 Q-Trap Mass Spectrometer via a MicroIonSpray II nanospray source (both Applied Biosystems, Foster City, CA, USA). The mass spectrometer program consisted of a repeating cycle starting with an enhanced MS (EMS) scan in positive mode from 400 to 1500 utilizing a 5 ms trap fill time and a scan speed of 4000 amu/s. This scan was followed by an enhanced resolution (ER) scan of the three most intense ions with an intensity above 300,000 cps to better estimate the m/z value of the ion and to help determine the charge state of the ion from its isotopic distribution. The ER scan used a dynamic fill time and a scan speed of 250 amu/s. Ions determined by the ER scan to possess a charge state of +2, +3 or +4 (or an indeterminate charge state) were then subject to an enhanced product ion (EPI) scan. EPI scans utilized a dynamic fill time, a scan speed of 4000 amu/s and a rolling collision energy calculated based upon the m/z and charge state of the ion. The mass spectrometry software, Analyst 1.4.2 (AB SCIEX, Framingham, MA, USA.), was used to generate text files containing the peak lists corresponding to the EPI scans performed by the mass spectrometer. The resulting peak lists were analyzed using Matrix Science’s (Boston, MA, USA) Mascot MS/MS ions search essentially as described above.


