Next Issue
Volume 7, July
Previous Issue
Volume 7, May


Climate, Volume 7, Issue 6 (June 2019) – 12 articles

Cover Story (view full-size image): 
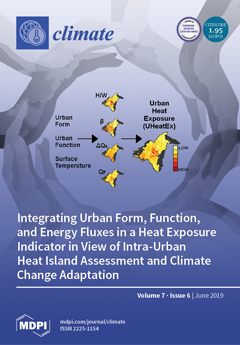
Thermal indicators have the potential to identify the most thermally vulnerable areas within cities in view of climate-sensitive planning. In this research, the Urban Heat Exposure (UHeatEx) indicator is proposed, incorporating the three-dimensional and dynamic characteristics of the urban thermal landscape. UHeatEx integrates the most important governing forces of the urban heat island: the canyon aspect ratio, the Bowen ratio, the storage heat flux, and the anthropogenic heat emissions. It is derived using remote sensing and GIS techniques, in conjunction with meteorological and inventory data. UHeatEx is found to better highlight the strong intra-urban thermal variability of the study area than the well-established Local Climate Zones scheme, taken that the latter is by-design focused on more universally applicable thermal classes. View this paper.
  • Issues are regarded as officially published after their release is announced to the table of contents alert mailing list.
  • You may sign up for e-mail alerts to receive table of contents of newly released issues.
  • PDF is the official format for papers published in both, html and pdf forms. To view the papers in pdf format, click on the "PDF Full-text" link, and use the free Adobe Reader to open them.
Order results
Result details
Section
Select all
Export citation of selected articles as:
25 pages, 6684 KiB  
Article
The Effect of Agulhas Eddies on Absorption and Transport of Anthropogenic Carbon in the South Atlantic Ocean
by Iole B. M. Orselli, Catherine Goyet, Rodrigo Kerr, José L. L. de Azevedo, Moacyr Araujo, Felippe Galdino, Franck Touratier and Carlos A. E. Garcia
Climate 2019, 7(6), 84; https://doi.org/10.3390/cli7060084 - 18 Jun 2019
Cited by 10 | Viewed by 4847
Abstract
The South Atlantic Ocean is currently undergoing significant alterations due to climate change. This region is important to the global carbon cycle, but marine carbon data are scarce in this basin. Additionally, this region is influenced by Agulhas eddies. However, their effects on [...] Read more.
The South Atlantic Ocean is currently undergoing significant alterations due to climate change. This region is important to the global carbon cycle, but marine carbon data are scarce in this basin. Additionally, this region is influenced by Agulhas eddies. However, their effects on ocean biogeochemistry are not yet fully understood. Thus, we aimed to model the carbonate parameters in this region and investigate the anthropogenic carbon (Cant) content in 13 eddies shed by the Agulhas retroflection. We used in situ data from the CLIVAR/WOCE/A10 section to elaborate total dissolved inorganic carbon (CT) and total alkalinity (AT) models and reconstruct those parameters using in situ data from two other Brazilian initiatives. Furthermore, we applied the Tracer combining Oxygen, inorganic Carbon, and total Alkalinity (TrOCA) method to calculate the Cant, focusing on the 13 identified Agulhas eddies. The CT and AT models presented root mean square errors less than 1.66 and 2.19 μmol kg−1, indicating Global Ocean Acidification Observing Network climate precision. The Cant content in the Agulhas eddies was 23% higher than that at the same depths of the surrounding waters. We observed that Agulhas eddies can play a role in the faster acidification of the South Atlantic Central Water. Full article
(This article belongs to the Special Issue Ocean Warming, Acidification and Deoxygenation)
Show Figures

Figure 1

20 pages, 4294 KiB  
Article
Solar Irradiance and Temperature Variability and Projected Trends Analysis in Burundi
by Agnidé Emmanuel Lawin, Marc Niyongendako and Célestin Manirakiza
Climate 2019, 7(6), 83; https://doi.org/10.3390/cli7060083 - 12 Jun 2019
Cited by 17 | Viewed by 5569
Abstract
This paper assessed the variability and projected trends of solar irradiance and temperature in the East of Burundi. Observed temperature from meteorological stations and the MERRA-2 data set provided by NASA/Goddard Space Flight Center are used over the historical period 1976–2005. In addition, [...] Read more.
This paper assessed the variability and projected trends of solar irradiance and temperature in the East of Burundi. Observed temperature from meteorological stations and the MERRA-2 data set provided by NASA/Goddard Space Flight Center are used over the historical period 1976–2005. In addition, solar irradiance data provided by SoDa database were considered. Furthermore, projection data from eight Regional Climate Models were used over the periods 2026–2045 and 2066–2085. The variability analysis was performed using a standardized index. Projected trends and changes in the future climate were respectively detected through Mann-Kendall and t-tests. The findings over the historical period revealed increase temperature and decrease in solar irradiance over the last decades of the 20th century. At a monthly scale, the variability analysis showed that excesses in solar irradiance coincide with the dry season, which led to the conclusion that it may be a period of high production for solar energy. In the future climate, upward trends in temperature are expected over the two future periods, while no significant trends are forecasted in solar irradiance over the entire studied region. However, slight decreases and significant changes in solar irradiance have been detected over all regions. Full article
Show Figures

Figure 1

25 pages, 3731 KiB  
Article
An Investigation into the Spatial and Temporal Variability of the Meteorological Drought in Jordan
by Haitham Aladaileh, Mohammed Al Qinna, Barta Karoly, Emad Al-Karablieh and János Rakonczai
Climate 2019, 7(6), 82; https://doi.org/10.3390/cli7060082 - 11 Jun 2019
Cited by 22 | Viewed by 5546
Abstract
Following the impact of droughts witnessed during the last decade there is an urgent need to develop a drought management strategy, policy framework, and action plan for Jordan. This study aims to provide a historical baseline using the standardized precipitation index (SPI) and [...] Read more.
Following the impact of droughts witnessed during the last decade there is an urgent need to develop a drought management strategy, policy framework, and action plan for Jordan. This study aims to provide a historical baseline using the standardized precipitation index (SPI) and meteorological drought maps, and to investigate the spatial and temporal trends using long-term historical precipitation records. Specifically, this study is based on the statistical analysis of 38 years of monthly rainfall data, gathered from all 29 meteorological stations that cover Jordan. The Mann–Kendall test and linear regression analysis were used to uncover evidence of long-term trends in precipitation. Drought indices were used for calculating the meteorological SPI on an annual (SPI12), 6-months (SPI6), and 3-months basis (SPI3). At each level, every drought event was characterized according to its duration, interval, and intensity. Then, drought maps were generated using interpolation kriging to investigate the spatial extent of drought events, while drought patterns were temporally characterized using multilinear regression and spatial grouped using the hierarchical clustering technique. Both annual and monthly trend analyses and the Mann–Kendall test indicated significant reduction of precipitation in time for all weather stations except for Madaba. The rate of decrease is estimated at approximately 1.8 mm/year for the whole country. The spatial SPI krig maps that were generated suggest the presence of two drought types in the spatial dimension: Local and national. Local droughts reveal no actual observed trends or repeatable patterns of occurrence. However, looking at meteorological droughts across all time scales indicated that Jordan is facing an increasing number of local droughts. With a probability of occurrence of once every two years to three years. On the other hand, extreme national droughts occur once every 15 to 20 years and last for two or more consecutive years. Linear trends indicated significant increase in drought magnitude by time with a rate of 0.02 (p < 0.0001). Regression analysis indicated that draught in Jordan is time dependent (p < 0.001) rather than being spatially dependent (p > 0.99). Hierarchical clustering was able to group national draughts into three zones, namely the northern zone, the eastern zone, and the southern zone. This study highlights the urgent need for a monitoring program to investigate local and national drought impacts on all sectors, as well as the development of a set of proactive risk management measures and preparedness plans for various physiographic regions. Full article
(This article belongs to the Special Issue From Local to Global Precipitation Dynamics and Climate Interaction)
Show Figures

Figure 1

32 pages, 3807 KiB  
Article
Ushering in the New Era of Radiometric Intercomparison of Multispectral Sensors with Precision SNO Analysis
by Mike Chu and Jennifer Dodd
Climate 2019, 7(6), 81; https://doi.org/10.3390/cli7060081 - 10 Jun 2019
Cited by 3 | Viewed by 2545
Abstract
A “nadir-only” framework of the radiometric intercomparison of multispectral sensors using simultaneous nadir overpasses (SNOs) is examined at the 1-km regimes and below using four polar-orbiting multispectral sensors: the twin MODerate-resolution Imaging Spectroradiometer (MODIS) in the Terra and Aqua satellites, the Visible Imaging [...] Read more.
A “nadir-only” framework of the radiometric intercomparison of multispectral sensors using simultaneous nadir overpasses (SNOs) is examined at the 1-km regimes and below using four polar-orbiting multispectral sensors: the twin MODerate-resolution Imaging Spectroradiometer (MODIS) in the Terra and Aqua satellites, the Visible Imaging Infrared Radiometer Suite (VIIRS) in the Suomi National Polar-orbiting Partnership (SNPP) satellite, and the Ocean and Land Colour Instrument (OLCI) in the Sentinel-3A satellite. The study is carried out in the context of isolating the on-orbit calibration of the reflective solar bands (RSBs) under the “nadir-only” restriction. With a homogeneity-ranked, sample size constrained procedure designed to minimize scene-based variability and noise, the overall approach successfully stabilizes the radiometric ratio and tightens the precision of each SNO-generated comparison event. Improvements to the multiyear comparison time series are demonstrated for different conditions of area size, sample size, and other refinements. The time series demonstrate the capability at 1% precision or better under general conditions but can attain as low as 0.2% in best cases. Solar zenith angle is examined not to be important in the “nadir-only” framework, but the spectral mismatch between two bands can give rise to significant yearly modulation in the comparison time series. A broad-scaled scene-based variability of ~2%, the “scaling phenomenon”, is shown to have pervasive presence in both northern and the southern polar regions to impact inter-RSB comparison. Finally, this paper highlights the multi-instrument cross-comparisons that are certain to take on a more important role in the coming era of high-performing multispectral instruments. Full article
(This article belongs to the Special Issue Climate Variability and Change in the 21th Century)
Show Figures

Figure 1

13 pages, 1954 KiB  
Article
FCVLP: A Fuzzy Random Conditional Value-at-Risk-Based Linear Programming Model for Municipal Solid Waste Management
by Donglin Wang, Xiangming Kong, Shan Zhao and Yurui Fan
Climate 2019, 7(6), 80; https://doi.org/10.3390/cli7060080 - 06 Jun 2019
Cited by 4 | Viewed by 3239
Abstract
A fuzzy random conditional value-at-risk-based linear programming (FCVLP) model was proposed in this study for dealing with municipal solid waste (MSW) management problems under uncertainty. FCVLP improves upon the existing fuzzy linear programming and fuzzy random conditional value-at-risk methods by allowing analysis of [...] Read more.
A fuzzy random conditional value-at-risk-based linear programming (FCVLP) model was proposed in this study for dealing with municipal solid waste (MSW) management problems under uncertainty. FCVLP improves upon the existing fuzzy linear programming and fuzzy random conditional value-at-risk methods by allowing analysis of the risks of violating constraints that contain fuzzy parameters. A long-term MSW management problem was used to illustrate the applicability of FCVLP. The optimal feasibility solutions under various significance risk levels could be generated in order to analysis the trade-offs among the system cost, the feasibility degree of capacity constraints, and the risk level of waste-disposal-demand constraints. The results demonstrated that (1) a lower system cost may lead to a lower feasibility of waste-facility-capacity constraint and a higher risk of waste-disposal-demand constraint; (2) effects on system cost from vague information in incinerator capacity inputs would be greater than those in landfill capacity inputs; (3) the total allowable waste allocation would vary significantly because of the variations of risk levels and feasibility degrees. The proposed FCVLP method could be used to identify optimal waste allocation scenarios associated with a variety of complexities in MSW management systems. Full article
(This article belongs to the Special Issue Environment Pollution and Climate Change)
Show Figures

Figure 1

13 pages, 1520 KiB  
Article
Light Energy Partitioning under Various Environmental Stresses Combined with Elevated CO2 in Three Deciduous Broadleaf Tree Species in Japan
by Mitsutoshi Kitao, Hiroyuki Tobita, Satoshi Kitaoka, Hisanori Harayama, Kenichi Yazaki, Masabumi Komatsu, Evgenios Agathokleous and Takayoshi Koike
Climate 2019, 7(6), 79; https://doi.org/10.3390/cli7060079 - 03 Jun 2019
Cited by 10 | Viewed by 5552
Abstract
Understanding plant response to excessive light energy not consumed by photosynthesis under various environmental stresses, would be important for maintaining biosphere sustainability. Based on previous studies regarding nitrogen (N) limitation, drought in Japanese white birch (Betula platyphylla var. japonica), and elevated [...] Read more.
Understanding plant response to excessive light energy not consumed by photosynthesis under various environmental stresses, would be important for maintaining biosphere sustainability. Based on previous studies regarding nitrogen (N) limitation, drought in Japanese white birch (Betula platyphylla var. japonica), and elevated O3 in Japanese oak (Quercus mongolica var. crispula) and Konara oak (Q. serrata) under future-coming elevated CO2 concentrations, we newly analyze the fate of absorbed light energy by a leaf, partitioning into photochemical processes, including photosynthesis, photorespiration and regulated and non-regulated, non-photochemical quenchings. No significant increases in the rate of non-regulated non-photochemical quenching (JNO) were observed in plants grown under N limitation, drought and elevated O3 in ambient or elevated CO2. This suggests that the risk of photodamage caused by excessive light energy was not increased by environmental stresses reducing photosynthesis, irrespective of CO2 concentrations. The rate of regulated non-photochemical quenching (JNPQ), which contributes to regulating photoprotective thermal dissipation, could well compensate decreases in the photosynthetic electron transport rate through photosystem II (JPSII) under various environmental stresses, since JNPQ+JPSII was constant across the treatment combinations. It is noteworthy that even decreases in JNO were observed under N limitation and elevated O3, irrespective of CO2 conditions, which may denote a preconditioning-mode adaptive response for protection against further stress. Such an adaptive response may not fully compensate for the negative effects of lethal stress, but may be critical for coping with non-lethal stress and regulating homeostasis. Regarding the three deciduous broadleaf tree species, elevated CO2 appears not to influence the plant responses to environmental stresses from the viewpoint of susceptibility to photodamage. Full article
(This article belongs to the Special Issue Air Pollution and Plant Ecosystems)
Show Figures

Figure 1

23 pages, 2030 KiB  
Article
The Evolution of Climate Changes in Portugal: Determination of Trend Series and Its Impact on Forest Development
by Leonel J. R. Nunes, Catarina I. R. Meireles, Carlos J. Pinto Gomes and Nuno M. C. Almeida Ribeiro
Climate 2019, 7(6), 78; https://doi.org/10.3390/cli7060078 - 01 Jun 2019
Cited by 16 | Viewed by 5942
Abstract
Climate changes are a phenomenon that can affect the daily activities of rural communities, with particular emphasis on those directly dependent on the agricultural and forestry sectors. In this way, the present work intends to analyse the impact that climate changes have on [...] Read more.
Climate changes are a phenomenon that can affect the daily activities of rural communities, with particular emphasis on those directly dependent on the agricultural and forestry sectors. In this way, the present work intends to analyse the impact that climate changes have on forest risk assessment, namely on how the occurrence of rural fires are affecting the management of the forest areas and how the occurrence of these fires has evolved in the near past. Thus, a comparative analysis of the data provided by IPMA (Portuguese Institute of the Sea and the Atmosphere), was carried out for the period from 2001 to 2017 with the climatic normal for the period between 1971 to 2000, for the variables of the average air temperature, and for the precipitation. In this comparative study, the average monthly values were considered and the months in which anomalies occurred were determined. Anomalies were considered in the months in which the average air temperature varied by 1 °C than the value corresponding to the climatic norm, in at least 50% of the national territory. The same procedure was repeated for the variable precipitation, counting as anomaly the occurrence of a variation in precipitation of 50%, also in 50% of the national territory. Then the calculation of the moving averages for cycles of 3, 5 and 7 periods were applied, and the trend lines were projected. Subsequently, the relationship between the results obtained and the occurrence of rural fires as well as the spatial distribution of forest area, species and structure were analyzed. From the results obtained it was possible to confirm the existence of a tendency for the occurrence of climatic anomalies, highlighting the occurrence of an increasing number of months with temperatures higher by at least 1 °C. It was possible to foresee the relation between the occurrence of rural fires and the periods of anomaly and absence of precipitation. From the results obtained it is also possible to infer that, analyzing the tendency for these phenomena to occur, it can be necessary to change the “critical period of rural fires”, since it is verified that what is currently in use does not covers the entire period where anomalies occur and where large-scale rural fires potentially can happen. Full article
(This article belongs to the Special Issue Climate Change, Carbon Budget and Energy Policy)
Show Figures

Figure 1

16 pages, 3118 KiB  
Article
Atmospheric and Ocean Dynamics May Explain Cycles in Oceanic Oscillations
by Knut L. Seip and Øyvind Grøn
Climate 2019, 7(6), 77; https://doi.org/10.3390/cli7060077 - 29 May 2019
Cited by 3 | Viewed by 3062
Abstract
What causes cycles in oceanic oscillations, and is there a change in the characteristics of oscillations in around 1950? Characteristics of oceanic cycles and their sources are important for climate predictability. We here compare cycles generated in a simple model with observed oceanic [...] Read more.
What causes cycles in oceanic oscillations, and is there a change in the characteristics of oscillations in around 1950? Characteristics of oceanic cycles and their sources are important for climate predictability. We here compare cycles generated in a simple model with observed oceanic cycles in the great oceans: The North Atlantic Oscillation (NAO), El Niño, the Southern Oscillation Index (SOI), and the Pacific Decadal Oscillation (PDO). In the model, we let a stochastic movement in one oceanic oscillation cause a similar but lagging movement in another oceanic oscillation. The two interacting oscillations show distinct cycle lengths depending upon how strongly one oscillation creates lagging cycles in the other. The model and observations both show cycles around two to six, 13 to 16, 22 to 23, and 31 to 32 years. The ultimate cause for the distinct cycles is atmospheric and oceanic “bridges” that connect the ocean basins, but the distinct pattern in cycle lengths is determined by properties of statistical distributions. We found no differences in the leading or lagging strength between well separated basins (the North Atlantic and the Pacific) and overlapping ocean basins (both in the Pacific). The cyclic pattern before 1950 appears to be different from the cyclic pattern after 1950. Full article
(This article belongs to the Special Issue The North Atlantic Ocean Dynamics and Climate Change)
Show Figures

Figure 1

14 pages, 4105 KiB  
Case Report
Estimating the Future Function of the Nipsa Reservoir due to Climate Change and Debris Sediment Factors
by Fotios Maris, Apostolos Vasileiou, Panagiotis Tsiamantas and Panagiotis Angelidis
Climate 2019, 7(6), 76; https://doi.org/10.3390/cli7060076 - 28 May 2019
Cited by 3 | Viewed by 2915
Abstract
The constantly growing human needs for water aiming to supply urban areas or for energy production or irrigation purposes enforces the application of practices leading to its saving. The construction of dams has been continuously increasing in recent years, aiming at the collection [...] Read more.
The constantly growing human needs for water aiming to supply urban areas or for energy production or irrigation purposes enforces the application of practices leading to its saving. The construction of dams has been continuously increasing in recent years, aiming at the collection and storage of water in the formed reservoirs. The greatest challenge that reservoirs face during their lifetime is the sedimentation caused by debris and by the effects of climate change on water harvesting. The paper presents an investigation on the amount, the position and the height of the debris ending up at the Nipsa reservoir. The assessment of the debris volume produced in the drainage basin was conducted by a geographical information system (GIS) based model, named TopRunDF, also used to predict the sedimentation area and the sediment deposition height in the sedimentation cone. The impact of climate change to the reservoir storage capacity is evaluated with the use of a water balance model triggered by the HadCM2, ECHAM4, CSIRO-MK2, CGCM1, CCSR-98 climate change models. The results predict a significant future decrease in the stored water volume of the reservoir, and therefore several recommendations are proposed for the proper future functioning and operation of the reservoir. Full article
(This article belongs to the Special Issue Impact of Climate-Change on Water Resources)
Show Figures

Figure 1

28 pages, 6123 KiB  
Article
Integrating Urban Form, Function, and Energy Fluxes in a Heat Exposure Indicator in View of Intra-Urban Heat Island Assessment and Climate Change Adaptation
by Ilias Agathangelidis, Constantinos Cartalis and Mat Santamouris
Climate 2019, 7(6), 75; https://doi.org/10.3390/cli7060075 - 28 May 2019
Cited by 23 | Viewed by 6566
Abstract
Cities worldwide are getting warmer due to the combined effects of urban heat and climate change. To this end, local policy makers need to identify the most thermally vulnerable areas within cities. The Local Climate Zone (LCZ) scheme highlights local-scale variations; however, its [...] Read more.
Cities worldwide are getting warmer due to the combined effects of urban heat and climate change. To this end, local policy makers need to identify the most thermally vulnerable areas within cities. The Local Climate Zone (LCZ) scheme highlights local-scale variations; however, its classes, although highly valuable, are to a certain extent generalized in order to be universally applicable. High spatial resolution indicators have the potential to better reflect city-specific challenges; in this paper, the Urban Heat Exposure (UHeatEx) indicator is developed, integrating the physical processes that drive the urban heat island (UHI). In particular, the urban form is modeled using remote sensing and geographical information system (GIS) techniques, and used to estimate the canyon aspect ratio and the storage heat flux. The Bowen ratio is calculated using the aerodynamic resistance methodology and downscaled remotely sensed surface temperatures. The anthropogenic heat flux is estimated via a synergy of top–down and bottom–up inventory approaches. UHeatEx is applied to the city of Athens, Greece; it is correlated to air temperature measurements and compared to the LCZs classification. The results reveal that UHeatEx has the capacity to better reflect the strong intra-urban variability of the thermal environment in Athens, and thus can be supportive for adaptation responses. High-resolution climate projections from the EURO-CORDEX ensemble for the region show that the adverse effects of the existing thermal inequity are expected to worsen in the coming decades. Full article
(This article belongs to the Special Issue Urban Heat Islands)
Show Figures

Figure 1

16 pages, 986 KiB  
Article
Factors that Influence Climate Change Mitigation and Adaptation Action: A Household Study in the Nuevo Leon Region, Mexico
by Dulce Liliana González-Hernández, Erik W. Meijles and Frank Vanclay
Climate 2019, 7(6), 74; https://doi.org/10.3390/cli7060074 - 28 May 2019
Cited by 13 | Viewed by 9909
Abstract
Household-level mitigation and adaptation actions are important because households make a significant contribution to greenhouse gas emissions and are severely affected by climate change. However, there is still very little understanding of the factors that influence household-level mitigation and adaptation action. From a [...] Read more.
Household-level mitigation and adaptation actions are important because households make a significant contribution to greenhouse gas emissions and are severely affected by climate change. However, there is still very little understanding of the factors that influence household-level mitigation and adaptation action. From a review of literature, we identified the factors that potentially influence climate mitigation and adaptation actions of households, which we then tested using survey data from 622 households in Nuevo Leon, Mexico. Nuevo Leon is a major emitter of greenhouse gasses and is a state where climate-related disasters are recurrent and expected to increase in frequency and severity. Results from ordinal regression analyses showed that perceived knowledge and financial self-efficacy greatly influenced the extent of household-level action taken. To a lesser extent, the age and educational level of the respondent also affected action. Respondents pointed out the need to know about different aspects of climate change. An implication of our study is the value of recognizing the importance of perceptions, as mitigation and adaptation actions are shaped by perceptions of climate change alongside socio-demographic characteristics. This may have significant implications for policies and campaigns promoting household-level action to increase resilience to climate change. Full article
(This article belongs to the Special Issue Environment Pollution and Climate Change)
Show Figures

Figure 1

20 pages, 6642 KiB  
Article
Mesoscale Convective Systems: A Case Scenario of the ‘Heavy Rainfall’ Event of 15–20 January 2013 over Southern Africa
by Modise Wiston and Kgakgamatso Marvel Mphale
Climate 2019, 7(6), 73; https://doi.org/10.3390/cli7060073 - 28 May 2019
Cited by 6 | Viewed by 4101
Abstract
Southern east Africa is prone to some extreme weather events and interannual variability of the hydrological cycle, including tropical cyclones and heavy rainfall events. Most of these events occur during austral summer and are linked to shifts in the intertropical convergence zone, changes [...] Read more.
Southern east Africa is prone to some extreme weather events and interannual variability of the hydrological cycle, including tropical cyclones and heavy rainfall events. Most of these events occur during austral summer and are linked to shifts in the intertropical convergence zone, changes in El Niño Southern Oscillation signatures, sea surface temperature and sea level pressure. A typical example include mesoscale convective systems (MCSs) that occur between October and March along the eastern part, adjacent to the warm waters of Mozambique Channel and Agulhas Current. In this study we discuss a heavy rainfall event over southern Africa, focusing particularly on the period 15–20 January 2013, the period during which MCSs were significant over the subcontinent. This event recorded one of the historic rainfalls due to extreme flooding and overflows, loss of lives and destruction of economic and social infrastructure. An active South Indian Convergence Zone was associated with the rainfall event sustained by a low-level trough linked to a Southern Hemisphere planetary wave pattern and an upper-level ridge over land. In addition, also noteworthy is a seemingly strong connection to the strength of the African Easterly Jet stream. Using rainfall data, satellite imagery and re-analysis (model processed data combined with observations) data, our analysis indicates that there was a substantial relation between rainfall totals recorded/observed and the presence of MCSs. The low-level trough and upper-level ridge contributed to moisture convergence, particularly from tropical South East Atlantic Ocean, which in turn contributed to the prolonged life span of the rainfall event. Positive temperature anomalies favored the substantial contribution of moisture fluxes from the Atlantic Ocean. This study provides a contextual assessment of rainfall processes and insight into the physical control mechanisms and feedback of large-scale convective interactions over tropical southern Africa. Full article
Show Figures

Figure 1

Previous Issue
Next Issue
Back to TopTop