
Geospatial Modeling for Investigating Spatial Pattern and Change Trend of Temperature and Rainfall


Abstract
:1. Introduction
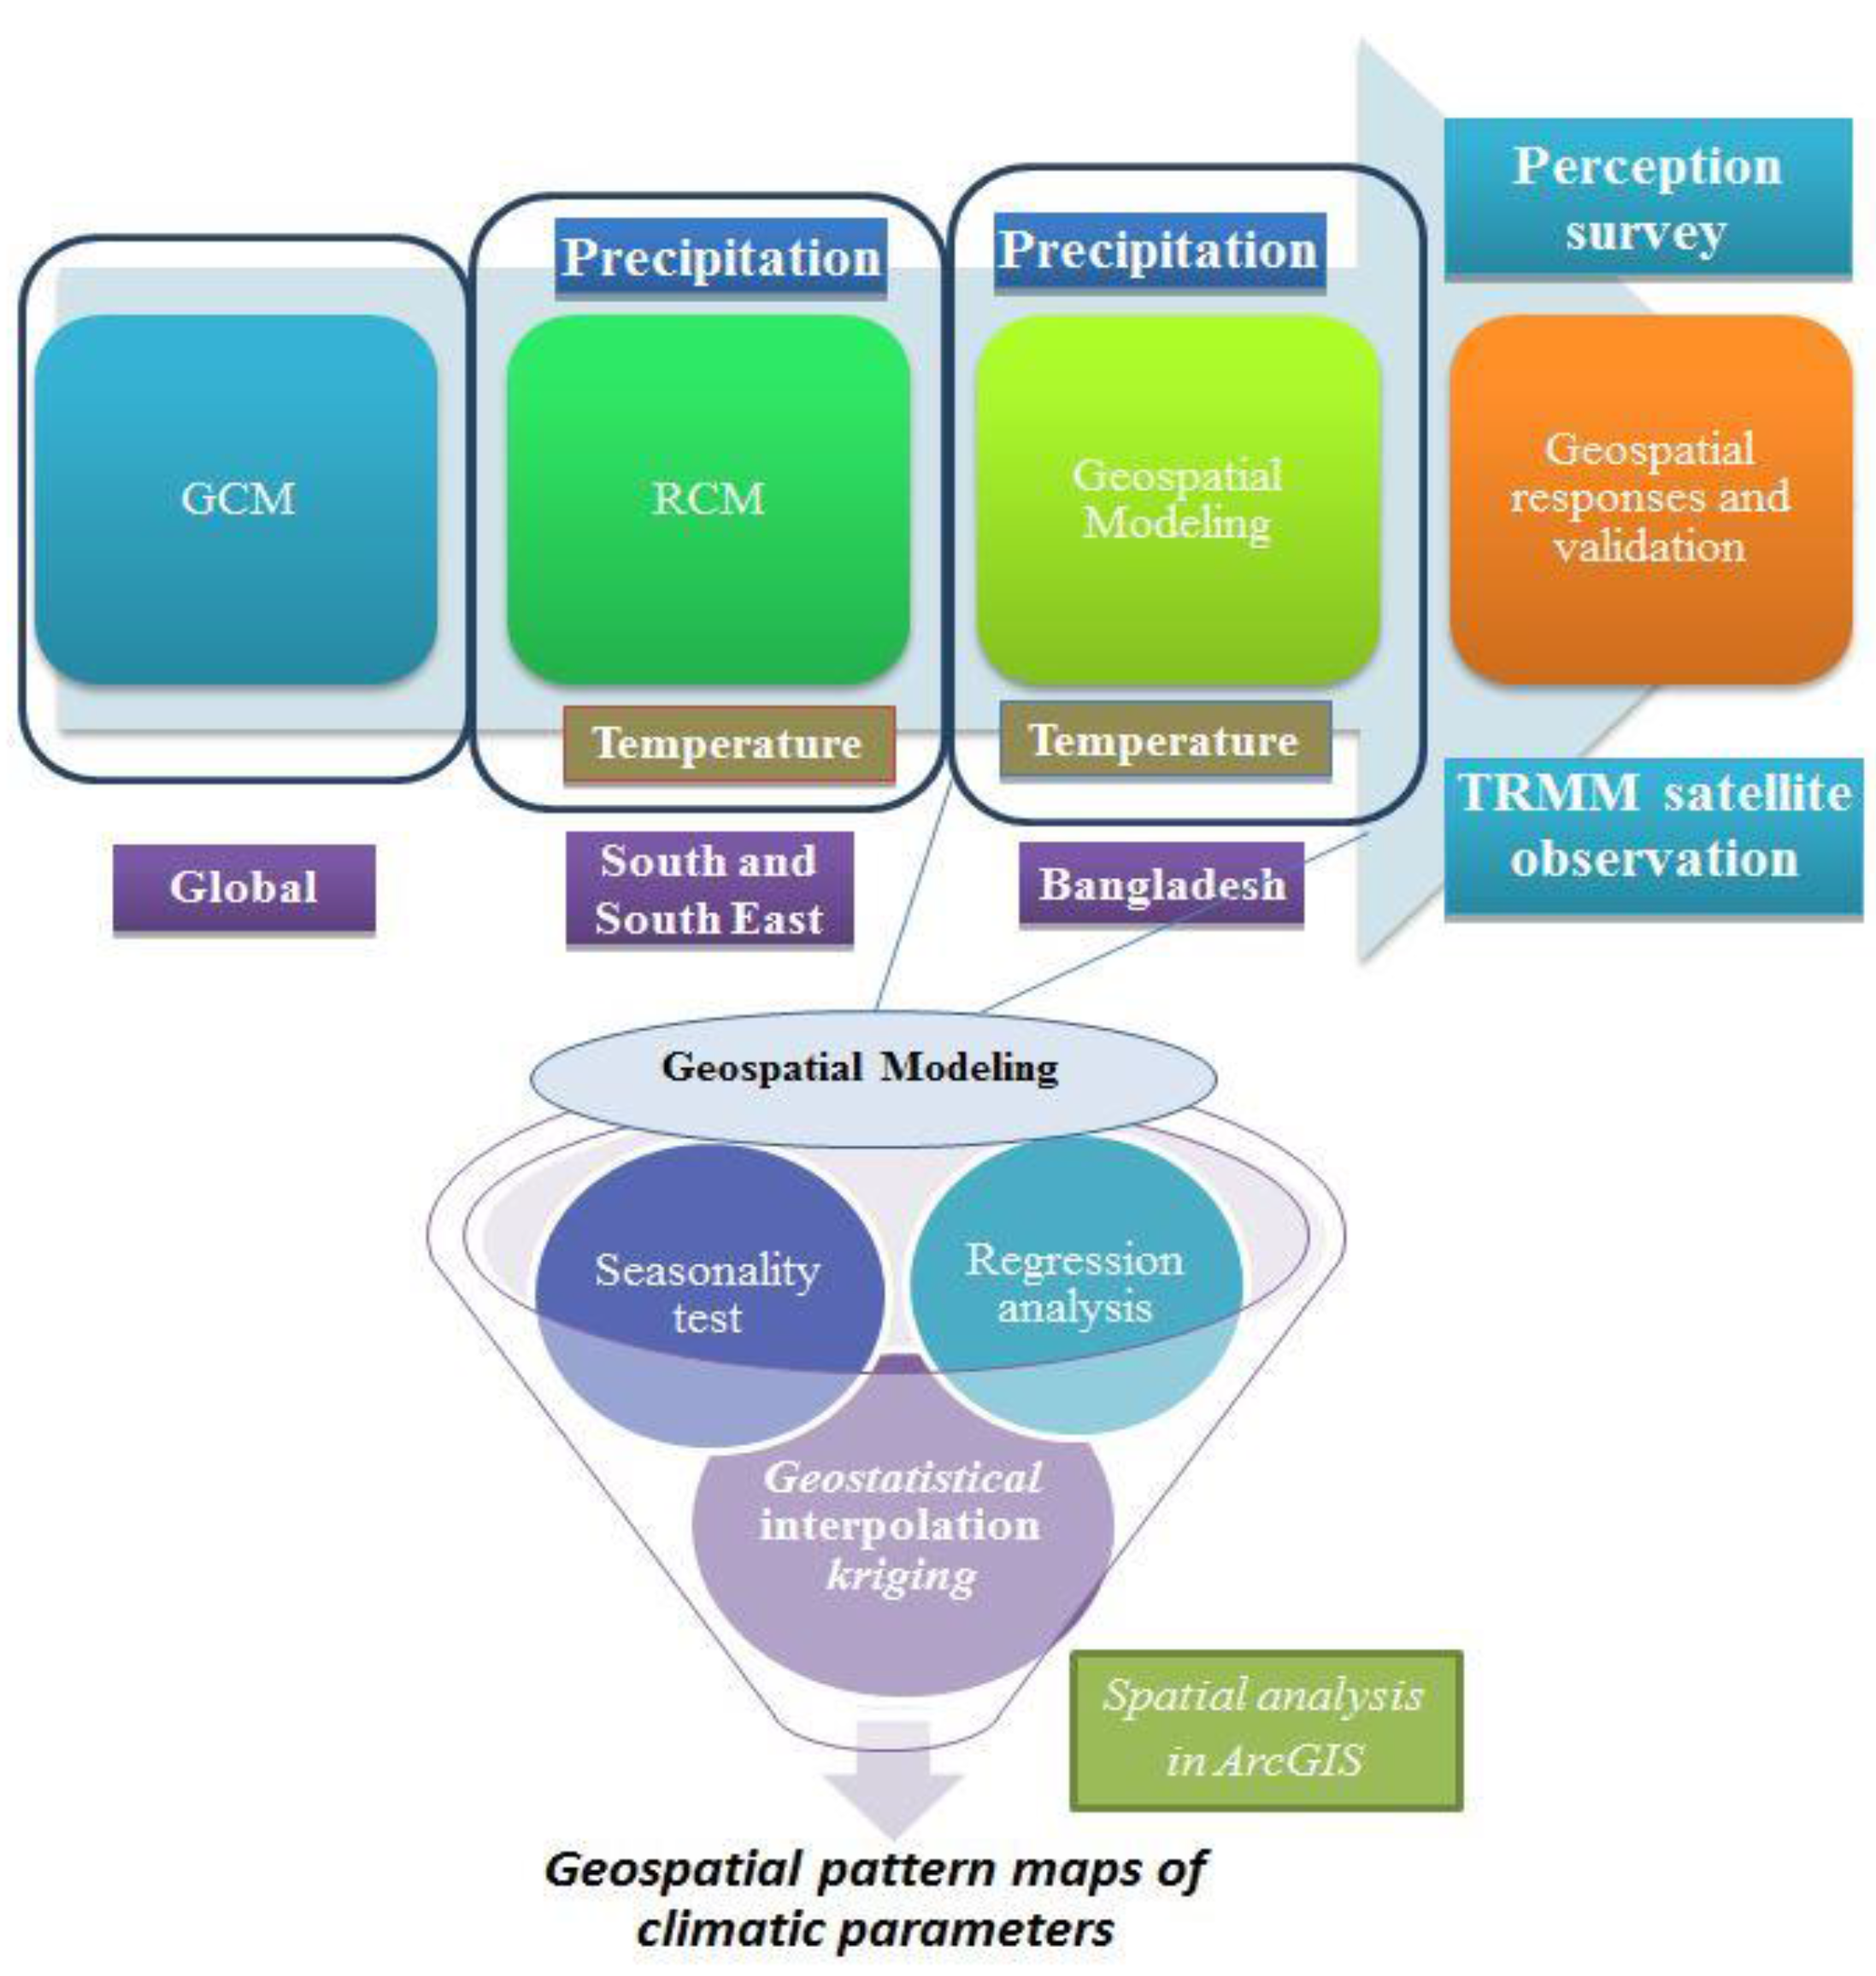
2. Materials and Methods
2.1. Materials
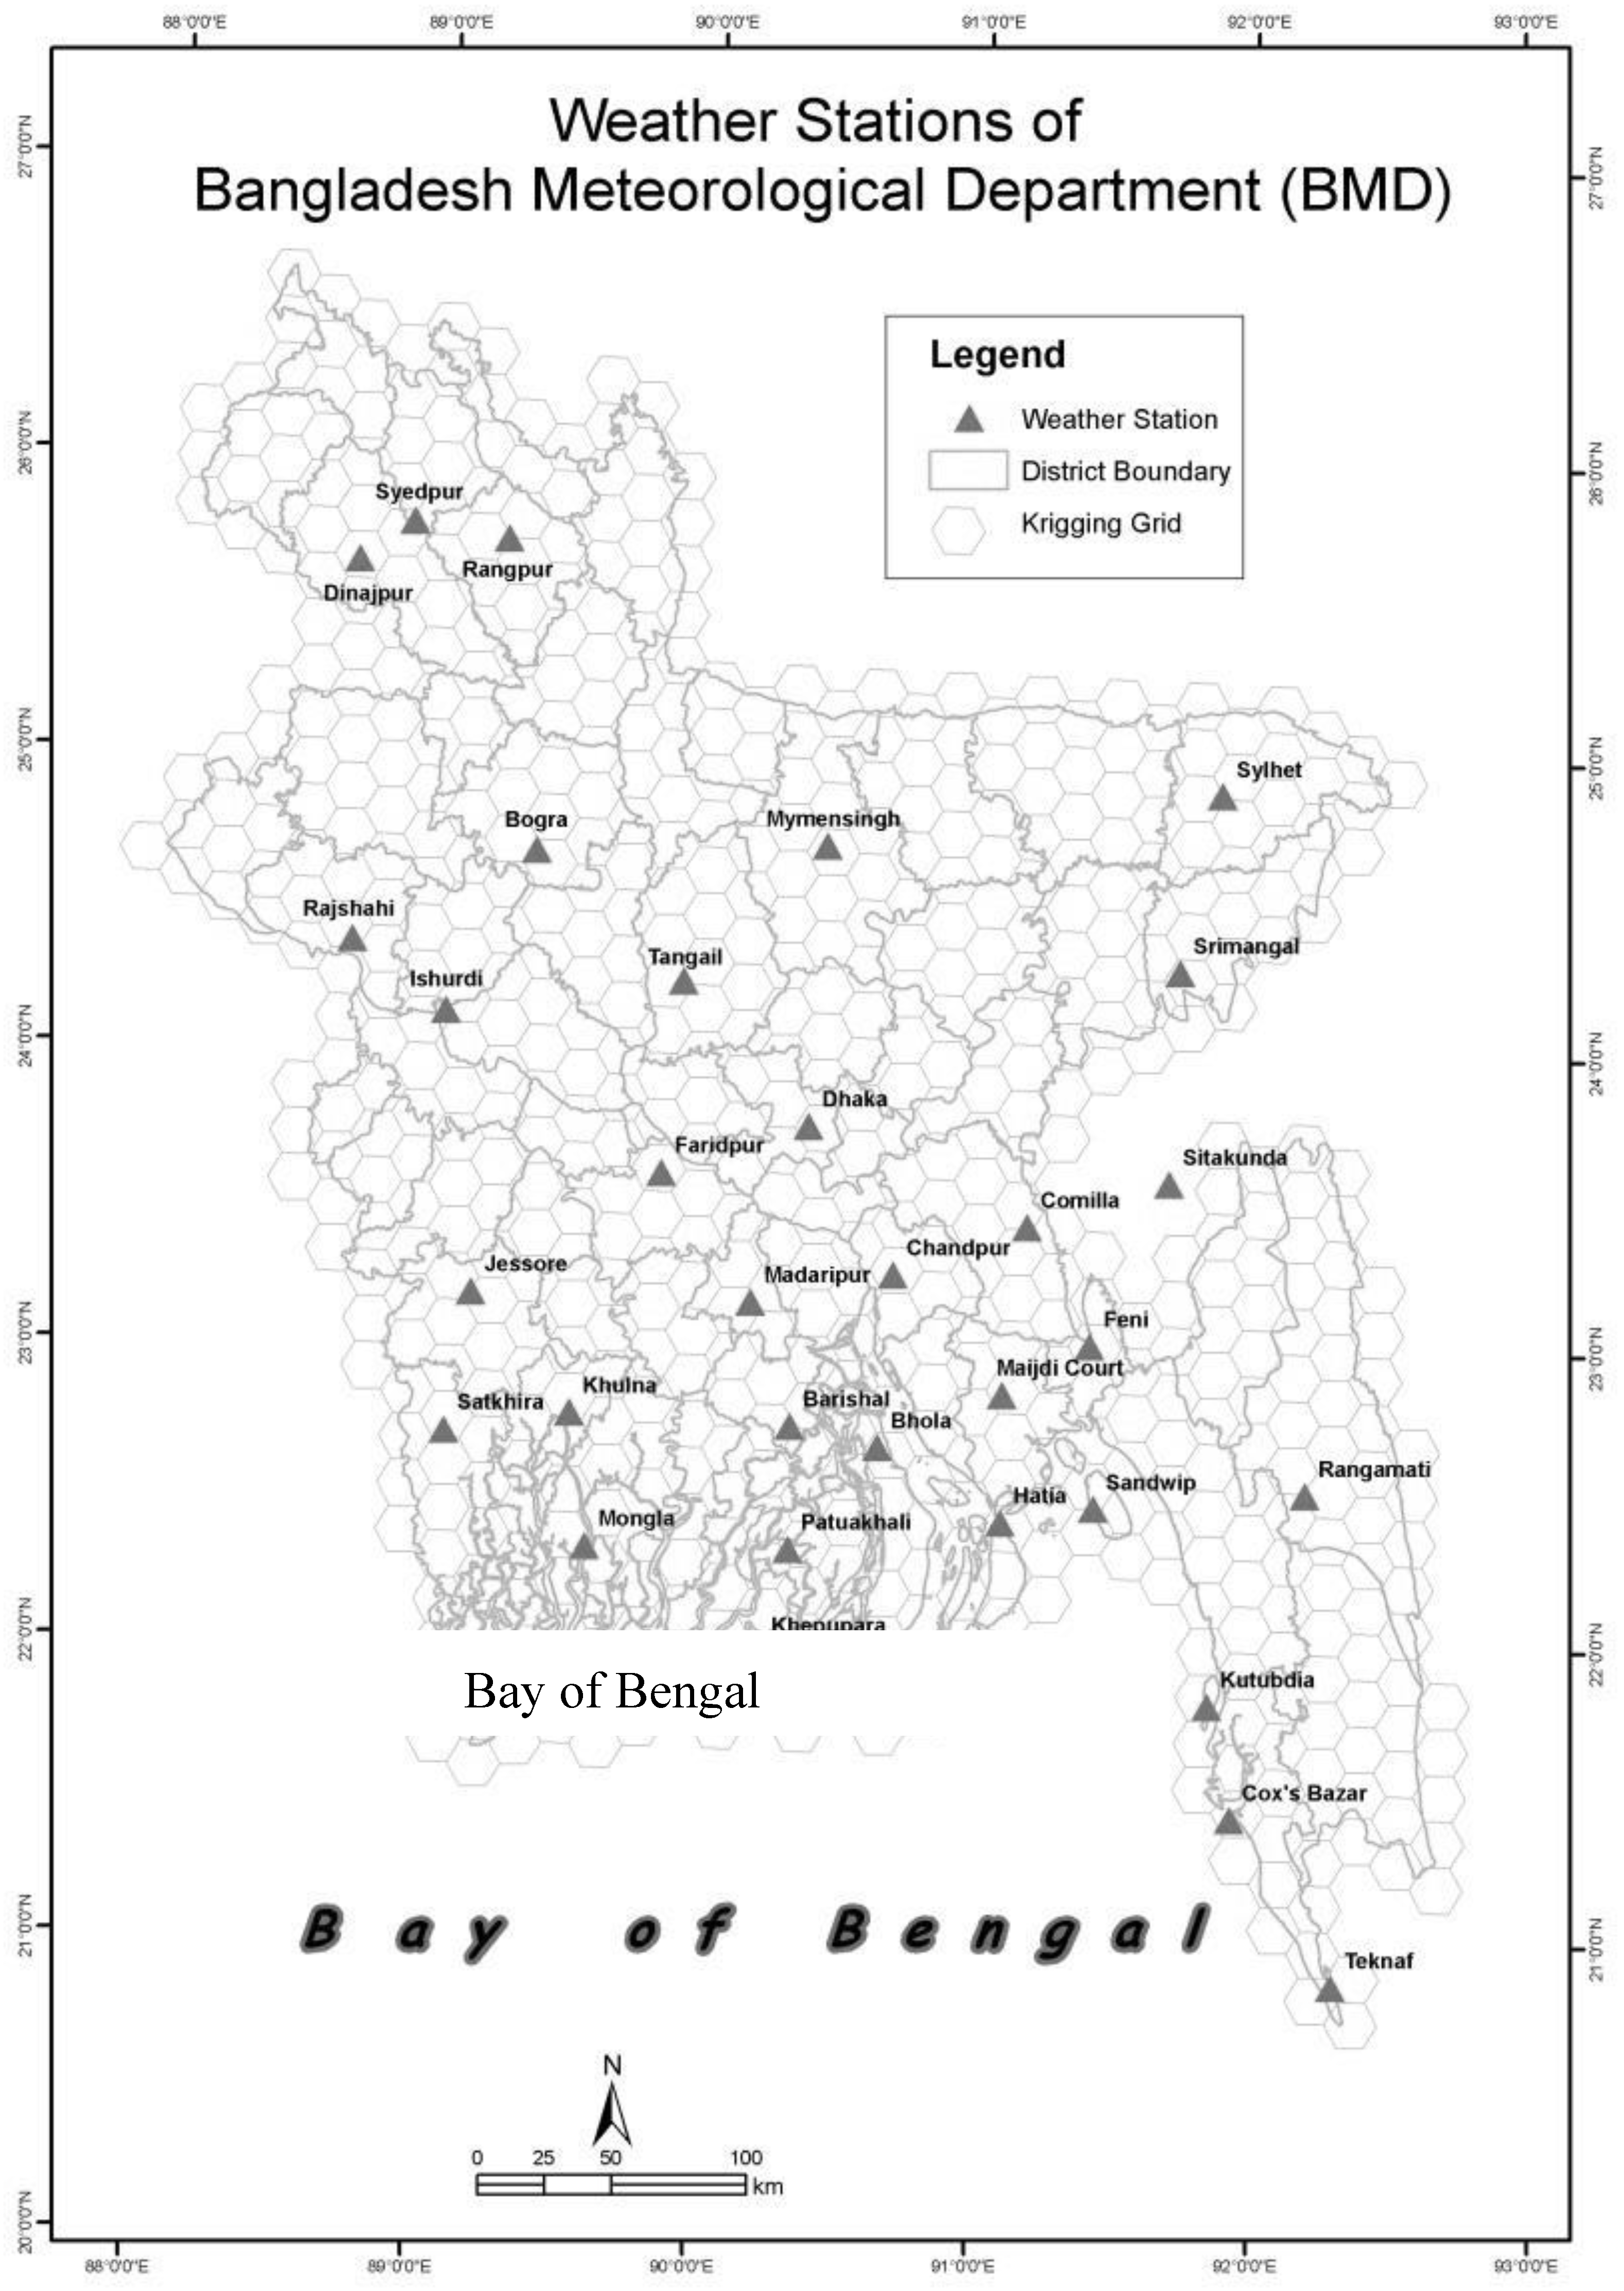
2.2. Study Area
2.3. Methodology
2.3.1. Regression Model
2.3.2. Mann Kendall Test
2.3.3. Mathematical Interpolation Methods
Step 1
Step 2
2.3.4. Kriging-Stochastic/Deterministic Interpolation
3. Results
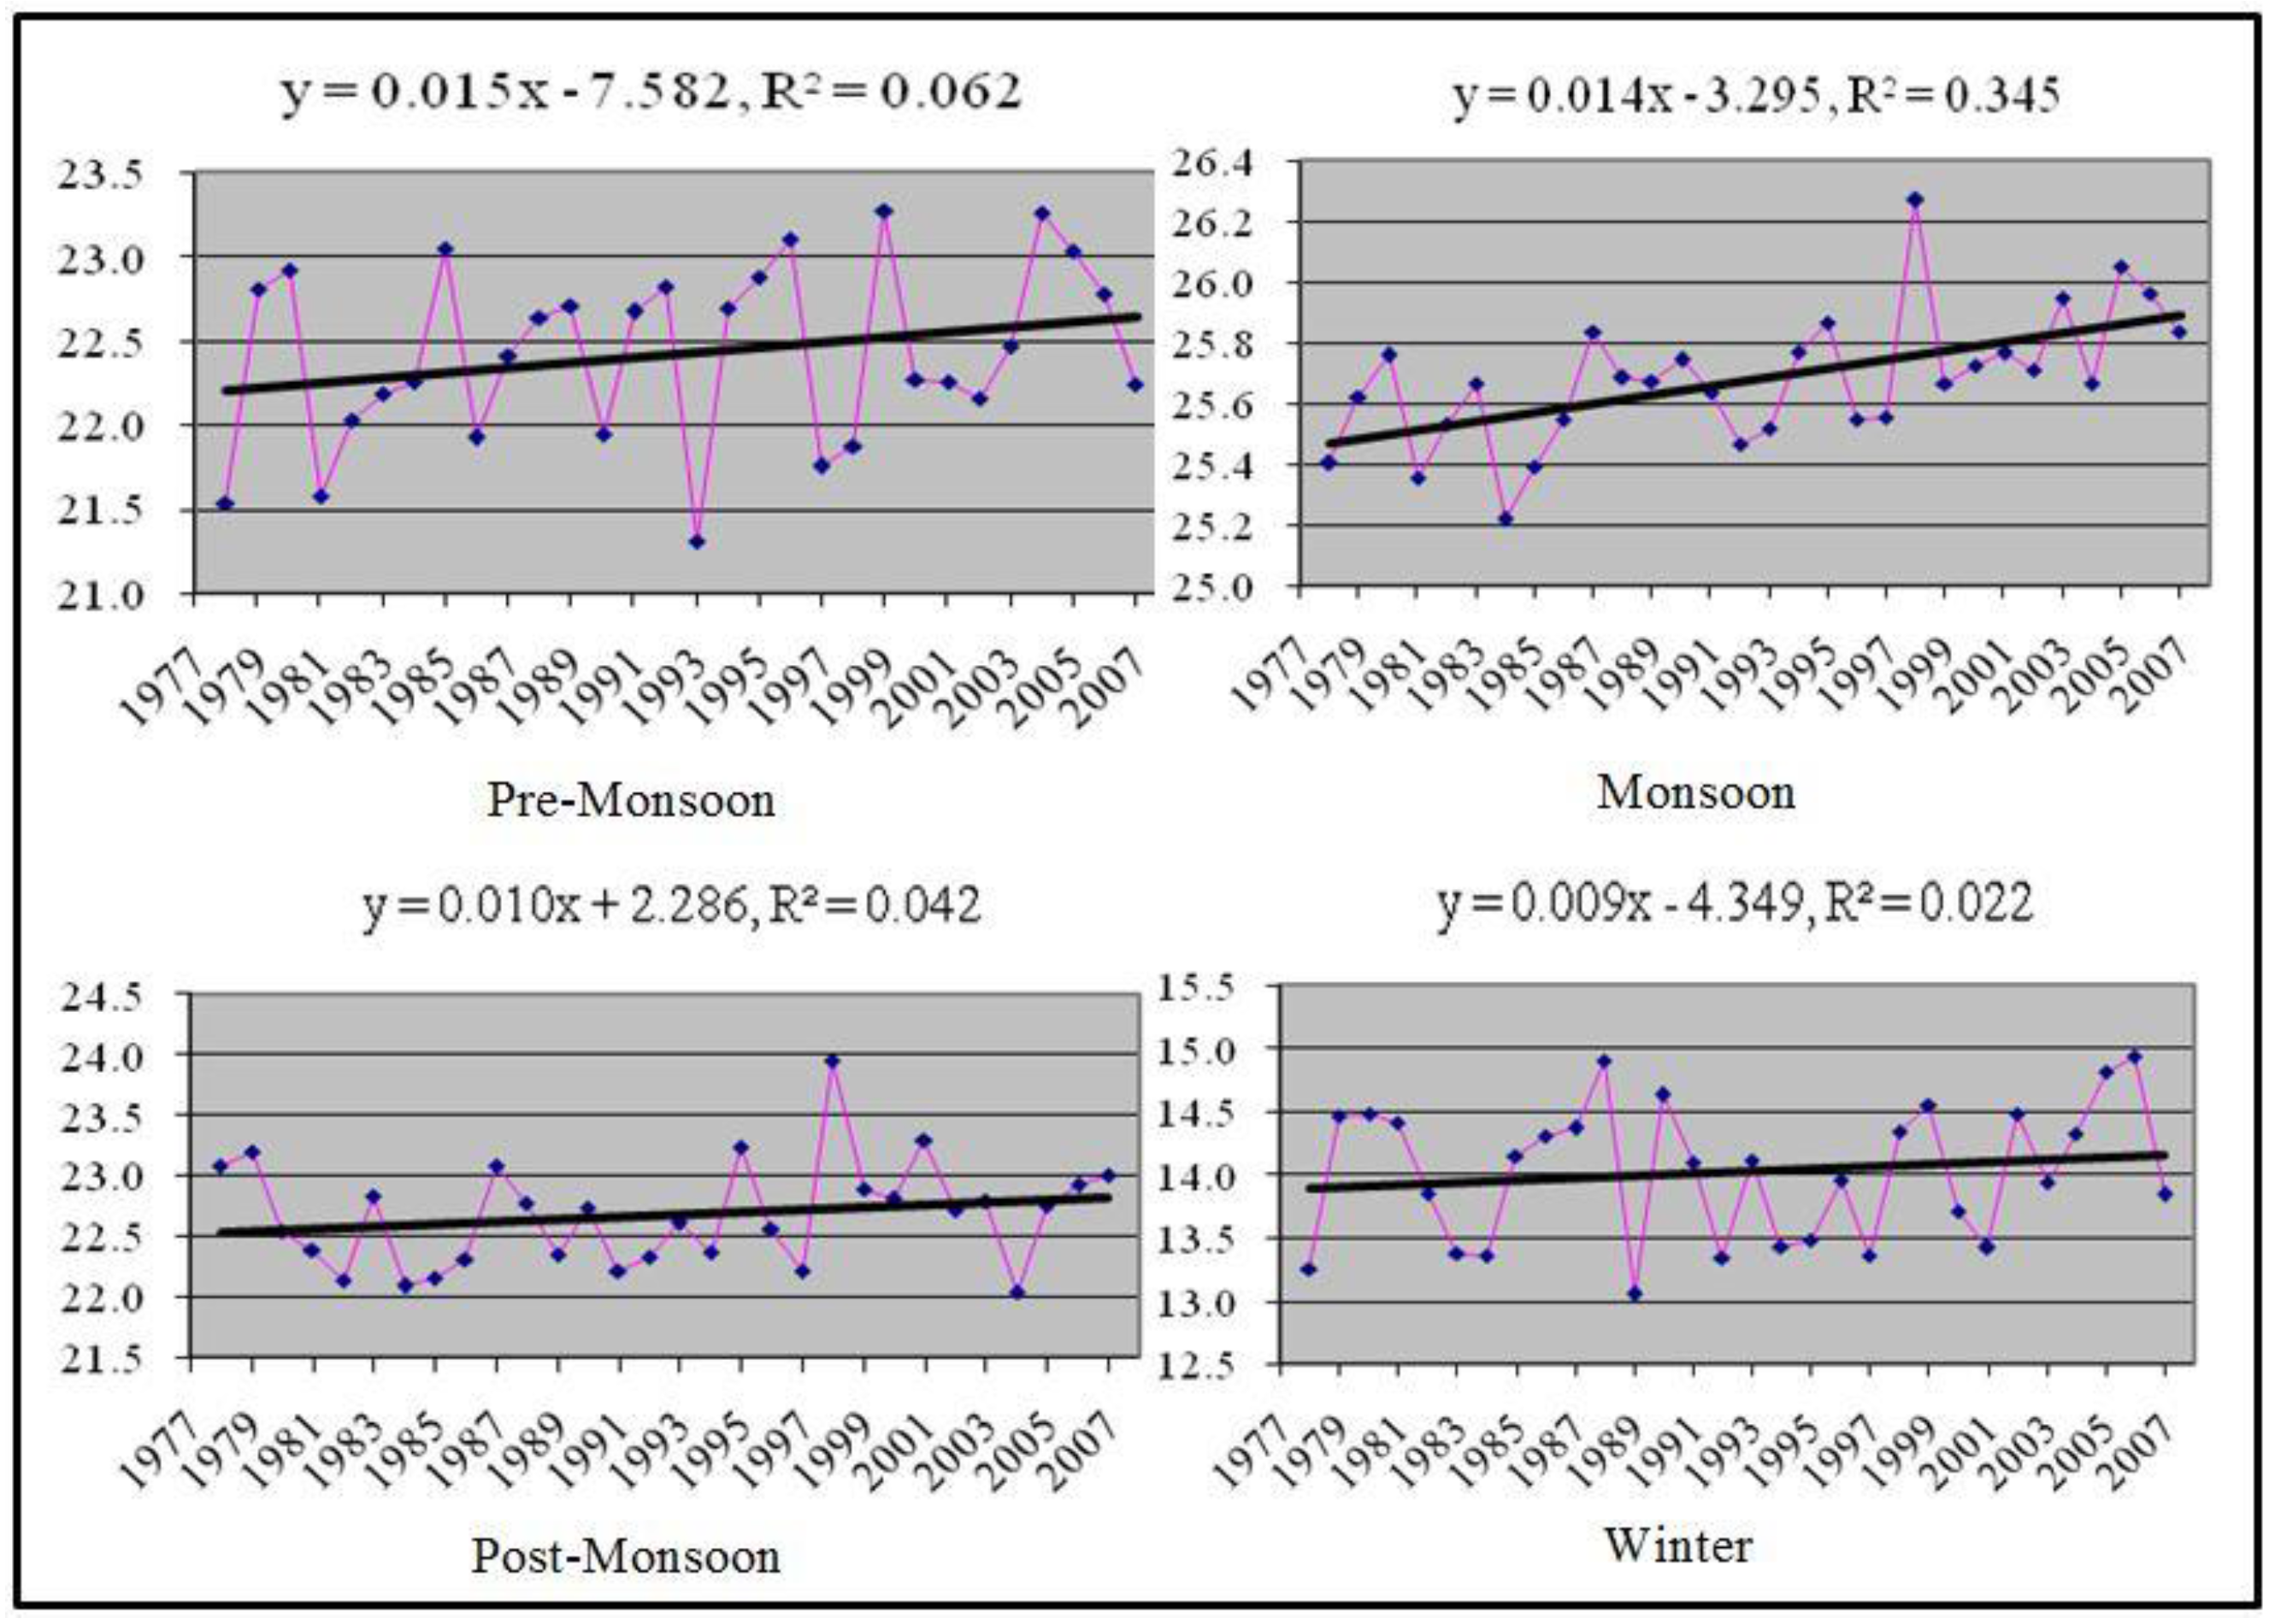
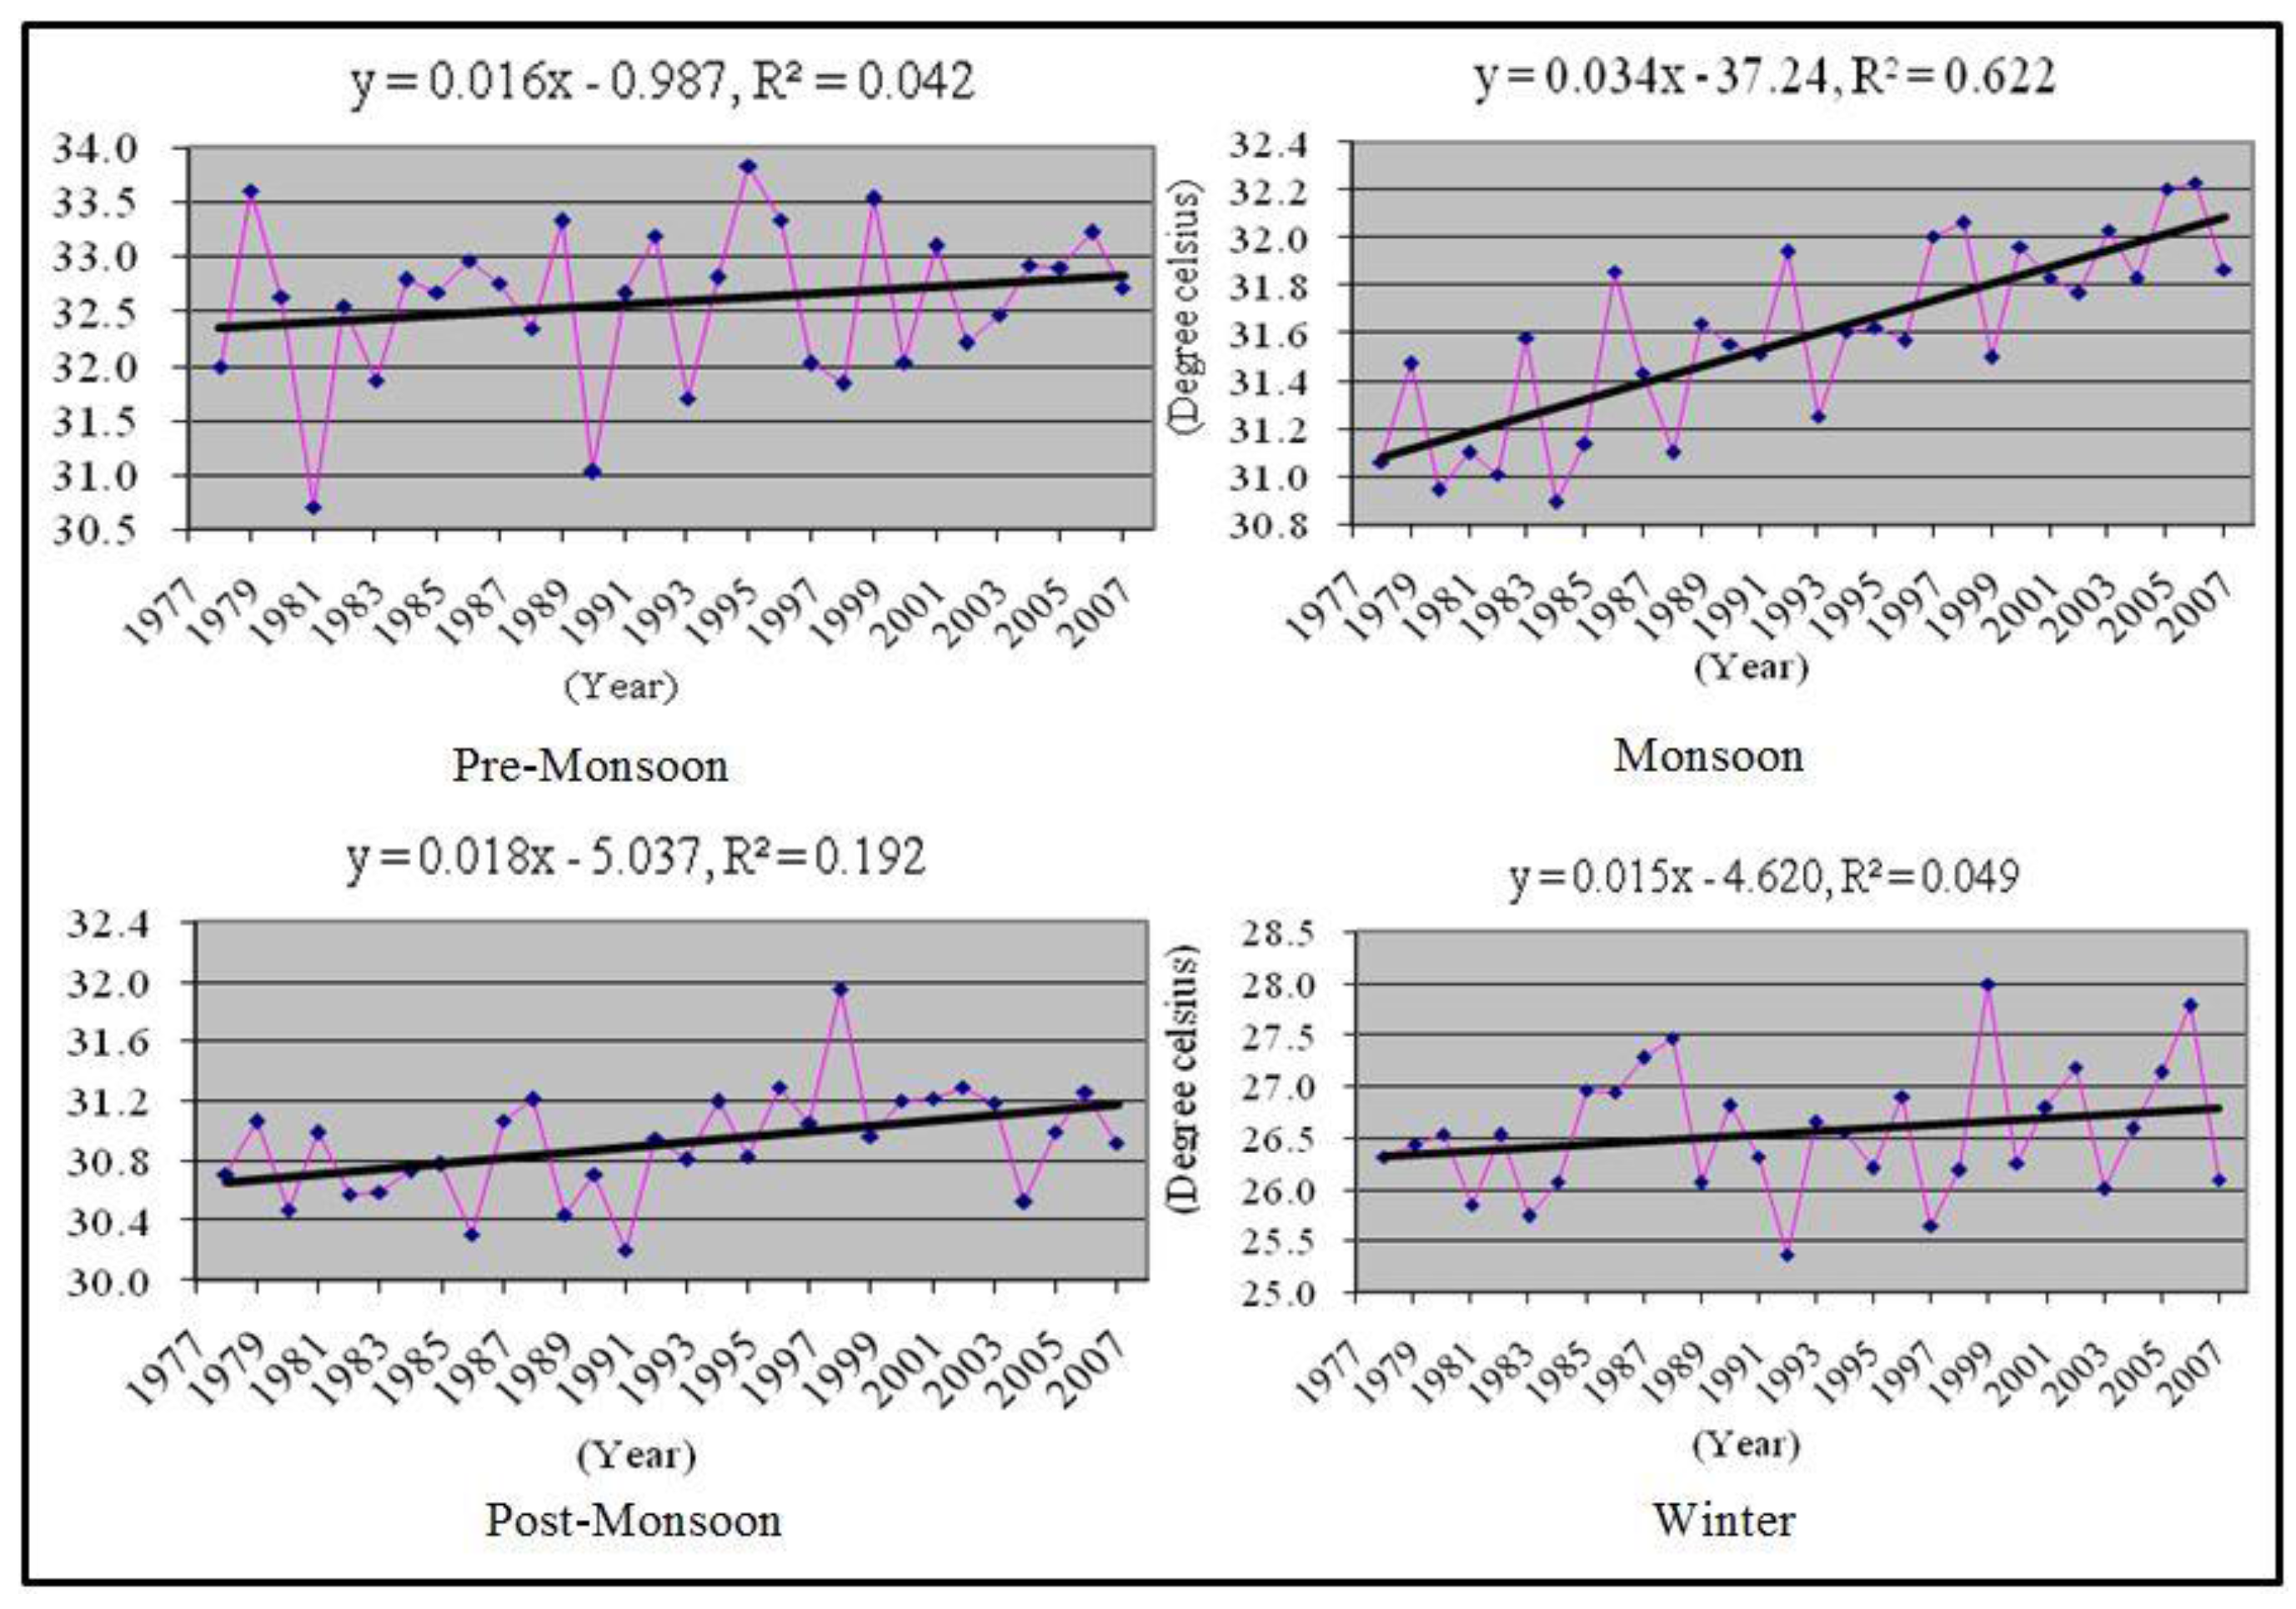
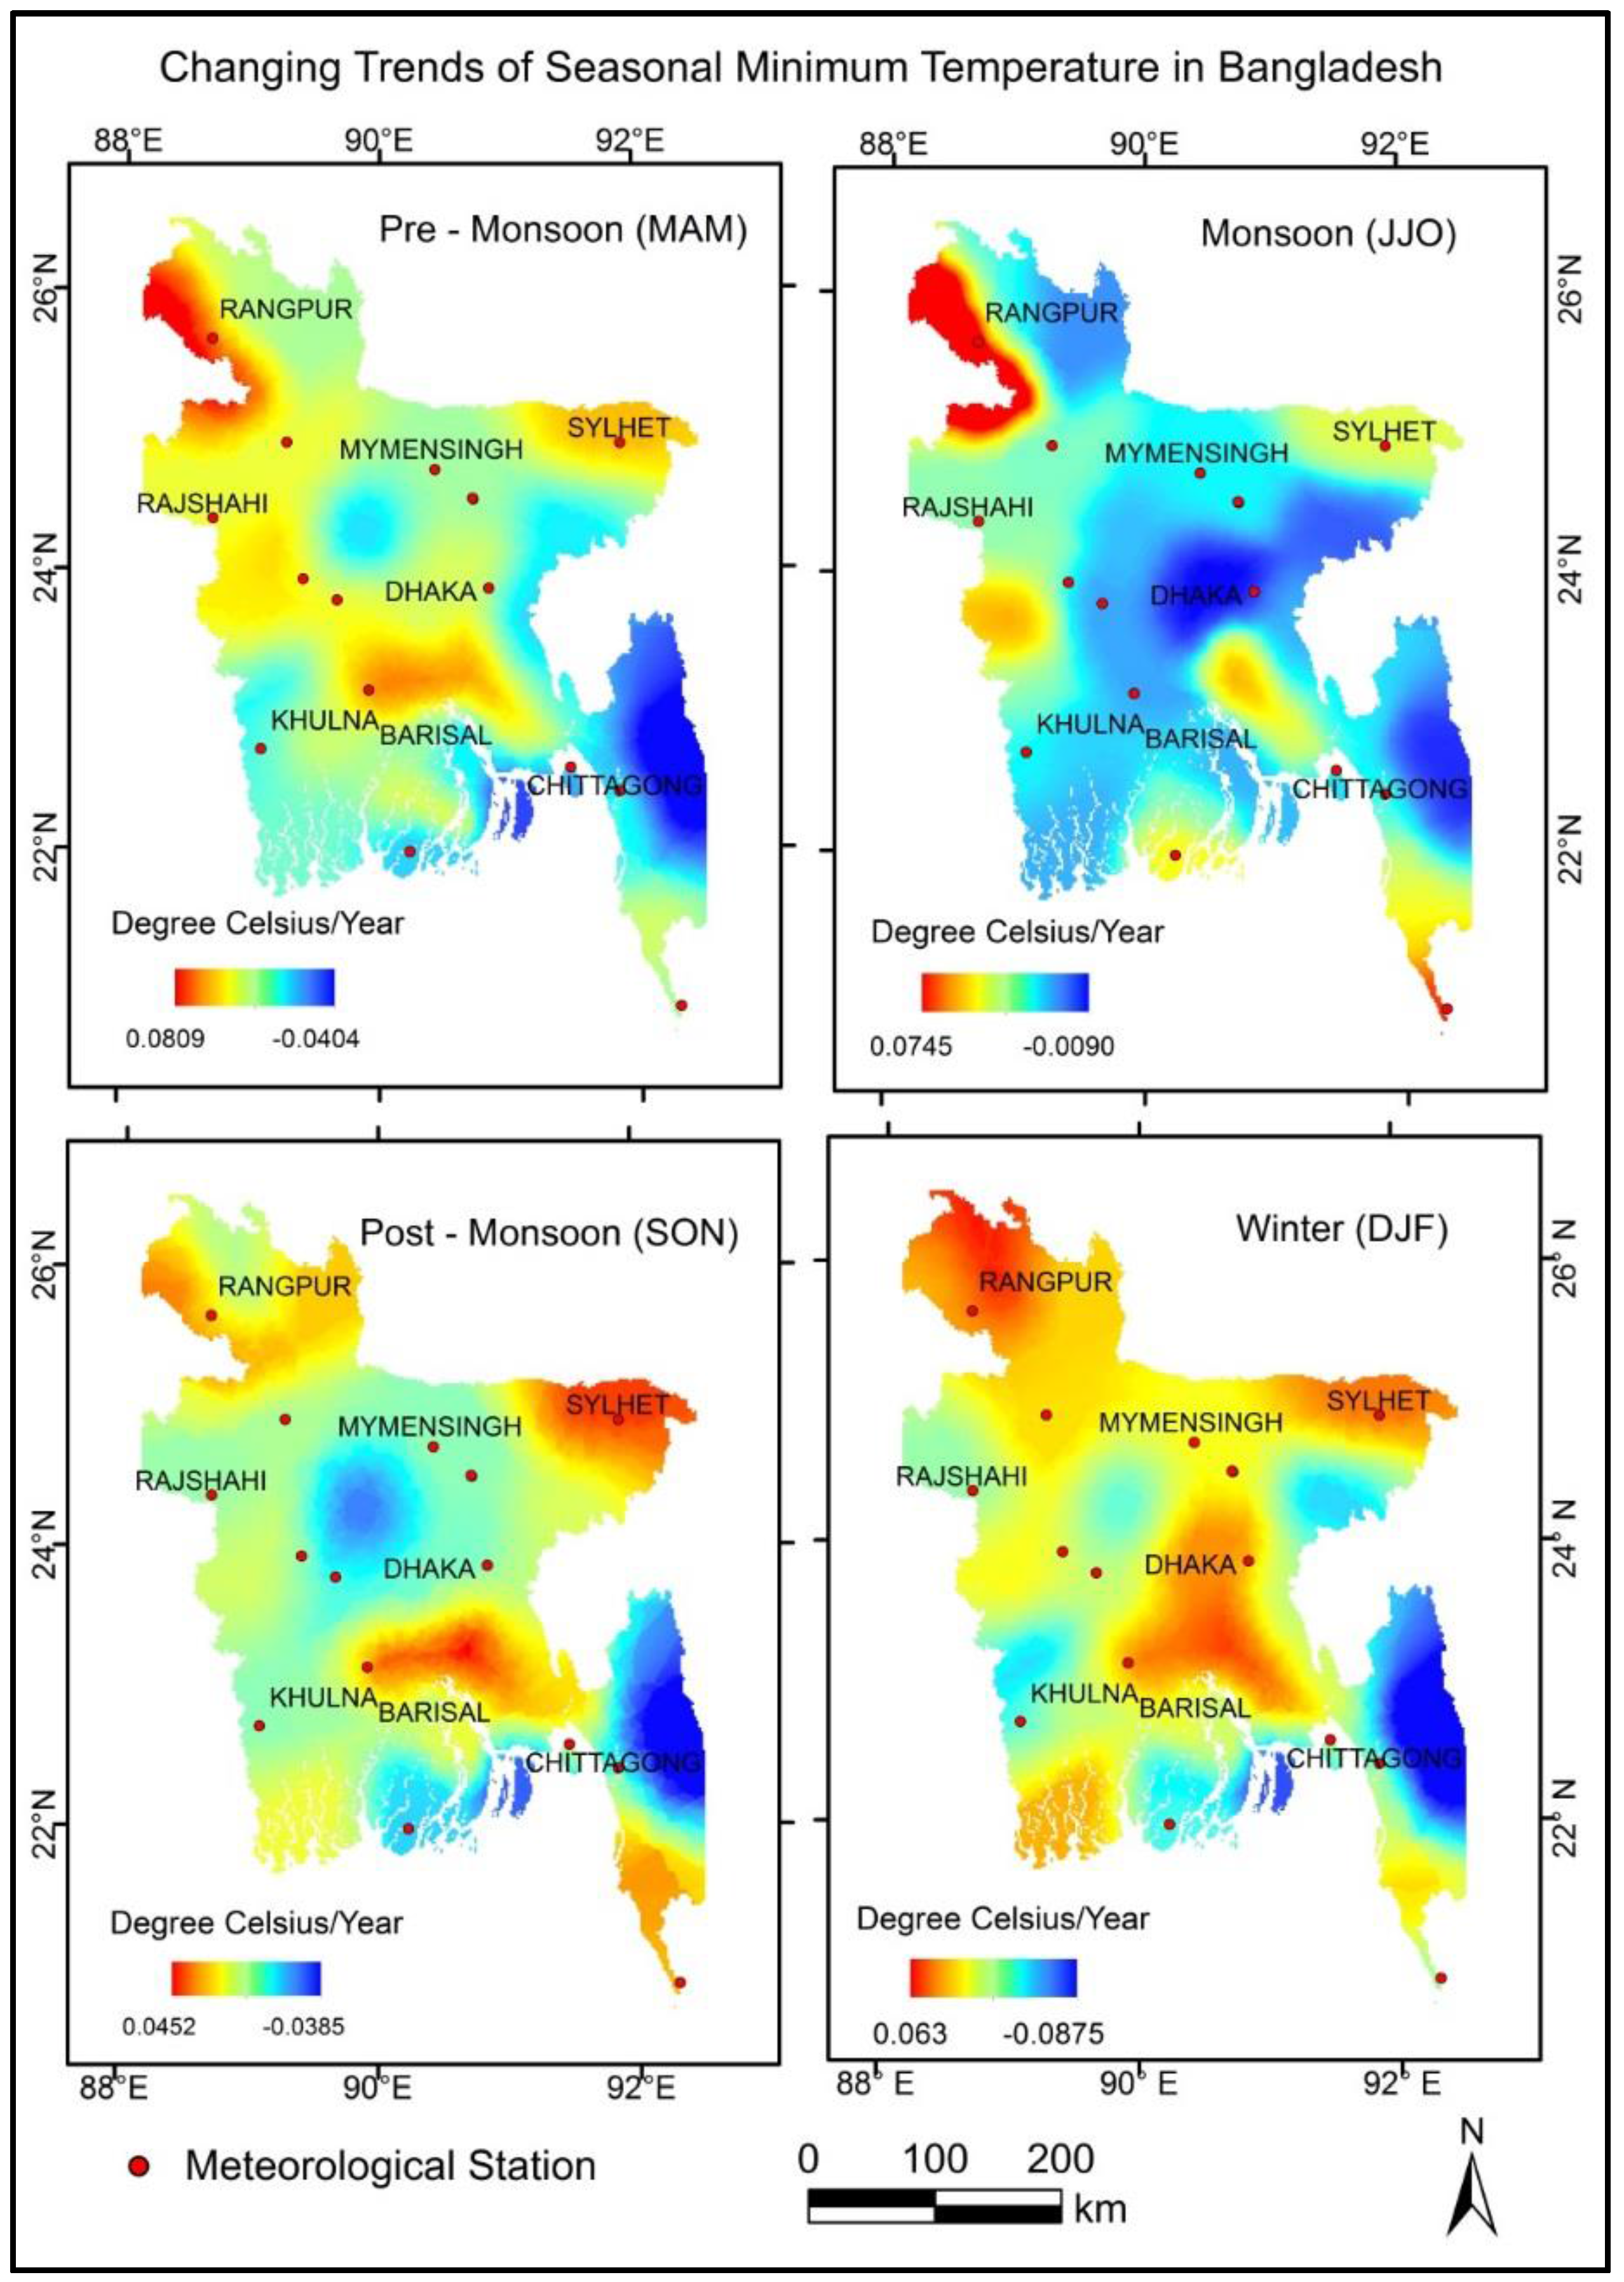
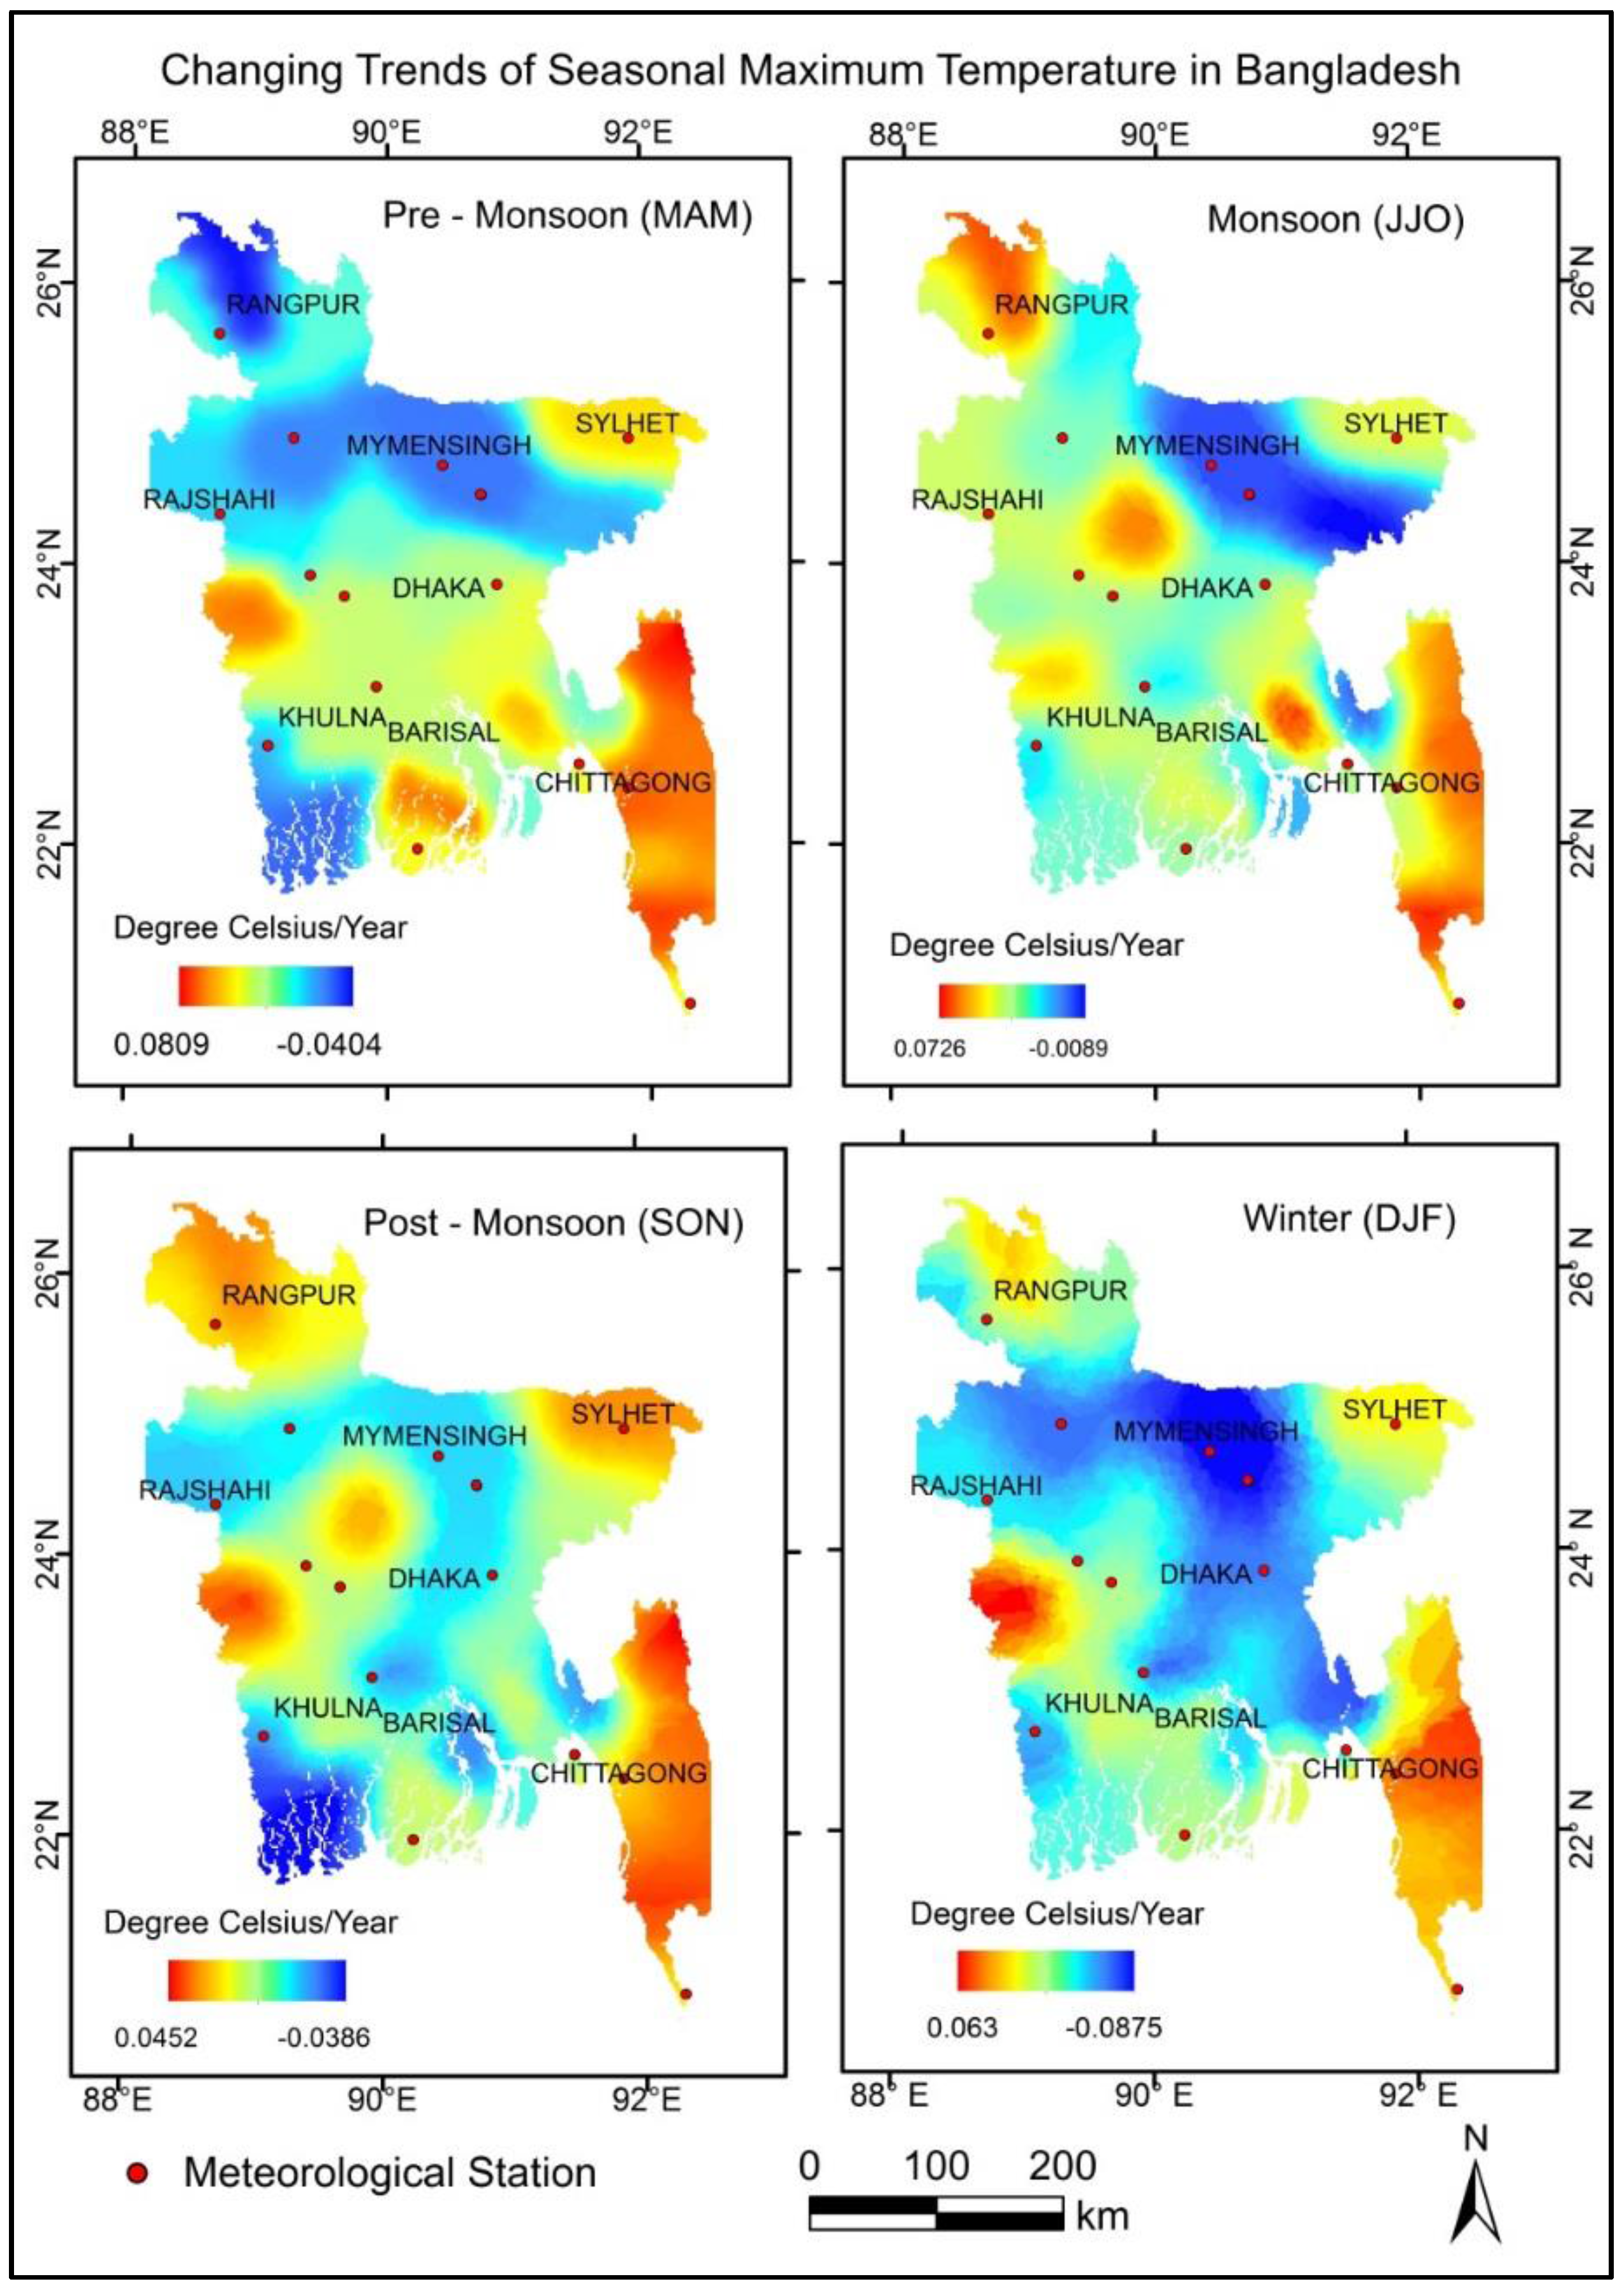
3.1. Changing Trends of Seasonal Maximum and Minimum Temperature
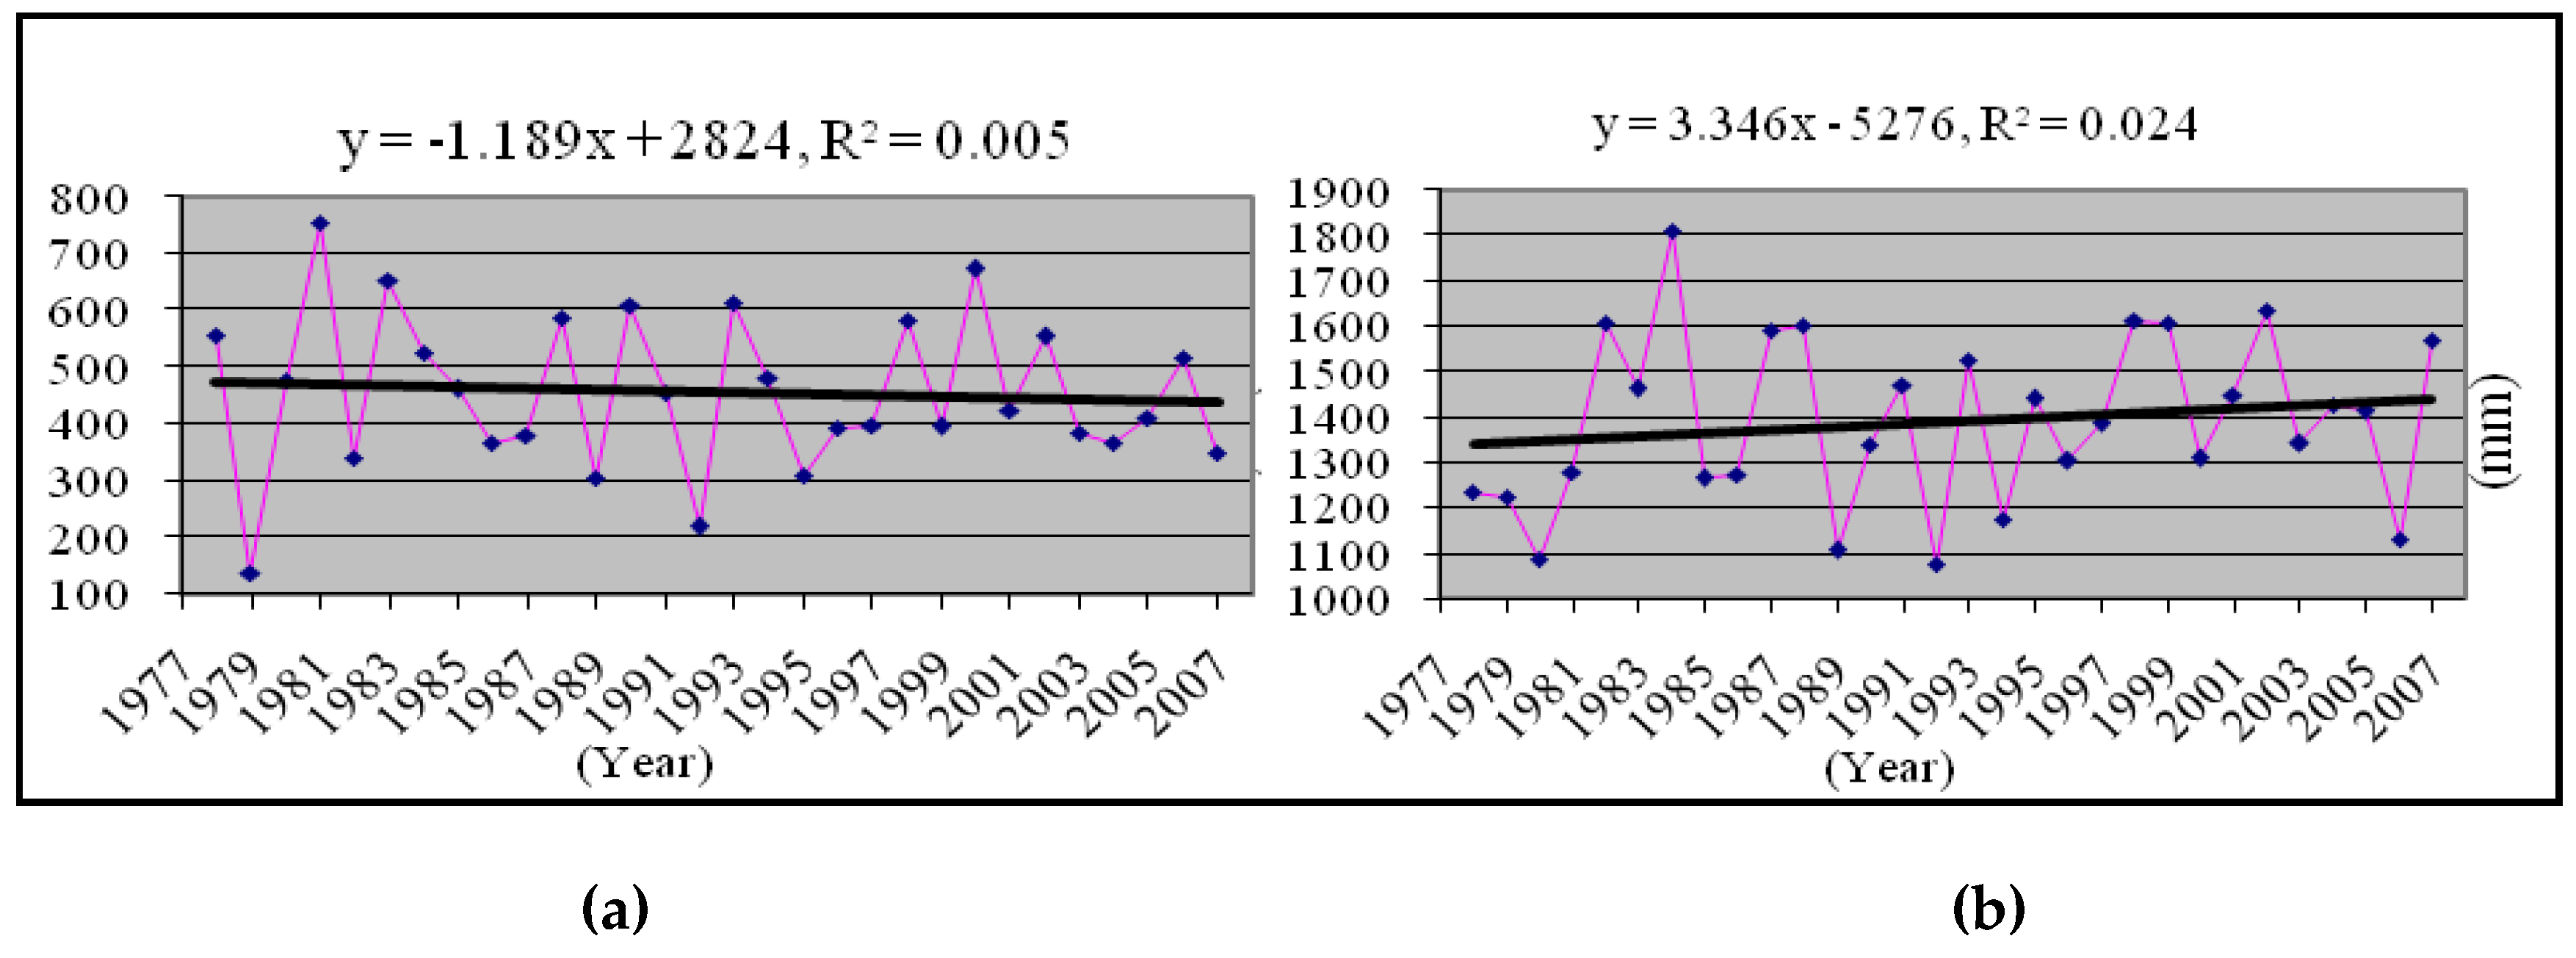
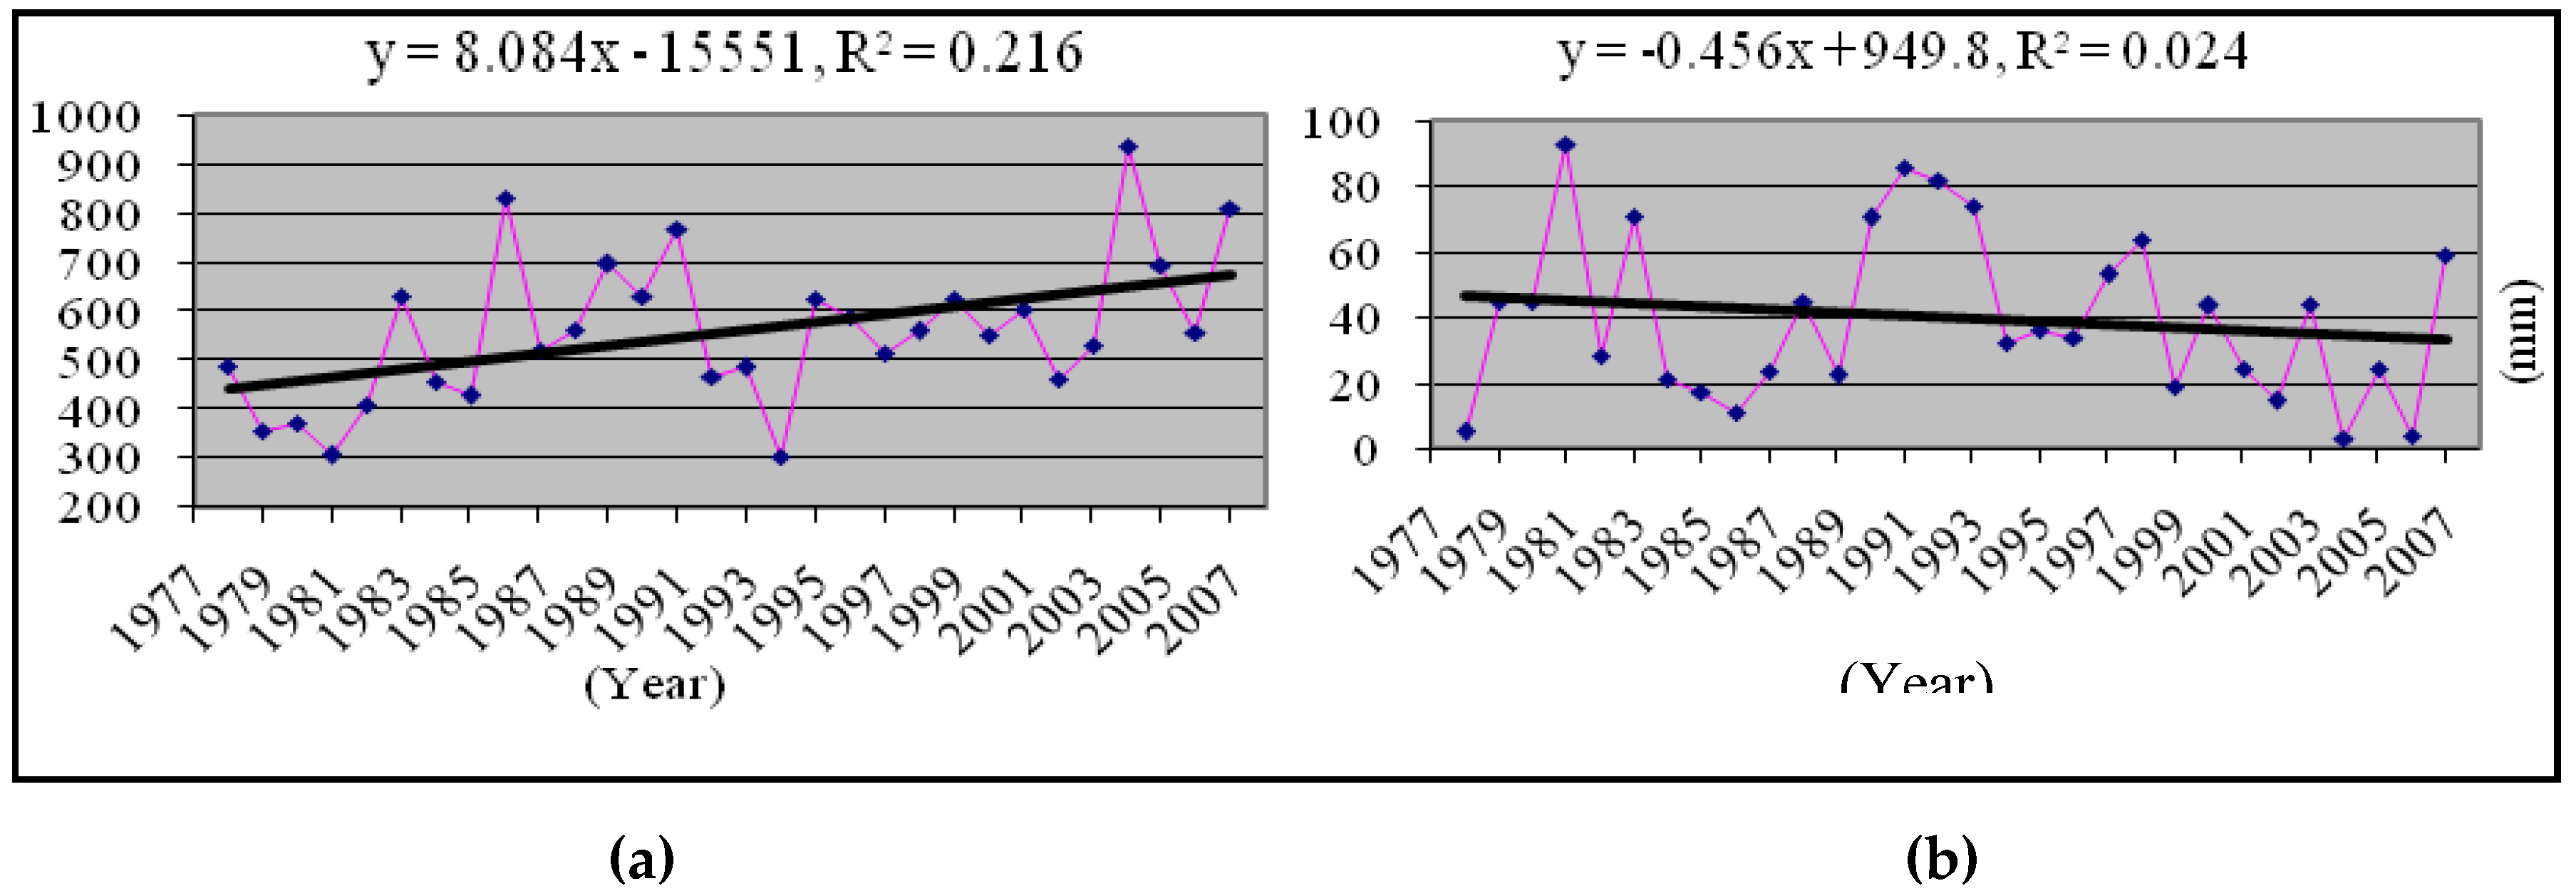
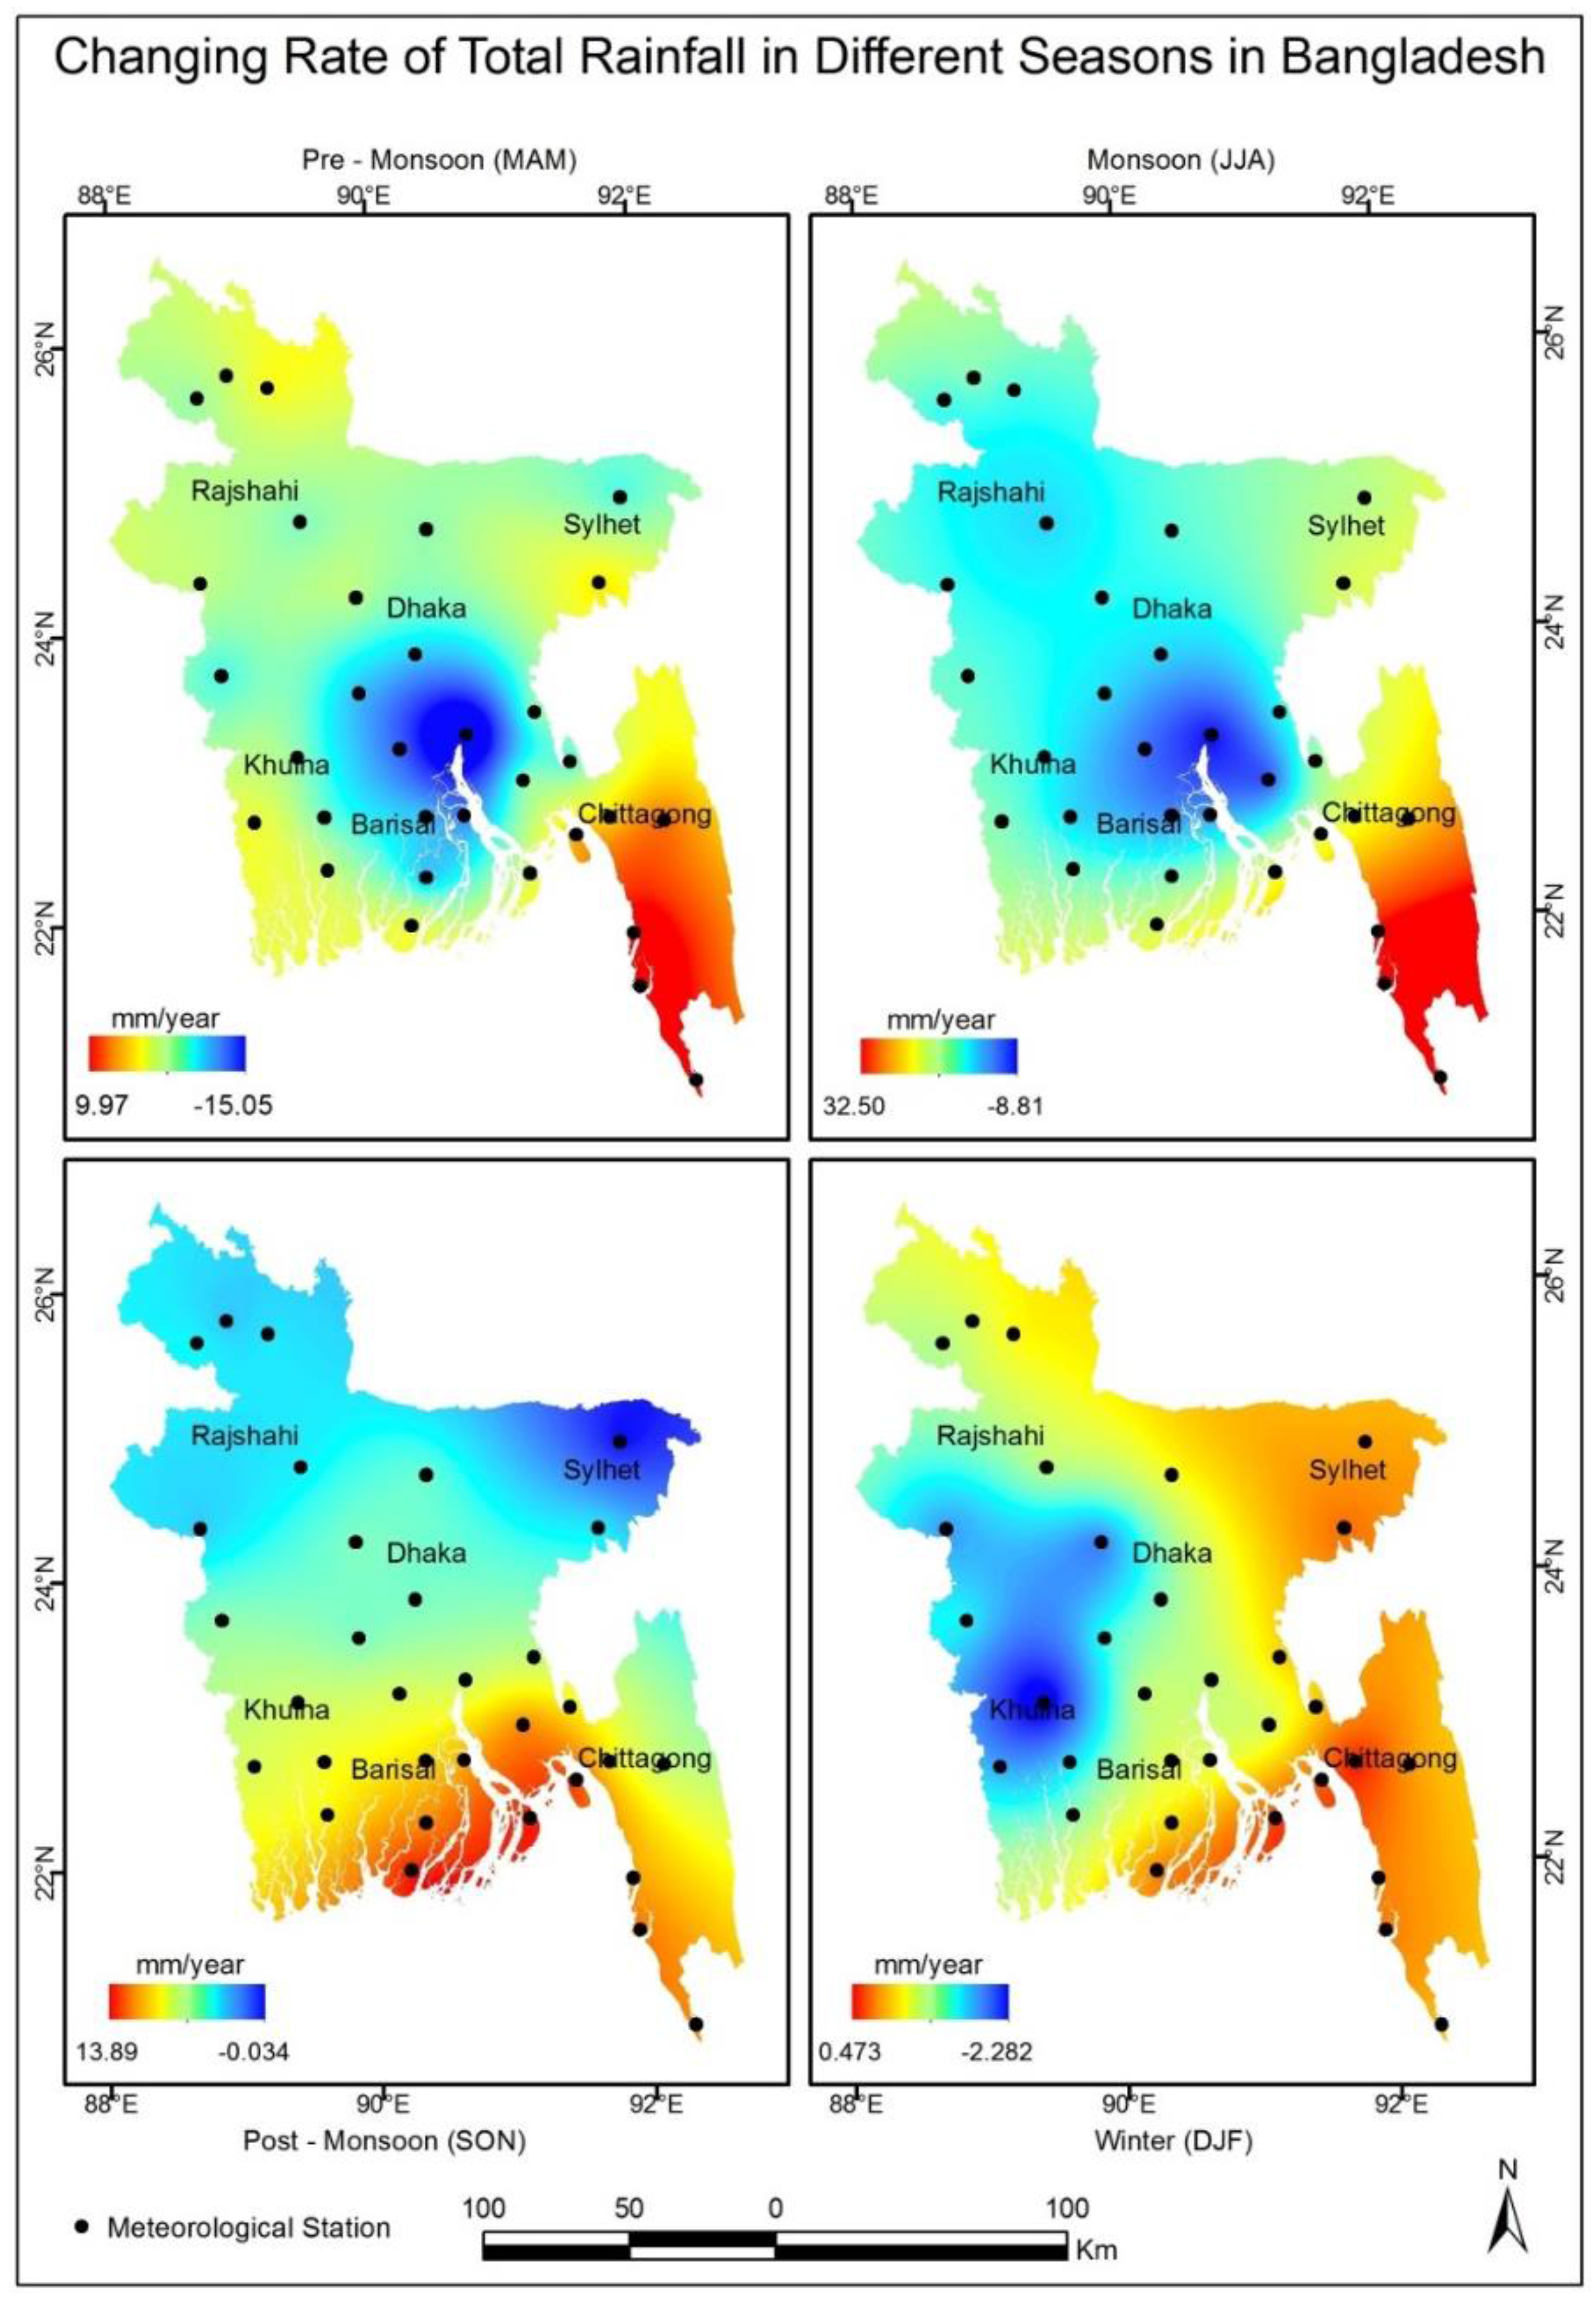
3.2. Changing Trends in Total and Monthly Average Rainfall
3.3. Temperature-Rainfall Inter-Linkage
4. Discussion
5. Conclusions
Acknowledgments
Author Contributions
Conflicts of Interest
References
- Bangladesh National Committee of ICID (BANCID). National Minor Irrigation Census Report; BANCID: Dhaka, Bengal, 1998. [Google Scholar]
- Blanford Henry, F. On the connexion of the Himalaya snowfall with dry winds and seasons of drought in India. Proc. R. Soc. Lond. 1884, 37, 3–22. [Google Scholar] [CrossRef]
- Ashfaq, M.; Shi, Y.; Tung, W.; Robert, J.; Xueijie, T.; Gao, J.; Pal, S.; Noah, S. Diffenbaugh. Suppression of south Asian summer Monsoon precipitation in the 21st century. Geophys. Res. Lett. 2009, 36, L01704. [Google Scholar] [CrossRef]
- Harmeling, S. Global Climate Risk Index-2012. Bonn: Germanwatche V. Available online: http://www.germanwatch.org/klima/cri2011.pdf (accessed on 6 June 2012).
- Singh, D.; Tsiang, M.; Rajaratnam, B.; Dienbaugh, N.S. Observed changes in extreme wet and dry spells during the South Asian summer Monsoon season. Nat. Clim. Chang. 2014. [Google Scholar] [CrossRef]
- Chowdhury, M.H.K.; Debsharma, S.K. Climate change in Bangladesh—A statistical review. In Proceedings of the IOC-UNEP Workshop on Impacts of Sea Level Rise due to Global Warming, Divya, Bangladesh, 16–19 November 1992.
- Mia, N.M. Variations of temperature of Bangladesh. In Proceedings of SAARC Seminars on Climate Variability in the South Asian Region and its Impacts, Dhaka, Bangladesh, 10–12 December 2003.
- Parthasarathy, B.; Sontake, N.A.; Monot, A.A.; Kothawale, D.R. Drought-flood in the summer Monsoon season over different meteorological subdivisions of India for the period 1871–1984. J. Climatol. 1987, 7, 57–70. [Google Scholar] [CrossRef]
- Mehrotra, D.; Mehrotra, R. Climate change and hydrology with emphasis on the Indian subcontinent. Hydrol. Sci. J. 1995, 2, 231–242. [Google Scholar] [CrossRef]
- Karmakar, S.; Shrestha, M.L. Recent Climate Change in Bangladesh; SMRC No.4; SMRC: Dhaka, Bangladesh, 2000. [Google Scholar]
- Hossain, M.; Islam, A.T.M.A.; Saha, S.K. Floods in Bangladesh—An analysis of their nature and causes. In Floods in Bangladesh Recurrent Disaster and People’s Survival; Universities Research Centre: Dhaka, Bangladesh, 1987; pp. 1–21. [Google Scholar]
- Rafiuddin, M.; Uyeda, H.; Islam, M.N. Simulation of characteristics of precipitation systems developed in Bangladesh during pre-monsoon and monsoon. In Proceedings of the 2nd International Conference on Water and Flood Management, Dhaka, Bangladesh, 15–17 March 2009; Institute of Water and Flood Management, BUET: Dhaka, Bangladesh, 2009; pp. 61–68. [Google Scholar]
- Smith, J.B.; Rahman, A.; Mirza, M.Q. Considering Adaptation to Climate Change in the Sustainable Development of Bangladesh; The World Bank by Stratus Consulting Inc.: Boulder, CO, USA, 1998. [Google Scholar]
- MPO. National Water Management Plan: Phase II, Final Report, Master Planning Organization (MPO), Ministry of Irrigation, Water Development and Flood Control; Government of the People’s Republic of Bangladesh: Dhaka, Bangladesh, 1991.
- Chiew, F.H.S. Estimation of rainfall elasticity of stream flow in Australia. Hydrol. Sci. J. 2006, 51, 613–625. [Google Scholar] [CrossRef]
- Shin, H.H.; Hong, S.Y. Intercomparison of Planetary Boundary-Layer Parametrizations in the WRF Model for a Single Day from CASES-99. Bound. Layer Meteorol. 2011, 139, 261–281. [Google Scholar] [CrossRef]
- IPCC; Rosenzweig, C.; Casassa, G.; Imeson, A.; Karoly, D.J.; Liu Chunzhen, M.A.; Rawlins, S.; Root, T.L.; Seguin, B.; Tryjanowski, P. Assessment of Observed Changes And Responses in Natural and Managed Systems. Available online: http://www.ipcc.ch/pdf/assessment-report/ar4/wg2/ar4-wg2-chapter1.pdf (accessed on 8 January 2008).
- Arfanuzzaman, M.; Mamnun, N.; Islam, M.S.; Dilshad, T.; Syed, M.A. Evaluation of Adaptation Practices in the Agriculture Sector of Bangladesh: An Ecosystem Based Assessment. Climate 2016, 4. [Google Scholar] [CrossRef]
- Syed, M.A. Regional analysis, import-export and related issues on food security. In Food Security and Risk Reduction in Bangladesh; Umma, H., Anwarul, A., Abu Wali, R.H., Rajib, S., Eds.; Springer: Tokyo, Japan, 2015; pp. 111–134. [Google Scholar]
- Rauscher, S.A.; Coppola, E.; Piani, C.; Giorgi, F. Resolution effects on regional climate model simulations of seasonal precipitation over Europe. Part I: Seasonal. Clim. Dyn. 2010, 35, 685–711. [Google Scholar] [CrossRef]
- Rashid, H.E. Geography of Bangladesh, 2nd ed.; The University Press Ltd.: Dhaka, Bangladesh, 1991. [Google Scholar]
- Huq, S.; Asaduzzaman, M. Overview. In Vulnerability and Adaptation to Climate Change for Bangladesh; Huq, S., Karim, Z., Asaduzzaman, M., Mahtab, F., Eds.; Kluwer Academic Publishers: Dordrecht, The Netherlands, 1999; pp. 1–11. [Google Scholar]
- Armstrong, J.S. Illusions in regression analysis. Int. J. Forecast. 2012. [Google Scholar] [CrossRef]
- Freedman, D.A. Statistical Models: Theory and Practice; Cambridge University Press: Cambridge, UK, 2005. [Google Scholar]
- Cook, R.D.; Weisberg, S. Criticism and influence analysis in regression. Sociol. Methodol. 1982, 13, 313–361. [Google Scholar] [CrossRef]
- Mann, H.B. Non-parametric test against trend. Econometrica 1945, 13, 245–259. [Google Scholar] [CrossRef]
- Kendall, M.G. Rank Correlation Methods, 4th ed.; Charles Griffin: London, UK, 1975. [Google Scholar]
- Dietz, E.J.; Killeen, T.J. A nonparametric multivariate test for monotone trend with pharmaceutical applications. J. Am. Stat. Assoc. 1981, 76, 169–174. [Google Scholar] [CrossRef]
- Hirsch, R.M.; Slack, J.R. A nonparametric trend test for seasonal data with serial dependence. Water Resour. Res. 1984, 20, 727–732. [Google Scholar] [CrossRef]
- Lettenmaier, D.P. Multivariate nonparametric tests for trend in water quality. Water Resour. Bull. 1988, 24, 505–512. [Google Scholar] [CrossRef]
- Libiseller, C.; Grimvall, A. Performance of Partial Mann Kendall Tests for Trend Detection in the Presence of Covariates. Environmetrics 2002, 13, 71–84. [Google Scholar] [CrossRef]
- Shahid, S. Trends in extreme rainfall events of Bangladesh. Theor. Appl. Climatol. 2011, 104, 489–499. [Google Scholar] [CrossRef]
- Gilbert, R.O. Statistical Methods for Environmental Pollution Monitoring; Van Nostrand Reinhold Co.: New York, NY, USA, 1987. [Google Scholar]
- Salmi, T.; Maata, A.; Antilla, P.; Ruoho-Airola, T.; Amnell, T. Detecting Trends of Annual Values of Atmospheric Pollutants by the Mann-Kendall Test and Sen’s Slope Estimates—The Excel Template Application Makesens; Finnish Meteorological Institute: Helsinki, Finland, 2002. [Google Scholar]
- Luo, Y.; Liu, S.; Fu, S.F.; Liu, J.; Wang, G.; Zhou, G. Trends of precipitation in Beijiang River Basin, Guangdong Province, China. Hydrol. Process. 2008, 22, 2377–2386. [Google Scholar] [CrossRef]
- Reeve, M.A.; Syed, M.D.; Hossain, P.R.; Maainuddin, G.; Mamnun, N. Community level perceptions of the monsoon onset, withdrawal and climatic trends in Bangladesh, Theme: Prediction and predictability of the monsoon, extended abstract. In Proceedings of the International Conference on Opportunities and Challenges in Monsoon Prediction in a Changing Climate (OCHAMP-2012), Pune, India, 21–25 February 2012; pp. 21–25.
- Marqunez, J.; Lastra, J.; Garcia, P. Estimation models for precipitation in mountainous regions: The use of GIS and multivariate analysis. J. Hydrol. 2003, 270, 1–11. [Google Scholar] [CrossRef]
- Phillips, D.L.; Dolph, J.; Mark, D. A Comparison of geostatistical procedures for spatial analysis of precipitation in mountainous terrain. Agric. For. Meteorol. 1992, 58, 119–141. [Google Scholar] [CrossRef]
- Creutin, J.O.C. Objective Analyses and mapping techniques for rainfall fields: An objective comparison. Water Resour. Bull. 1982, 18, 413–431. [Google Scholar] [CrossRef]
- Tabios, G.Q.; Salas, J.D. Comparative analysis of techniques for spatial interpolation of precipitation. Water Resour. Bull. 1985, 21, 365–380. [Google Scholar] [CrossRef]
- Landau, S.; Barnett, V. A comparison of methods for climate data interpolation, in the context of yield predictions from Winter wheat simulation models. Aspects Biol. 1996, 46, 13–22. [Google Scholar]
- Cornford, D. The Development and Application of Techniques for Mapping Daily Minimum Air Temperatures. Ph.D. Thesis, University of Birmingham, Birmingham, UK, 1997. [Google Scholar]
- Lennon, J.J.; Turner, J.R.G. Predicting the spatial distribution of climate: Temperature in Great Britain. J. Anim. Ecol. 1995, 64, 370–392. [Google Scholar] [CrossRef]
- Jarvis, C.C.; Stuart, N. A Comparison among Strategies for Interpolating Maximum and Minimum Daily Air Temperatures. Part II: The Interaction between Number of Guiding Variables and the Type of Interpolation Method. Am. Meteorol. Soc. 2001, 40, 1075–1084. [Google Scholar] [CrossRef]
- Bolstad, P.V.; Swift, L.; Collins, F.; Regniere, J. Measured and predicted air temperatures at basin to regional scales in the southern Appalachian Mountains. Agric. For. Meteorol. 1998, 91, 161–178. [Google Scholar] [CrossRef]
- Tomislav, H.; Geuvelink, G.B.M.; Stein, A. Comparison of Krigging with External Drift and Regression-Krigging, Technical Note, 2003, ITC. Available online: https://www.itc.nl/library/Papers_2003/misca/hengl_comparison.pdf (accessed on 5 April 2016).
- Ahmed, R.; Karmakar, S. Arrival and withdrawal dates of the summer monsoon in Bangladesh. Int. J. Climatol. 1993, 13, 727–740. [Google Scholar] [CrossRef]
- Kumar, R.; Anil, D.; Bhowmik, S.K.R. Evaluation of physics options of the Weather Research and Forecasting (WRF) Model to simulate high impact heavy rainfall events over Indian Monsoon region. GEOFIZIKA 2010, 27, 101–125. [Google Scholar]
- Murata, F.; Terao, T.; Kiguchi, M.; Fukushima, A.; Takahashi, K.; Hayashi, T.; Habib, A.; Bhuiyan, M.S.; Choudhury, S.A. Daytime thermodynamic and airflow structures over Northeast Bangladesh during the pre-monsoon season: A Case Study on 25 April 2010. J. Meteorol. Soc. Jpn. 2011, 89, 167–179. [Google Scholar] [CrossRef]
- Mondal, A.; Kundu1, S.; Mukhopadhyay, A. Rainfall trend analysis by Mann-Kendall test: A case study of North-Eastern part of Cuttack district, Orissa. Int. J. Geol. Earth Environ. Sci. 2012, 2, 70–78. [Google Scholar]
- Allen, C.D.; Macalady, A.K.; Chenchouni, H.; Bachelet, D.; McDowell, N.; Vennetier, M.; Kitzberger, T.; Rigling, A.; Breshears, D.D.; Hogg, E.H.; et al. A global overview of drought and heat-induced tree mortality reveals emerging climate change risks for forests. For. Ecol. Manag. 2010, 259, 660–684. [Google Scholar] [CrossRef]


| Variables | Season | Constant Α | Slope β | Level of Significance | Model R Square |
|---|---|---|---|---|---|
| Independent: Seasonal Average Temperature (°C) Dependent: Total Seasonal Rainfall (mm) | Pre-Mon | 9139 | −170 | 0.001 | 0.519 |
| Monsoon | 3283 | −66 | 0.608 | 0.10 | |
| Post-Mon | 2665 | −78 | 0.322 | 0.035 | |
| Winter | 394 | −17 | 0.049 | 0.131 | |
| Independent: Average Maximum Temperature (°C) Dependent: Total Seasonal Rainfall (mm) | Pre-Mon | 5457 | −153 | 0.001 | 0.643 |
| Monsoon | 3618 | −70 | 0.446 | 0.021 | |
| Post-Mon | 5113 | −147 | 0.059 | 0.122 | |
| Winter | 651 | −23 | 0.001 | 0.317 | |
| Independent: Average Minimum Temperature (°C) Dependent: Total Seasonal Rainfall (mm) | Pre-Mon | 3315 | −128 | 0.006 | 0.244 |
| Monsoon | 1249 | 6 | 0.972 | 0.001 | |
| Post-Mon | 737 | −8 | 0.904 | 0.001 | |
| Winter | 80 | −3 | 0.750 | 0.004 |
© 2016 by the authors; licensee MDPI, Basel, Switzerland. This article is an open access article distributed under the terms and conditions of the Creative Commons by Attribution (CC-BY) license (http://creativecommons.org/licenses/by/4.0/).
Share and Cite
Syed, M.A.; Al Amin, M. Geospatial Modeling for Investigating Spatial Pattern and Change Trend of Temperature and Rainfall. Climate 2016, 4, 21. https://doi.org/10.3390/cli4020021
Syed MA, Al Amin M. Geospatial Modeling for Investigating Spatial Pattern and Change Trend of Temperature and Rainfall. Climate. 2016; 4(2):21. https://doi.org/10.3390/cli4020021
Chicago/Turabian StyleSyed, Md. Abu, and M. Al Amin. 2016. "Geospatial Modeling for Investigating Spatial Pattern and Change Trend of Temperature and Rainfall" Climate 4, no. 2: 21. https://doi.org/10.3390/cli4020021
APA StyleSyed, M. A., & Al Amin, M. (2016). Geospatial Modeling for Investigating Spatial Pattern and Change Trend of Temperature and Rainfall. Climate, 4(2), 21. https://doi.org/10.3390/cli4020021