Article

Potential Vegetation and Carbon Redistribution in Northern North America from Climate Change

1
Department of Geographical Sciences, University of Maryland, College Park, MD 20740, USA
2
Department of Plant Science and Landscape Architecture, University of Maryland, College Park, MD 20740, USA
*
Author to whom correspondence should be addressed.
Climate 2016, 4(1), 2; https://doi.org/10.3390/cli4010002
Submission received: 1 September 2015 / Revised: 21 November 2015 / Accepted: 16 December 2015 / Published: 6 January 2016
(This article belongs to the Special Issue Ecological Impacts of Climate Change)

Abstract

:
There are strong relationships between climate and ecosystems. With the prospect of anthropogenic forcing accelerating climate change, there is a need to understand how terrestrial vegetation responds to this change as it influences the carbon balance. Previous studies have primarily addressed this question using empirically based models relating the observed pattern of vegetation and climate, together with scenarios of potential future climate change, to predict how vegetation may redistribute. Unlike previous studies, here we use an advanced mechanistic, individually based, ecosystem model to predict the terrestrial vegetation response from future climate change. The use of such a model opens up opportunities to test with remote sensing data, and the possibility of simulating the transient response to climate change over large domains. The model was first run with a current climatology at half-degree resolution and compared to remote sensing data on dominant plant functional types for northern North America for validation. Future climate data were then used as inputs to predict the equilibrium response of vegetation in terms of dominant plant functional type and carbon redistribution. At the domain scale, total forest cover changed by ~2% and total carbon storage increased by ~8% in response to climate change. These domain level changes were the result of much larger gross changes within the domain. Evergreen forest cover decreased 48% and deciduous forest cover increased 77%. The dominant plant functional type changed on 58% of the sites, while total carbon in deciduous vegetation increased 107% and evergreen vegetation decreased 31%. The percent of terrestrial carbon from deciduous and evergreen plant functional types changed from 27%/73% under current climate conditions, to 54%/46% under future climate conditions. These large predicted changes in vegetation and carbon in response to future climate change are comparable to previous empirically based estimates, and motivate the need for future development with this mechanistic model to estimate the transient response to future climate changes.

1. Introduction

Previous research has demonstrated a strong relationship between climate and the distribution of terrestrial ecosystems [1,2,3,4], and anthropogenic forcing is expected to change future climate at its greatest rate in the next century [5,6,7,8,9]. Forests have important biophysical and biogeochemical properties relevant to climate and, contain roughly 80% of above ground carbon and sequester approximately 30% of annual fossil fuel carbon emissions [10]. Therefore, how terrestrial ecosystems respond to future climate and the carbon consequences associated with this change are important research topics [10,11,12].
The potential equilibrium response of vegetation to climate change has previously been estimated using empirically derived climate-ecosystem relationships [1,2,3]. Köppen used a classification system based on temperature, evapotranspiration rate, seasonality of precipitation, and severity of dry season to predict ecosystem type [1]. Holdrige’s diagram is considered the most iconic climate-ecosystem classification scheme and produced an ecosystem classification key based on temperature, precipitation, and evapotranspiration [4]. Thornthwaite used the variables precipitation effectiveness and temperature efficiency, based strongly on transpiration, to generate eight major climate regions [2,3]. When given a climate change scenario, these empirical schemes have been used to map potential future ecosystem distributions [13,14,15,16]. Moreover, using two climate data sets, Prentice found that they could replicate ~80% of the observed land surface before predicting future distribution from climate change [17].
While equilibrium response of vegetation to climate is important, the transient response is also important, potentially introducing lags in response, novel communities, and other patterns [18,19]. Estimation of these transient responses requires the use of mechanistic models able to predict the consequences of limited and varied dispersal, plant competition, and other factors. Generally, progress applying such models to this problem is limited. TreeMig is one of the more advanced mechanistic gap models [20]. It accounts for within-cell heterogeneity of the 30 most important Central European species and includes such forest dynamic aspects as growth, competition, mortality, seed production, seed bank dynamics, dispersal, germination, and sapling development. TRIFFID is a process-based model that uses a top-down approach ideal for large domain simulations, and can simulate land-surface interactions when coupled with JULES [21,22]. SEIB-DGVM is a spatially explicit forest model that scales up to a larger domain to research the transient response [23,24]. Despite this progress, additional work is needed to examine the transient response mechanistically over large domains.
Here we used an advanced individually based mechanistic ecosystem model that is formulated to overcome many of these limitations, and applied it to predict the response of vegetation and carbon to future climate over northern North America. As implemented, the model is pseudo-spatial, which decreases computation time while retaining individually based formulation. Specifically, this study (1) validated model predicted dominant plant functional type (PFT) distribution in northern North America under current climate conditions through a comparison with remote sensing data and (2) used a future climate change scenario as input to simulate the equilibrium response of the expected redistribution of dominant PFTs and carbon.

2. Methods

2.1. Model

The Ecosystem Demography (ED) model [25,26] is an individual tree based model that uses a size and age-structured approximation for the first moment of the underlying spatial stochastic process of vegetation dynamics. ED differs from most terrestrial models by using a size-age-structure approximation of the first moment of the stochastic simulator to scale. Thus it is an individual-based model of vegetation dynamics with submodels of growth, mortality, water, phenology, biodiversity, disturbance, hydrology, and soil biogeochemistry. Individual PFTs compete mechanistically for water, nutrients, and light. It has been successfully implemented in South and Central America, the United States, and is currently being used in NASA’s Carbon Monitoring System [27] and the upcoming NASA mission GEDI.
Plants in ED are represented by PFTs, which partition vegetation into discrete classes defined by physiognomy, leaf habitat, photosynthetic pathway, leaf form, and other characteristics [28,29,30,31]. Following Hurtt et al. 2002 [32], trees in North America were represented by two dominant types, cold deciduous and evergreen. ED was modified from its previous implementation over the U.S. for high latitudes [33], and to improve downregulation of carboxylation rates as available light decreases on descending the vertical canopy for each PFT. The maximum carboxylation rate for evergreen was set to 9 μmols·m−2·s−1 and deciduous to 7 μmols·m−2·s−1 which is consistent with literature values [30,34,35].
ED was then run for 500 years with current climate data in the domain of northern North America (40°N to 75°N and 165°W to 50°W) to establish the predicted current dominant PFT. The average year of the entire dataset (1901–2010) was used as the driver. Dominant PFT was determined by applying the National Land Cover Dataset 1992 (NLCD92) [36] forest classification definitions of deciduous, evergreen, and mixed forests to the output. These definitions call for 25% of a site to have tree cover to be classified a forest, and greater than 75% of that cover to be a specific type to not be considered a mixed forest. ED was then run with a future climatology over the same domain using the average of the last five years of the dataset (2065–2070). The model was run for 500 years and the NLCD92 classification applied as in the previous part. A comparison between current and future dominant PFT showed the percentage of sites expected to convert type and the specific conversions (i.e., evergreen becomes deciduous forest, non-forest becomes evergreen).

2.2. Climate Data

Two climate datasets were used. A current climate dataset to initialize the model to contemporary conditions and compare model predictions of dominant PFT against remote sensing data, and a future climate dataset for use as input to simulate future ecosystem dynamics and redistribution of dominant types. Increases in resolution improve the ability to adequately capture all aspects of forest dynamics [37], so the highest resolution climate change data set available with the inputs necessary to drive ED was chosen. The climate attributes that drive ED are specific humidity, surface temperature, precipitation, and photosynthetically active radiation. Though new climate change datasets are constantly produced they often do not contain the specific humidity data ED requires. For contemporary conditions, the North America Carbon Program (NACP) data set from the Multi-Scale Synthesis and Terrestrial Model Intercomparison Project (MsTMIP) was used [38,39]. This data is referred to as CRUNCEP and is a combination of the Climate Research Unit (CRU) and National Centers for Environmental Prediction (NCEP) climatologies. CRUNCEP is a global 0.5 × 0.5 degree climatology with a 6 h daily time step from 1901–2010 in a WGS84 projection.
For the future, the North American Climate Change Assessment Program (NARRCAP) produces multiple future climatologies with required attributes at ~50 km resolution [40]. NARCCAP provides climate change projections by coupling a set of regional climate models (RCMs) driven by a set of atmosphere-ocean general circulation models (AOGCMs) that are forced with the Special Report on Emission Scenarios (SRES) A2 scenario for the 21st century, which has atmospheric carbon increasing to 575 ppm by mid-century. The combination of the Community Climate System Model (CCSM) as the driving model and MM5I as the regional model was used. It contains future climate data for 2041–2070 at ~50 km resolution with 3 h daily times steps in a Lambert Conic Conformal projection. The NARCCAP climatology was converted to half-degree resolution with a WGS84 projection to match the CRUNCEP climatology.

2.3. Remote Sensing Data

Remote sensing and field data have provided a valuable resource in constraining ecosystem models [15]. To determine PFT distribution from remote sensing data the AVHRR Continuous Fields Tree Cover Product (CFTCP) produced by Global Land Cover Facility (GLCF) was used [41]. The product contains percent deciduous, coniferous, and total tree cover layers at 1 km resolution. CFTCP was averaged to 0.5 × 0.5 degree resolution to match the resolution of the climatologies and the NLCD92 classification that was applied to the model outputs used to generate a dominant PFT distribution from remote sensing under current climate conditions. The PFT distribution from current climate predicted by the model was validated against the remote sensing distribution.

3. Results

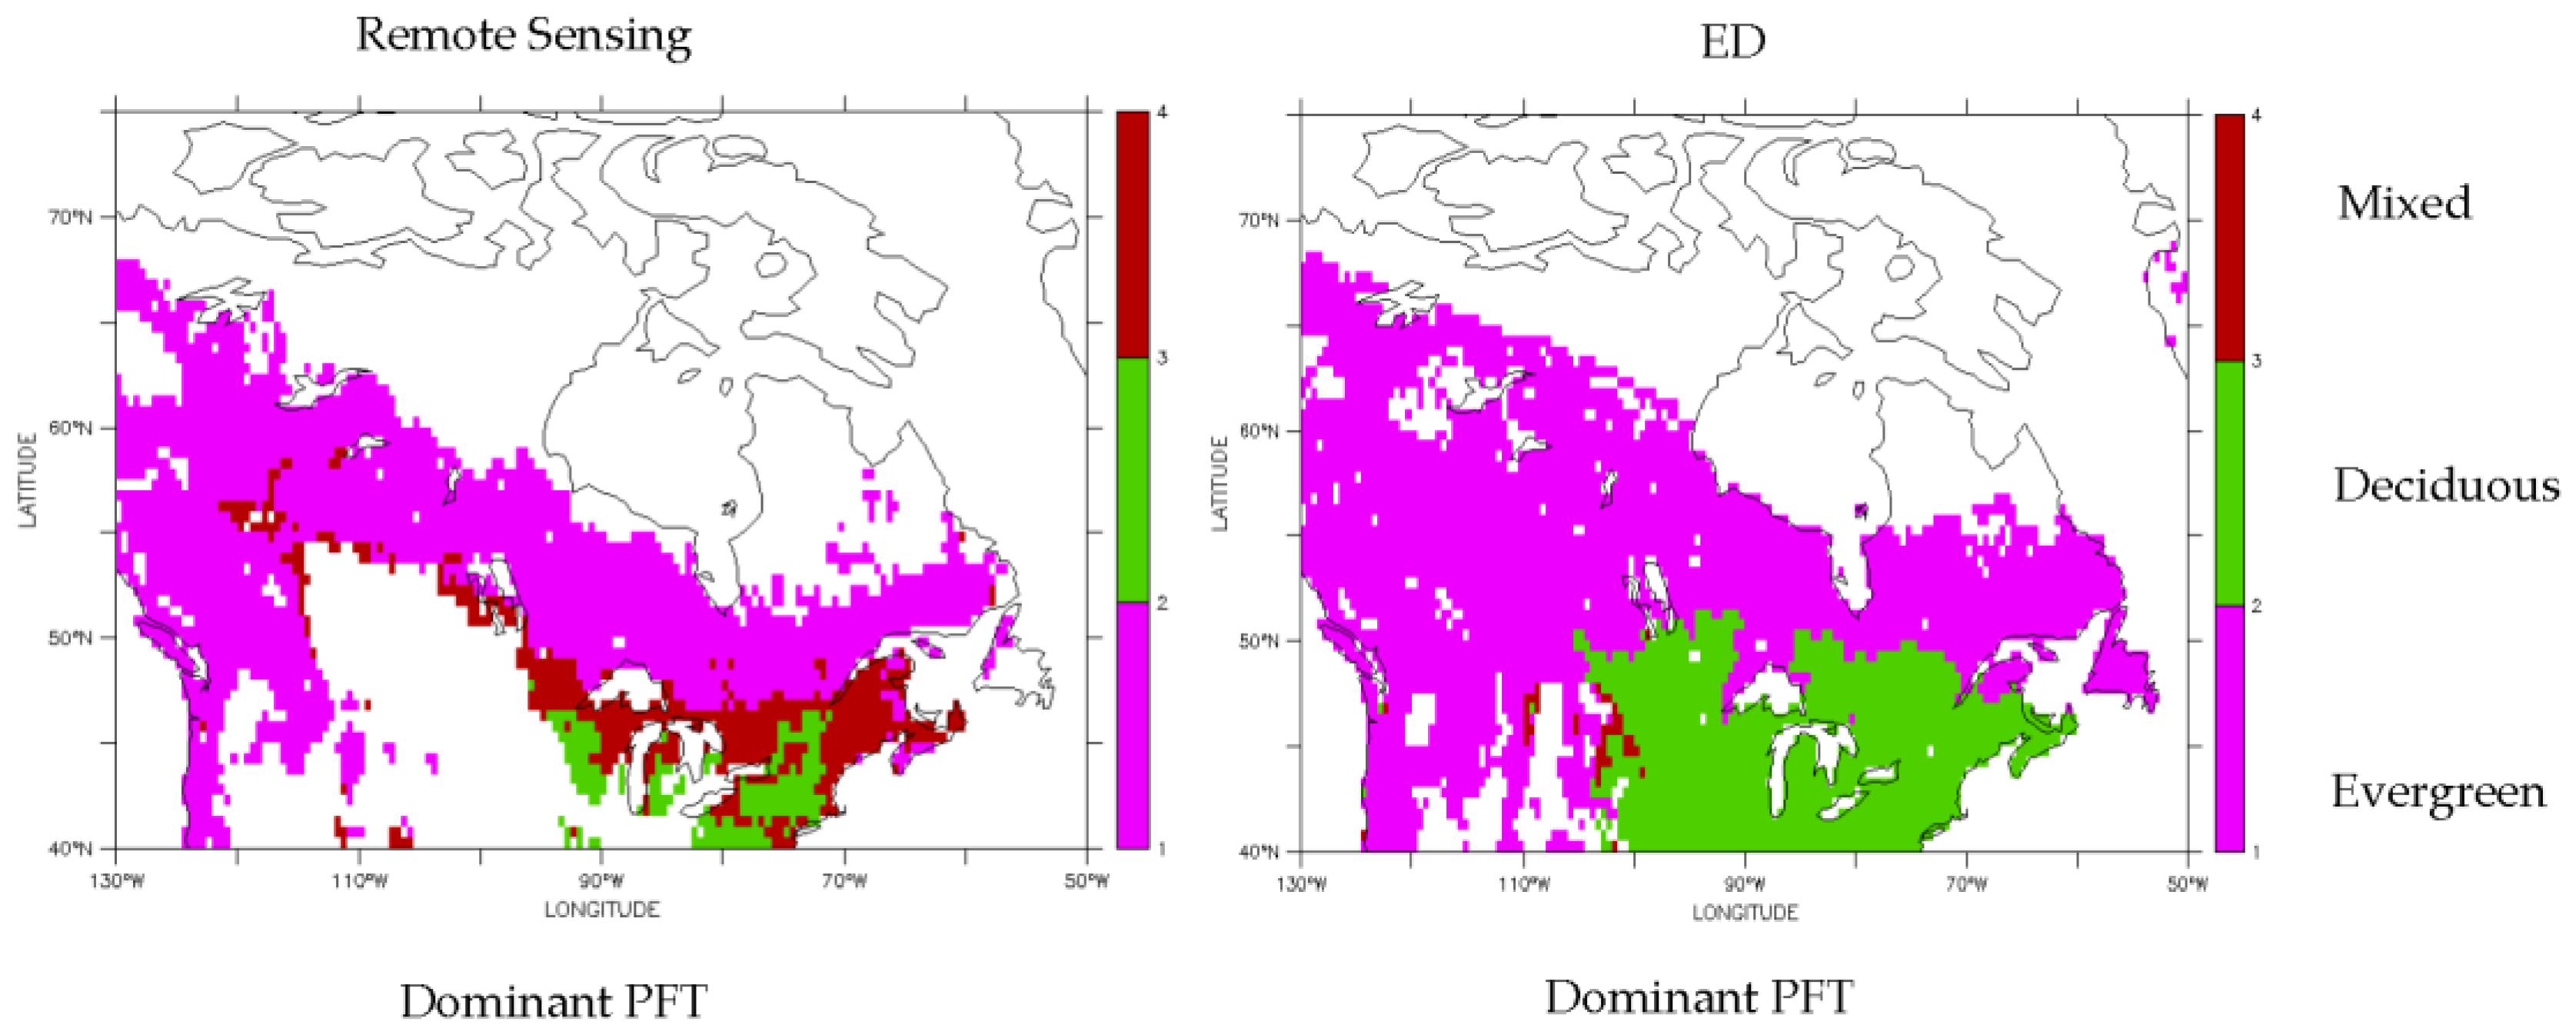
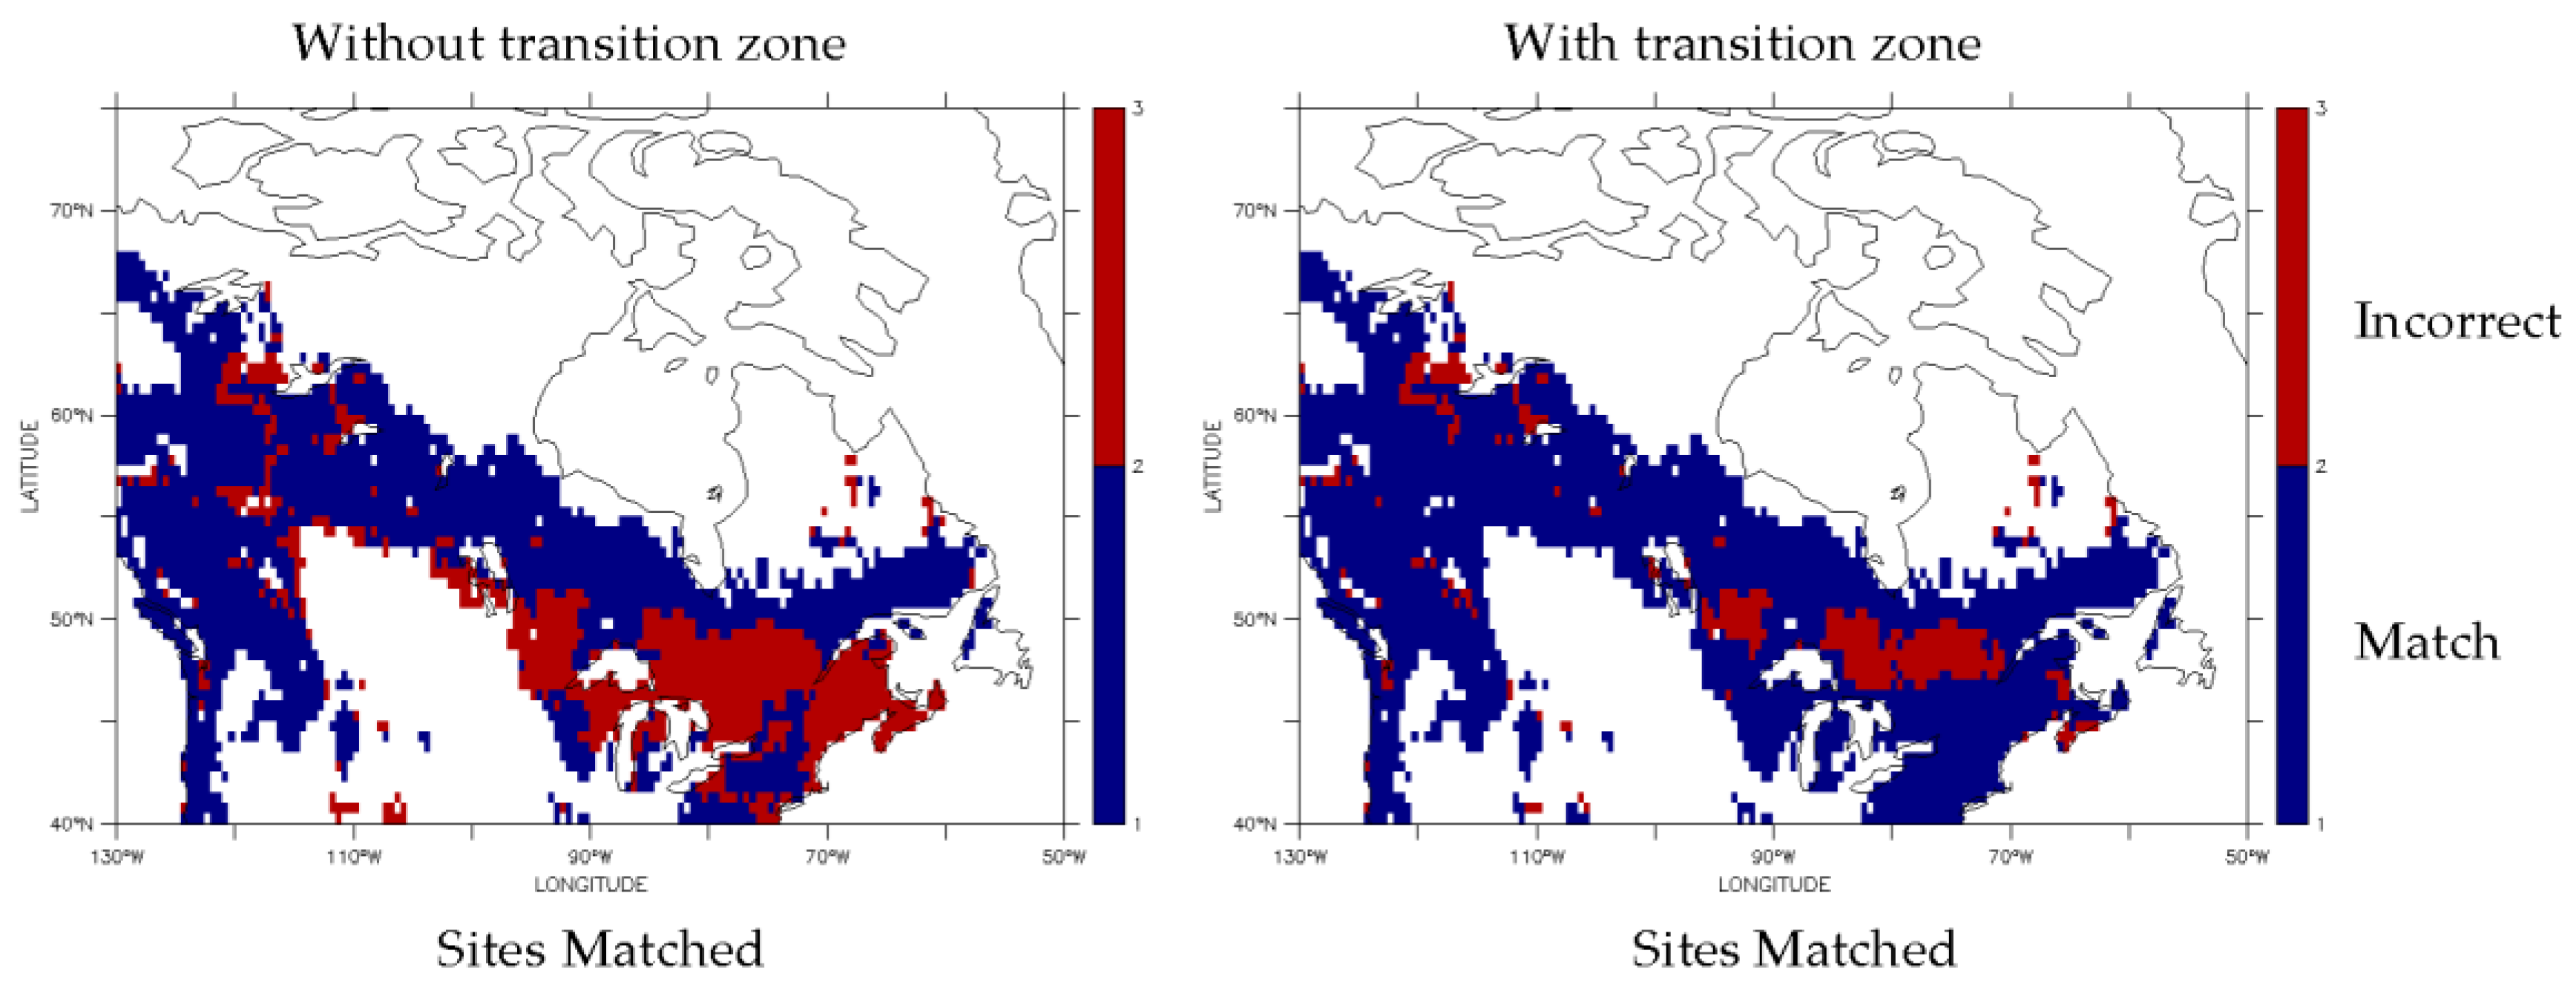
3.1. Dominant Plant Functional Type Distribution

The comparison of the distribution of the dominant PFT (evergreen or deciduous) in northern North America between remote sensing data and model prediction is presented in Figure 1. Despite considerable agreement, differences arise in this comparison because of fundamental difference between the remote sensing product (actual) and ED (potential) treatment of forest. To gain the fairest comparison, we restricted our analysis to sites determined to be forest by remote sensing data. In 76% of the 3064 forested sites that met this criteria, model prediction of dominant PFT and remote sensing data were in agreement (Figure 2). By remote sensing, this area was comprised of 77% evergreen, 16% mixed, and 7% deciduous. Model prediction over this area was 74% evergreen, 26% deciduous, and less than 1% mixed. ED supported mixed forests sites, and a cluster exists around 45°N 110°W, but typically produced a prevalence of one dominant PFT per site. Therefore, the mixed forest boundary between deciduous and evergreen forests that appears in the remote sensing data was under represented in the model output. However, when mixed forest was considered a transition zone in the model, essentially combining the deciduous and mixed PFTs, the agreement increased to 82% (Figure 2).
Figure 1. Dominant PFT distribution from remote sensing data (left); and model prediction (right) from current climate.
Climate 04 00002 g001
Figure 2. Areas of agreement (blue) and disagreement (red) without (left) and with (right) the mixed forest considered a transition zone.
Climate 04 00002 g002

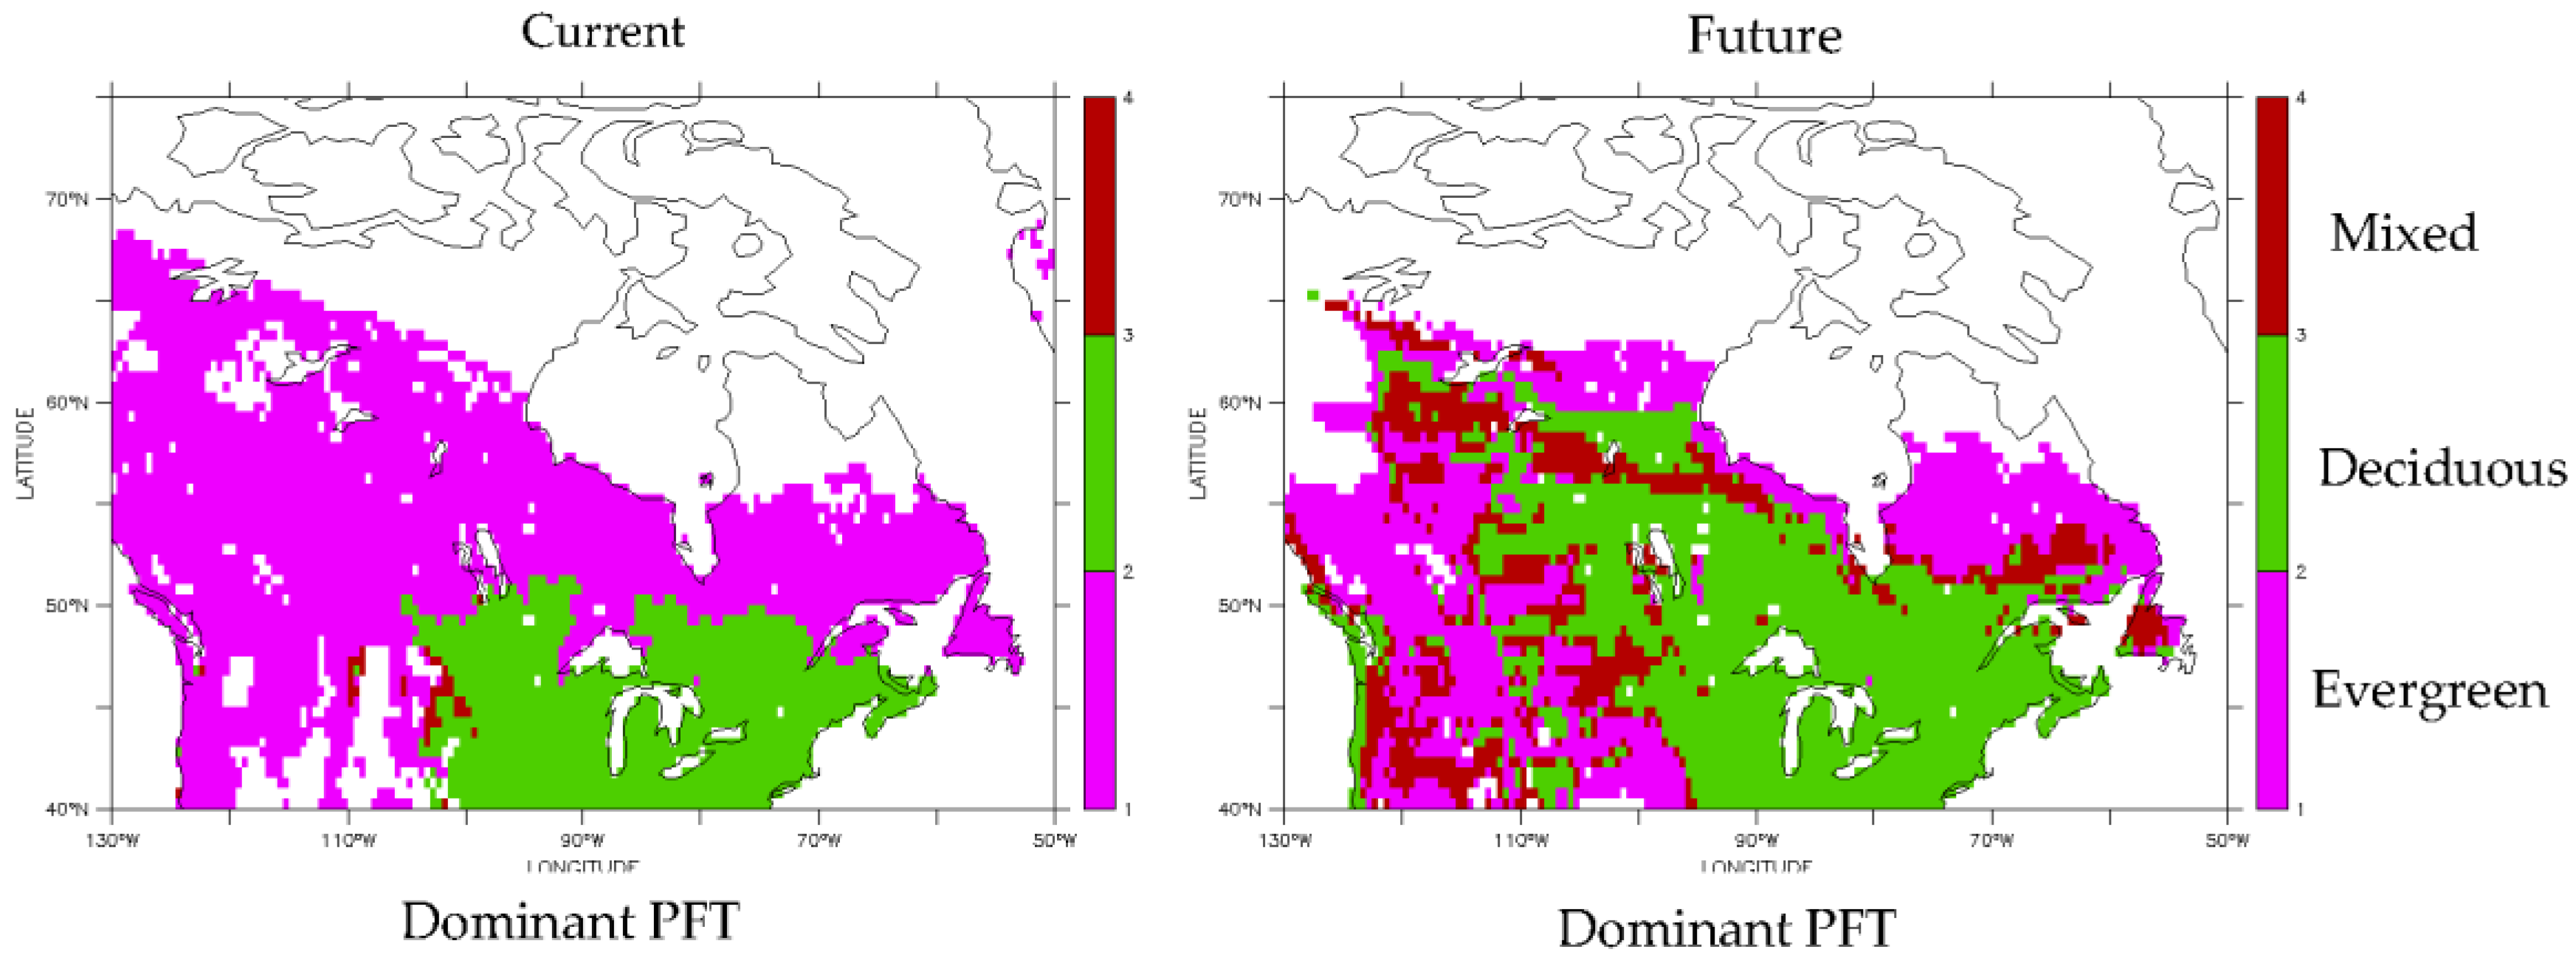
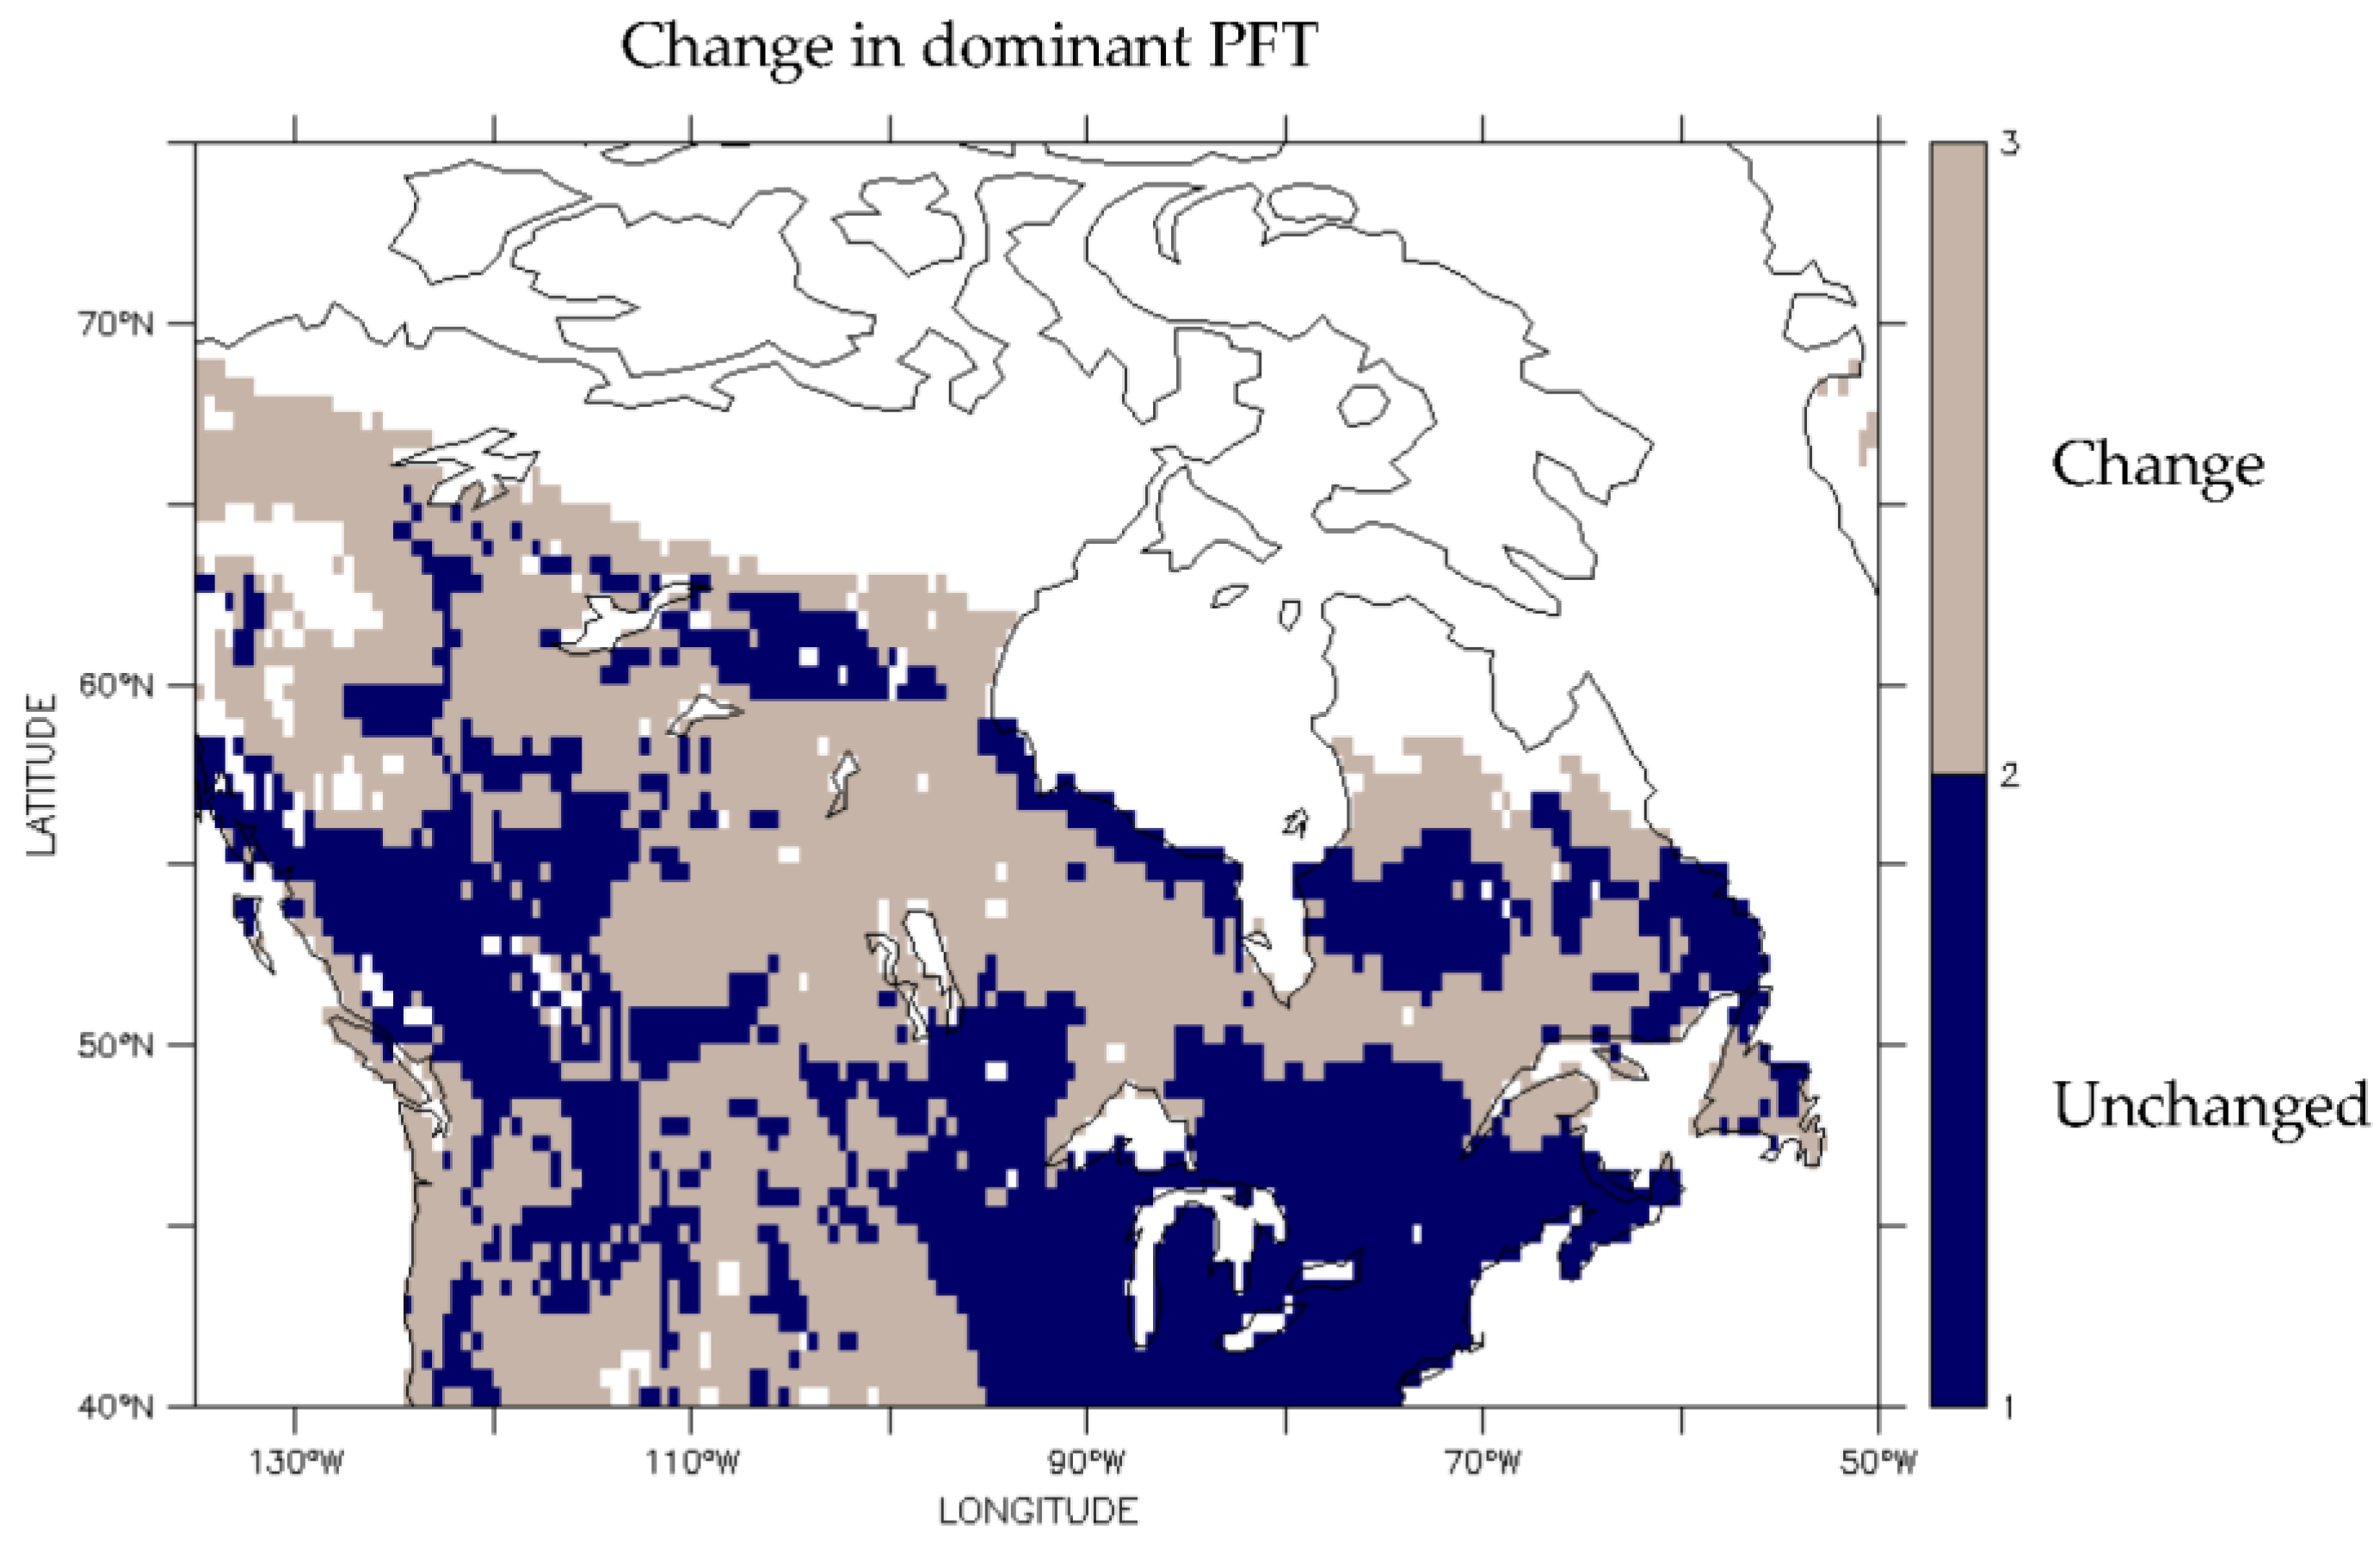
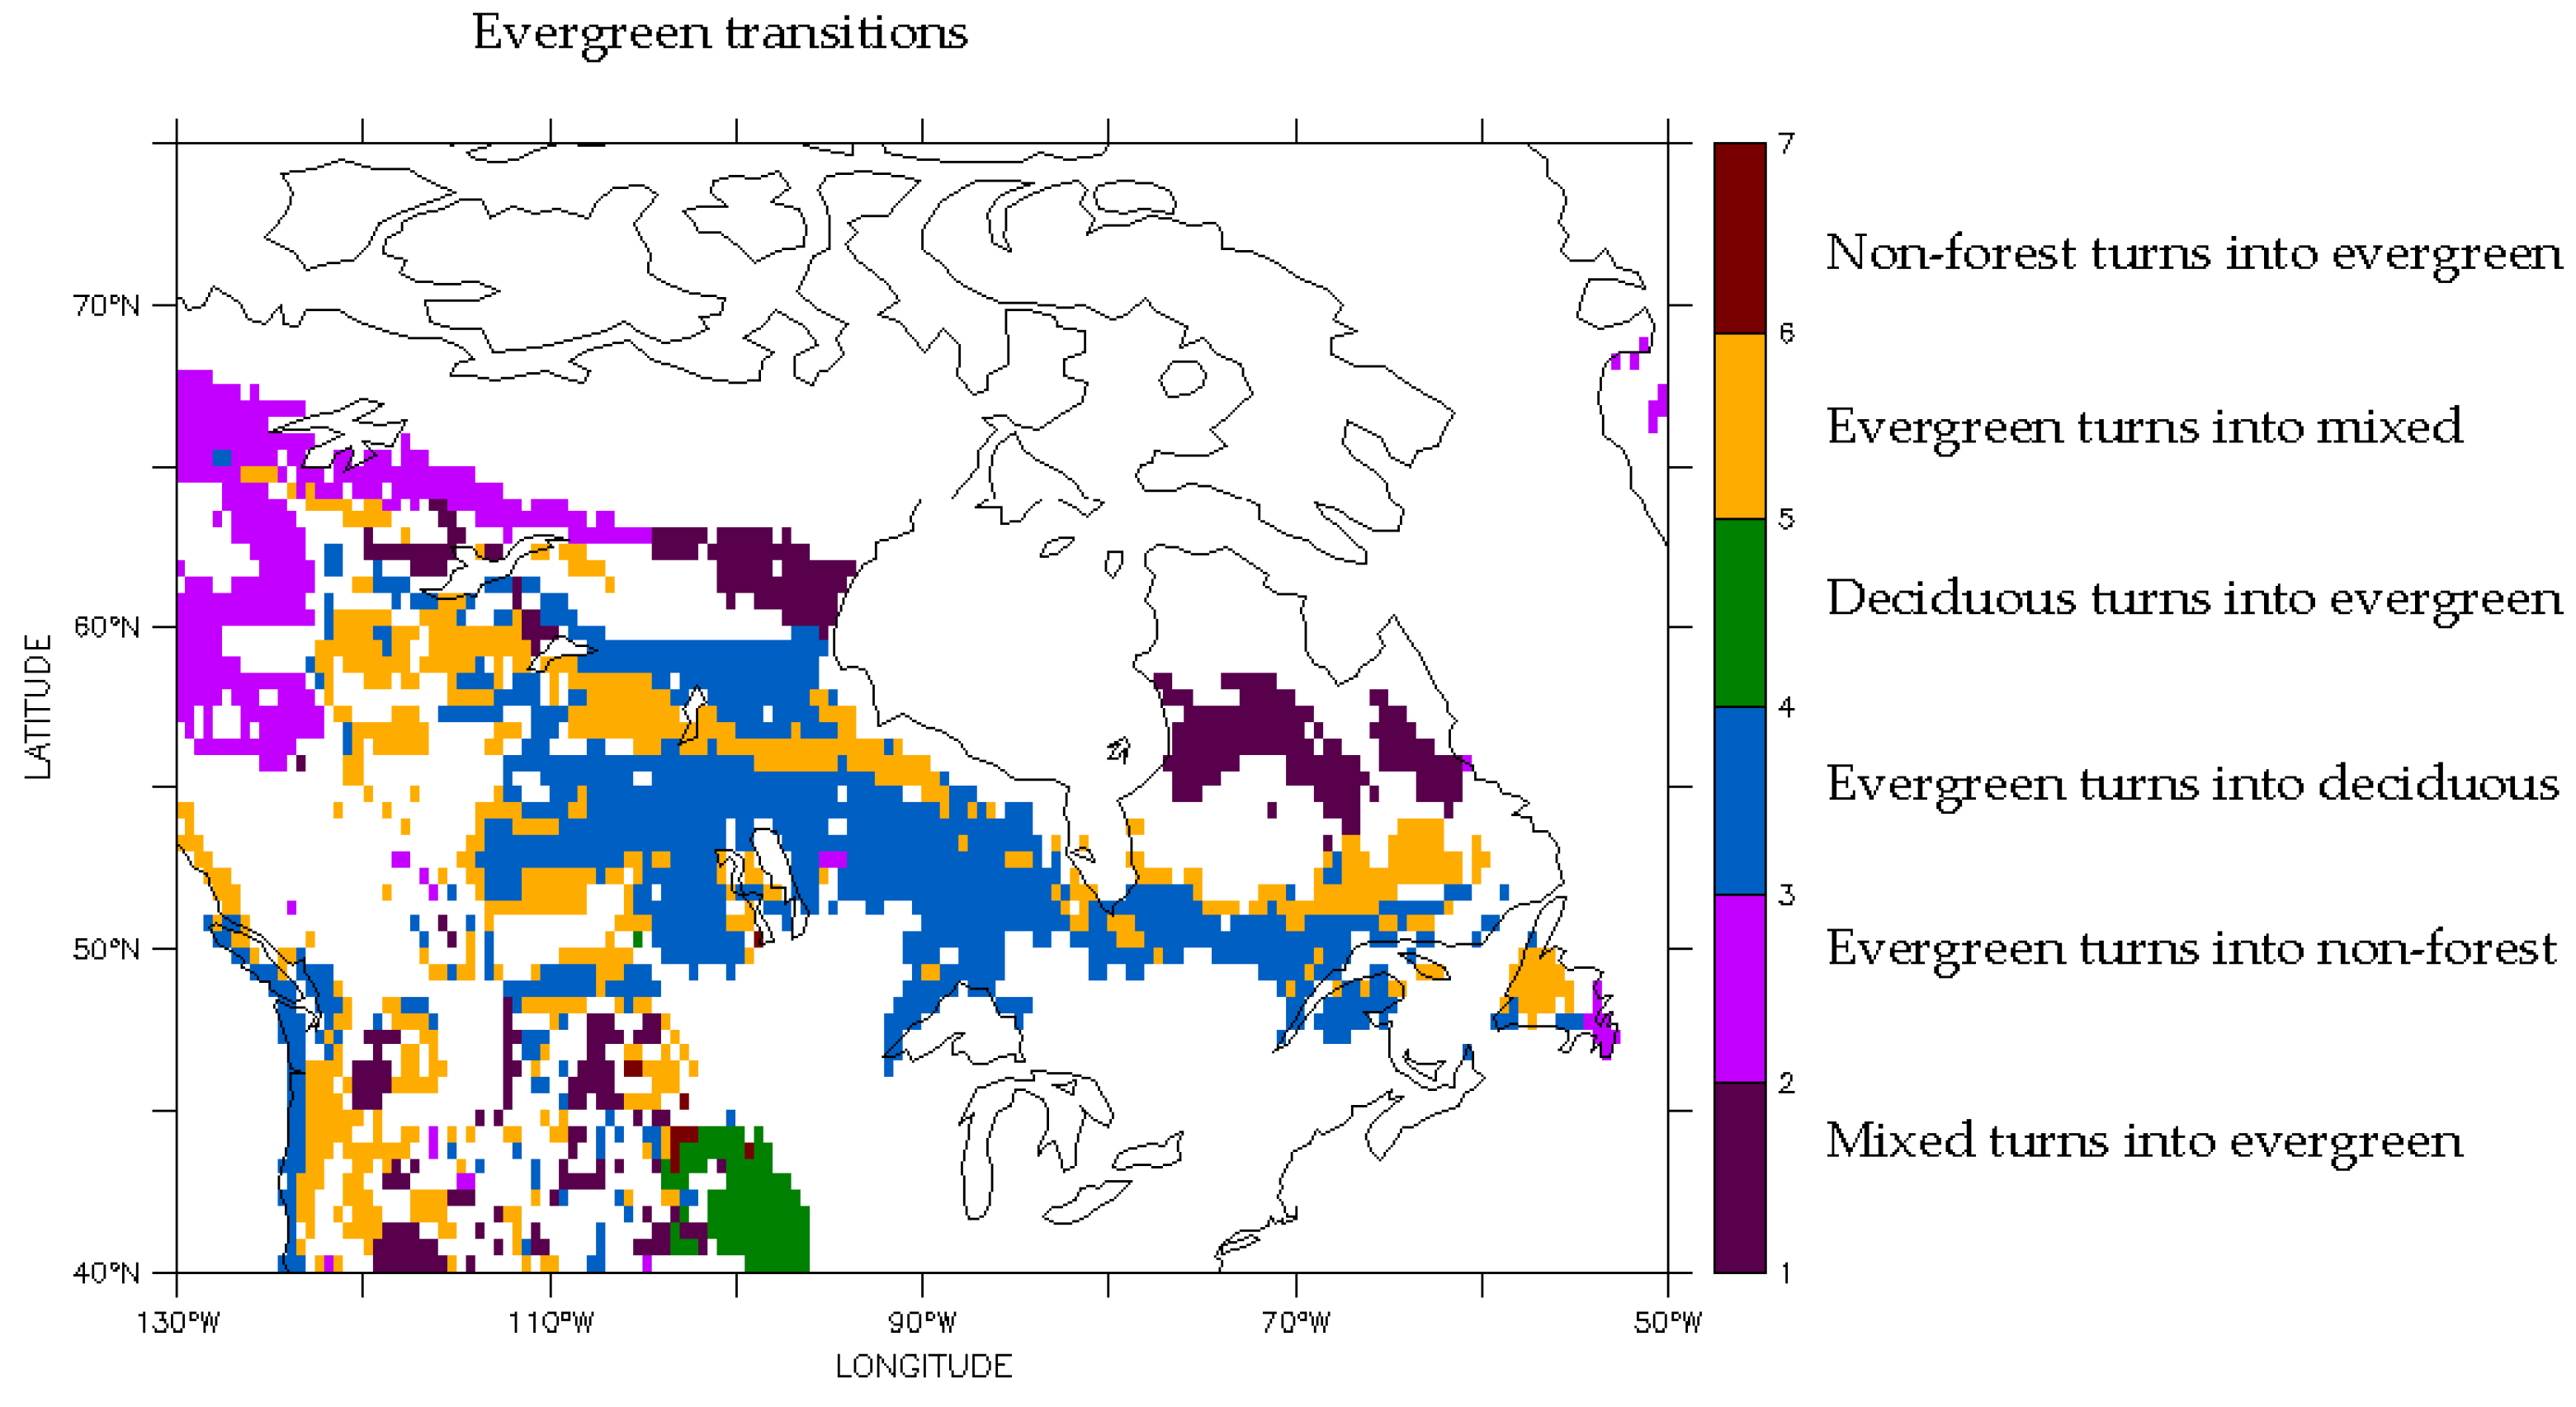
3.2. Predicted Dominant Plant Functional Type Redistribution from Climate Change

The predictions of dominant PFT distributions based on current climate were next compared to those based on future climate (Figure 3).
Figure 3. Contemporary and future predictions for mixed, deciduous, evergreen, and non-forest PFTs.
Climate 04 00002 g003
Under future climate conditions, total forest cover increased from 4764 sites to 4839 sites, a 2% increase. Deciduous sites increased from 1223 to 2159 sites, a 77% increase, while evergreen sites decreased from 3497 to 1811 sites, a 48% decrease. Overall, 58% of the domain changed dominant PFT (Figure 4). All the transitions between PFTs and non-forest were tracked, but evergreen expansion and withdrawal accounted for ~90% of the predicted change (Table 1). The transitions are shown with a dominant PFT change map (Figure 5).
Table 1. Percentage of sites in the domain that had either evergreen expansion or withdrawal. These changes accounted for 58% of the total 60% change in dominant PFT predicted.
Dominant Plant Functional Type ChangePercentage of Sites in Domain
Evergreen turns into deciduous21
Evergreen turns into mixed15
Non-forest turns into evergreen8
Evergreen turns into non-forest7
Deciduous turns into evergreen2
Mixed turns into evergreen>1
Figure 4. Sites that switch dominant PFT (gray) and remain unchanged (blue).
Climate 04 00002 g004
Figure 5. Predicted evergreen transitions of dominant plant functional from climate change.
Climate 04 00002 g005

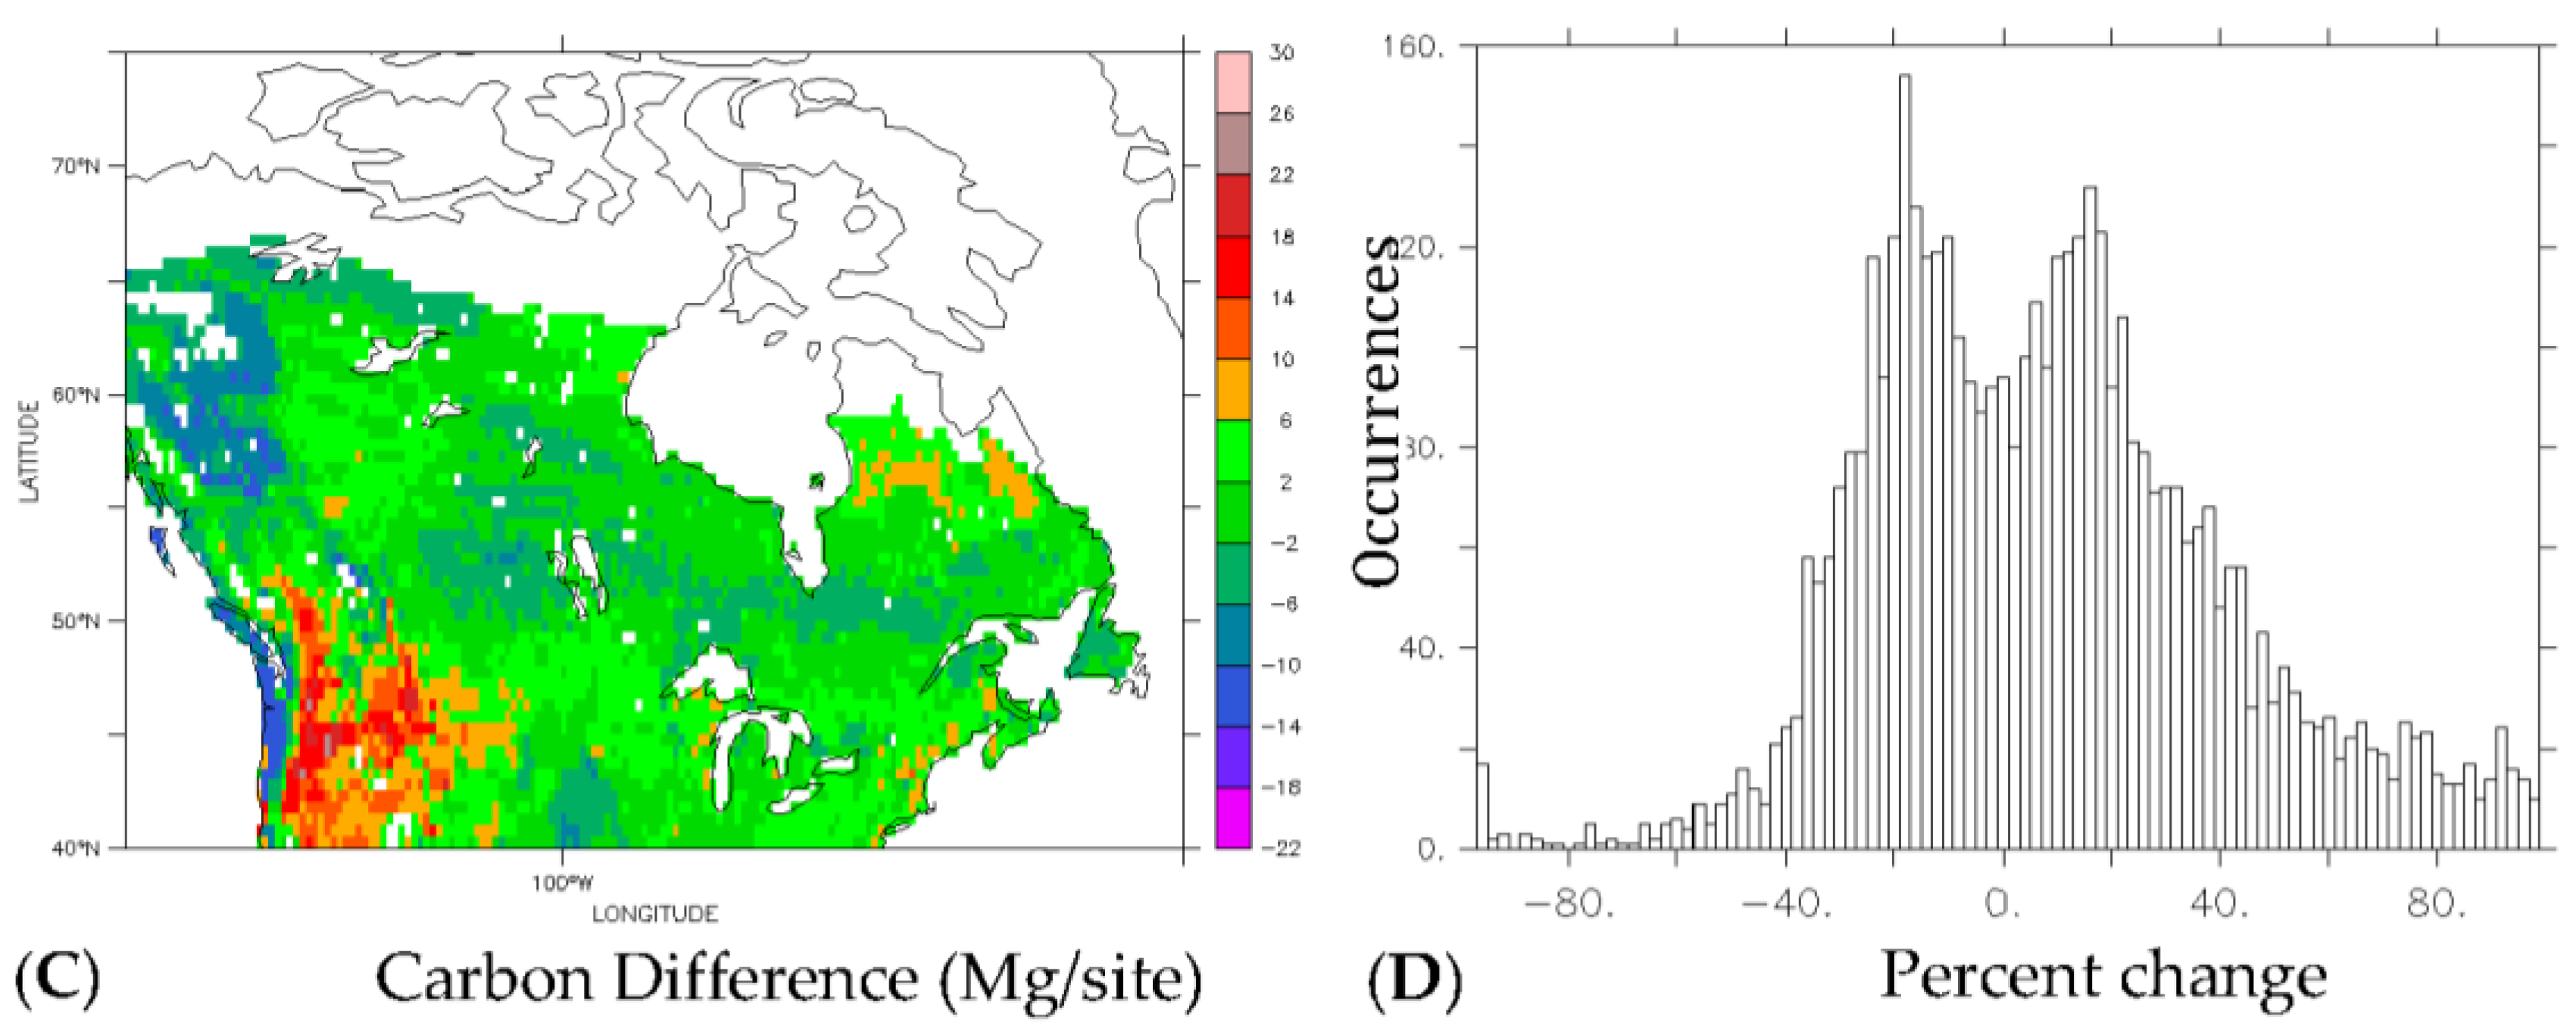
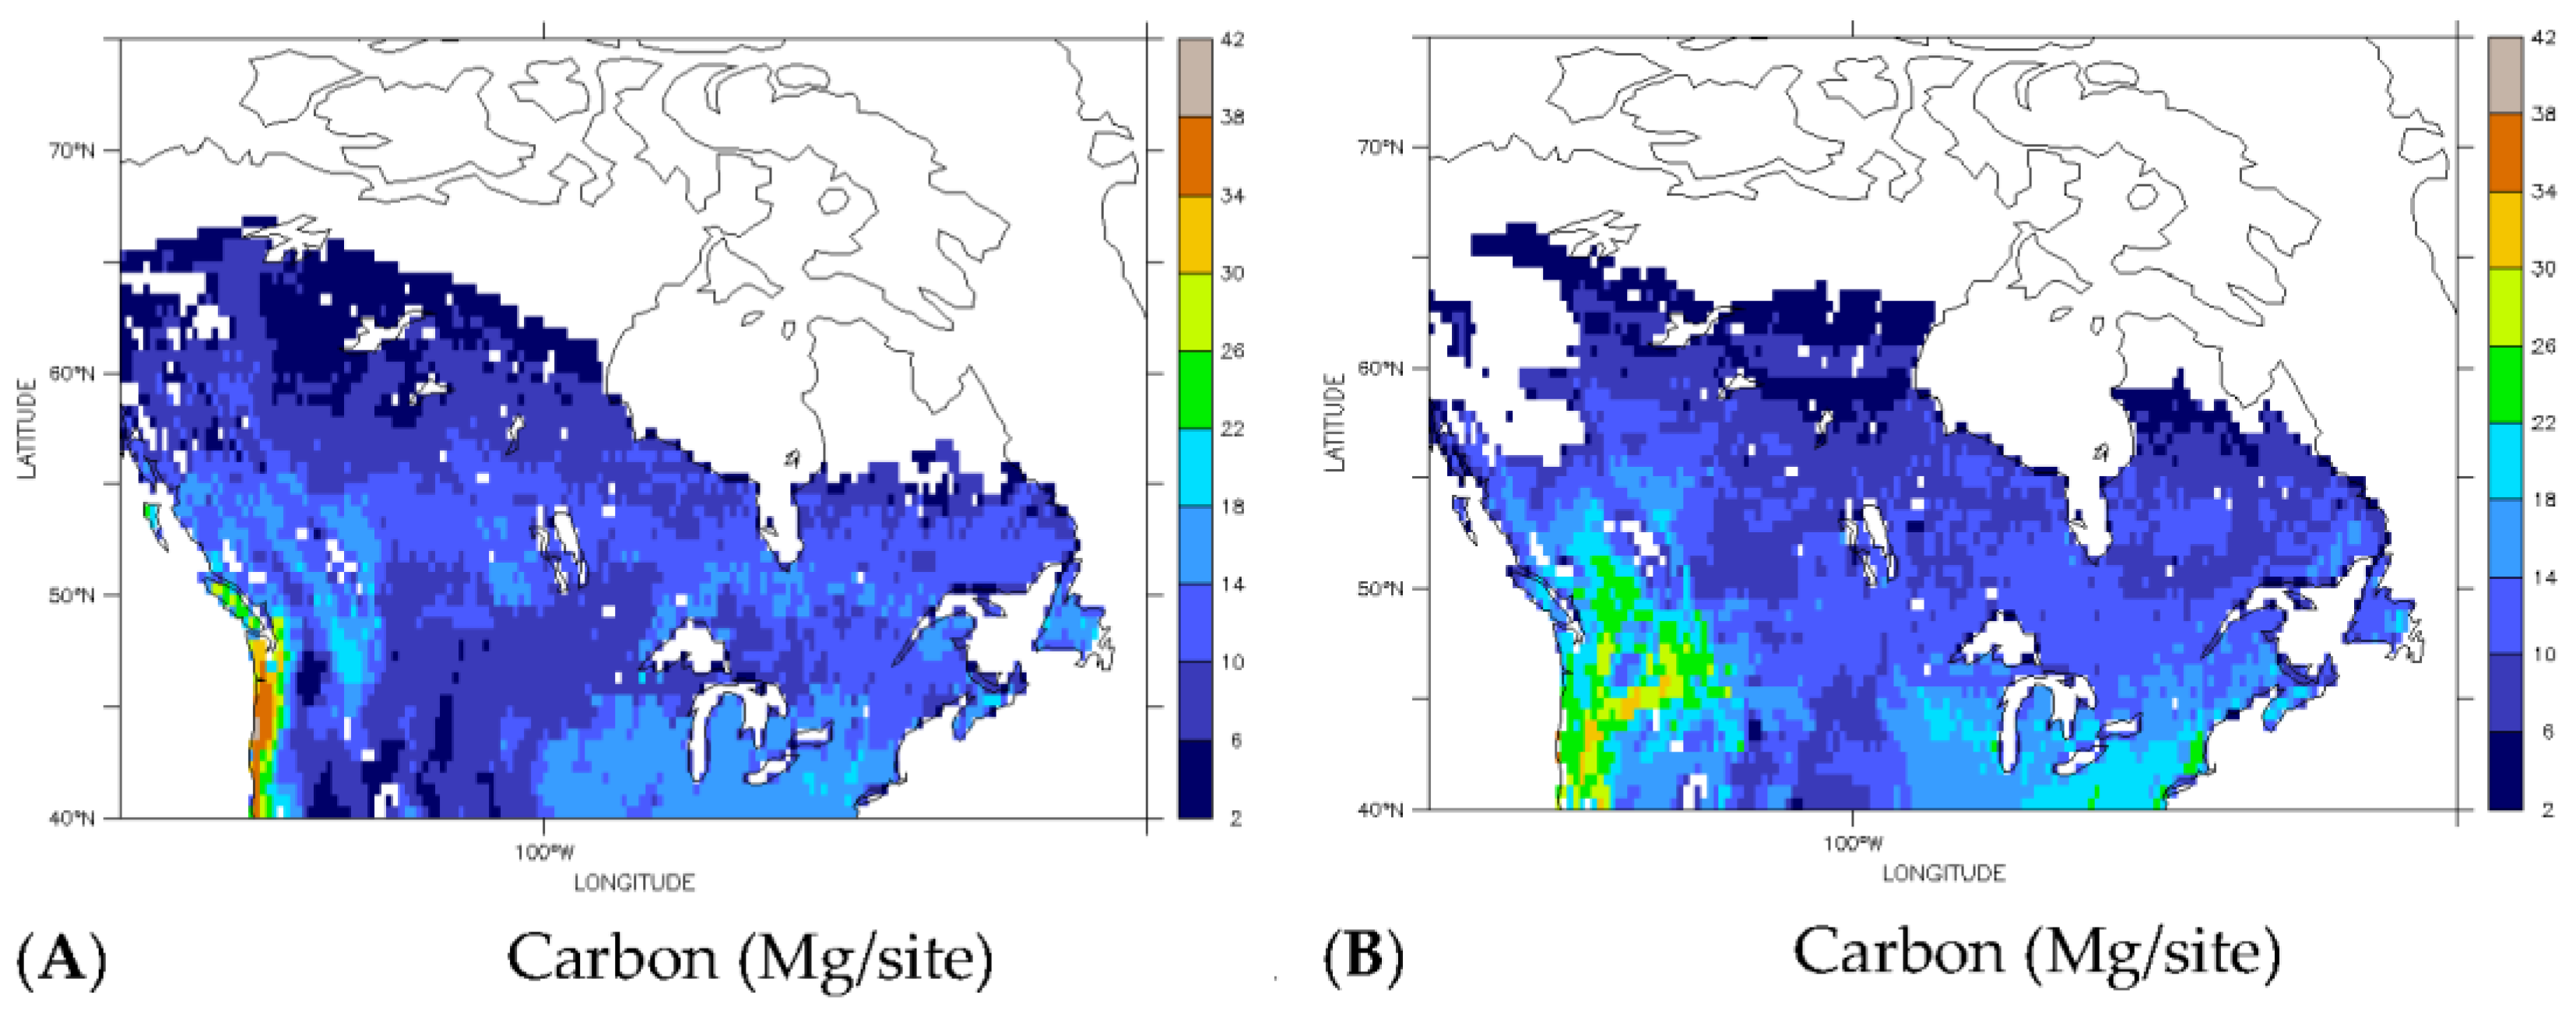
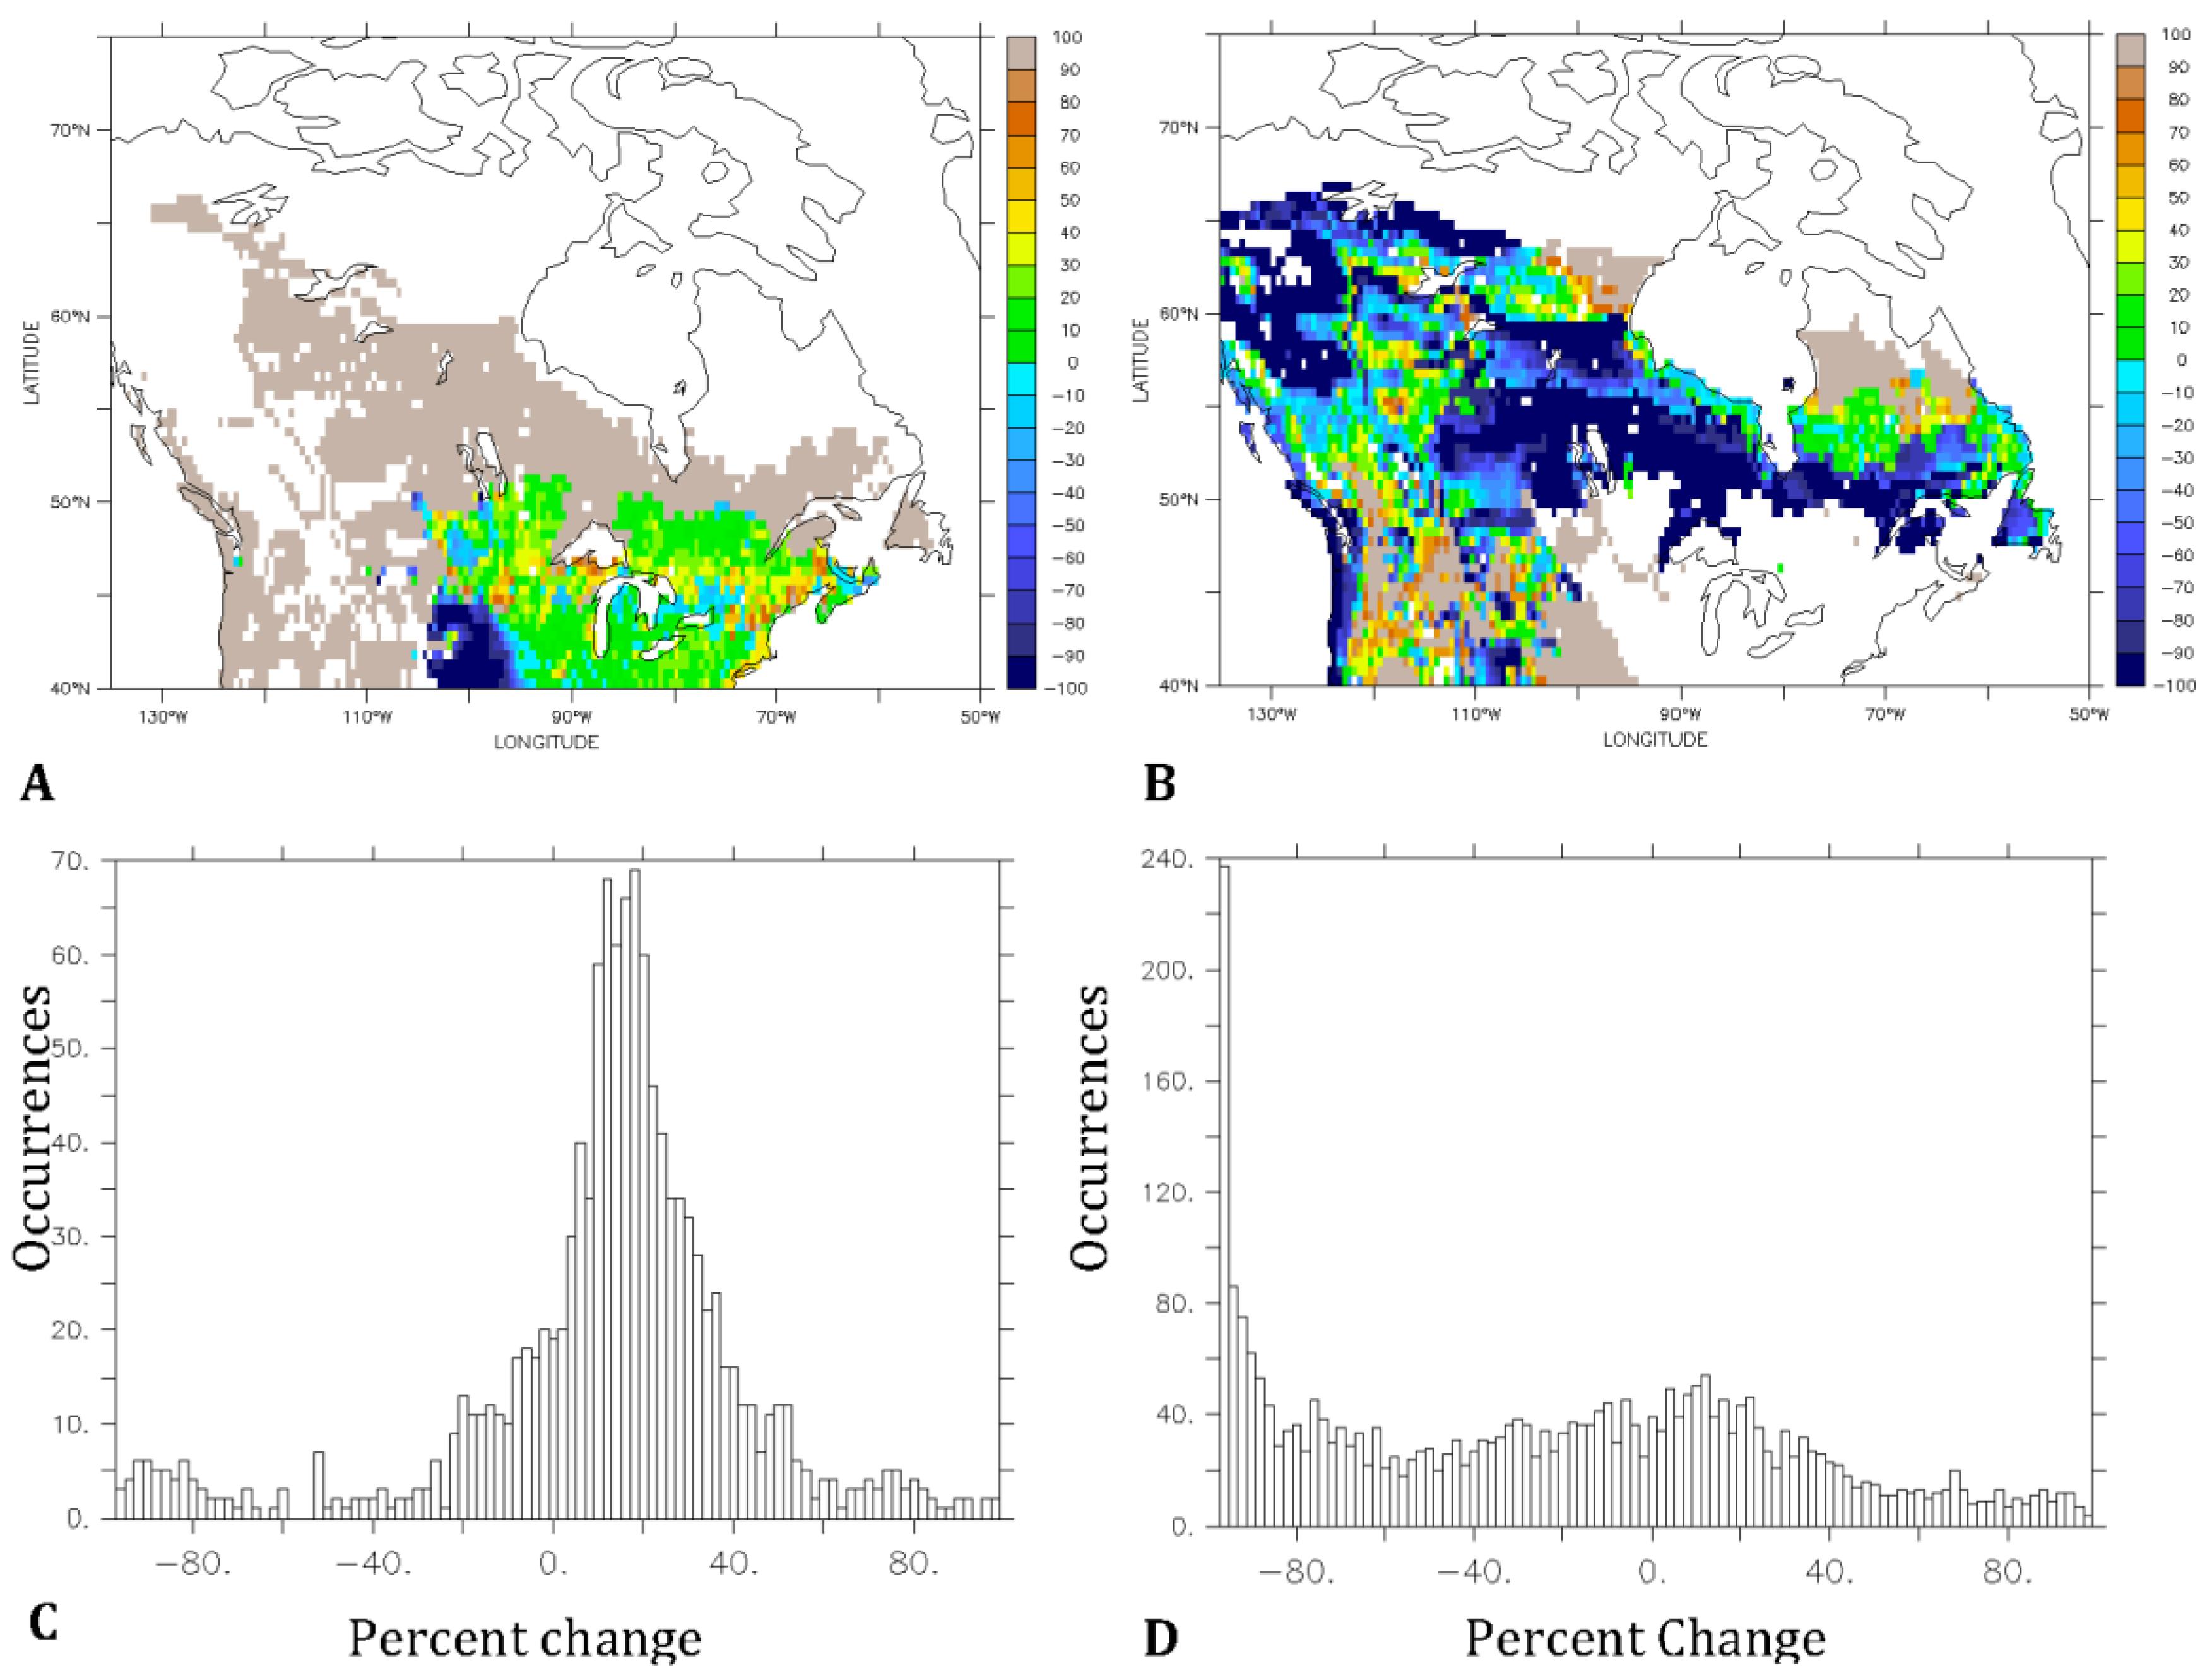
3.3. Implications for Carbon Redistribution and Change

The predicted redistribution of PFTs has implications for carbon stocks (Table 2) and fluxes (Table 3).
Table 2. Carbon amount, difference, and percent change predicted by ED for current and future climate.
Carbon (Tg)
Carbon TypeCurrentFutureDifferencePercent Change
Total545848
Deciduous153116107
Evergreen3927−12−31
Table 3. Percentage of total carbon comprised of deciduous and evergreen from current and future climate.
Percentage of Total Carbon
ScenarioDeciduousEvergreen
Current2872
Future5446
Figure 6. Predicted total carbon under (A) current climate and (B) future climate; (C) The carbon difference between the current and future; and (D) the percent change in carbon distribution.
Climate 04 00002 g006aClimate 04 00002 g006b
In response to climate change, total carbon across the domain increased 8%. This aggregate increase was a combined result of an increase in deciduous carbon and decrease in evergreen carbon. Total terrestrial carbon increased 4 Tg (8%), deciduous carbon increased 16 Tg (107%), and evergreen carbon decreased 12 Tg (31%). In terms of percentage of carbon by PFT, deciduous carbon increased from 28% to 54%, and evergreen carbon decreased from 72% to 46%. Though regional total carbon increases are relatively modest, the underlying gridded changes were larger and had a wide distribution (Figure 6), and differed by PFT (Figure 7).
Figure 7. The percent change in (A) deciduous; and (B) evergreen terrestrial carbon from climate change, and histograms of the percent change occurrences (C,D).
Climate 04 00002 g007

4. Discussion

This study used an advanced mechanistic ecosystem model and future climate scenario to estimate the potential equilibrium response of vegetation and carbon to future climate change over North America. Results suggest a relatively modest net domain level change in both forest cover and carbon, with much larger underlying gridded changes in both the distribution of vegetation and carbon stocks. Total forest cover expanded 2% and total carbon storage increased 8% (4 Tg). Underlying these regional net changes, deciduous cover expanded by 77% and gained 107% carbon (16 Tg), while evergreen cover was reduced by 48% and lost 31% carbon (12 Tg). In all, nearly 60% of the domain was shown to expect to change dominant PFT, with the percentage of terrestrial carbon attributed from evergreen and deciduous PFTs to change from a 1:3 to 1:1 ratio with wide ranges in carbon storage fluctuations at the site level. Such changes have potentially large climate, biogeochemical, and other implications.
Like previous studies, this work focused on estimating the long-term equilibrium response of vegetation and carbon to climate change. However, unlike previous studies based on empirical climate-vegetation models, this study used an advanced mechanistic, individually based ecosystem model. The use of such a model allowed for large domain validation of dominant PFT distribution from remote sensing data (Figure 2), and potential future opportunities to utilize additional remote sensing data as well as simulating the transient response of vegetation and carbon to climate change over large domains. Our results here are comparable to previous studies of vegetation and terrestrial carbon equilibrium response to climate change. For example, Schaphoff et al. [42] used the LPJ-DGVM model with five different climate change projections and found vegetation carbon to increase 7.7% on average globally, but with differing response in vegetation patterns. Solomon and Kirilenko [43] doubled CO2 globally and found a relatively modest response in net carbon gains with underlying biome changes exhibiting larger changes, similar to the findings we present.
For the northern hemisphere, the predicted underlying changes are evergreen forest replaced by deciduous forest at the southern boundary but expanding at the northern boundary. Rehfledt et al. [44,45,46] provides a number of empirical based studies on multiple species under altered climate change scenarios in the western United States that are consistent with these results. Sykes and Prentice [47] doubled CO2 and found that boreal species withdraw northward as temperate deciduous species dramatically expand into boreal tracts. Additional studies have focused on transitional zones, regions that are expected to change ecosystem type from climate change. These studies include regions such as those at high latitudes where boreal forest zones are replaced by cool temperate forest or cool temperate steppe [48], taiga to tundra migration [49,50], and deciduous forests northward expansion [51]. Based on these studies, boreal forests are projected to temporarily become a carbon source as deciduous forests are expected to move northward, but only after evergreen withdrawal [49], while the artic becomes a sink as boreal species migrate into regions previously classified as tundra [48,49,50,51]. Our results project evergreen forests moving into higher latitudes [49,52,53], and deciduous forests moving into areas previous classified as evergreen [54]. These changes at the PFT level (Figure 5) likely mask larger and more complex underlying changes at the species level. As the functional type representation of biodiversity is aggregated, it does not track species level shifts.
Large potential changes in response to climate change has lead scientists to examine the transient response [14,16,24,51,55,56]. The transient response of vegetation to climate change may introduce a time-lag to equilibrium as species have withdrawal-invasion interactions dependent on the climate change rate that can influence terrestrial carbon stocks. Research on the transient response must include additional submodels of landscape characteristics, disturbance rates, dispersal properties, and how these factors might be altered with climate change [17,40,47,57,58,59,60,61,62,63]. Disturbance has been found to be necessary for rapid plant migration as resident species largely prevent the establishment of species presumed to be better adapted to the new environment predicted by climate change scenarios [23], but too much disturbance prevents new species establishment [47,58]. Landscape heterogeneity and habitat fragmentation can both accelerate and retard plant migration rates [57,60,61,64,65], and dispersal kernels should be used to vary the speed of dispersal and migration dependent on species type to account for Reid’s paradox [18,20,66,67]. With rapid climate change rapid tree migration rates must occur or species face extinction and alter the expected carbon balance as the equilibrium state does not have enough time to establish [14,56,68,69,70].
The computational requirement for simulating theses interactions often limits the domain size to the subcontinent scale [20,63]. Extensive work on the risk and vulnerability of forests to climate change has been done for the eastern United States [56,71,72,73,74,75]. Two models, DISTRIB and SHIFT, were combined to estimate the potential migration of five tree species in the eastern U.S. from climate change in the next 100 years [56]. DISTRIB used a statistical approach to predict suitable habitat from climate while SHIFT provided the probability of colonization and coupled they showed the proportion of new habitat colonized within a century was low for all species under multiple climate change scenarios. Subsequent research illustrated large potential changes in suitable habitat for northeastern species, mostly gaining potential suitable areas of habitat [71], and incorporated habitat, dispersal, and disturbance [72]. The vulnerability and risk for individual species under multiple climate change scenarios has also shown potential for substantial change [74,75]. An extensive study was performed on central hardwood ecosystems [76] using three different models: Climate Change Tree Atlas, LANDIS PRO, and LINKAGES. All showed significant changes in species composition. Of these, LANDIS PRO was the most similar to ED, but its domain was limited to Missouri. This study has made important advances in using a mechanistic ecosystem model to project future change in vegetation in response to climate change over large domains. In addition to an assessment of transient responses, future work should prioritize the inclusion of additional relevant processes, and assessment of additional climate scenarios. Boreal forests are vulnerable to climate warming which can change the fire regimes that control dominant PFT [53,77,78]. Climate change induced disturbance rate changes can alter succession [16,58] as these changes both impede and accelerate migration [51]. Permafrost warming alters the terrestrial carbon balance [79,80,81] which adds another estimate to the net carbon storage change. Nitrogen limitation may also alter species composition [82,83]. Future studies should incorporate these processes while also utilizing additional climate change scenarios, increasing remote sensing data use for validation, and expanding the number of PFTs for interspecies reaction to climate change. Additional climate change scenarios should be evaluated The NARCCAP is producing numerous future climatologies from a set of regional climate models (RCMs) driven by a set of atmosphere-ocean general circulation models (AOGCMs). These can be used as inputs to models for a sensitivity analysis on transient predictions of carbon and vegetation redistribution from climate change over large domains.

5. Conclusions

This study used an advanced mechanistic, individually based, ecosystem model to predict the potential response of terrestrial ecosystems to climate change in North America. There are three major conclusions: (1) There are large potential changes to the distribution of plant functional types in response to future climate change; (2) There are large potential changes to the distribution of terrestrial carbon stocks in response to future climate change. These changes are largest at the grid scale, and tend to compensate at the domain scale; (3) The large potential changes warrant additional future studies on the transient response of ecosystems to climate change, and the sensitivity to alternative climate scenarios.

Acknowledgments

We gratefully acknowledge the financial support of the NASA Terrestrial Ecology Program and Nasa Carbon Monitoring System.

Author Contributions

Steven A. Flanagan and George C. Hurtt conceived and designed the experiments. Justin P. Fisk, Ritvik Sahajpal, and Maosheng Zhao contributed to model development. Matthew C. Hansen analyzed and processed the remote sensing data. Katelyn A. Dolan and Joe H. Sullivan analyzed ecosystem response. The manuscript was written and revised by Steven A. Flanagan and George C. Hurtt with inputs from all co-authors.

Conflicts of Interest

The authors declare no conflict of interest.

References

  1. Köppen, W. Versuch einer Klassifikation der Klimate, vorzugsweise nach ihren Beziehungen zur Pflanzenwelt. Geogr. Z. 1900, 11, 593–611. [Google Scholar]
  2. Thornthwaite, C.W. The climates of North America: According to a new classification. Geogr. Rev. 1931, 21, 633–655. [Google Scholar] [CrossRef]
  3. Thornthwaite, C.W. An approach toward a rational classification of climate. Geogr. Rev. 1948, 38, 55–94. [Google Scholar] [CrossRef]
  4. Holdrige, L.R. Determination of world plant formation from simple climate data. Science 1947, 105, 367–368. [Google Scholar] [CrossRef] [PubMed]
  5. Dale, V.H.; Joyce, L.A.; McNulty, S.; Neilson, R.P.; Ayres, M.P.; Flannigan, M.D.; Hasnon, P.J.; Irland, L.C.; Lugo, A.E.; Peterson, C.J.; et al. Climate change and forest disturbances. BioScience 2001, 51, 723–734. [Google Scholar] [CrossRef]
  6. Houghton, D.D. Global Climate Change—Challenges and Impacts. Available online: http://www.ssec.wisc.edu/library/ft/global_climate_change_houghton_2003.pdf (accessed on 1 September 2015).
  7. Vitousek, P.M.; D’Antonio, C.M.; Loope, L.L.; Westbrooks, R. Biological invasions as global environmental change. Am. Sci. 1996, 84, 468–478. [Google Scholar]
  8. Gruber, N.; Galloway, J.N. An Earth-system perspective of the global nitrogen cycle. Nature 2008, 451, 293–296. [Google Scholar] [CrossRef] [PubMed]
  9. Matear, R.J.; Wang, Y.-P.; Lenton, A. Land and ocean nutrient and carbon cycle interactions. Curr. Opin. Environ. Sustain. 2010, 2, 258–263. [Google Scholar] [CrossRef]
  10. Bonan, G.B. Forests and climate change: Forcings, feedbacks, and the climate benefits of forests. Science 2008, 320, 1444–1449. [Google Scholar] [CrossRef] [PubMed]
  11. Goulden, M.L.; Munger, J.W.; Fan, S.; Daube, B.C.; Wofsy, S.C. Measurements of carbon sequestration by long-term eddy covariance: Methods and a critical evaluation of accuracy. Glob. Chang. Biol. 1996, 2, 169–182. [Google Scholar] [CrossRef]
  12. Goetz, S.; Dubayah, R. Advances in remote sensing technology and implications for measuring and monitoring forest carbon stocks and change. Carbon Manag. 2011, 2, 231–244. [Google Scholar] [CrossRef]
  13. Prentice, K.C.; Fung, I.Y. The sensitivity of terrestrial carbon storage to climate change. Nature 1990, 346, 48–51. [Google Scholar] [CrossRef]
  14. Neilson, R.P.; Pitelka, L.F.; Solomon, A.M.; Nathan, R.; Midgley, G.F.; Fragoso, J.M.V.; Lischke, H.; Thompson, K. Forecasting regional to global plant migration in response to climate change. BioScience 2005, 55, 749–759. [Google Scholar] [CrossRef]
  15. Hurtt, G.C.; Dubayah, R.; Drake, J.; Moorcroft, P.; Pacala, S. Beyond potential vegetation: Combining lidar remote sensing and a height-structured ecosystem model for improved estimates of carbon stocks and fluxes. Ecol. Appl. 2004, 14, 873–883. [Google Scholar] [CrossRef]
  16. Medvigy, D.; Moorcroft, P.R. Predicting ecosystem dynamics at regional scales: An evaluation of a terrestrial biosphere model for the forests of northeastern North America. Philos. Trans. R. Soc. B Biol. Sci. 2012, 367, 222–235. [Google Scholar] [CrossRef] [PubMed]
  17. Prentice, K.C. Bioclimatic distribution of vegetation for general-circulation model studies. J. Geophys. Res. Atmos. 1990, 95, 11811–11830. [Google Scholar] [CrossRef]
  18. Clark, J.S.; Fastie, C.; Hurtt, G.; Jackson, S.T.; Johnson, C.; King, G.A.; Lewis, M.; Lynch, J.; Pacala, S.; Prentice, C.; et al. Reid’s paradox of rapid plant migration. BioScience 1998, 48, 13–24. [Google Scholar] [CrossRef]
  19. Pacala, S.W.; Hurtt, G.C. Terrestrial vegetation and climate change: Integrating models and experiments. In Biotic Interactions and Global Change; Sinauer Associates Incorporated: Sunderland, MA, USA, 1993. [Google Scholar]
  20. Lischke, H.; Zimmermann, N.E.; Bolliger, J.; Rickebusch, S.; Loeffler, T.J. TreeMig: A forest-landscape model for simulating spatio-temporal patterns from stand to landscape scale. Ecol. Model. 2006, 199, 409–420. [Google Scholar] [CrossRef]
  21. Clark, D.B.; Mercado, L.M.; Sitch, S.; Jones, C.D.; Gedney, N.; Best, M.J.; Pryor, M.; Rooney, G.G.; Essery, R.L.H.; Blyth, E.; et al. The Joint UK Land Environment Simulator (JULES), model description—Part 2: Carbon fluxes and vegetation dynamics. Geosci. Model Dev. 2011, 4, 701–722. [Google Scholar] [CrossRef]
  22. Cox, P.M. Description of the TRIFFID Dynamic Global Vegetation Model; Hadley Cebtre: Exeter, UK, 2001. [Google Scholar]
  23. Sato, H.; Itoh, A.; Kohyama, T. SEIB-DGVM: A new dynamic global vegetation model using a spatially explicit individual-based approach. Ecol. Model. 2007, 200, 279–307. [Google Scholar] [CrossRef]
  24. Sato, H.; Ise, T. Effect of plant dynamic processes on African vegetation responses to climate change: Analysis using the spatially explicit individual-based dynamic global vegetation model (SEIB-DGVM). J. Geophys. Res. 2012, 117. [Google Scholar] [CrossRef]
  25. Hurtt, G.C.; Moorcroft, P.R.; Pacala, S.W.; Levin, S.A. Terrestrial models and global change: Challenges for the future. Glob. Chang. Biol. 1998, 4, 581–590. [Google Scholar] [CrossRef]
  26. Moorcroft, P.R.; Hurtt, G.C.; Pacala, S.W. A method for scaling vegetation dynamics: The ecosystem demography model (ED). Ecol. Monogr. 2001, 71, 557–586. [Google Scholar] [CrossRef]
  27. Hurtt, G.; Wickland, D.; Jucks, K.; Bowman, K.; Brown, M.E.; Duren, R.M.; Hagen, S.; Verdy, A. NASA Carbon Monitoring System: Prototype Monitoring, Reporting, and Verification. Available online: http://carbon.nasa.gov/pdfs/2014_CarbonMonitoringSystem_ProgressReport.pdf (accessed on 1 November 2015).
  28. Prentice, I.C.; Cramer, W.; Harrison, S.P.; Leemans, R.; Monserud, R.A.; Solomon, A.M. A global biome model based on plant physiology and dominance, soil properties and climate. J. Biogeogr. 1992, 19, 117–134. [Google Scholar] [CrossRef]
  29. Haxeltine, A.; Prentice, I.C. BIOME3: An equilibrium terrestrial biosphere model based on ecophysiological constraints, resource availability, and competition among plant functional types. Glob. Biogeochem. Cycles 1996, 10, 693–709. [Google Scholar] [CrossRef]
  30. Foley, J.A.; Prentice, I.C.; Ramankutty, N.; Levis, S.; Pollard, D.; Sitch, S.; Haxeltine, A. An integrated biosphere model of land surface processes, terrestrial carbon balance, and vegetation dynamics. Glob. Biogeochem. Cycles 1996, 10, 603–628. [Google Scholar] [CrossRef]
  31. Duckworth, J.C.; Kent, M.; Ramsay, P.M. Plant functional types: An alternative to taxonomic plant community description in biogeography? Prog. Phys. Geogr. 2000, 24, 515–542. [Google Scholar] [CrossRef]
  32. Hurtt, G.C.; Pacala, S.W.; Moorcroft, P.R.; Caspersen, J.; Shevliakova, E.; Houghton, R.A.; Moore, B. Projecting the future of the U.S. carbon sink. Proc. Natl. Acad. Sci. USA 2002, 99, 1389–1394. [Google Scholar] [CrossRef] [PubMed]
  33. Thomas, R.Q.; Hurtt, G.C.; Dubayah, R.; Schilz, M.H. Using lidar data and a height-structured ecosystem model to estimate forest carbon stocks and fluxes over mountainous terrain. Can. J. Remote Sens. 2008, 34, S351–S363. [Google Scholar] [CrossRef]
  34. Von Caemmerer, S.; Farquhar, G.D. Some relationships between the biochemistry of photosynthesis and the gas exchange of leaves. Planta 1981, 153, 376–387. [Google Scholar] [CrossRef] [PubMed]
  35. Farquhar, G.D.; Sharkey, T.D. Stomatal conductance and photosynthesis. Annu. Rev. Plant Physiol. 1982, 33, 317–345. [Google Scholar] [CrossRef]
  36. Vogelmann, J.E.; Howard, S.M.; Yang, L.; Larson, C.R.; Wylie, B.K.; van Driel, J.N. Completion of the 1990’s National Land Cover Data Set for the conterminous United States from Landsat Thematic Mapper data and ancillary data sources. Photogramm. Eng. Remote Sens. 2001, 67, 650–662. [Google Scholar]
  37. Hurtt, G.C.; Fisk, J.; Thomas, R.Q.; Dubayah, R.; Moorcroft, P.R.; Shugart, H.H. Linking models and data on vegetation structure. J. Geophys. Res. 2010, 115, G00E10. [Google Scholar] [CrossRef]
  38. Wei, Y.; Liu, S.; Huntzinger, D.N.; Michalak, A.M.; Viovy, N.; Post, W.M.; Schwalm, C.R.; Schaefer, K.; Jacobson, A.R.; Lu, C.; et al. NACP MsTMIP: Global and North American Driver Data for Multi-Model Intercomparison; Data Set; Oak Ridge National Laboratory Distributed Active Archive Center: Oak Ridge, TN, USA, 1994. [Google Scholar]
  39. Wei, Y.; Liu, S.; Huntzinger, D.N.; Michalak, A.M.; Viovy, N.; Post, W.M.; Schwalm, C.R.; Schaefer, K.; Jacobson, A.R.; Lu, C.; et al. The North American carbon program multi-scale synthesis and terrestrial model intercomparison project—Part 2: Environmental driver data. Geosci. Model Dev. 2013, 6, 5375–5422. [Google Scholar] [CrossRef]
  40. Mearns, L.O.; Gutowski, W.J.; Jones, R.; Leung, L.-Y.; McGinnis, S.; Nunes, A.M.B.; Qian, Y. A regional climate change assessment program for North America. EOS 2009, 90, 311–312. [Google Scholar] [CrossRef]
  41. DeFries, R.; Hansen, M.; Townshend, J.R.G.; Janetos, A.C.; Loveland, T.R. 1 Kilometer Tree Cover Continuous Fields, 1.0; Department of Geography, University of Maryland: College Park, MD, USA, 1992–1993. [Google Scholar]
  42. Schaphoff, S.; Lucht, W.; Gerten, D.; Sitch, S.; Cramer, W.; Prentice, I.C. Terrestrial biosphere carbon storage under alternative climate projections. Clim. Chang. 2006, 74, 97–122. [Google Scholar] [CrossRef]
  43. Solomon, A.M.; Kirilenko, A.P. Climate change and terrestrial biomass: What if trees do not migrate? Glob. Ecol. Biogeogr. Lett. 1997, 6, 139–148. [Google Scholar] [CrossRef]
  44. Rehfeldt, G.E.; Crookston, N.L.; Warwell, M.V.; Evans, J.S. Empirical analyses of plant-climate relationships for the Western United States. Int. J. Plant Sci. 2006, 167, 1123–1150. [Google Scholar] [CrossRef]
  45. Rehfeldt, G.E.; Ying, C.C.; Spittlehouse, D.L.; Hamilton, D.A., Jr. Genetic responses to climate in pinus contorta: Niche breadth, climate change, and reforestation. Ecol. Monogr. 1999, 69, 375–407. [Google Scholar] [CrossRef]
  46. Rehfeldt, G.E.; Tchebakova, N.M. Intraspecific responses to climate in Pinus sylvestris. Glob. Chang. Biol. 2002, 8, 912–929. [Google Scholar] [CrossRef]
  47. Sykes, M.T.; Prentice, I.C. Boreal forest futures—Modeling the controls on tree species range limits and transient responses to climate-change. Water Air Soil Pollut. 1995, 82, 415–428. [Google Scholar] [CrossRef]
  48. Emanuel, W.R.; Shugart, H.H.; Stevenson, M.P. Climatic change and the broad-scale distribution of terrestrial ecosystem complexes. Clim. Chang. 1985, 7, 29–43. [Google Scholar] [CrossRef]
  49. Ranson, K.J.; Sun, G.; Kharuk, V.I.; Kovacs, K. Assessing tundra-taiga boundary with multi-sensor satellite data. Remote Sens. Environ. 2004, 93, 283–295. [Google Scholar] [CrossRef]
  50. Montesano, P.M.; Nelson, R.; Sun, G.; Margolis, H. MODIS tree cover validation for the circumpolar taiga-tundra transition zone. Remote Sens. Environ. 2009, 113, 2130–2141. [Google Scholar] [CrossRef]
  51. Chapin, F.S.; McGuire, A.D.; Ruess, R.W.; Hollingsworth, T.N.; Mack, M.C.; Johnstone, J.F.; Kasischke, E.S.; Euskirchen, E.S.; Jones, J.B.; Jorgenson, M.T.; et al. Resilience of Alaska’s boreal forest to climatic change. Can. J. For. Res. 2010, 40, 1360–1370. [Google Scholar] [CrossRef]
  52. Soja, A.J.; Tchebakova, N.M.; French, N.H.F.; Flannigan, M.D.; Shugart, H.H.; Stocks, B.J.; Sukhinin, A.I.; Parfenova, E.I.; Chapin, F.S., III; Stackhouse, P.W., Jr. Climate-induced boreal forest change: Predictions versus current observations. Glob. Planet. Chang. 2007, 56, 274–296. [Google Scholar] [CrossRef]
  53. Grace, J. Impacts of climate change on the tree line. Ann. Bot. 2002, 90, 537–544. [Google Scholar] [CrossRef] [PubMed]
  54. Goldblum, D.; Rigg, L.S. Tree growth response to climate change at the deciduous boreal forest ecotone, Ontario, Canada. Can. J. For. Res. 2005, 35, 2709–2718. [Google Scholar] [CrossRef]
  55. Bachelet, D.; Neilson, R.P.; Lenihan, J.M.; Drapek, R.J. Climate change effects on vegetation distribution and carbon budget in the United States. Ecosystems 2001, 4, 164–185. [Google Scholar] [CrossRef]
  56. Iverson, L.R.; Schwartz, M.W.; Prasad, A.M. Potential colonization of newly available tree-species habitat under climate change: An analysis for five eastern US species. Landsc. Ecol. 2004, 19, 787–799. [Google Scholar] [CrossRef]
  57. Küchler, A.W. Problems in classifying and mapping vegetation for ecological regionalization. Ecology 1973, 54, 512–523. [Google Scholar] [CrossRef]
  58. Denslow, J.S. Patterns of plant-species diversity during succession under different disturbance regimes. Oecologia 1980, 46, 18–21. [Google Scholar] [CrossRef]
  59. Bailey, R.G. Delineation of ecosystem regions. Environ. Manag. 1983, 7, 365–373. [Google Scholar] [CrossRef]
  60. Pitelka, L.F. Plant migration and climate change: A more realistic portrait of plant migration is essential to predicting biological responses to global warming in a world drastically altered by human activity. Am. Sci. 1997, 85, 464–473. [Google Scholar]
  61. Collingham, Y.C.; Huntley, B. Impacts of habitat fragmentation and patch size upon migration rates. Ecol. Appl. 2000, 10, 131–144. [Google Scholar] [CrossRef]
  62. Plotnick, R.E.; Gardner, R.H. A general model for simulating the effects of landscape heterogeneity and disturbance on community patterns. Ecol. Model. 2002, 147, 171–197. [Google Scholar] [CrossRef]
  63. Lavorel, S.; McIntyre, S.; Landsberg, J.; Forbes, T. Plant functional classifications: From general groups to specific groups based on response to disturbance. Trends Ecol. Evol. 1997, 12, 474–478. [Google Scholar] [CrossRef]
  64. Svenning, J.C.; Skov, F. Limited filling of the potential range in European tree species. Ecol. Lett. 2004, 7, 565–573. [Google Scholar] [CrossRef]
  65. Fahrig, L. Effect of habitat fragmentation on the extinction threshold: A synthesis. Ecol. Appl. 2002, 12, 346–353. [Google Scholar] [CrossRef]
  66. Kot, M.; Lewis, M.A.; van den Driessche, P. Dispersal data and the spread of invading organisms. Ecology 1996, 77, 2027–2042. [Google Scholar] [CrossRef]
  67. Peel, M.C.; Finlayson, B.L.; McMahon, T.A. Updated world map of the Koppen-Geiger climate classification. Hydrol. Earth Syst. Sci. 2007, 11, 1633–1644. [Google Scholar] [CrossRef]
  68. Midgley, G.F.; Thuiller, W.; Higgins, S.I. Plant species migration as a key uncertainty in predicting future impacts of climate change on ecosystems: Progress and challenges. In Global Change—The IGBP Series; Springer: Berling/Heidelberg, Germany; New York, NY, USA, 2007; pp. 129–137. [Google Scholar]
  69. Peñuelas, J.; Ogaya, R.; Boada, M.; Jump, A.S. Migration, invasion and decline: Changes in recruitment and forest structure in a warming-linked shift of European beech forest in Catalonia (NE Spain). Ecography 2007, 30, 829–837. [Google Scholar] [CrossRef]
  70. Lenoir, J.; Gegout, J.C.; Marquet, P.A.; de Ruffray, P.; Brisse, H. A significant upward shift in plant species optimum elevation during the 20th Century. Science 2008, 320, 1768–1771. [Google Scholar] [CrossRef] [PubMed]
  71. Iverson, L.; Prasad, A.; Matthews, S. Modeling potential climate change impacts on the trees of the northeastern United States. Mitig. Adapt. Strateg. Glob. Chang. 2007, 13, 487–516. [Google Scholar] [CrossRef]
  72. Iverson, L.R.; Prasad, A.M.; Matthews, S.N.; Peters, M.P. Lessons learned while integrating habitat, dispersal, disturbance, and life-history traits into species habitat models under climate change. Ecosystems 2011, 14, 1005–1020. [Google Scholar] [CrossRef]
  73. Matthews, S.N.; Iverson, L.R.; Peters, M.P.; Prasad, A.M.; Subburayalu, S. Assessing and comparing risk to climate changes among forested locations: Implications for ecosystem services. Landsc. Ecol. 2014, 29, 213–228. [Google Scholar] [CrossRef]
  74. Duveneck, M.J.; Scheller, R.M.; White, M.A.; Handler, S.D.; Ravenscroft, C. Climate change effects on northern Great Lake (USA) forests: A case for preserving diversity. Ecosphere 2014, 5, 23. [Google Scholar] [CrossRef]
  75. Zolkos, S.G.; Jantz, P.; Cormier, T.; Iverson, L.R.; McKenney, D.W.; GOETZ, S.J. Projected tree species redistribution under climate change: Implications for ecosystem vulnerability across protected areas in the Eastern United States. Ecosystems 2015, 18, 202–220. [Google Scholar] [CrossRef]
  76. Brandt, L.; He, H.; Iverson, L.; Thompson, F.R., III; Butler, P.; Handler, S.; Janowiak, M.; Shannon, P.D.; Swanston, C.; Albrecht, M.; et al. Central Hardwoods Ecosystem Vulnerability Assessment and Synthesis; USDA Forest Service: Newton Square, MA, USA, 2014. [Google Scholar]
  77. Kasischke, E.S.; Verbyla, D.L.; Rupp, T.S.; McGuire, A.D.; Murphy, K.A.; Jandt, R.; Barnes, J.L.; Hoy, E.E.; Duffy, P.A.; Calef, M.; et al. Alaska’s changing fire regime—Implications for the vulnerability of its boreal forests. Can. J. For. Res. 2010, 40, 1313–1324. [Google Scholar] [CrossRef]
  78. McGuire, A.D.; Macdonald, R.W.; Schuur, E.A.; Harden, J.W.; Kuhry, P.; Hayes, D.J.; Christensen, T.R.; Heimann, M. The carbon budget of the northern cryosphere region. Curr. Opin. Environ. Sustain. 2010, 2, 231–236. [Google Scholar] [CrossRef]
  79. Beck, P.S.A.; Goetz, S.J.; Mack, M.C.; Alexander, H.D.; Jin, Y.; Randerson, J.T.; Loranity, M.M. The impacts and implications of an intensifying fire regime on Alaskan boreal forest composition and albedo. Glob. Chang. Biol. 2011, 17, 2853–2866. [Google Scholar] [CrossRef]
  80. Turetsky, M.R.; Kane, E.S.; Harden, J.W.; Ottmar, R.D.; Manies, K.L.; Hoy, E.; Kasischke, E.S. Recent acceleration of biomass burning and carbon losses in Alaskan forests and peatlands. Nat. Geosci. 2010, 4, 27–31. [Google Scholar] [CrossRef]
  81. Ciais, P.; Canadell, J.G.; Luyssaert, S.; Chevallier, F.; Shvidenko, A.; Poussi, Z.; Jonas, M.; Peylin, P.; King, A.W.; Schulze, E.-D.; et al. Can we reconcile atmospheric estimates of the Northern terrestrial carbon sink with land-based accounting? Curr. Opin. Environ. Sustain. 2010, 2, 225–230. [Google Scholar] [CrossRef]
  82. Dietze, M.C.; Vargas, R.; Richardson, A.D.; Stoy, P.C.; Barr, A.G.; Anderson, R.S.; Arain, M.A.; Baker, I.T.; Black, T.A.; Chen, J.M.; et al. Characterizing the performance of ecosystem models across time scales: A spectral analysis of the North American Carbon Program site-level synthesis. J. Geophys. Res. 2011, 116, G04029. [Google Scholar] [CrossRef]
  83. Fisher, R.; McDowell, N.; Purves, D.; Moorcroft, P.; Sitch, S.; Cox, P.; Huntingford, C.; Meir, P.; Ian Woodward, F. Assessing uncertainties in a second-generation dynamic vegetation model caused by ecological scale limitations. New Phytol. 2010, 187, 666–681. [Google Scholar] [CrossRef] [PubMed] [Green Version]

