3.2. Detecting Changes in the Mean
The results for the sub-regional average annual rainfall series of the Argentine Pampas Region by Hubert’s segmentation method [
31] are detailed in
Table 3.
Table 3.
Segmentation of the annual precipitation series for the sub-regions of the Pampa Region by Hubert’s segmentation method [
31].
Table 3.
Segmentation of the annual precipitation series for the sub-regions of the Pampa Region by Hubert’s segmentation method [31].
| Sub-Regions | Sub-Period | Mean (mm) | Standard Deviation | Variation Coefficient |
|---|
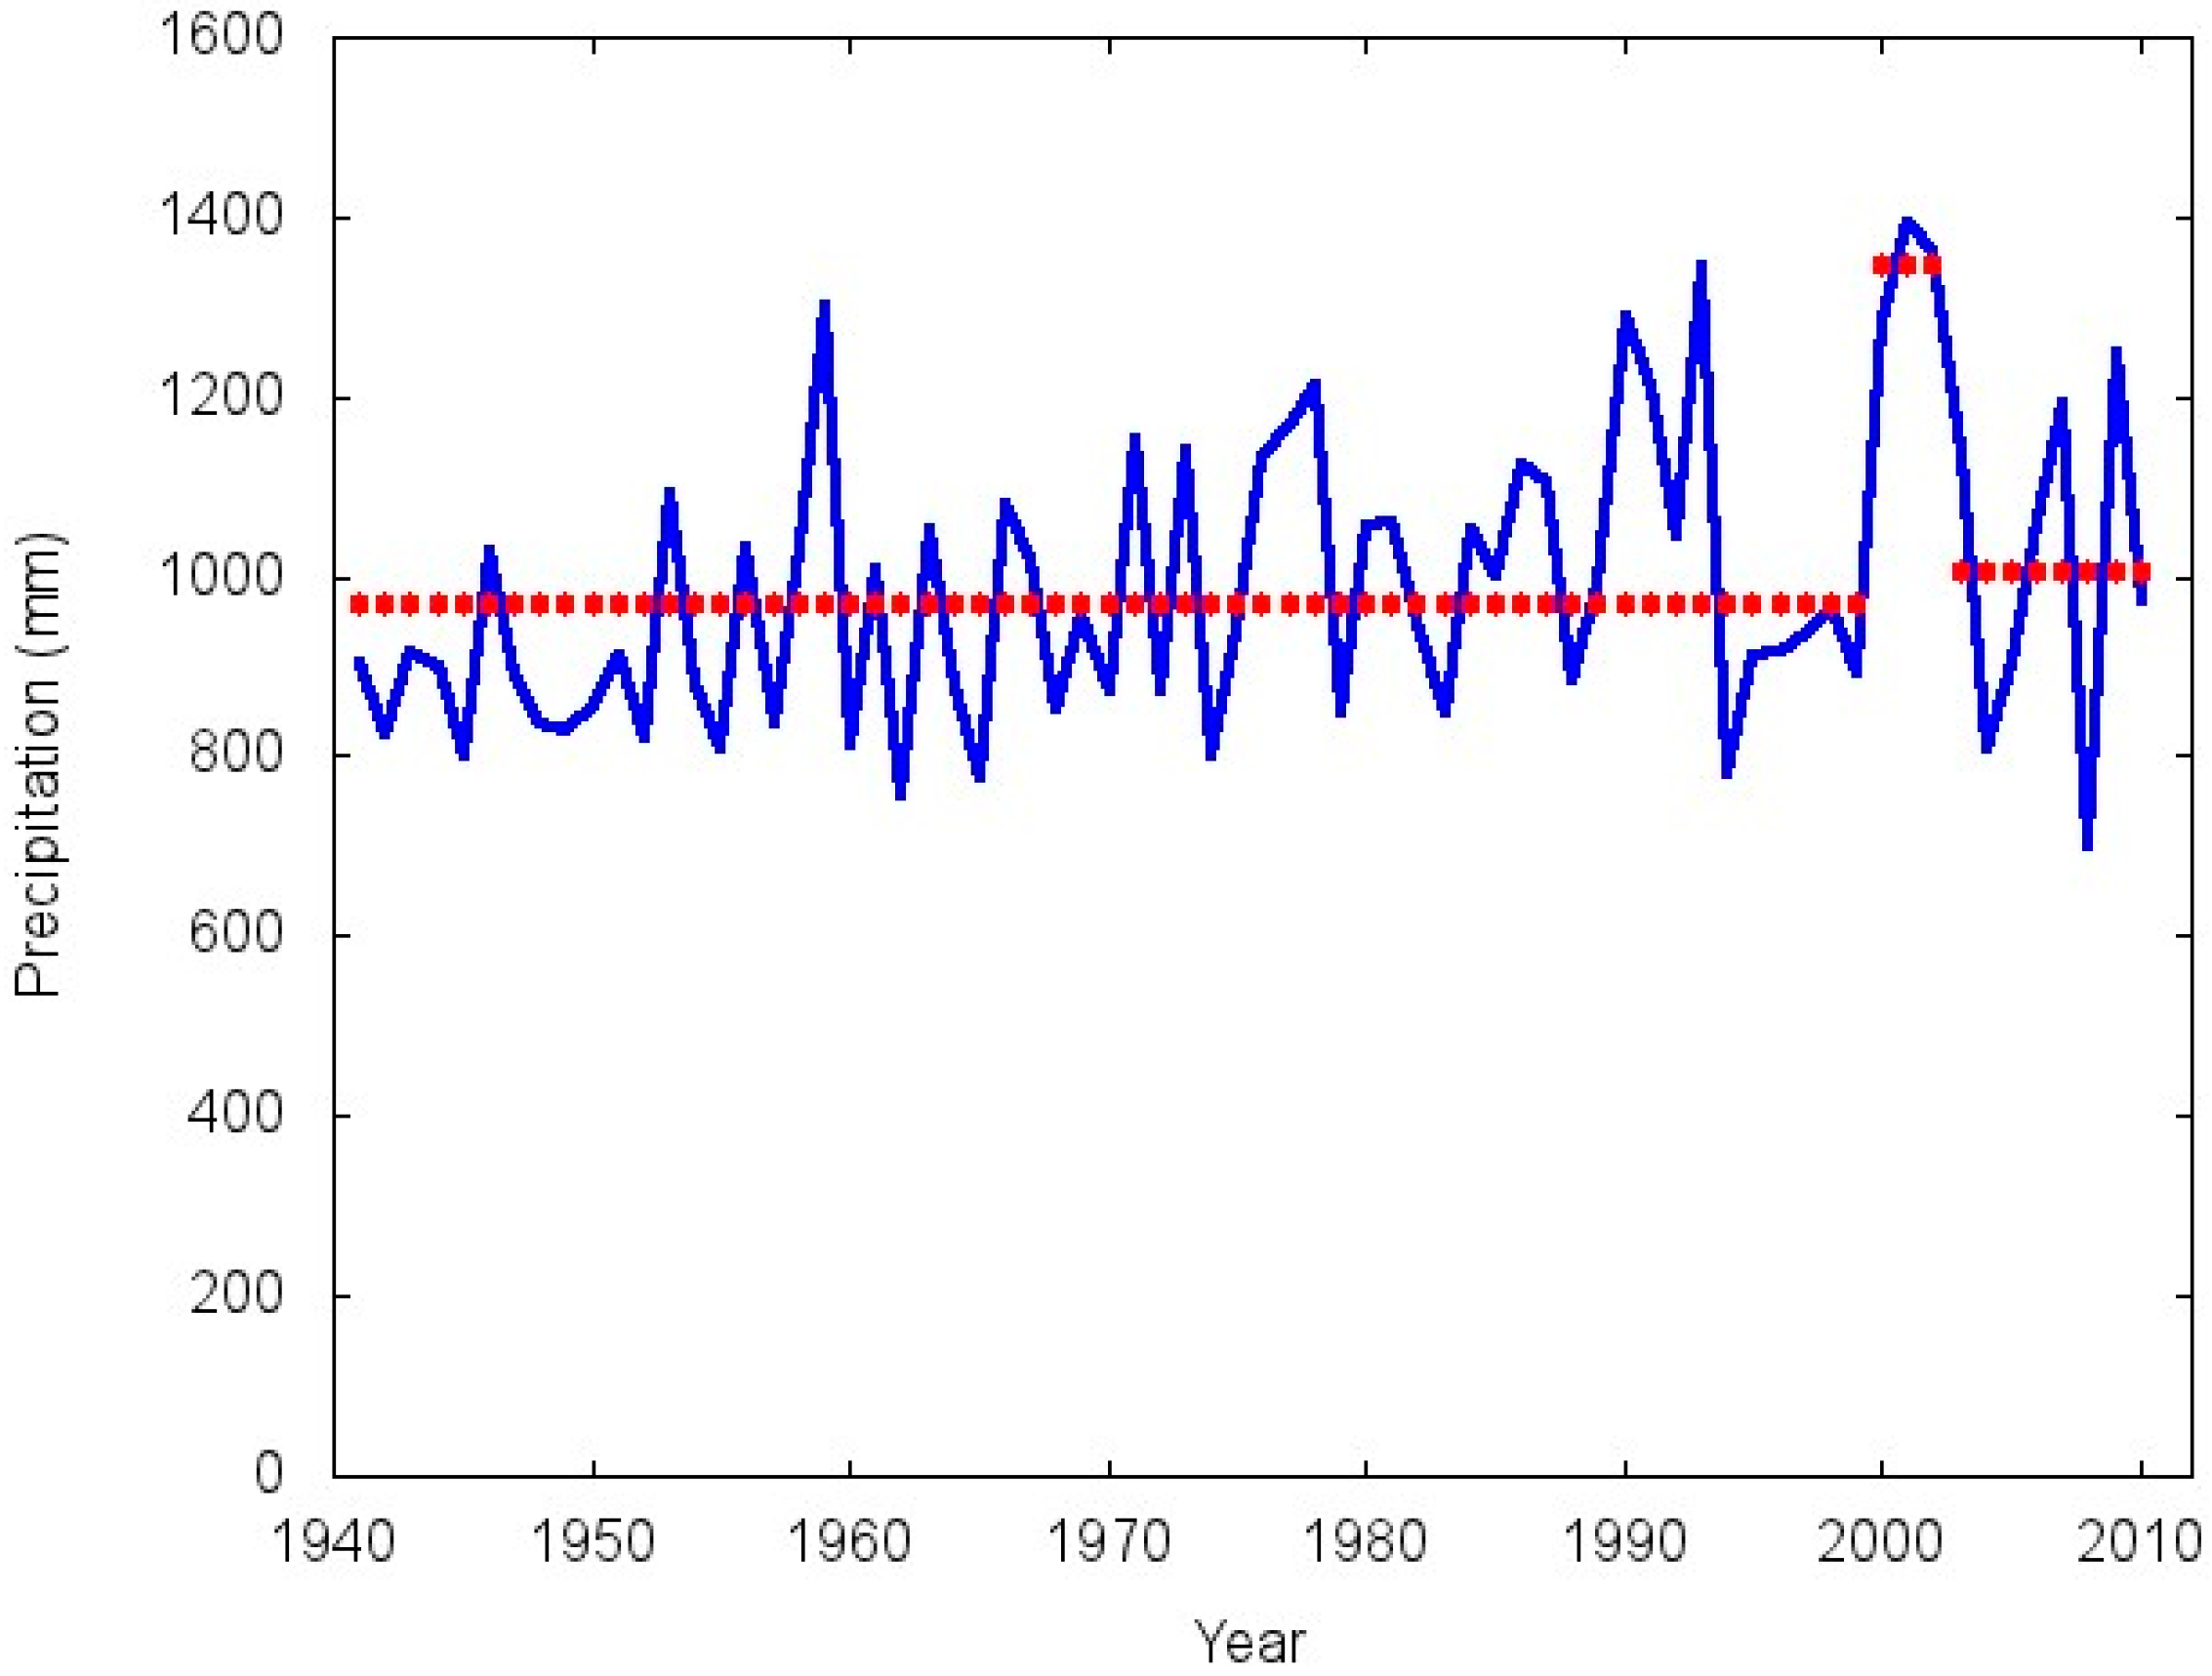
| Rolling Pampa | 1941–1999 | 971.9 | 142.8 | 14.7 |
| 2000–2002 | 1349.3 | 56.7 | 4.2 |
| 2003–2010 | 1005.2 | 191.8 | 19.0 |
| Mesopotamian Pampa | 1941–1999 | 1062.9 | 197.9 | 18.6 |
| 2000–2003 | 1568.9 | 211.1 | 13.4 |
| 2004–2010 | 1108.0 | 289.5 | 26.1 |
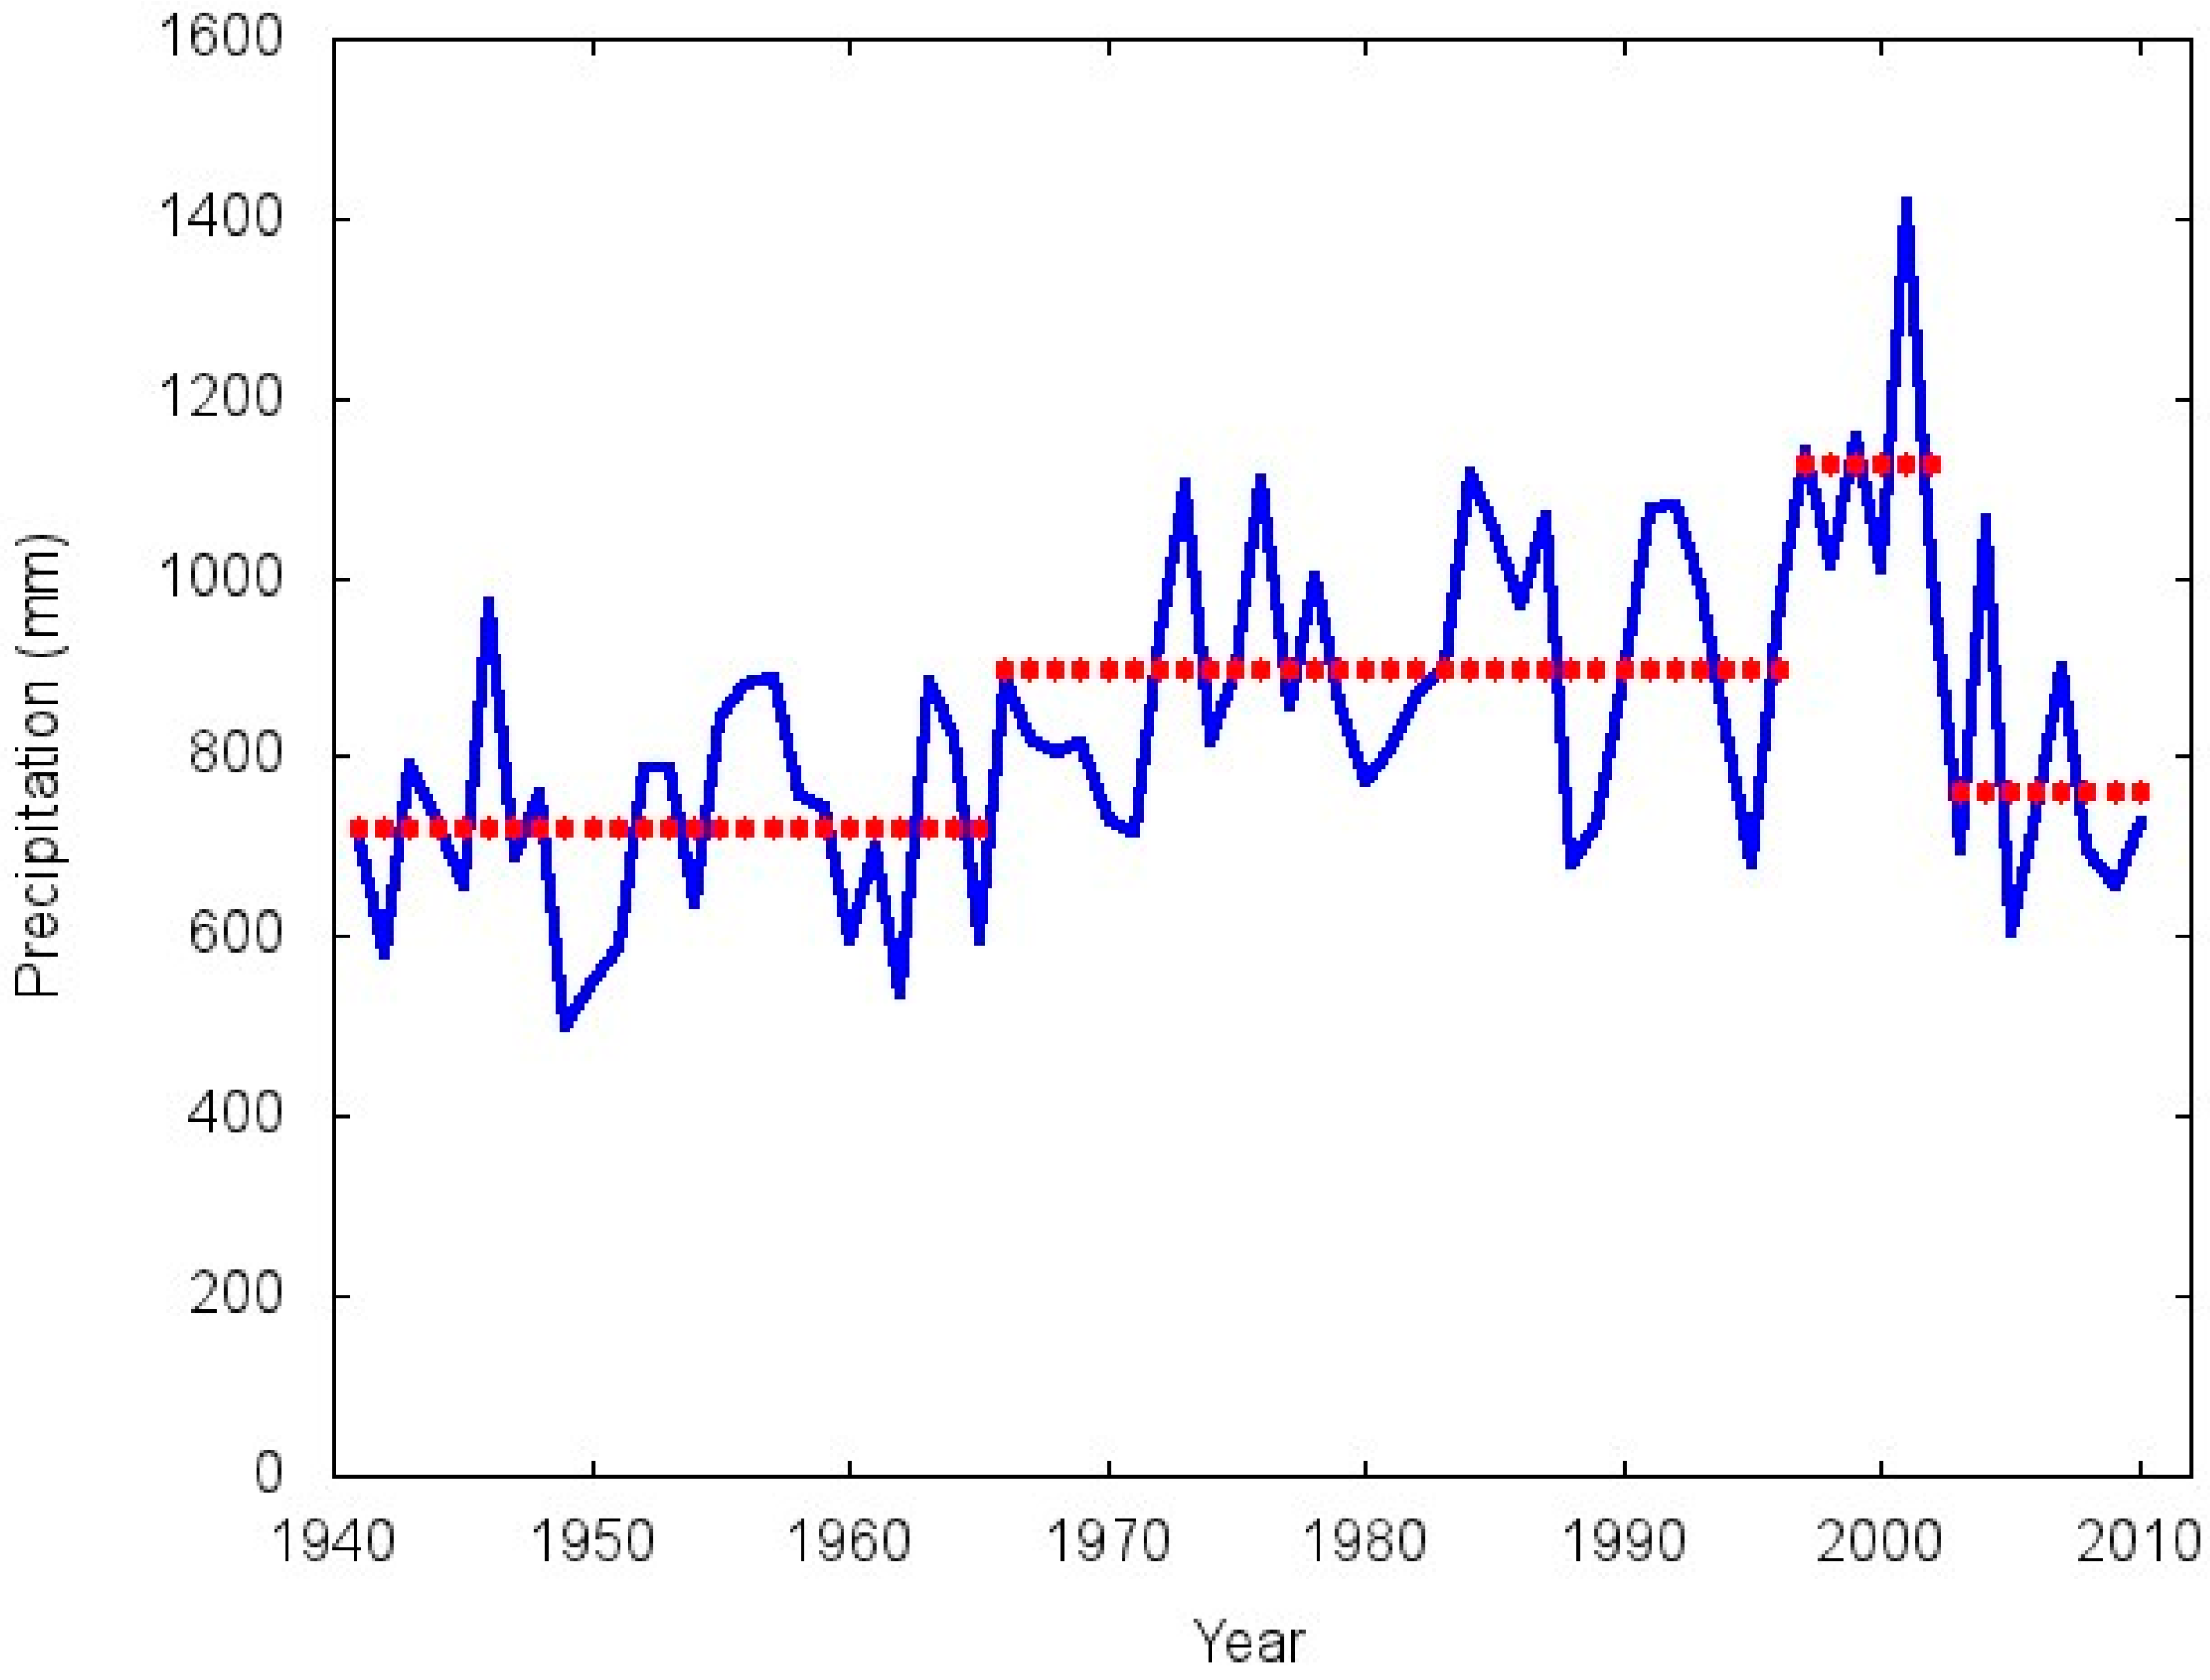
| Central Pampa | 1941–1965 | 721.3 | 126.2 | 17.5 |
| 1966–1996 | 900.0 | 132.8 | 14.7 |
| 1997–2002 | 1126.0 | 158.8 | 14.1 |
| 2003–2010 | 762.2 | 149.9 | 19.7 |
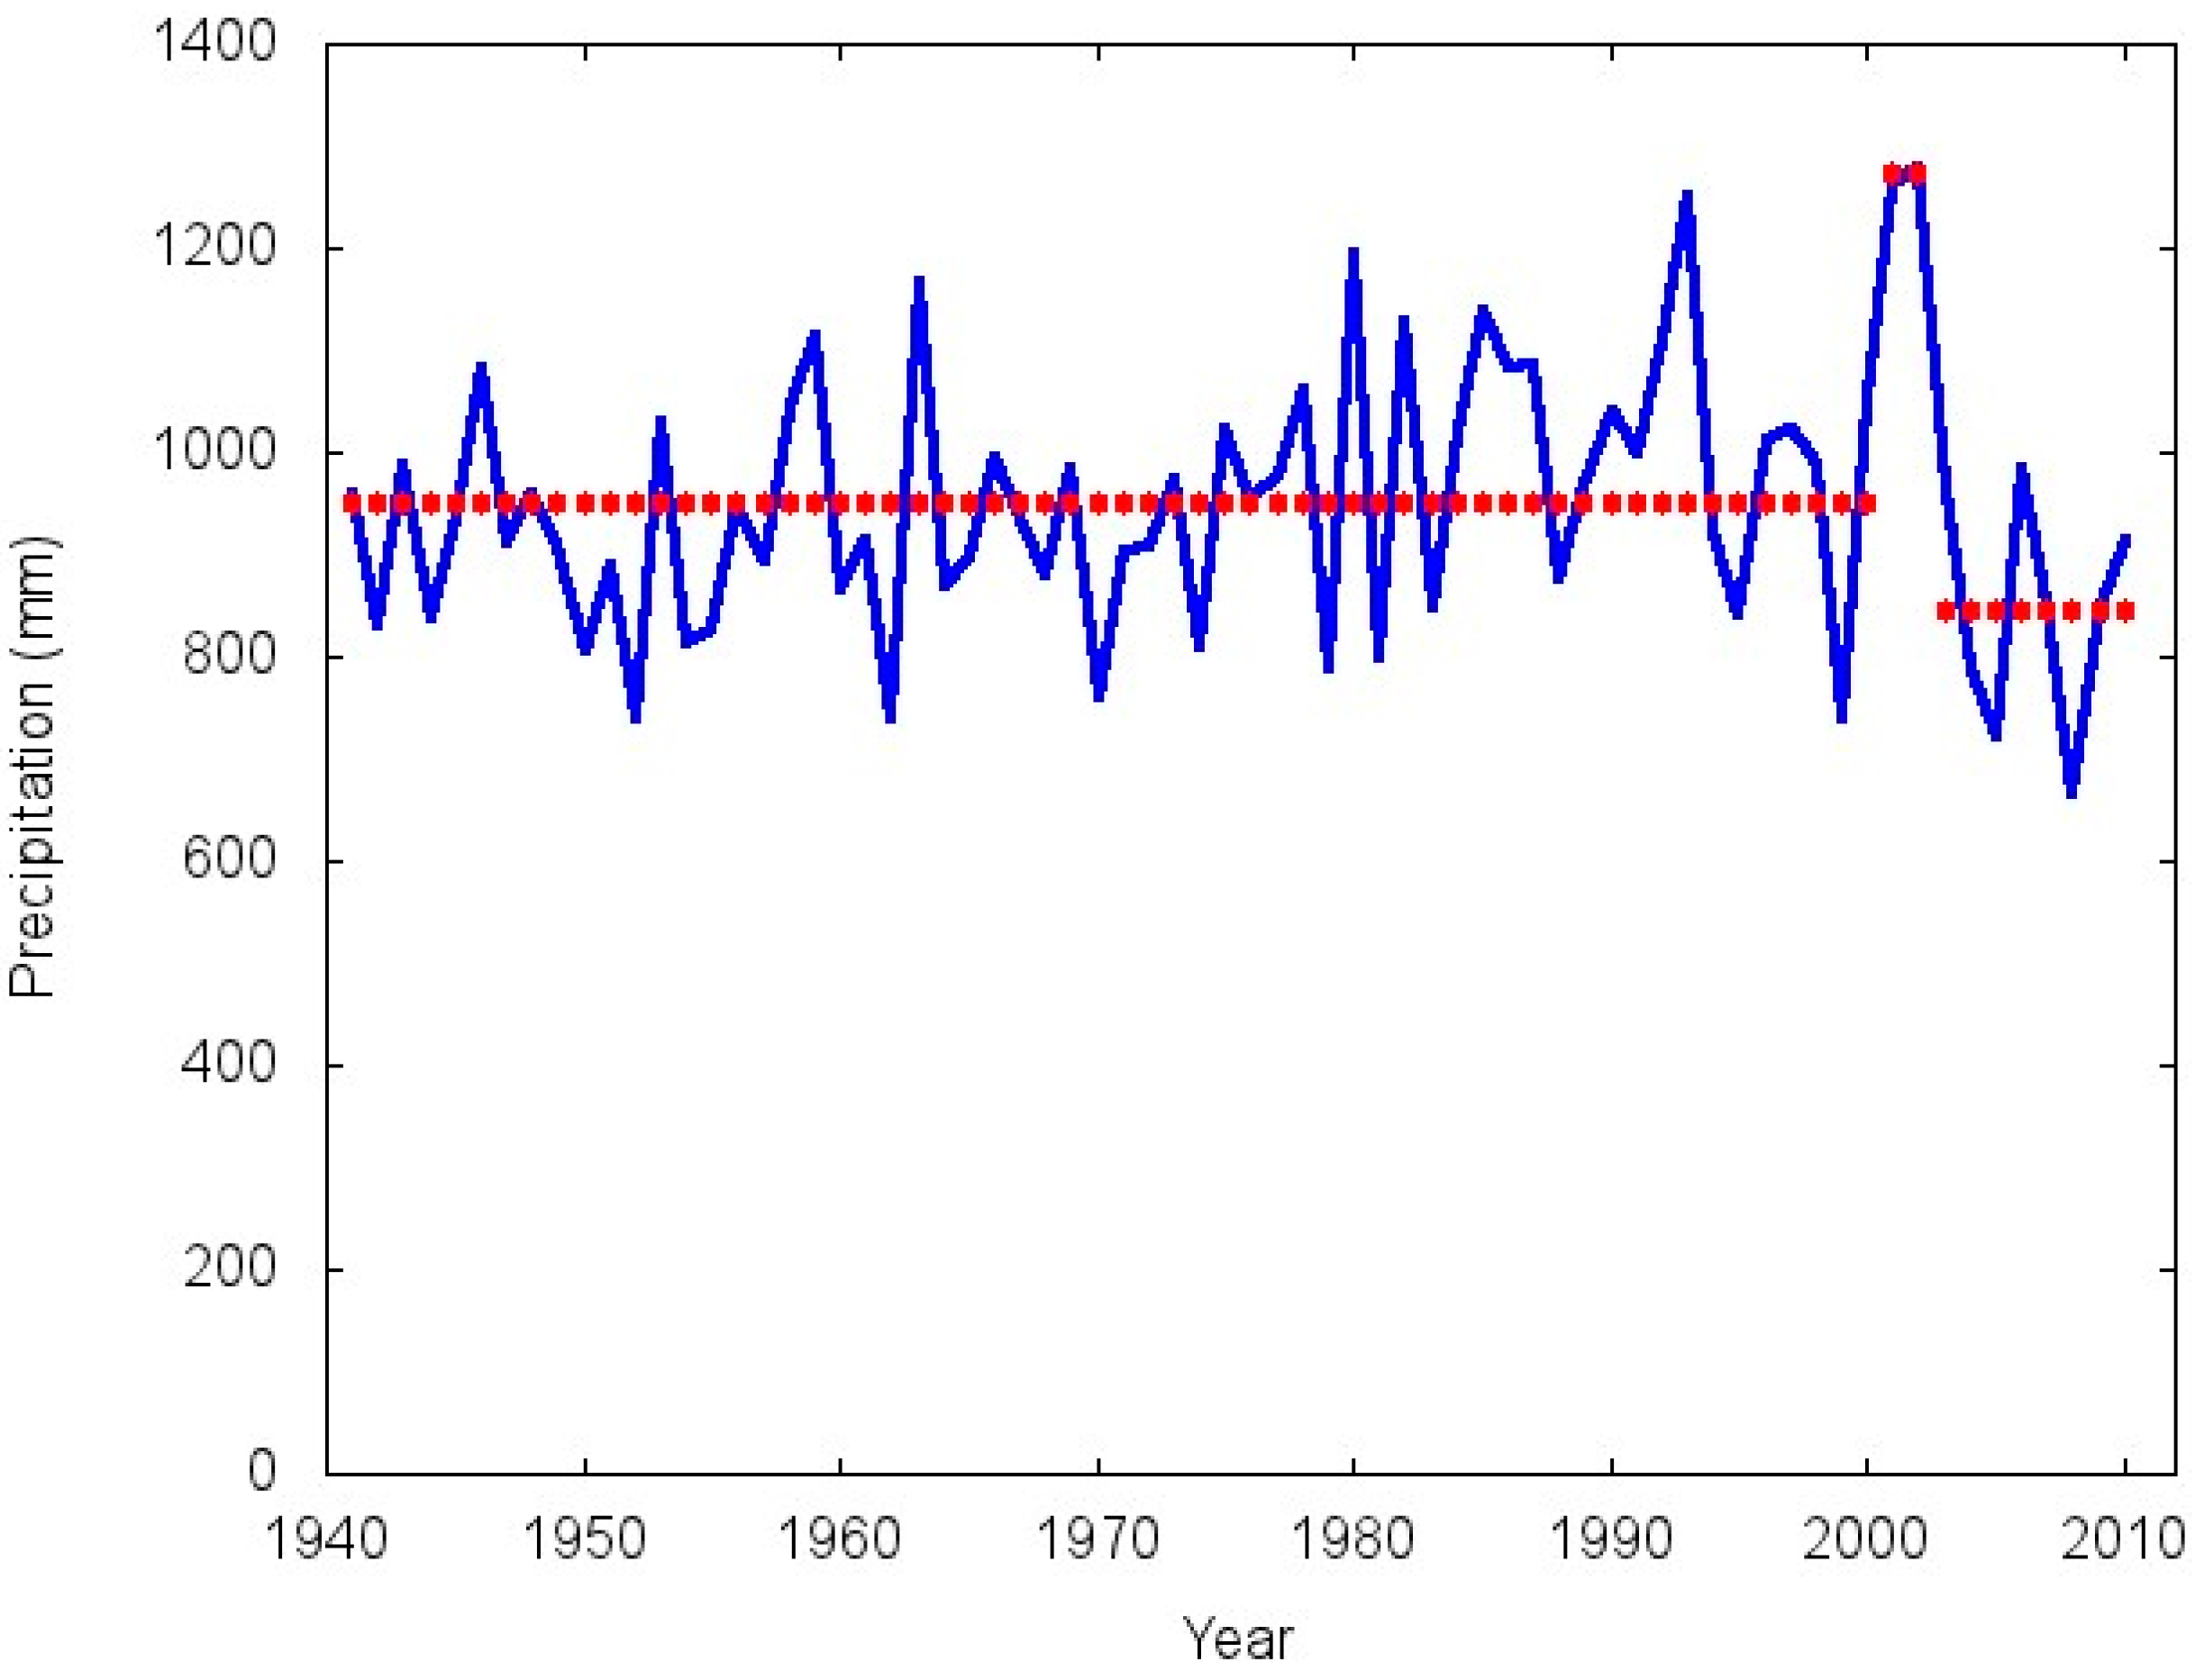
| Flooding Pampa | 1941–2000 | 952.7 | 118.9 | 12.5 |
| 2001–2002 | 1272.2 | 10.9 | 0.9 |
| 2003–2010 | 844.5 | 112.9 | 13.4 |
| Southern Pampa | 1941–2000 | 819.3 | 137.1 | 16.7 |
| 2001–2002 | 1155.2 | 85.9 | 7.4 |
| 2003–2010 | 745.3 | 103.5 | 13.9 |
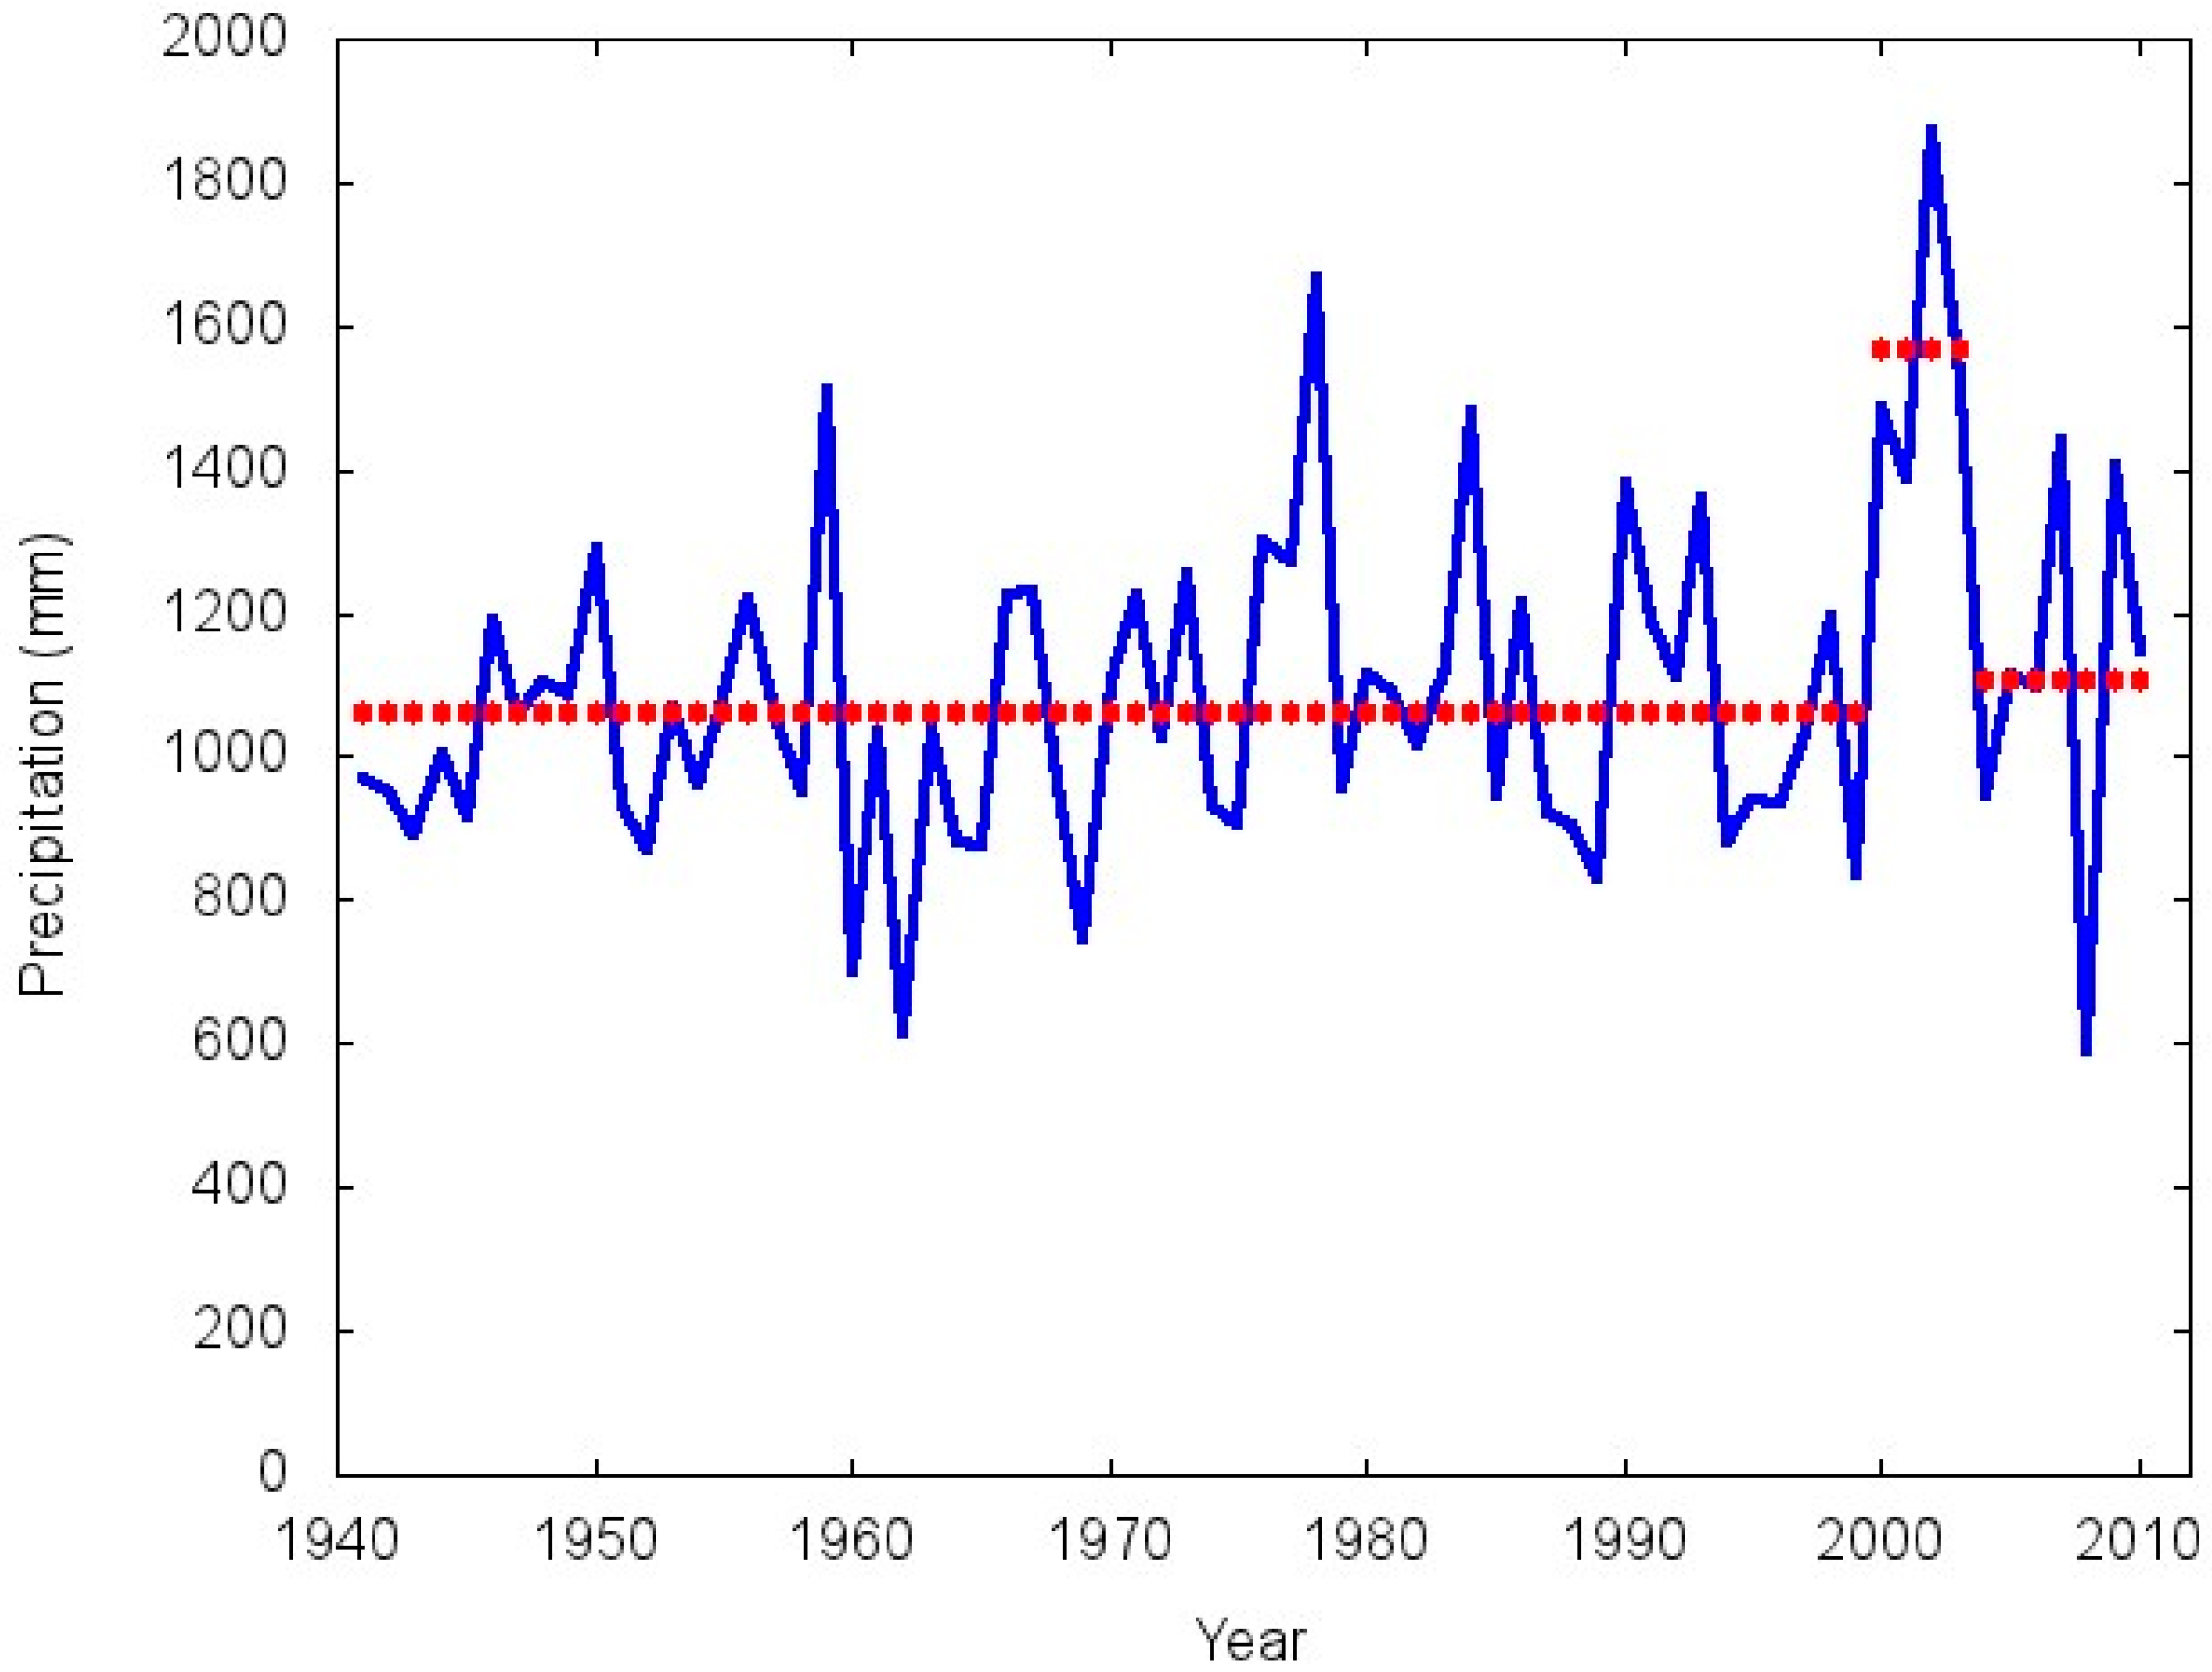
The Rolling Pampa sub-region average (
Figure 5) showed two abrupt changes. The first of these was positive, with the average annual precipitation rising from 971.9 mm during 1941–1999 the sub-period, to 1349.3 mm during a very short sub-period ranging from 2000 to 2002. In 2003, a negative change dropped the average annual rainfall to 1005.2 mm, only slightly higher than what it had been in the initial 1941–1999 sub-period.
Figure 5.
Annual precipitation and means for sub-periods in the Rolling Pampa sub-region by Hubert’s segmentation method.
Figure 5.
Annual precipitation and means for sub-periods in the Rolling Pampa sub-region by Hubert’s segmentation method.
The mean for the Mesopotamian Pampa sub-region showed a very similar behavior with two abrupt shifts (
Figure 6). The first of these was positive, with annual average rainfall increasing from 1062.9 mm during the 1941–1999 sub-period to 1568.9 mm during a short sub-period between 2000 and 2003. The second abrupt change, which began in 2004, was negative, with average annual rainfall dropping to 1108.0 mm, only slightly higher than what it had been in the initial 1941–1999 sub-period.
Figure 6.
Annual precipitation and means for sub-periods in the Mesopotamian Pampa sub region by Hubert’s segmentation method.
Figure 6.
Annual precipitation and means for sub-periods in the Mesopotamian Pampa sub region by Hubert’s segmentation method.
The Central Pampa sub region (
Figure 7) showed a more complex behavior, with two abrupt positive changes in close succession. The first brought average annual precipitation from 721.3 mm during the sub-period 1941–1965, to 900.0 mm during the sub-period 1966–1996. The second abrupt positive change raised average annual rainfall to 1126.0 mm between 1997 and 2002. It is noteworthy that after this short wet sub-period of just five years, a negative abrupt change beginning in 2003 reduced average annual rainfall to 762.2 mm, very similar to the mean precipitation for the initial 1941–1965 sub-period.
Figure 7.
Annual precipitation and means for sub-periods in the Central Pampa sub region by Hubert’s segmentation method.
Figure 7.
Annual precipitation and means for sub-periods in the Central Pampa sub region by Hubert’s segmentation method.
Figure 8.
Annual precipitation and means for the 1941–2010 period in the Flooding Pampa sub-region.
Figure 8.
Annual precipitation and means for the 1941–2010 period in the Flooding Pampa sub-region.
The mean for the Flooding Pampa sub-region showed two abrupt changes (
Figure 8). The first was positive, with annual average rainfall increasing from 952.7 mm during the 1941–2000 sub-period, to 1272.2 mm for the 2001–2002 sub-period. The second abrupt change, which began in 2003, was negative, with average annual rainfall dropping to 844.5 mm, which is lower than it had been during the initial 1941–2000 sub-period.
The mean for the Southern Pampa sub-region showed two abrupt changes (
Figure 9). The first was positive, with annual average rainfall increasing from 819.3 mm during the 1941–2000 sub-period, to 1155.2 mm for the 2001–2002 sub-period. The second abrupt change, which began in 2003, was negative. Here average annual rainfall dropped to 745.3 mm, which is lower than it had been during the initial 1941–2000 sub-period.
Figure 9.
Annual precipitation and means for the sub-periods in the Southern Pampa sub region by Hubert’s segmentation method.
Figure 9.
Annual precipitation and means for the sub-periods in the Southern Pampa sub region by Hubert’s segmentation method.
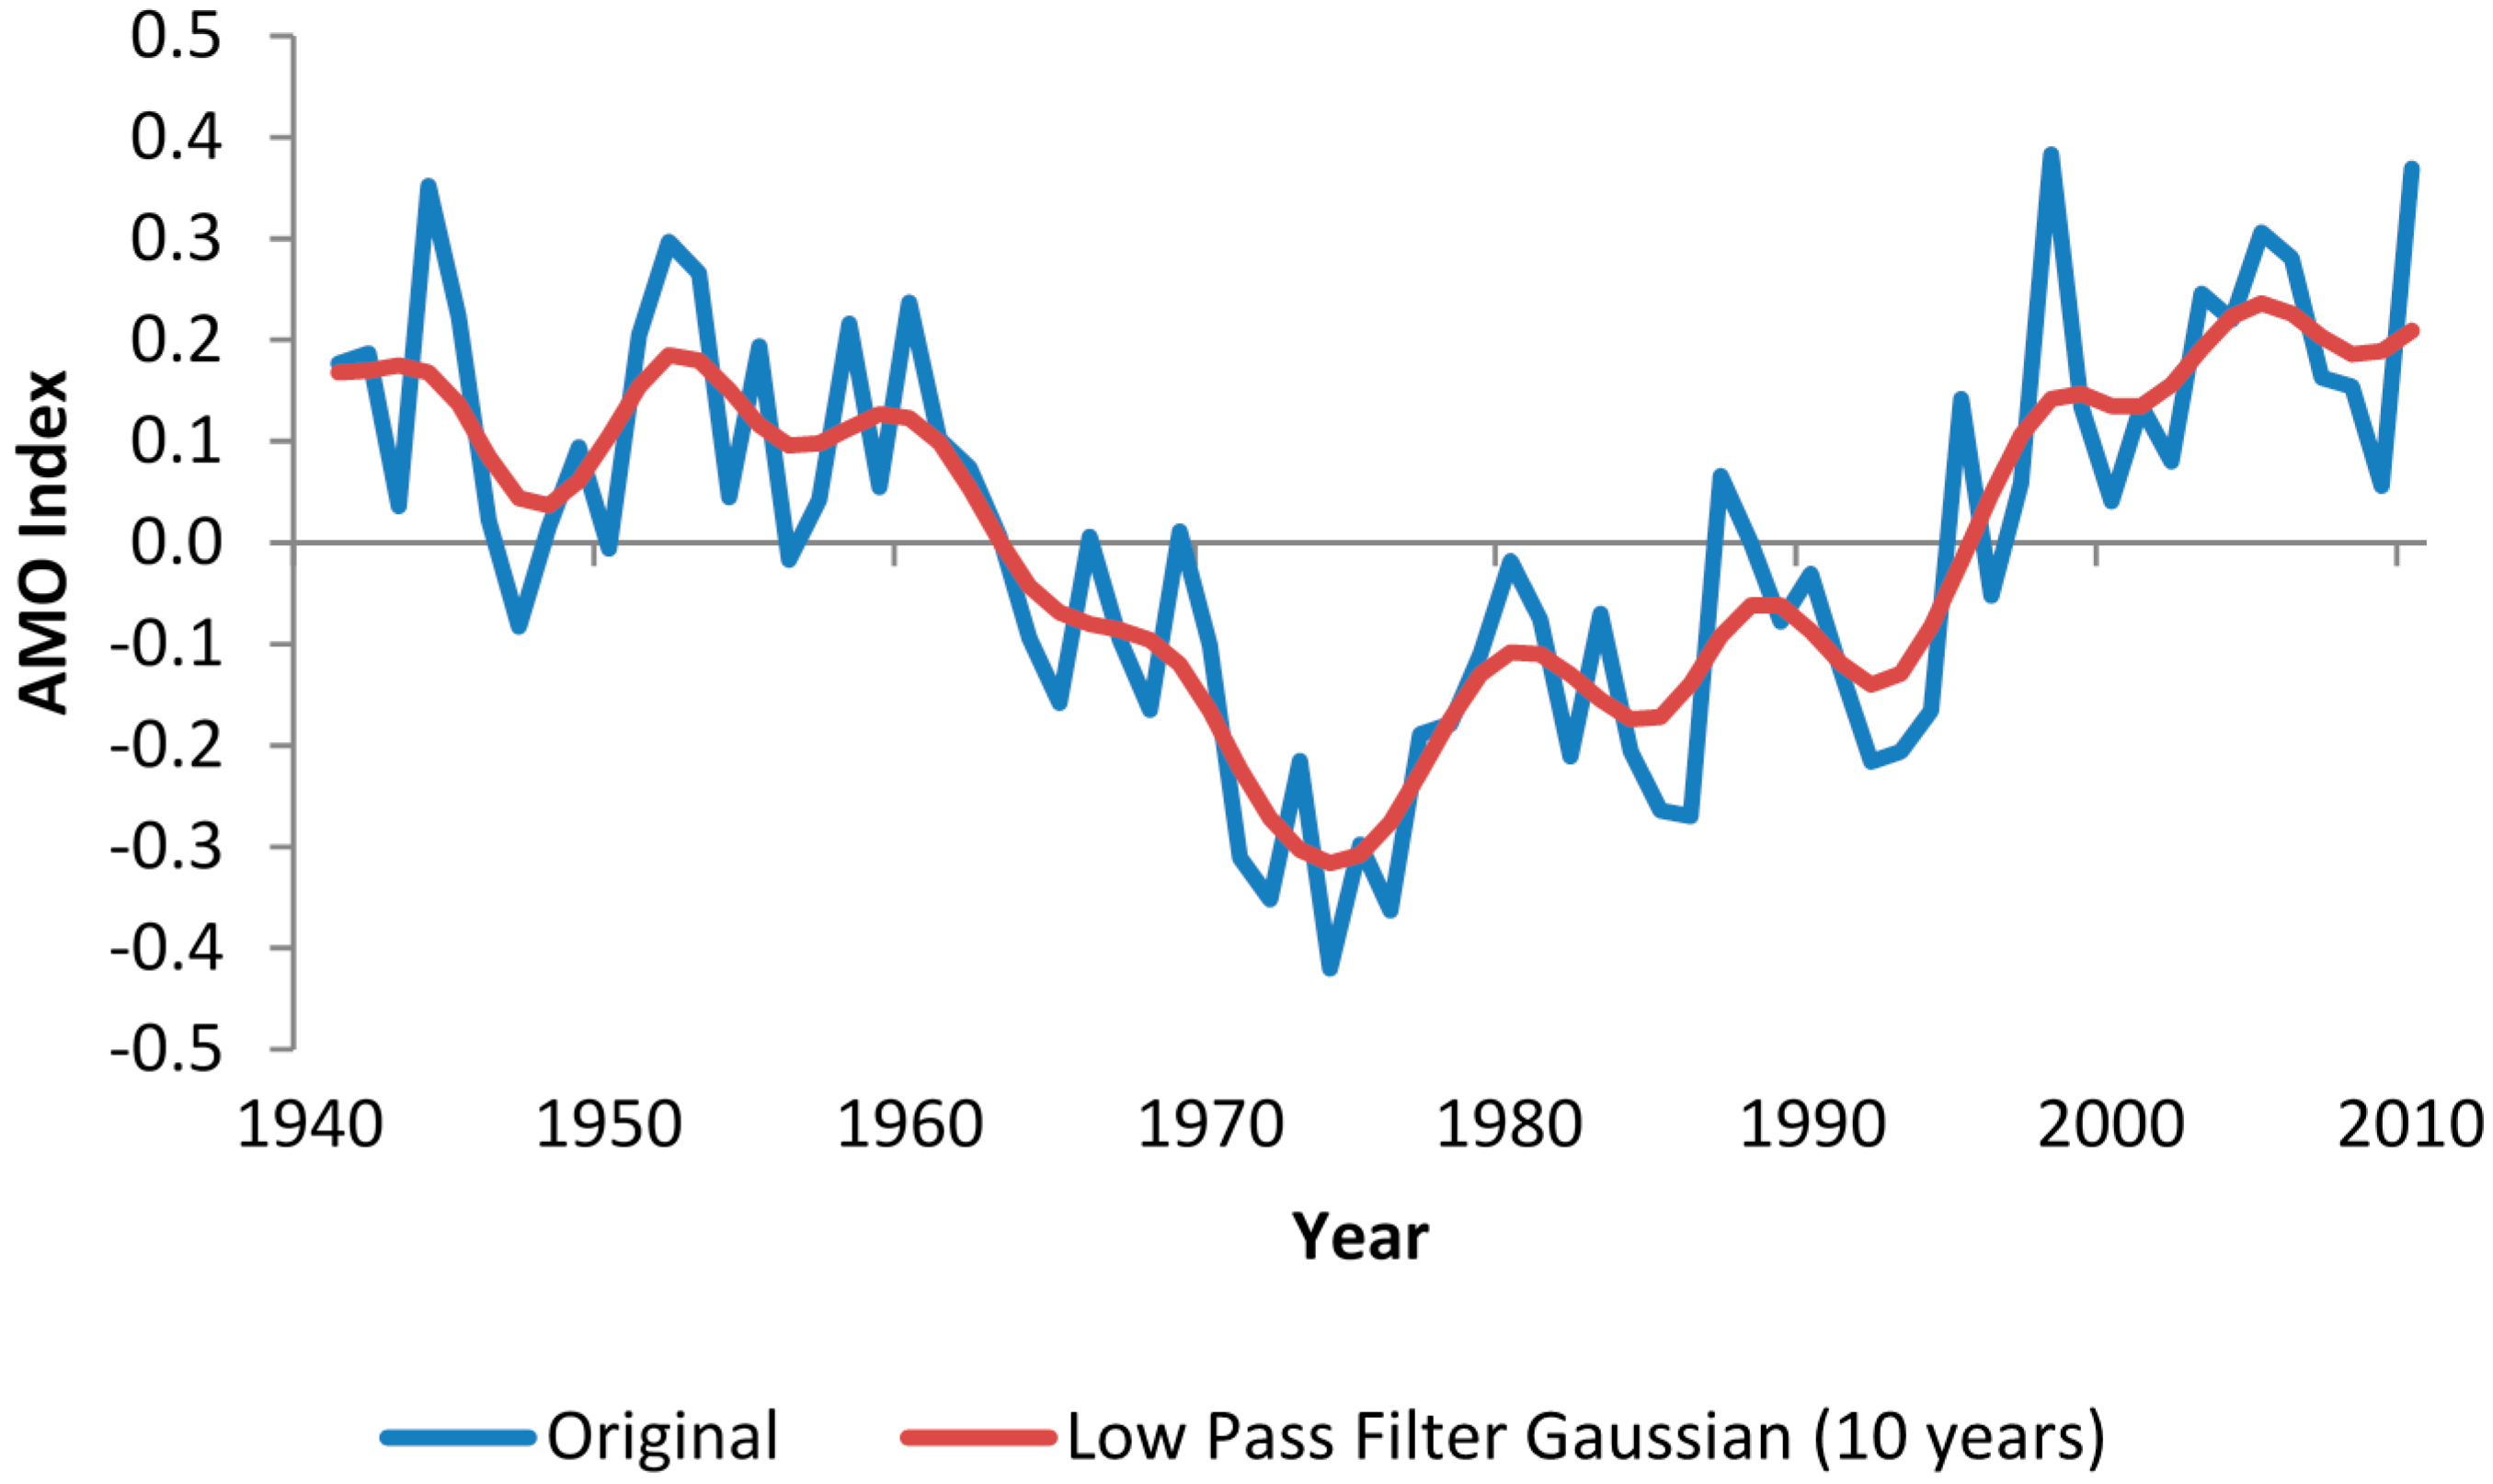
3.3. Associations from Rainfall to the AMO, PDO and SOI
The most significant AMO teleconnections to precipitation in Argentina’s Pampa Region were observed at lag −10 years in the Rolling (RP), Mesopotamian (MP), Flooding (FP) and Southern (SP) sub-regions and at lag −8 years in the Central Pampa sub-region (
Table 4).
The fact that these correlations are negative indicates that, when the Atlantic Ocean warms, rainfall tends to show a decrease in mean value and an increase in variability over much of the Pampa Region. This has a negative impact on agricultural production.
The fact that AMO significant correlations begin as much as lag −10, suggest that its influence is transferred very slowly to the atmosphere, and therefore it takes several years before sensible changes in rainfall behavior are detected.
It also suggest that AMO influence may be cumulative, requiring several years to reach an activation threshold strong enough to cause changes in rainfall behavior.
This also causes that, in spite that AMO is mainly a summer signal, it is capable of influencing annual values.
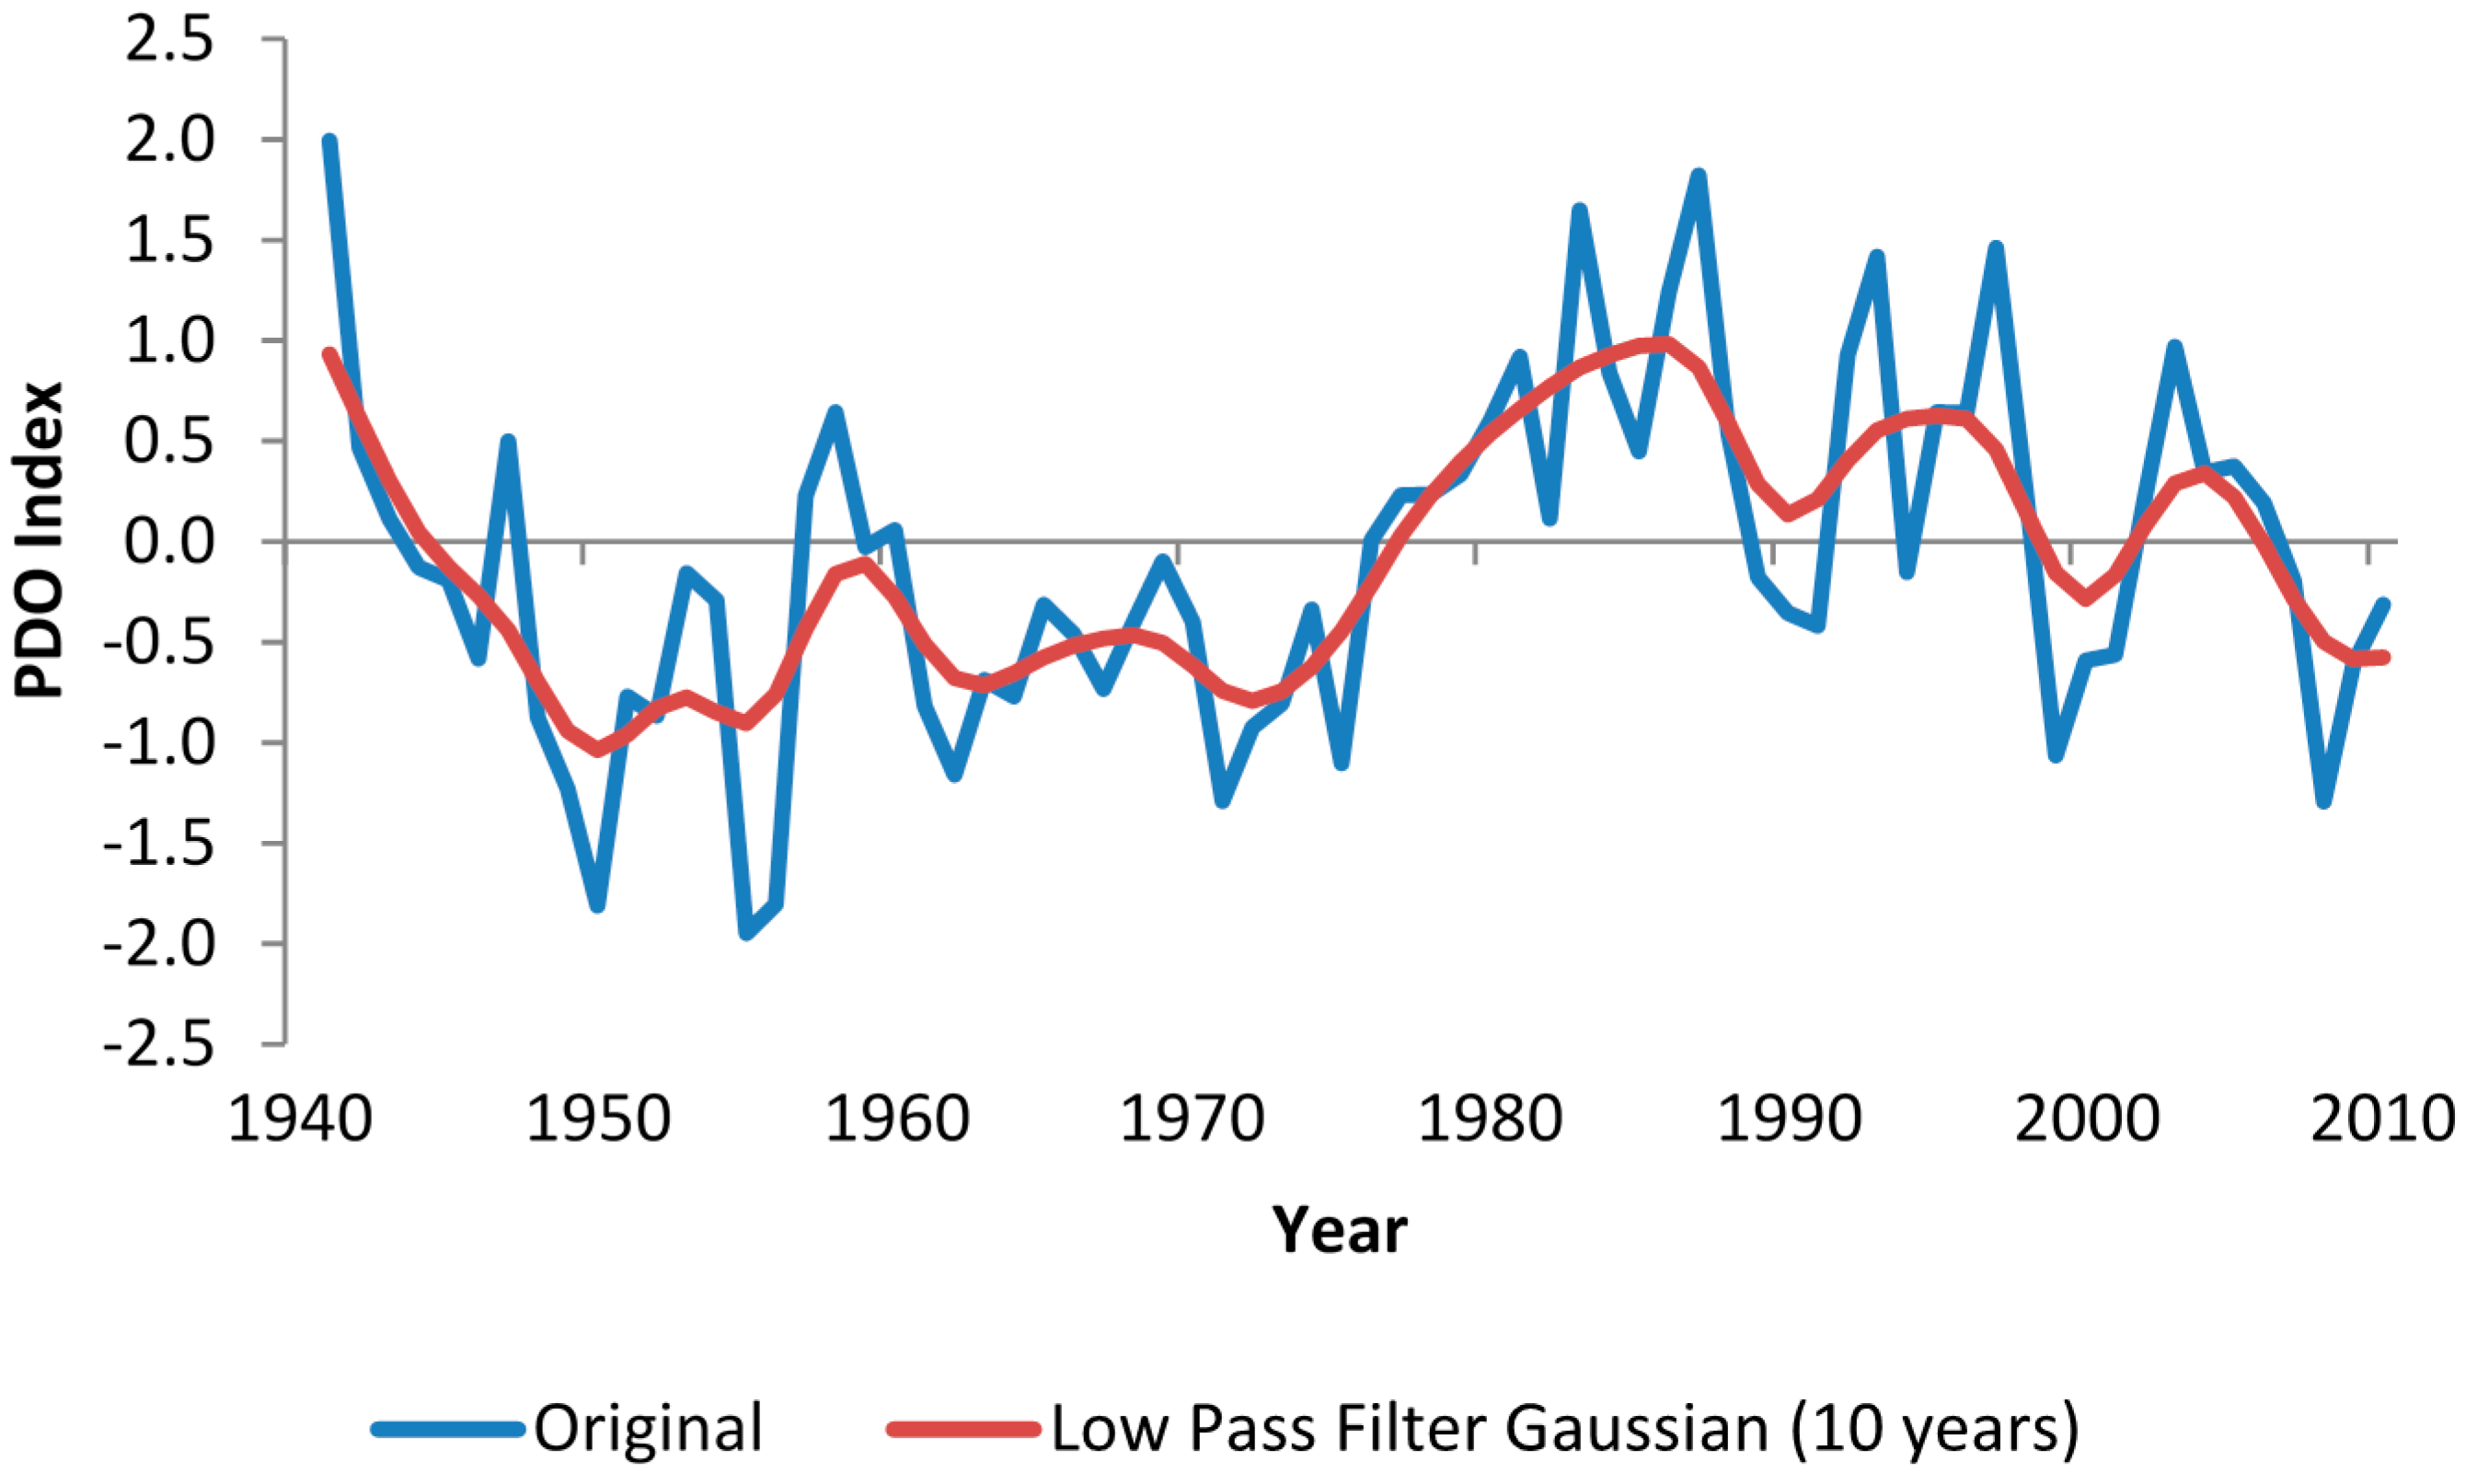
Statistically significant PDO teleconnections to precipitation in Argentina’s Pampa Region were observed at lags of 4 years in the Central Pampa sub-region, and at lags of 4 to 6 years in the Flooding and Southern Pampa sub-regions (
Table 5).
Table 4.
Correlation coefficients between the Atlantic Multidecadal Oscillation (AMO) and annual rainfall time series for the Pampa Region.
Table 4.
Correlation coefficients between the Atlantic Multidecadal Oscillation (AMO) and annual rainfall time series for the Pampa Region.
| Lag | RP | MP | CP | FP | SP |
|---|
| −20 | −0.0234 | −0.0295 | −0.1298 | −0.0865 | −0.0985 |
| −19 | −0.1980 | −0.1183 | −0.2139 | −0.1938 | −0.1513 |
| −18 | −0.1817 | −0.0829 | −0.2486 | −0.2476 | −0.2433 |
| −17 | −0.3121 | −0.1666 | −0.3049 | −0.2739 | −0.2880 |
| −16 | −0.3537 | −0.2378 | −0.3474 | −0.2631 | −0.2292 |
| −15 | −0.2213 | 0.0011 | −0.3032 | −0.1528 | −0.1696 |
| −14 | −0.1662 | −0.0323 | −0.2564 | −0.0857 | −0.1255 |
| −13 | −0.2599 | −0.0959 | −0.3388 | −0.2031 | −0.2153 |
| −12 | −0.1894 | −0.0677 | −0.3549 | −0.2341 | −0.2339 |
| −11 | −0.1803 | −0.1188 | −0.4051 | −0.2725 | −0.2863 |
| −10 | −0.3154 | −0.2784 | −0.4779 | −0.3924 | −0.4367 |
| −9 | −0.2784 | −0.2620 | −0.4186 | −0.3249 | −0.3048 |
| −8 | −0.2263 | −0.1892 | −0.5283 | −0.3139 | −0.4121 |
| −7 | −0.2617 | −0.1803 | −0.5054 | −0.2564 | −0.3619 |
| −6 | −0.1967 | −0.1124 | −0.3399 | −0.2136 | −0.2970 |
| −5 | −0.1884 | −0.0405 | −0.4449 | −0.1158 | −0.2295 |
| −4 | −0.1047 | 0.0457 | −0.2532 | −0.1703 | −0.1450 |
| −3 | −0.0188 | 0.0391 | −0.1540 | −0.0716 | −0.0566 |
| −2 | −0.0887 | −0.0878 | −0.2529 | −0.1607 | −0.0947 |
| −1 | −0.0956 | −0.0383 | −0.2681 | −0.2482 | −0.2158 |
| 0 | −0.1376 | −0.1107 | −0.3000 | −0.2237 | −0.2291 |
The fact that the correlations are positive indicates that as the North Pacific warms, precipitation increases in part of the Pampa Region and vice versa. Therefore, positive phases of this cycle favor the Argentine agricultural sector, while the negative phases are unfavorable.
As in the case of AMO, the fact that significant correlations begin as much as lag −10, suggest that its influence is transferred very slowly to the atmosphere, and therefore it takes several years before sensible changes in rainfall behavior are detected.
Similarly, PDO influence may be cumulative, requiring several years to reach an activation threshold strong enough to cause changes in rainfall behavior.
Although significant, all PDO correlations were weaker than those of AMO, showing that, by itself, It has little influence on the pampean rainfall regime. Nevertheless it may have some synergetic interaction with the AMO, whose cycle is almost inverse.
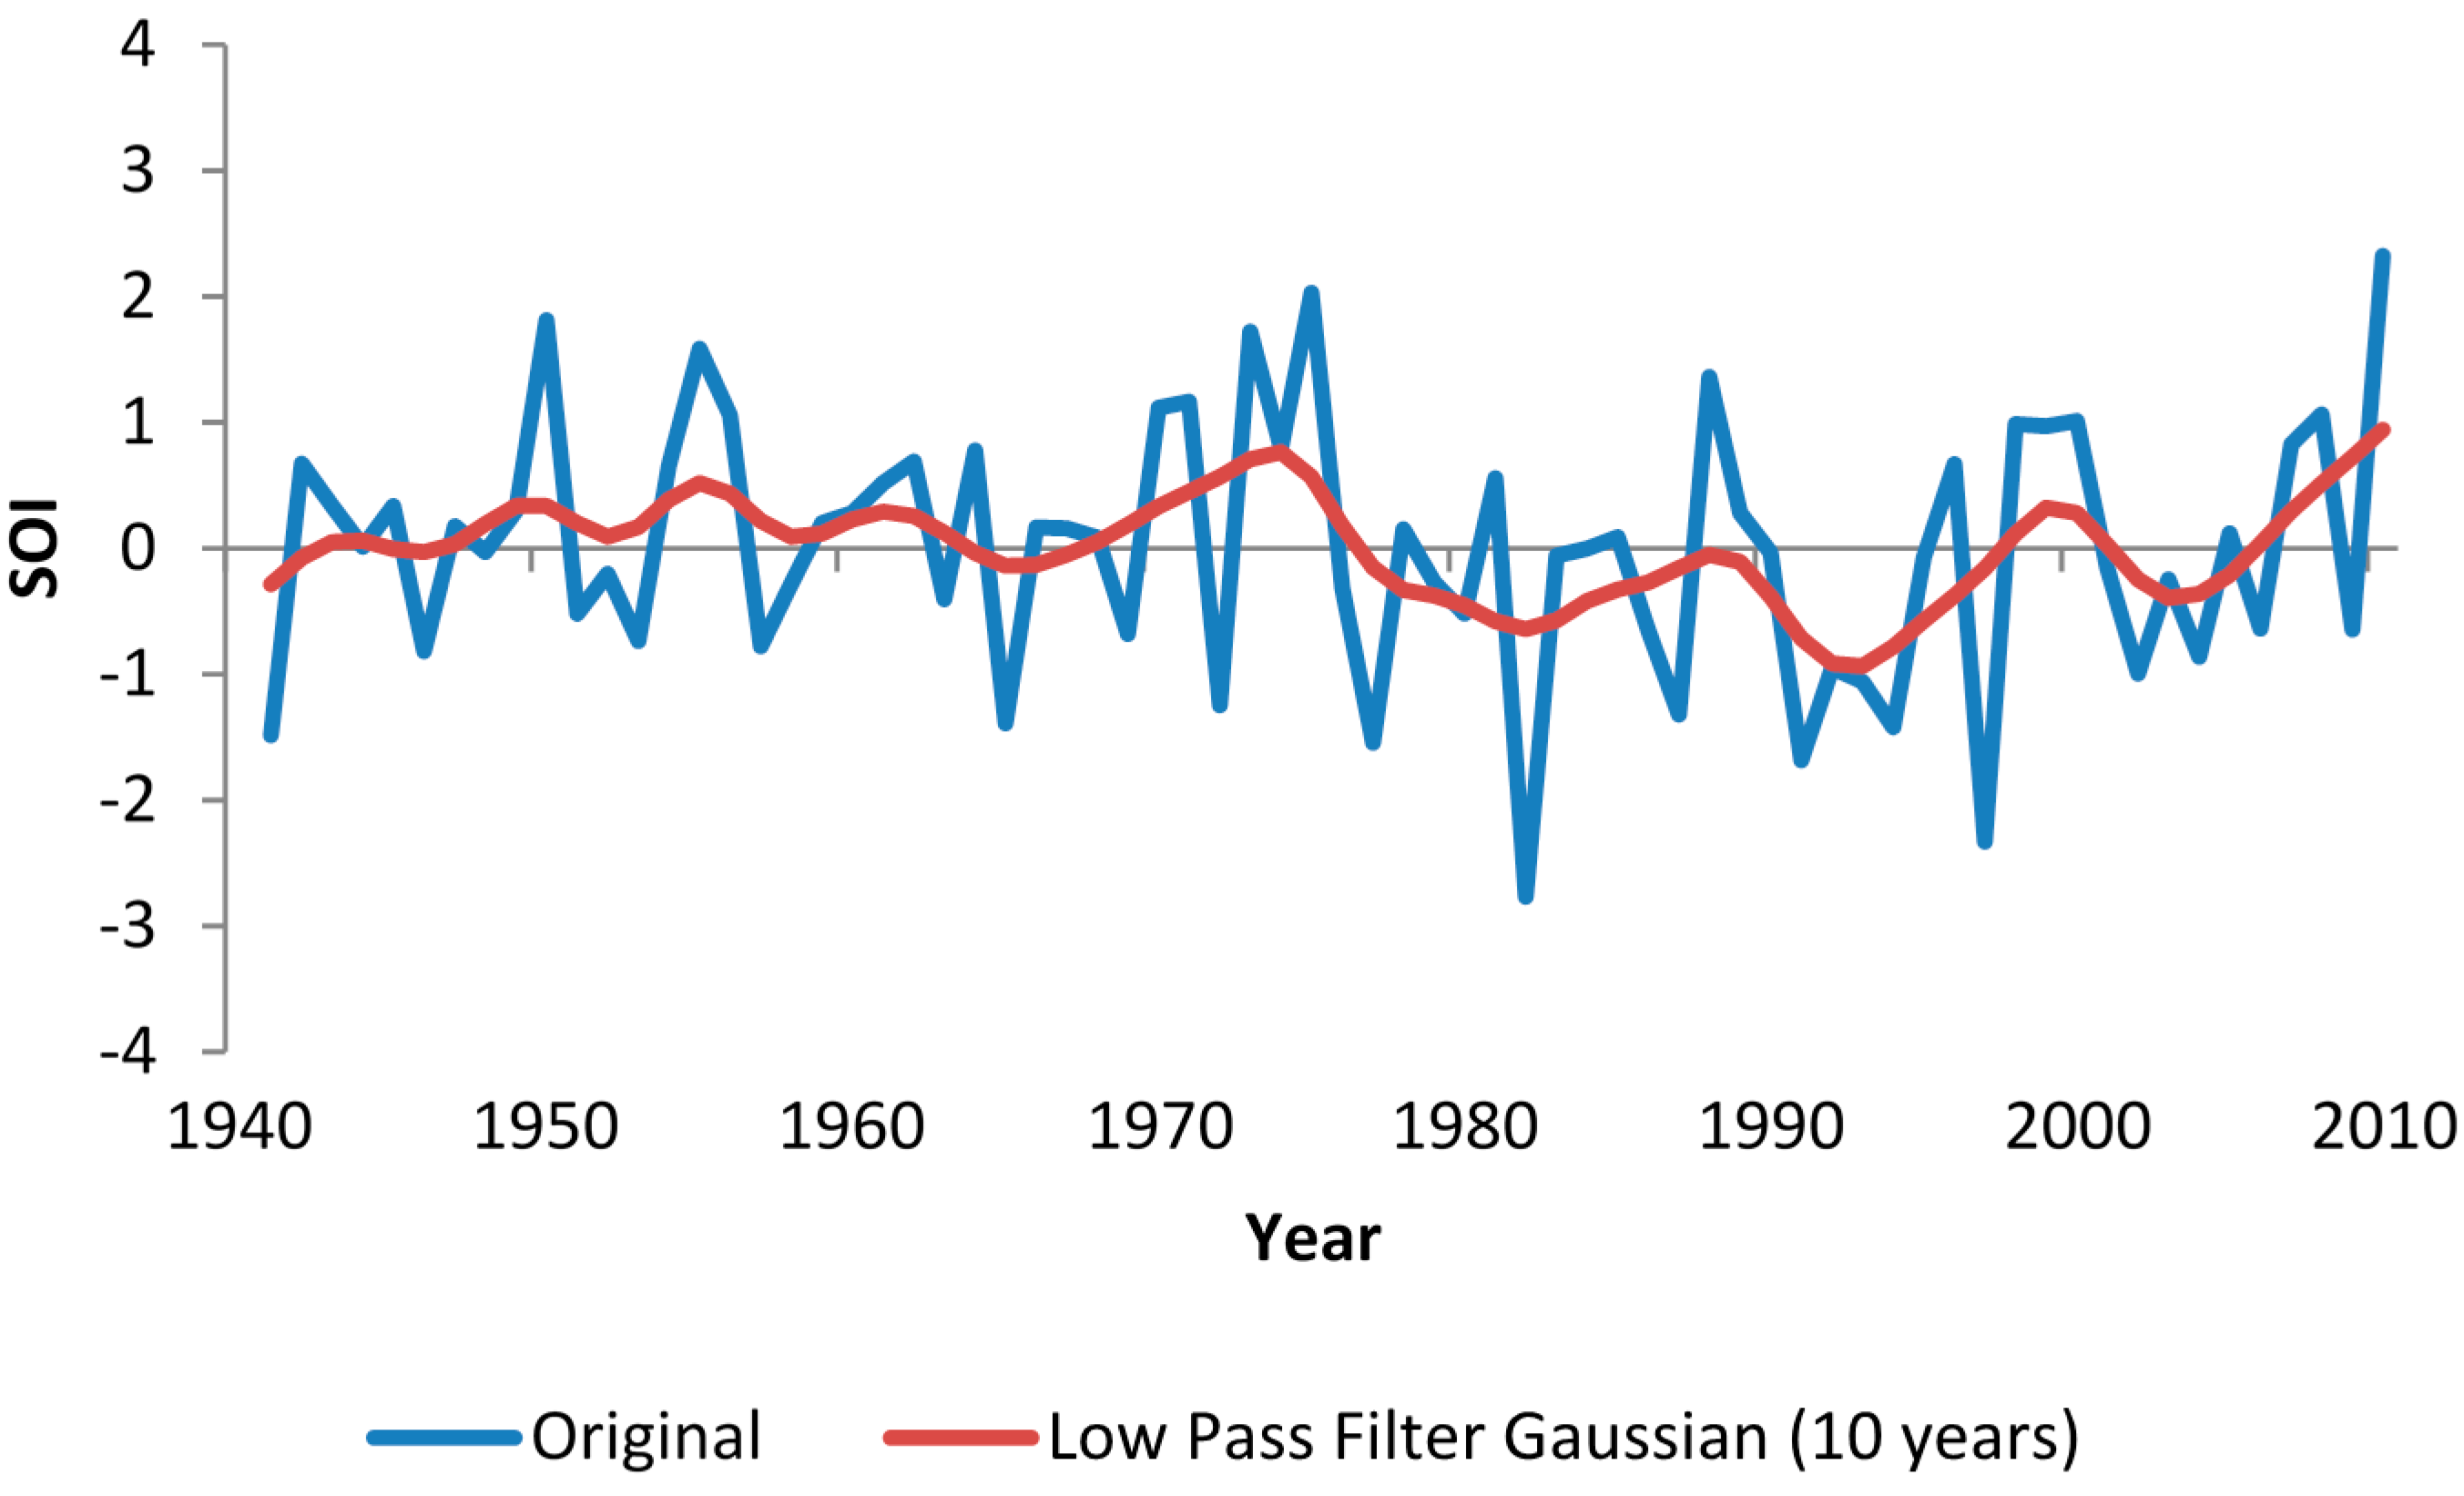
Statistically significant SOI teleconnections to precipitation in the Argentina Pampa Region were observed during the first year of each period in the Flooding and Southern Pampa sub-regions and at lag 7 years in the Central Pampa sub-region (
Table 6).
Table 5.
Correlation coefficients between the Pacific Decadal Oscillation (PDO) and the annual rainfall time series for the Pampa Region.
Table 5.
Correlation coefficients between the Pacific Decadal Oscillation (PDO) and the annual rainfall time series for the Pampa Region.
| Lag | RP | MP | CP | FP | SP |
|---|
| −20 | −0.0543 | 0.0568 | −0.1610 | −0.0764 | −0.0577 |
| −19 | 0.0604 | 0.2292 | −0.1320 | −0.0274 | −0.0830 |
| −18 | 0.0036 | 0.0694 | −0.0706 | −0.0665 | −0.0220 |
| −17 | −0.0109 | −0.0062 | −0.0415 | 0.0065 | 0.0634 |
| −16 | −0.0577 | 0.0683 | 0.0108 | −0.0543 | 0.0128 |
| −15 | −0.0162 | 0.1001 | 0.0764 | 0.0620 | 0.0741 |
| −14 | 0.0008 | 0.1935 | 0.0422 | −0.0051 | −0.0054 |
| −13 | 0.0029 | 0.0735 | −0.0938 | −0.1100 | −0.0600 |
| −12 | −0.0055 | 0.0036 | −0.0171 | −0.0738 | 0.0647 |
| −11 | −0.2090 | −0.1962 | −0.0649 | −0.1414 | −0.0270 |
| −10 | 0.0132 | 0.1259 | 0.0272 | 0.0514 | 0.0792 |
| −9 | 0.0106 | 0.0590 | 0.0504 | 0.1032 | 0.0867 |
| −8 | 0.0225 | 0.0808 | −0.0227 | −0.0027 | 0.0134 |
| −7 | 0.0333 | 0.0667 | 0.0253 | 0.0142 | 0.0136 |
| −6 | 0.1821 | 0.1085 | 0.1702 | 0.3433 | 0.3007 |
| −5 | 0.1672 | 0.1228 | 0.1776 | 0.3301 | 0.2436 |
| −4 | 0.1207 | −0.0415 | 0.3078 | 0.2349 | 0.2802 |
| −3 | 0.0286 | −0.0770 | 0.1123 | 0.0310 | 0.0494 |
| −2 | −0.1187 | −0.1685 | −0.0357 | −0.0684 | −0.1233 |
| −1 | −0.0206 | −0.0640 | 0.0991 | 0.1014 | 0.0436 |
| 0 | 0.1565 | 0.0601 | 0.2094 | 0.2731 | 0.1721 |
The fact that the correlations are negative indicates that when the trade winds strengthen, precipitation decreases in part of the Pampa Region and, conversely, when the trade winds slacken, precipitation increases. Therefore, the negative half of the SOI cycle, associated with “El Nino” events, favors the Argentine agricultural sector while the positive half, associated with “La Niña” events, is unfavorable.
It must be pointed out that SOI correlations to annual rainfall are necessarily weak because this atmospheric index acts predominantly during the spring and summer [
39], and therefore its influence is blurred by the use of annual data.
Table 6.
Correlation coefficients between the Southern Oscillation Index (SOI) and annual rainfall time series for the Pampa Region.
Table 6.
Correlation coefficients between the Southern Oscillation Index (SOI) and annual rainfall time series for the Pampa Region.
| Lag | RP | MP | CP | FP | SP |
|---|
| −20 | −0.1412 | −0.1968 | −0.1222 | −0.1595 | −0.1755 |
| −19 | −0.1681 | −0.1501 | −0.0653 | −0.0865 | −0.0105 |
| −18 | −0.0929 | −0.1157 | 0.0724 | 0.0818 | 0.1036 |
| −17 | 0.1892 | 0.2180 | 0.0089 | 0.1039 | 0.0454 |
| −16 | 0.0157 | −0.0846 | 0.0048 | 0.0524 | 0.0439 |
| −15 | −0.0841 | −0.1398 | −0.2318 | −0.0977 | −0.1329 |
| −14 | −0.0134 | −0.0185 | −0.0278 | 0.1175 | 0.0237 |
| −13 | −0.0938 | −0.1056 | 0.0423 | 0.1033 | 0.0166 |
| −12 | −0.0162 | 0.0007 | 0.0804 | 0.1292 | 0.0089 |
| −11 | 0.0608 | 0.0579 | 0.0197 | 0.0456 | 0.0087 |
| −10 | −0.2102 | −0.1870 | −0.2033 | −0.1881 | −0.1416 |
| −9 | −0.1095 | −0.0979 | −0.0246 | −0.0499 | −0.0109 |
| −8 | −0.2023 | −0.2033 | −0.0182 | −0.1213 | −0.0179 |
| −7 | −0.0267 | −0.0123 | −0.2904 | −0.0061 | −0.1194 |
| −6 | −0.1305 | −0.1348 | −0.1356 | −0.1974 | −0.1360 |
| −5 | −0.0313 | 0.0223 | −0.1598 | −0.0586 | −0.1237 |
| −4 | −0.0491 | 0.0403 | −0.1913 | −0.0097 | −0.0418 |
| −3 | 0.1789 | 0.2257 | 0.0934 | 0.0505 | 0.0424 |
| −2 | 0.2139 | 0.1670 | 0.0626 | 0.1313 | 0.1420 |
| −1 | −0.0056 | −0.1194 | 0.0347 | −0.0336 | 0.0004 |
| 0 | −0.1580 | −0.0407 | −0.2212 | −0.3848 | −0.3741 |


