Article

Soluble VCAM-1 Alters Lipid Phosphatase Activity in Epicardial Mesothelial Cells: Implications for Lipid Signaling During Epicardial Formation

1
Department of Pediatrics, Feinberg School of Medicine, Northwestern University, 225 E. Chicago Ave., Box 204 Chicago, IL 60611, USA
2
Department of Urology, Feinberg School of Medicine, Northwestern University, 303 E. Chicago Ave., 16-703 Chicago, IL 60611, USA
*
Author to whom correspondence should be addressed.
J. Dev. Biol. 2013, 1(2), 159-185; https://doi.org/10.3390/jdb1020159
Submission received: 2 May 2013 / Revised: 12 July 2013 / Accepted: 23 August 2013 / Published: 18 September 2013
(This article belongs to the Special Issue Epicardial Development and Cardiovascular Disease)

Abstract

:
Epicardial formation involves the attachment of proepicardial (PE) cells to the heart and the superficial migration of mesothelial cells over the surface of the heart. Superficial migration has long been known to involve the interaction of integrins expressed by the epicardium and their ligands expressed by the myocardium; however, little is understood about signals that maintain the mesothelium as it migrates. One signaling pathway known to regulate junctional contacts in epithelia is the PI3K/Akt signaling pathway and this pathway can be modified by integrins. Here, we tested the hypothesis that the myocardially expressed, integrin ligand VCAM-1 modulates the activity of the PI3K/Akt signaling pathway by activating the lipid phosphatase activity of PTEN. We found that epicardial cells stimulated with a soluble form of VCAM-1 (sVCAM-1) reorganized PTEN from the cytoplasm to the membrane and nucleus and activated PTEN’s lipid phosphatase activity. Chick embryonic epicardial mesothelial cells (EMCs) expressing a shRNA to PTEN increased invasion in collagen gels, but only after stimulation by TGFβ3, indicating that loss of PTEN is not sufficient to induce invasion. Expression of an activated form of PTEN was capable of blocking degradation of junctional complexes by TGFβ3. This suggested that PTEN plays a role in maintaining the mesothelial state of epicardium and not in EMT. We tested if altering PTEN activity could affect coronary vessel development and observed that embryonic chick hearts infected with a virus expressing activated human PTEN had fewer coronary vessels. Our data support a role for VCAM-1 in mediating critical steps in epicardial development through PTEN in epicardial cells.

1. Introduction

Heart development involves the joining of various mesodermal and ectodermal cells to the mature organ. The outermost mesothelial layer of the heart, the epicardium, is derived from elements of the splanchnic mesoderm, which first forms a villous structure protruding from the primitive liver called the proepicardium (PE) [1,2]. The PE attaches to the inner curvature of the looped myocardium and cells begin to superficially migrate over its surface to create a mesothelium called epicardium [1,2,3]. Concurrent with migration, and for some time after, epicardial mesothelial cells (EMCs) begin to delaminate and invade deeper aspects of the myocardium where they ultimately contribute to the coronary vessels, cardiac fibroblasts and AV valves [4,5,6,7]. However, early sites of epicardial to mesenchymal transformation (EMT) are regionalized and most migrating mesothelial cells remain superficial until later. Thus, it is likely that the timing of epicardial invasion is regulated. A simplistic model would be that while undergoing directional migration, EMCs are largely inhibited from undergoing EMT, then once the mesothelium is established, other pathways stimulating EMC invasion become dominant.
We previously reported a pathway that maintains the mesothelial state of the epicardium in the presence of EMT stimulators. This mechanism requires the presence of the integrin α4β1 (CD49d/CD29) on the surface of EMCs. Integrin α4β1 is known to be important for superficial migration of PE cyst cells during mouse epicardial development [8,9] and is expressed exclusively in the PE and epicardial mesothelium [10]. Down regulation of α4β1 in chick embryonic EMCs is sufficient to stimulate their invasion and alters their ability to differentiate into vascular smooth muscle cells [11]. Treatment of EMCs with the ligand of α4β1, soluble VCAM-1 (sVCAM-1) reduces epicardial EMT even in the presence of TGFβ ligands. A direct result of sVCAM-1 treatment of EMCs was an increase in the amount of active p190RhoGAP and a decrease in the amount of active RhoA [12]. These findings support a model in which α4β1 activates p190RhoGAP to antagonize RhoA and restrict the Rho/ROCK pathway. This limits the ability of EMCs to generate actin stress fibers and mediate actinomyosin-based motility via Rho/ROCK.
EMT involves the degradation of intercellular adhesion and cytoskeletal rearrangements that promote cellular invasion. Interestingly, we observed that sVCAM-1 increased the strength of epicardial cell-cell adhesion, robustly stimulated accumulation of junctional proteins within junctional complexes and promoted circumferential actin belts that stabilize intercellular junctions [12]. Since Rho/ROCK signaling is not thought to play a direct role in establishing intercellular junctional complexes, these observations suggested another role for sVCAM-1/α4β1 signaling in maintaining or promoting junctional complexes between mesothelial cells. VCAM-1 is a cytokine inducible cell surface protein that mediates the adhesion of a number of leukocytes to activated endothelium [13]. It is a member of the immunoglobulin (Ig) super family of cell surface proteins [14] and in defined isoforms contains seven or more extracellular Ig-like domains at the amino-terminal portion of the molecule. VCAM-1 is expressed in cells of the primary myocardium, just below the epicardium, in embryonic mice [8,15,16]. Deletion of the gene encoding VCAM-1 in mice caused cardiac defects consistent with an interactive role in mediating superficial migration of EMCs on the myocardium [16,17]. Thus, the interaction between VCAM-1 and α4β1 in the developing heart may serve as an evolutionarily conserved signaling pathway important for mesothelial formation or maintenance.
Various pathways are implicated in the establishment and maintenance of epithelial cohesion. One of these is the phosphatidylinositol 3-kinase/Akt (PI3K/Akt) pathway, which, by inhibiting GSK3β, can promote loss of epithelial characteristics [18,19,20,21]. Factors known to stimulate epicardial EMT also have been shown to activate PI3K/Akt signaling [22,23,24]. Other studies have implicated integrin signaling in modifying PI3K/Akt signaling, particularly in focal adhesions [20,25,26]. Since sVCAM-1 robustly antagonizes epicardial EMT, we hypothesized that sVCAM-1/α4β1 signaling could modify PI3K/Akt signaling. This hypothesis was supported by the finding of White et al. (2003) [27] that α4β1 ligation activates a cellular inhibitor of PI3K, phosphatase and tensin homolog on chromosome 10 (PTEN), in human lung fibroblasts. PTEN is a dual specificity phosphatase that, as a lipid phosphatase, dephosphorylates phosphatidylinositol (3,4,5) phosphate (PIP3) to phosphatidylinositol (4,5) phosphate (PIP2) (reviewed in [28]). Loss of PTEN has also been shown to increase EMT in cancer [29,30].
Here we report that sVCAM-1 can increase the activity PTEN in epicardial mesothelial cells and stimulate its localization to membranes. Additionally, we found that altering PTEN function, either by expression of a constitutively active human isoform or by expression of a shRNA targeting PTEN, modified epicardial invasion into collagen gels, epicardial junctional complexes and affected coronary vascular development in chick embryos. Thus, we believe that sVCAM-1, through its receptor α4β1 integrin, in addition to promoting superficial migration, can activate signals that antagonize EMT by promoting intercellular adhesion.

2. Experimental Methods

2.1. Chicken Eggs

Fertile White Leghorn chicken (Gallus gallus) eggs were obtained from Phil's Fresh Eggs (Forreston, IL) and were incubated in a humidified bird hatching incubator at 39 °C. Embryos were staged using the system of Hamburger and Hamilton (1951) [31].

2.2. Antibodies and Reagents

Polyclonal antibodies to mouse Akt (#9272), mouse phospho-Akt (Ser 473) (#9271), human PTEN (#9559 and #9552) were from Cell Signaling Technology. All were used at 1:1000. Rabbit anti-human ZO1 was from Invitrogen (Zymed) and used at 1:500. Texas-red X phalloidin and DAPI were from Invitrogen Molecular Probes. The monoclonal antibody to avian myoblastosis virus GAG protein (mAb 3C2) was obtained from the Developmental Studies Hybridoma Bank and used at 1:100. Rabbit anti-E-cadherin was from Lifespan Biosciences (#C33410) and used at 1:200 (this antibody is no longer available). Monoclonal antibodies to β-actin (clone AC-74, used at 1:10,000) and smooth muscle α-actin (clone 1A4, used at 1:500) were from Sigma. LY294002 was obtained from EMD Millipore and used at 10 µM. TGFβ3 and sVCAM-1 were obtained from Peprotech and used at 1 ng/mL (TGFβ3) and 100 ng/mL (sVCAM-1). Protease (#P8340) and phosphatase (#P0044) inhibitor cocktails were from Sigma.

2.3. Cell Culture

All cells were grown in tissue culture incubators in 5% CO2. Rat epicardial cells were originally derived from adult rat hearts [12,32,33,34,35] and cultured in DMEM medium (Hyclone) containing fetal bovine serum (10% v/v) and penicillin, streptomycin and fungizone (diluted to 1× from a 100× stock). When cells were serum starved they were washed twice with DMEM medium with penicillin, streptomycin and fungizone (no fetal bovine serum) and then incubated in the same serum-free medium overnight, prior to the specified treatments. Primary cultures of chick EMCs were made by explanting HH24 hearts onto sterile glass coverslips coated with Rat tail collagen I (BD Biosciences). Coverslips were placed in 30 mm cell culture dishes (VWR) and covered with 500–600 µL serum-free M199 supplemented with penicillin, streptomycin and fungizone as above. DF-1 chick embryonic fibroblasts were obtained from ATCC (CRL-12203) and grown in DMEM medium containing fetal bovine serum (10% v/v) and penicillin, streptomycin and fungizone as above.

2.4. Lipid Phosphatase Assay

Confluent, rat EMCs were serum starved and stimulated with VCAM-1 (1 nmol/L) various times for up to 1 h. Phospholipid vesicles were generated by vortexing D-myophosphatidylinositol 3,4,5-triphosphate phospholipids (Echelon Biosciences) in 10 mmol/L HEPES, pH 7.4, 1 mmol/L EGTA, and 1 mg/mL BSA. PTEN was immunoprecipitated from RIPA-solubilized cell lysates (see section 2.7) and combined with phospholipid vesicles (10 µL) in a final volume of 50 µL of enzyme assay reaction buffer (500 mmol/L Tris, pH 8, 10 mM dithiothreitol) in tubes for 40 min. Beads were removed by centrifugation and supernatants were added to BIOMOL green reagent (100 µL) for 30 min at ambient temperature. Phosphate release was determined by absorbance at 650 nm. Activity was determined by comparing the optical densities to those obtained from a phosphate standard curve in the same assay.

2.5. Immunostaining

Rat or primary chicken embryonic epicardial cells were cultured on glass coverslips (as above) and serum starved for 12 h. Cell were treated with soluble factors for various times: typically 0, 30 and 60 min. Cells were fixed for 10 min in fresh paraformaldehyde (4% v/v), washed in PBS and then in PBT (PBS with 0.1% v/v Tween-20 and 0.1% bovine serum albumin, w/v). Coverslips were incubated with primary antibodies (diluted in PBT) overnight, washed in PBS for 30 seconds and incubated for 2–4 h in secondary antibodies. After washing for 30 seconds in PBS, coverslips were mounted on glass slides in gel polymount (Fisher). Staining was imaged on a Zeiss LSM510 UV Confocal microscope.

2.6. Cell Fractionation

Confluent, rat EMCs were cultured on 10 cm dishes and then serum starved overnight. Cells were treated with TGFβ3 (1 ng/mL), sVCAM-1 (100 ng/mL) or a combination of the two as above for 30 min or 2 h and then rinsed in PBS and removed from plates by scraping in lysis buffer: Tris, pH7.5 (20 mmol/L), EDTA (0.5 mmol/L), EGTA (0.5 mmol/L), 2-mercaptoethanol (10 mmol/L), aprotinin (25 mg/mL) and leupeptin (25 mg/mL). Cells were disrupted in a Dounce homogenizer using 15 strokes and then left on ice for 20 min. Low speed centrifugation (5,000 g) was performed to remove nuclei. The nuclear pellet was dissolved in Triton solubilization buffer: Tris, pH7.5 (20 mmol/L), Triton X-100 (0.25% v/v) EDTA (0.5 mmol/L), EGTA (0.5 mmol/L), 2-mercaptoethanol (10 mmol/L), aprotinin (25 mg/mL) and leupeptin (25 mg/mL). The cell supernatant, containing both membrane and cytosolic fractions, was centrifuged at 100,000 g for 45 min at 4 °C. Supernatant was removed as the cytosolic fraction. The pellet was dissolved in Triton solubilization buffer and then centrifuged at 16,000 g in a microcentrifuge at 4 °C. The supernatant was removed as the Triton soluble membrane fraction. Proteins were quantified using a Bradford assay (Pierce) and equal amounts electrophoresed in 4–20% SDS PAGE gels (BioRad). Proteins were transferred to nitrocellulose and probed as above.

2.7. Immunoprecipitation

Rat EMCs were serum starved overnight, treated as above and washed with PBS twice. Cells were solubilized in ice cold RIPA buffer (50 mmol/L Tris-HCl pH 8.0, 350 mmol/L NaCl, 1% w/v NP-40, 0.5% w/v deoxycholate, 0.1% w/v sodium dodecyl chloride) for 5 min, scraped and spun at 4 °C at 10,000 rpm for 10 min. Protein in cleared supernatants was quantified using the Bradford method and 4 µg of primary antibody was added to 300–900 µg of total cellular protein. Tubes were rocked overnight at 4 °C. 20 µL of Protein A/G PLUS agarose (Santa Cruz Biotechnology) was added to each sample and tubes rocked at 4 °C for 1 h. Agarose beads were washed, boiled in sample buffer and proteins loaded onto 7.5% SDS PAGE gels (Biorad). Each experiment was performed in triplicate.

2.8. Viruses

AdnlacZ was constructed as described in Dettman et al., (1998) [6] and produced and concentrated using a Fast Trap Adenovirus Purification and Concentration Kit (Millipore) according to the manufacturer’s instructions. RCASYDV and RCASNHAGFP were obtained from Dr. Stacy Loftus at the NHGRI. Oligonucleotides encoding shRNAs to chicken PTEN were designed using the BLOCK-iT™ RNAi Designer from Invitrogen. Oligonucleotides were annealed and ligated to pENTR/U6 using T4 DNA ligase. Inserts were sequenced and successful clones were recombined with RCASYDV using LR clonase (Invitrogen). Individual RCAS recombinants were screened by digestion with EcoRV (Promega) and inserts were again sequenced. Plasmids containing PTEN-GFP and PTEN A4-GFP were obtained from Dr. William Sellers (Harvard University) through Addgene. cDNAs were amplified using Pfx Ultra Taq polymerase (Stratagene) and then incubated with pENTR/D/Topo (Invitrogen). Inserts were sequenced and pENTR/D/Topo clones were recombined with RCASYDV. Viruses were produced in DF-1 chick embryonic fibroblasts concentrated by ultracentrifugation at 22,000 RPM for 2 h in a SW-28 (Beckman) rotor and frozen in liquid nitrogen.

2.9. RCAS Transduction

Chick embryos were incubated at 39 °C in a humidified hatching incubator for 60 h. Eggs were windowed and India ink was injected underneath the yolk sac to visualize the embryo. HH17 or HH18 were used in this experiment. Small holes were opened in the yolk sac and vitelline membranes over the pericardium. Approximately 106 viral particles in 1–2 µL were injected into the pericardial space using a Finnpipette Labsystems pipettor. Windows were sealed with Parafilm (Pechiney Plastic Packaging) and eggs placed back in the incubator for either 2 or 10 days.

2.10. Invasion Assays

Collagen gel assays were performed as in Dokic and Dettman (2006) [17] except that we used PureCol rat tail collagen I from Inamed (Fremont, CA). To quantify invasion, we counted propidium iodide (Sigma) stained cells in three 20x fields from each gel. An in-depth description of the organ culture assay to quantify EMT in embryonic chick hearts is described in Dokic and Dettman (2006) [17]. In this experiment, HH27 hearts were excised in sterile PBS, infected for 4 h in serum free M199 medium and then washed in serum free medium. TGFβ3 and LY294002 (or a combination) were added to serum free medium and hearts incubated an additional 48 h. Hearts were stained, fixed and sectioned as in Dokic and Dettman (2006) [17]. Cells with lacZ+ nuclei were counted in a minimum of six sections and averaged per sample. Cells in the epicardium were scored as non-invasive. Cells underneath were defined as invasive and the percent invasive cells calculated as the number of invasive cells divided by the total.

2.11. Dispase II Assay

Rat epicardial monolayers were left untreated (UTD), treated with TGFβ3 (1 ng/mL), LY294002 (10 µm), or the combination of TGFβ3 and LY294002. Each treatment lasted 24 h. Monolayers were lifted using dispase II (Roche), agitated in the dish on an orbital shaker and the number of fragments produced were counted in each dish.

2.12. India Ink Labeling of Coronary Vessels

Embryos were removed from eggs and placed on absorbent paper. The thoracic cavity was opened to expose the beating heart. A small cut was made in the wall of the right ventricle. Undiluted India ink (Speedball, Super Black) was injected into the lumen of the left ventricle using a tuberculin syringe and a 30-gauge needle. Gentle pressure was applied to the plunger until ink could be seen in the left and right atria and outflow vessels.

2.13. Quantification of Junctional Actin Filaments by Confocal Microscopy

Images were obtained by confocal imaging in Zeiss LSM 510 software and opened in Image J 1.44 using the LSM reader plugin. Data for pixels was obtained by drawing lines, usually between 40 µm and 100µm in length and crossing three junctions either defined by E-cadherin or ZO1 staining. Lines were analyzed using the Analyze>Plot Profile command for both the green and red channels. Data from graphs was exported to Microsoft Excel using the “list” command. Values were the intensities of the fluorescent pixels in grayscale units from 0–255 in 8-bit images. Junctions were defined by manually inspecting the peaks of the green image and determining the positions along each line defined by these peaks. Then, gray values at those positions were determined in the data from the red (actin) channel. Here, the values were averaged if they were (1) at the junction and (2) defined the peak gray value at the junction and (3) were within 20% of the peak value. Mean pixel intensity for actin was determined for three junctions in each line. The remaining gray values from the red channel were averaged to determine the actin arrays in-between junctions. The ratio of the two values was calculated to determine the “junctional actin ratio”. Representative data is shown in Figure S1.

2.14. Quantification of Coronary Vessel Density in Hearts

To quantify coronary vessel density we used a modified method from Huang et al., 2004 [36]. Embryos were dissected to expose the heart and a small cut was made in the right atrium. The left ventricle then injected with a solution of isolectin GS-IB4 (1:1,000) and saline (1 mL). After 10 min, hearts were removed and fixed in 4% (v/v) formaldehyde from paraformaldehyde. After overnight fixation, hearts were rinsed in PBS several times and equilibrated in sucrose (20% w/v in PBS) and again in sucrose (30% w/v in PBS). Hearts were frozen in OCT and transverse cryosections (10 µm) were placed on positively charged glass slides (VWR). Transverse sections of the superior aspect of the ventricles were stained with antibodies Caldesmon (CALD-5) in order to identify vascular smooth muscle cells. Digital images were from five separate 40x fields per section and vessel counts were made in blinded fashion. Ten non-consecutive sections were analyzed and data averaged for each sample.

2.15. Statistical Analysis

All data was compiled in Microsoft Excel and exported to InStat software (GraphPad Software). Mean, standard deviation, standard error of the mean and ANOVA were all calculated using InStat.

3. Results and Discussion

3.1. The PI3K Inhibitor LY294002 Can Block Epicardial EMT

One pathway implicated in regulating epithelial junctional integrity is the PI3K/Akt signaling pathway [19,20,24] and this pathway can be modified by cell-surface integrins [19,25,26]. It is also known that inhibition of PI3K/Akt signaling represses epicardial EMT in mice [
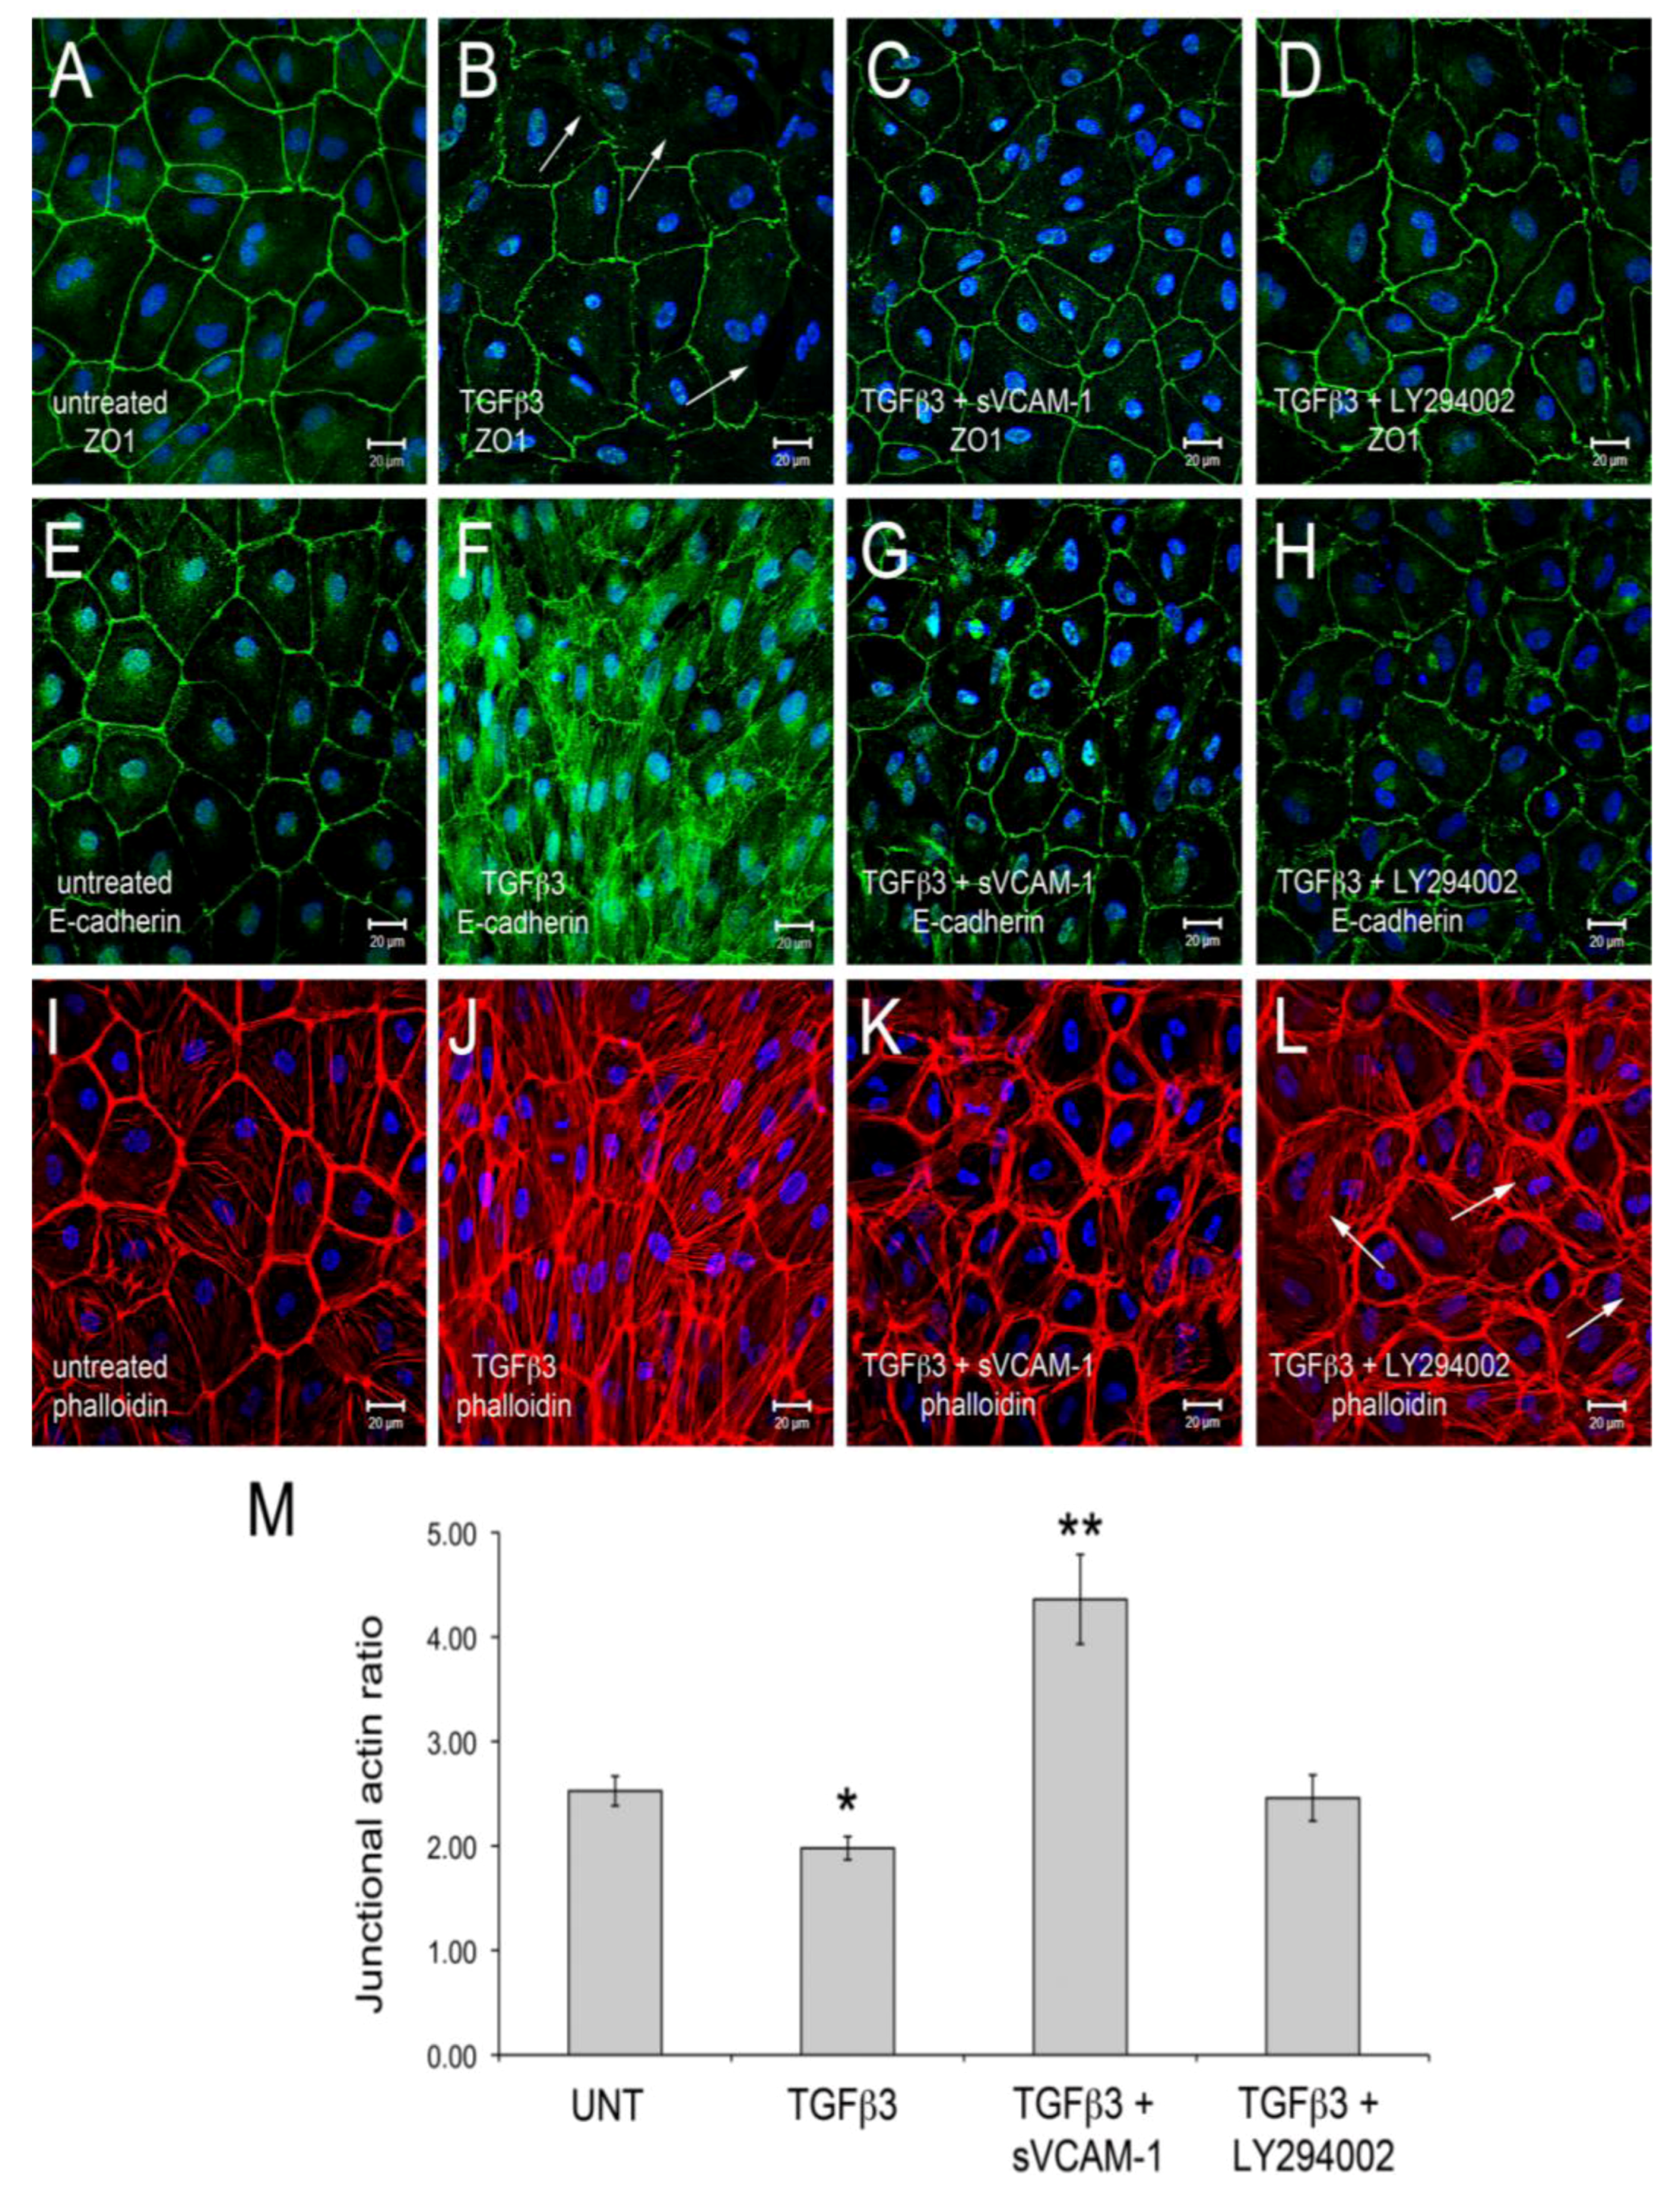
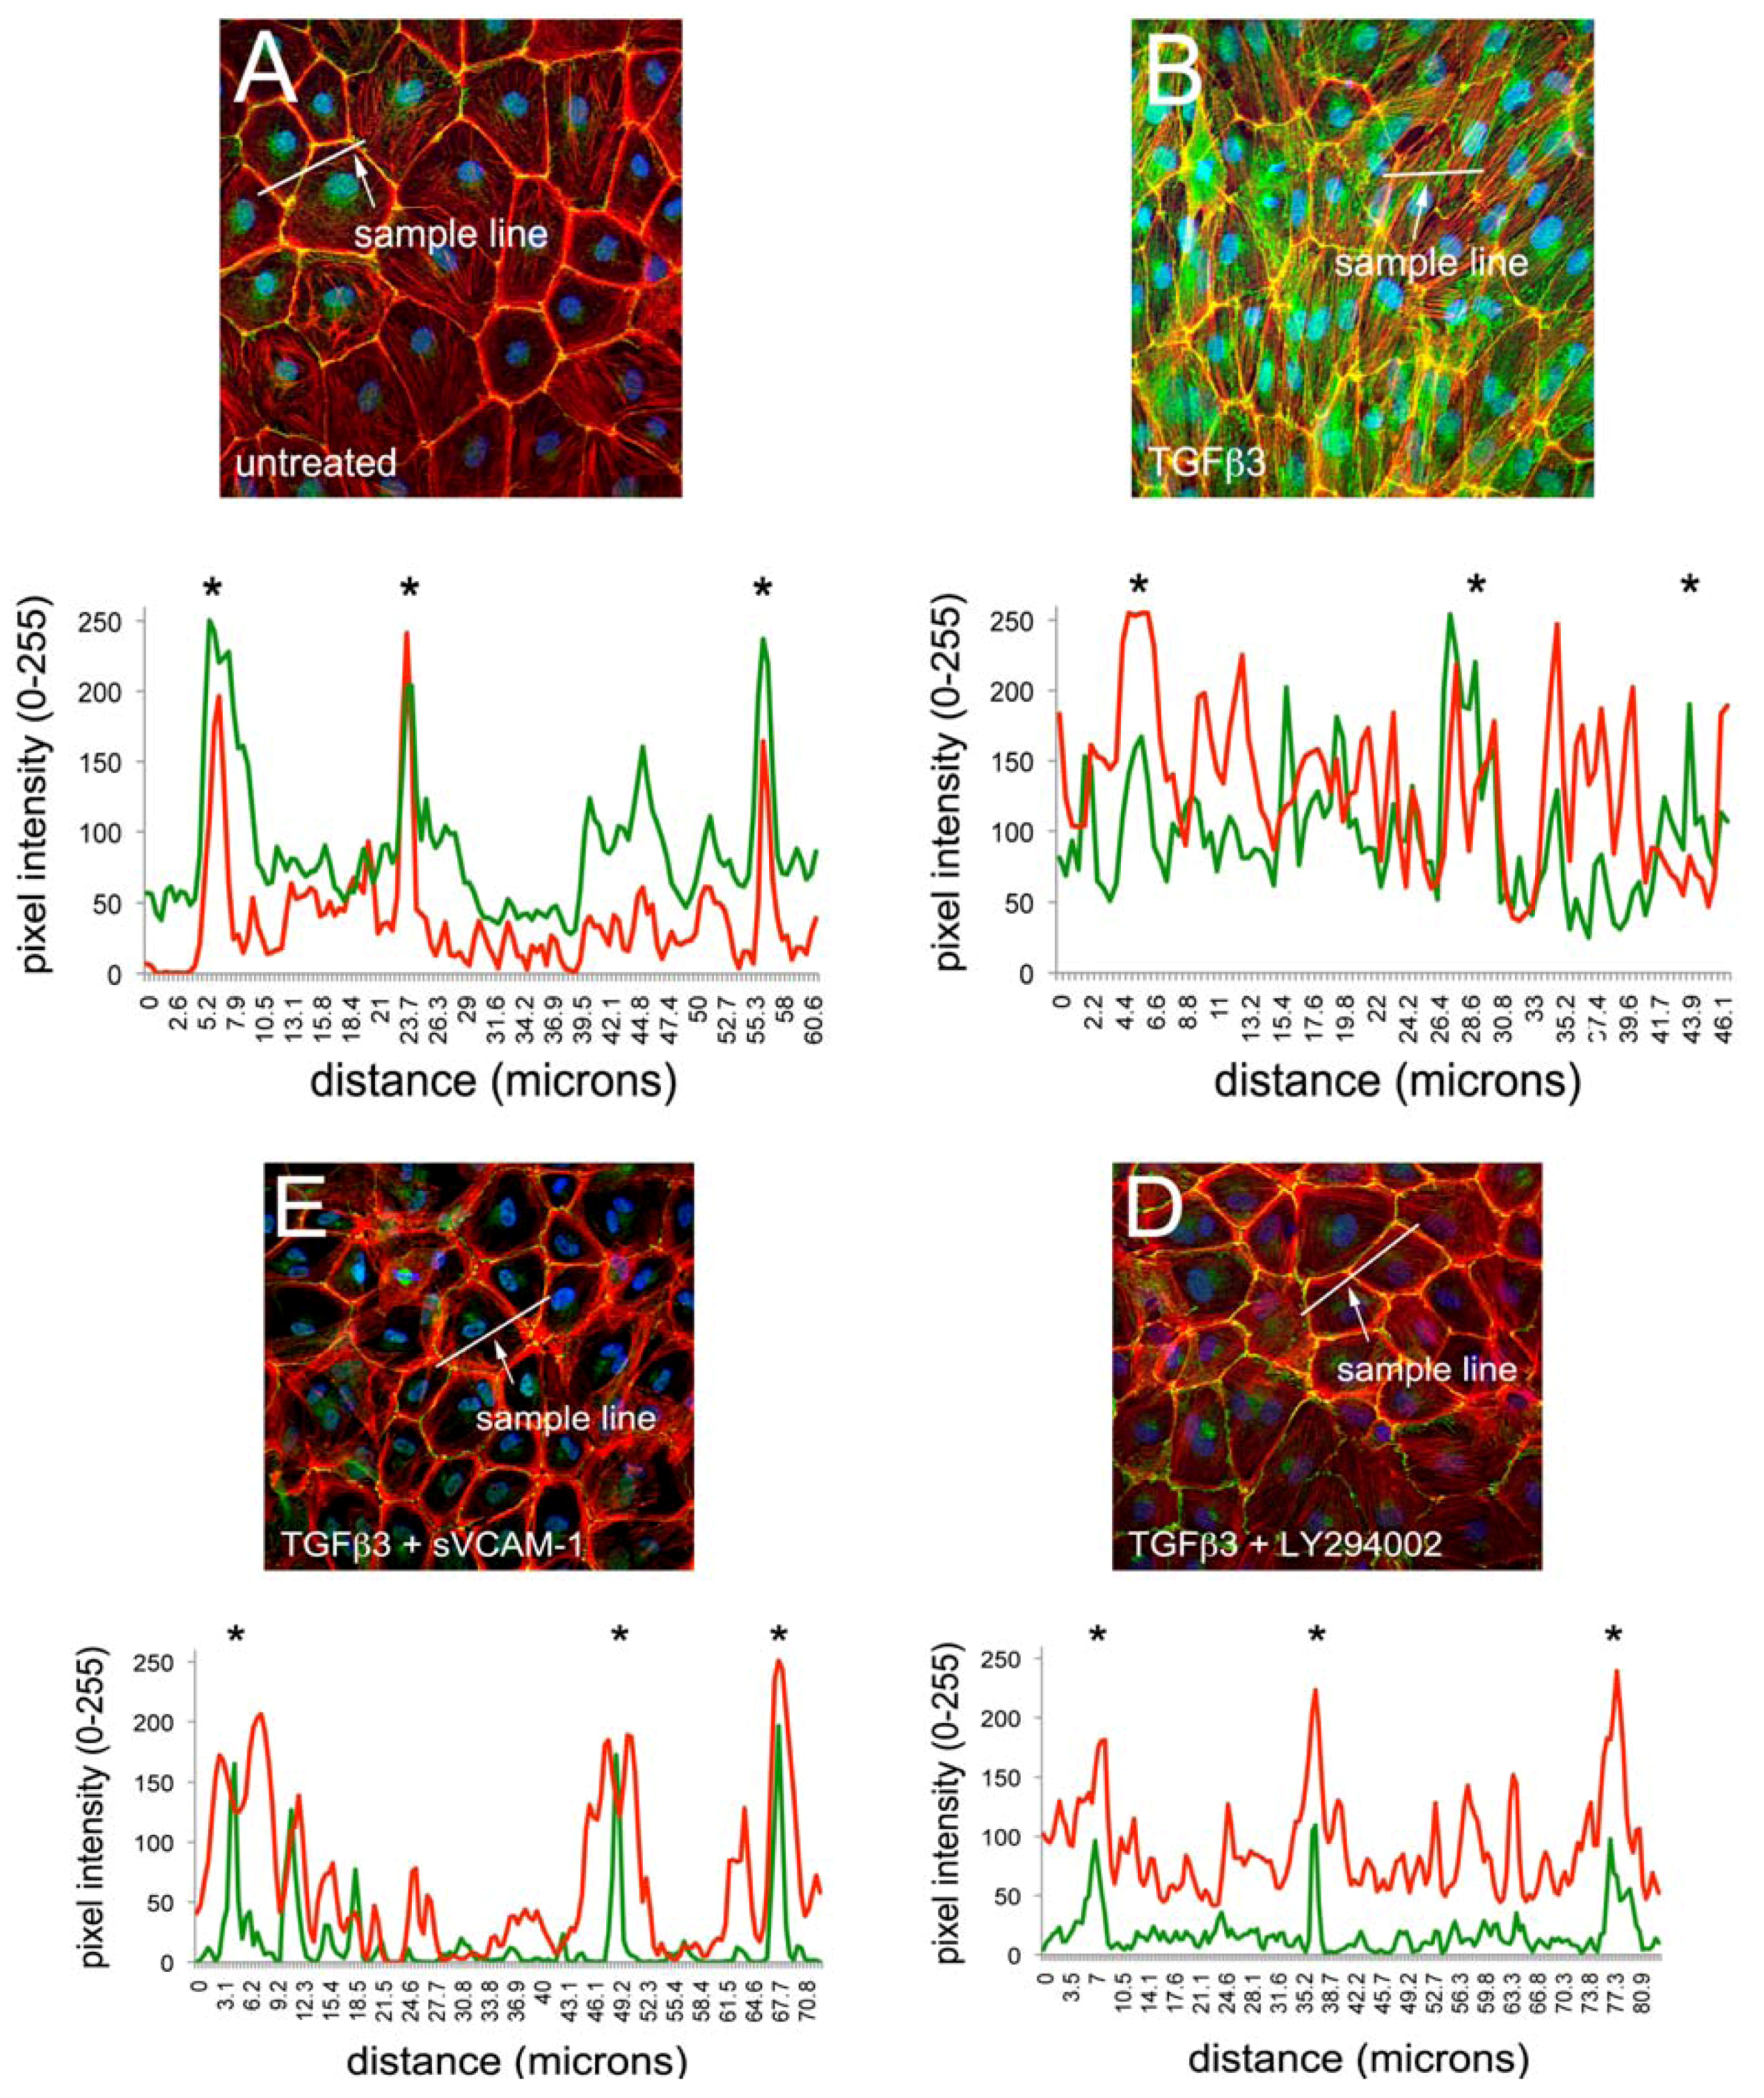
22]. We therefore tested if the PI3K inhibitor LY294002 can modulate junctional complexes and actin polymerization in EMCs similar to what we have observed with sVCAM-1. HH24 Chick embryonic EMCs were cultured in serum free medium and treated for 24 h with TGFβ3, TGFβ3 and sVCAM-1 or TGFβ3 and LY294002. Cells were fixed and stained for the tight junction protein zona occludins-1 (ZO1), the adherens junction protein E-Cadherin or f-actin with Texas-Red-X phalloidin (Figure 1). Here, we observed that TGFβ3 altered ZO1 (Figure 1B) and E-Cadherin localization in intercellular junctions (Figure 1F) and caused cytoskeletal changes in these cells (Figure 1J). sVCAM-1 limited these changes during an identical treatment period (Figure 1C, G) and increased circumferential actin belts at the expense of stress fibers (Figure 1K). LY294002 effectively inhibited changes to junctional complexes (Figure 1D, H) and increased circumferential actin belts but stress fibers were still present (Figure 1L).
To quantify changes to f-actin we measured pixel intensity using ImageJ (see methods). Lines of pixels spanning three junctions were sampled for pixel intensity. The mean ratio of the pixel intensity for phalloidin staining was determined at junctions and in-between junctions. The ratio of junctional to cytosolic pixel intensity was calculated and is shown in Figure 1M (see Methods and Figure S1). We observed that the mean junctional actin ratio in untreated EMCs was 2.53, reflecting a combination of stress fibers and circumferential actin belts in these cells. In TGFβ3 treated cultures, the mean junctional actin ratio was 1.98, reflecting an increase in stress fibers and a decrease in circumferential actin belts. In TGFβ3 + sVCAM-1 cultures, the mean junctional actin ratio was 4.36 reflecting a decrease in stress fibers and an increase in circumferential actin belts. This observation supported the idea that, in the presence of TGFβ3, sVCAM-1 alters pathways that affect both stress fibers and circumferential actin belts. In TGFβ3 + LY294002 cultures, the mean junctional actin ratio was 2.46, statistically identical to the untreated cultures. This supported the idea that, in the presence of TGFβ3, LY294002 alters pathways that primarily affect circumferential actin belts.
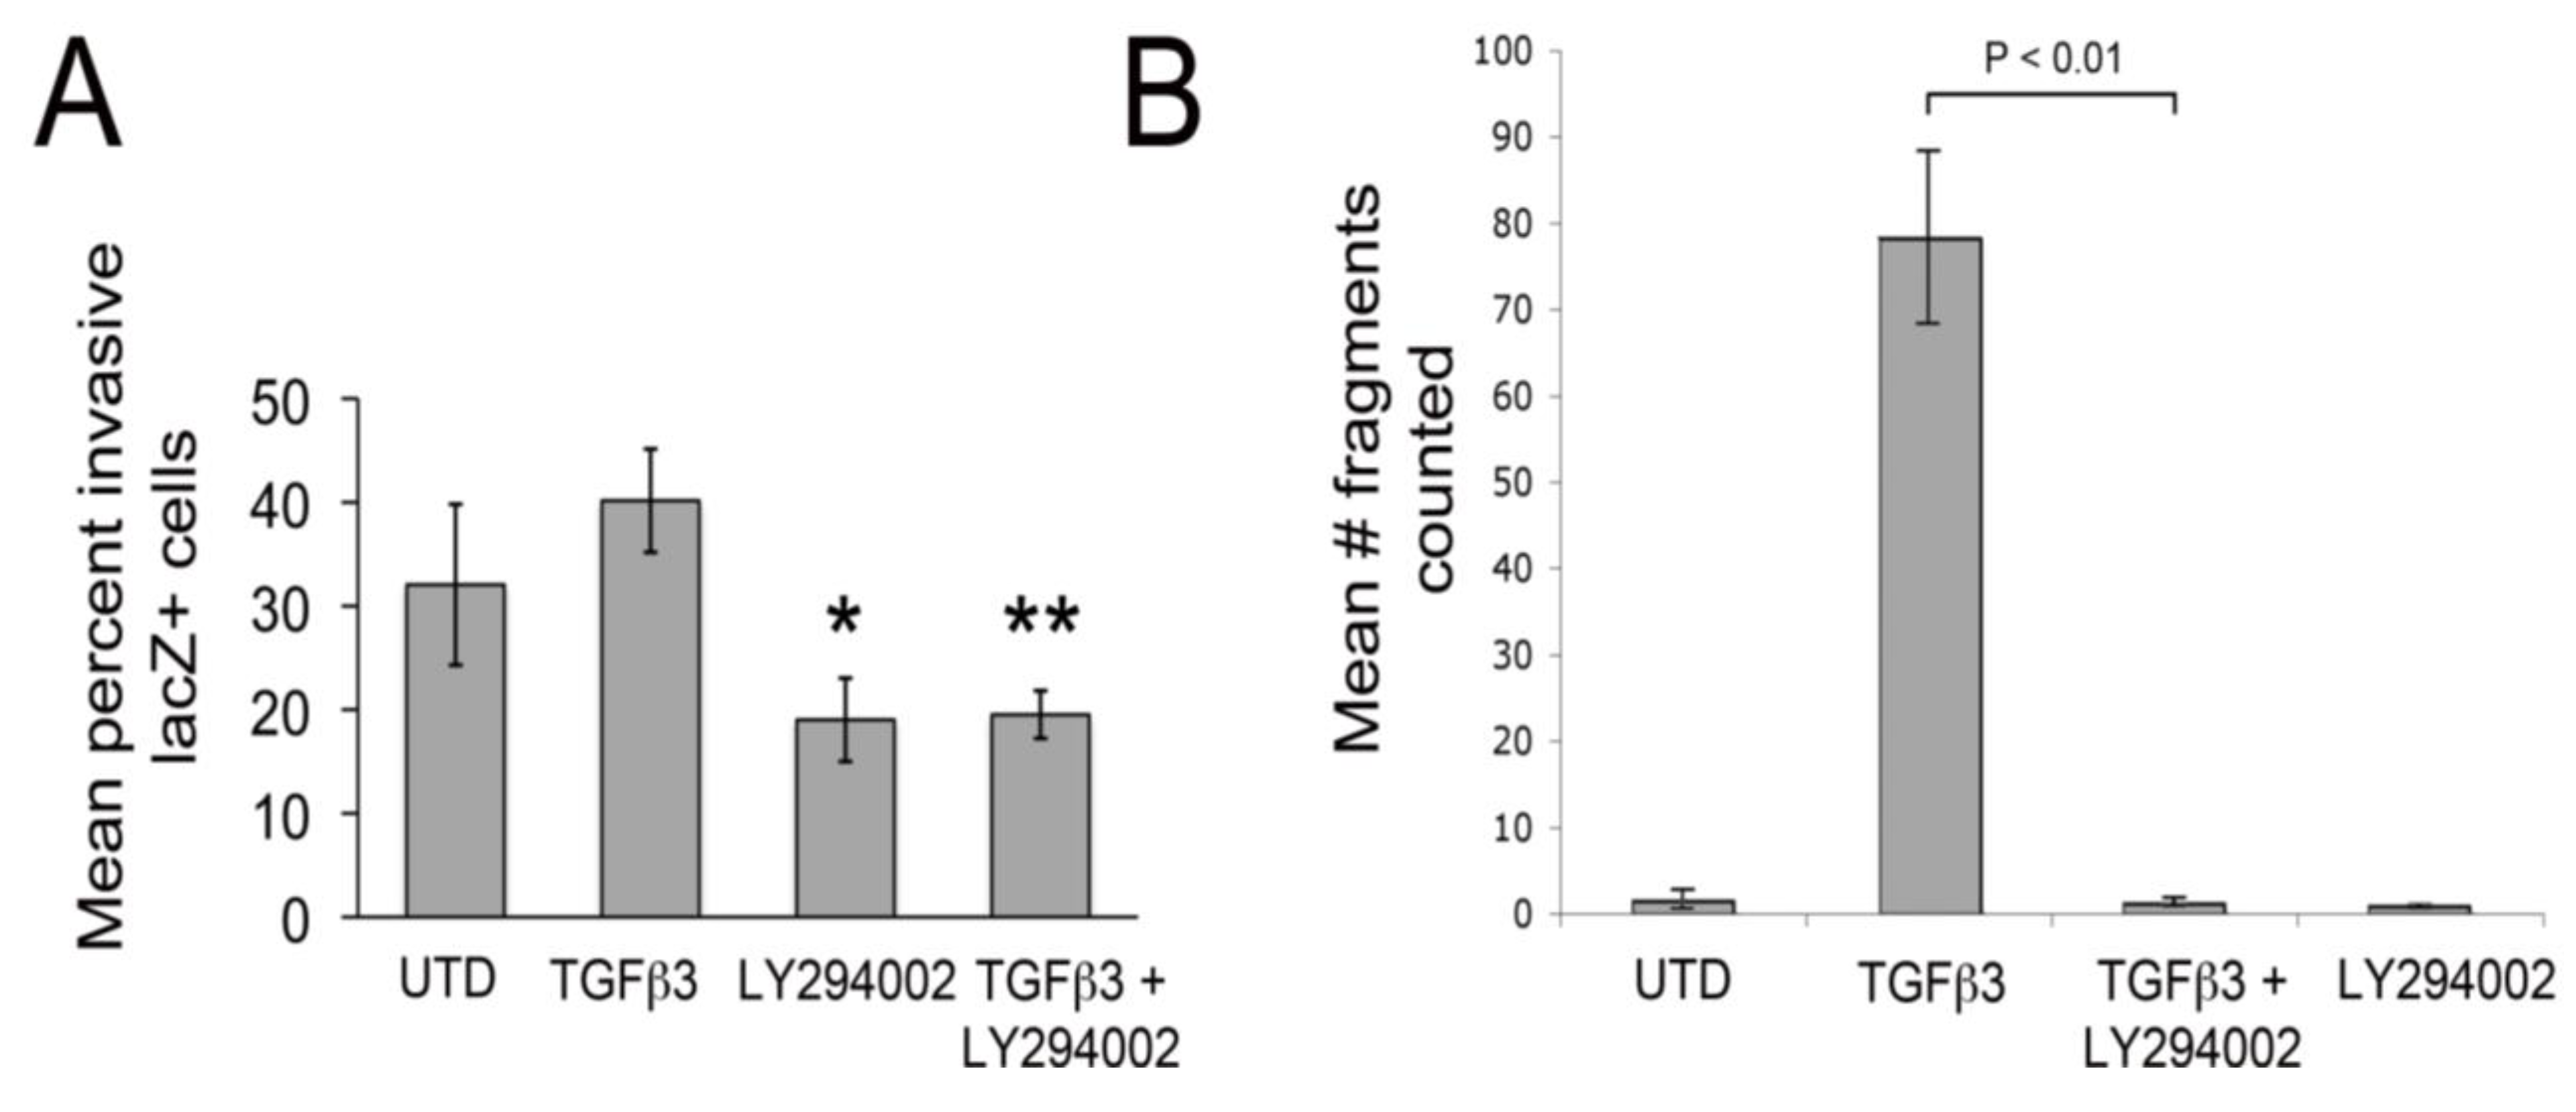
Since LY29002 appeared to protect junctional complexes in cultured chick EMCs treated with TGFβ3, we tested if LY29002 could inhibit epicardial EMT using an organ culture system. Here, embryonic hearts (HH27) were excised, infected with an adenovirus, which expresses a gene encoding nuclear targeted β-galactosidase. When hearts are infected in this manner, epicardium is infected but not underlying myocardial cells [11,12]. Hearts were washed with serum free medium and TGFβ3, LY294002 (or a combination) were added to the culture medium and hearts were cultured for 48 h. In these embryonic hearts, LY294002 significantly attenuated EMT, as detected by a decrease in TGFβ3-induced cellular invasion into the myocardium (Figure 2A). LY294002 also significantly decreased baseline invasion by about 1.7-fold. Together, these observations indicate that PI3K/Akt signaling plays an important role in facilitating epicardial EMT. To measure the strength of intercellular junctions we carried out dispase II assays [37] on rat epicardial mesothelial cell rEMCs) [12,32,33,34,35]. In this assay, monolayers are “lifted” from culture dishes (using Dispase II) without altering intercellular adhesion. Then, monolayers are agitated by shaking. If junctional contacts are weak, the monolayers fall apart and if they are strong, monolayers stay intact. Here, we found that TGFβ3 dramatically weakened intercellular junctions and this was almost completely inhibited by simultaneous treatment with LY294002 (Figure 2B). In a previous study, we made an identical observation using the dispase II assay in rEMCs treated with TGFβ3 and sVCAM-1 [12].
Figure 1. Activation of PI3K plays a role in TGFβ3 mediated cEMC shape changes and epicardial to mesenchymal transformation (EMT). (A-L) Confocal images of chicken embryonic EMCs cultured from HH24 hearts and left untreated (A, E, I), treated with TGFβ3 (B, F, J), TGFβ3 + sVCAM-1 (C, G, K) or TGFβ3 + LY294002 (D, H, L). Cells were fixed and stained for ZO1 (A-D), E-cadherin (E-H) or f-actin (I-L). All cells were stained with DAPI (blue) to identify nuclei. Arrows in (B) point to example regions where tight junctions have been degraded. Arrows in (L) point to example regions where stress fibers are readily apparent. Magnification bars are 20 µm. (M) Quantification of fluorescent pixel intensity across three junctions as described in the methods. Bar graph indicates the ratio of pixel intensity at junctions to pixel intensity between junctions. Error bars represent SEM with N = 6 for each treatment group.
Jdb 01 00159 g001
Figure 2. LY29004 inhibits epicardial EMT and weakening of junctional strength by TGFβ3. (A) Quantification of invasion of AdnlacZ infected surface cells in cultured HH27 chick hearts. Bars indicate percent of total cells counted that were in subepicardium or myocardium. * P < 0.05 for TGFβ3 (1 ng/ml) compared with LY294002 (10 µM) and ** P < 0.05 for TGFβ3 (1 ng/mL) + LY294002 (10 µM). Statistical significance was determined using ANOVA followed by a Newman-Keuls post-test. Error bars represent SEM with N = 4 for UTD, TGFβ3, LY294002 and N = 5 for TGFβ3 + LY294002. (B) Monolayer fragmentation after dispase II treatment of rEMC monolayers shown in bar graph format. Error bars represent SEM with N = 3 for each bar. Statistical significance was calculated using one-way ANOVA followed by a Tukey-Kramer Multiple Comparison Test.
Jdb 01 00159 g002
3.2. sVCAM-1 Modifies PTEN Phosphatase Localization and Activity
Since sVCAM-1 and LY294002 protected circumferential actin belts and inhibited epicardial EMT in the presence of TGFβ3, we reasoned that, like LY294002, sVCAM-1 may activate pathways in EMCs that counteract PI3K/Akt. One pathway that does this involves the dual specificity (lipid and protein) phosphatase PTEN. We therefore tested if PTEN could be altered by sVCAM-1 in rEMCs. PTEN is sequestered in the cytoplasm in a stable but catalytically inactive form [38,
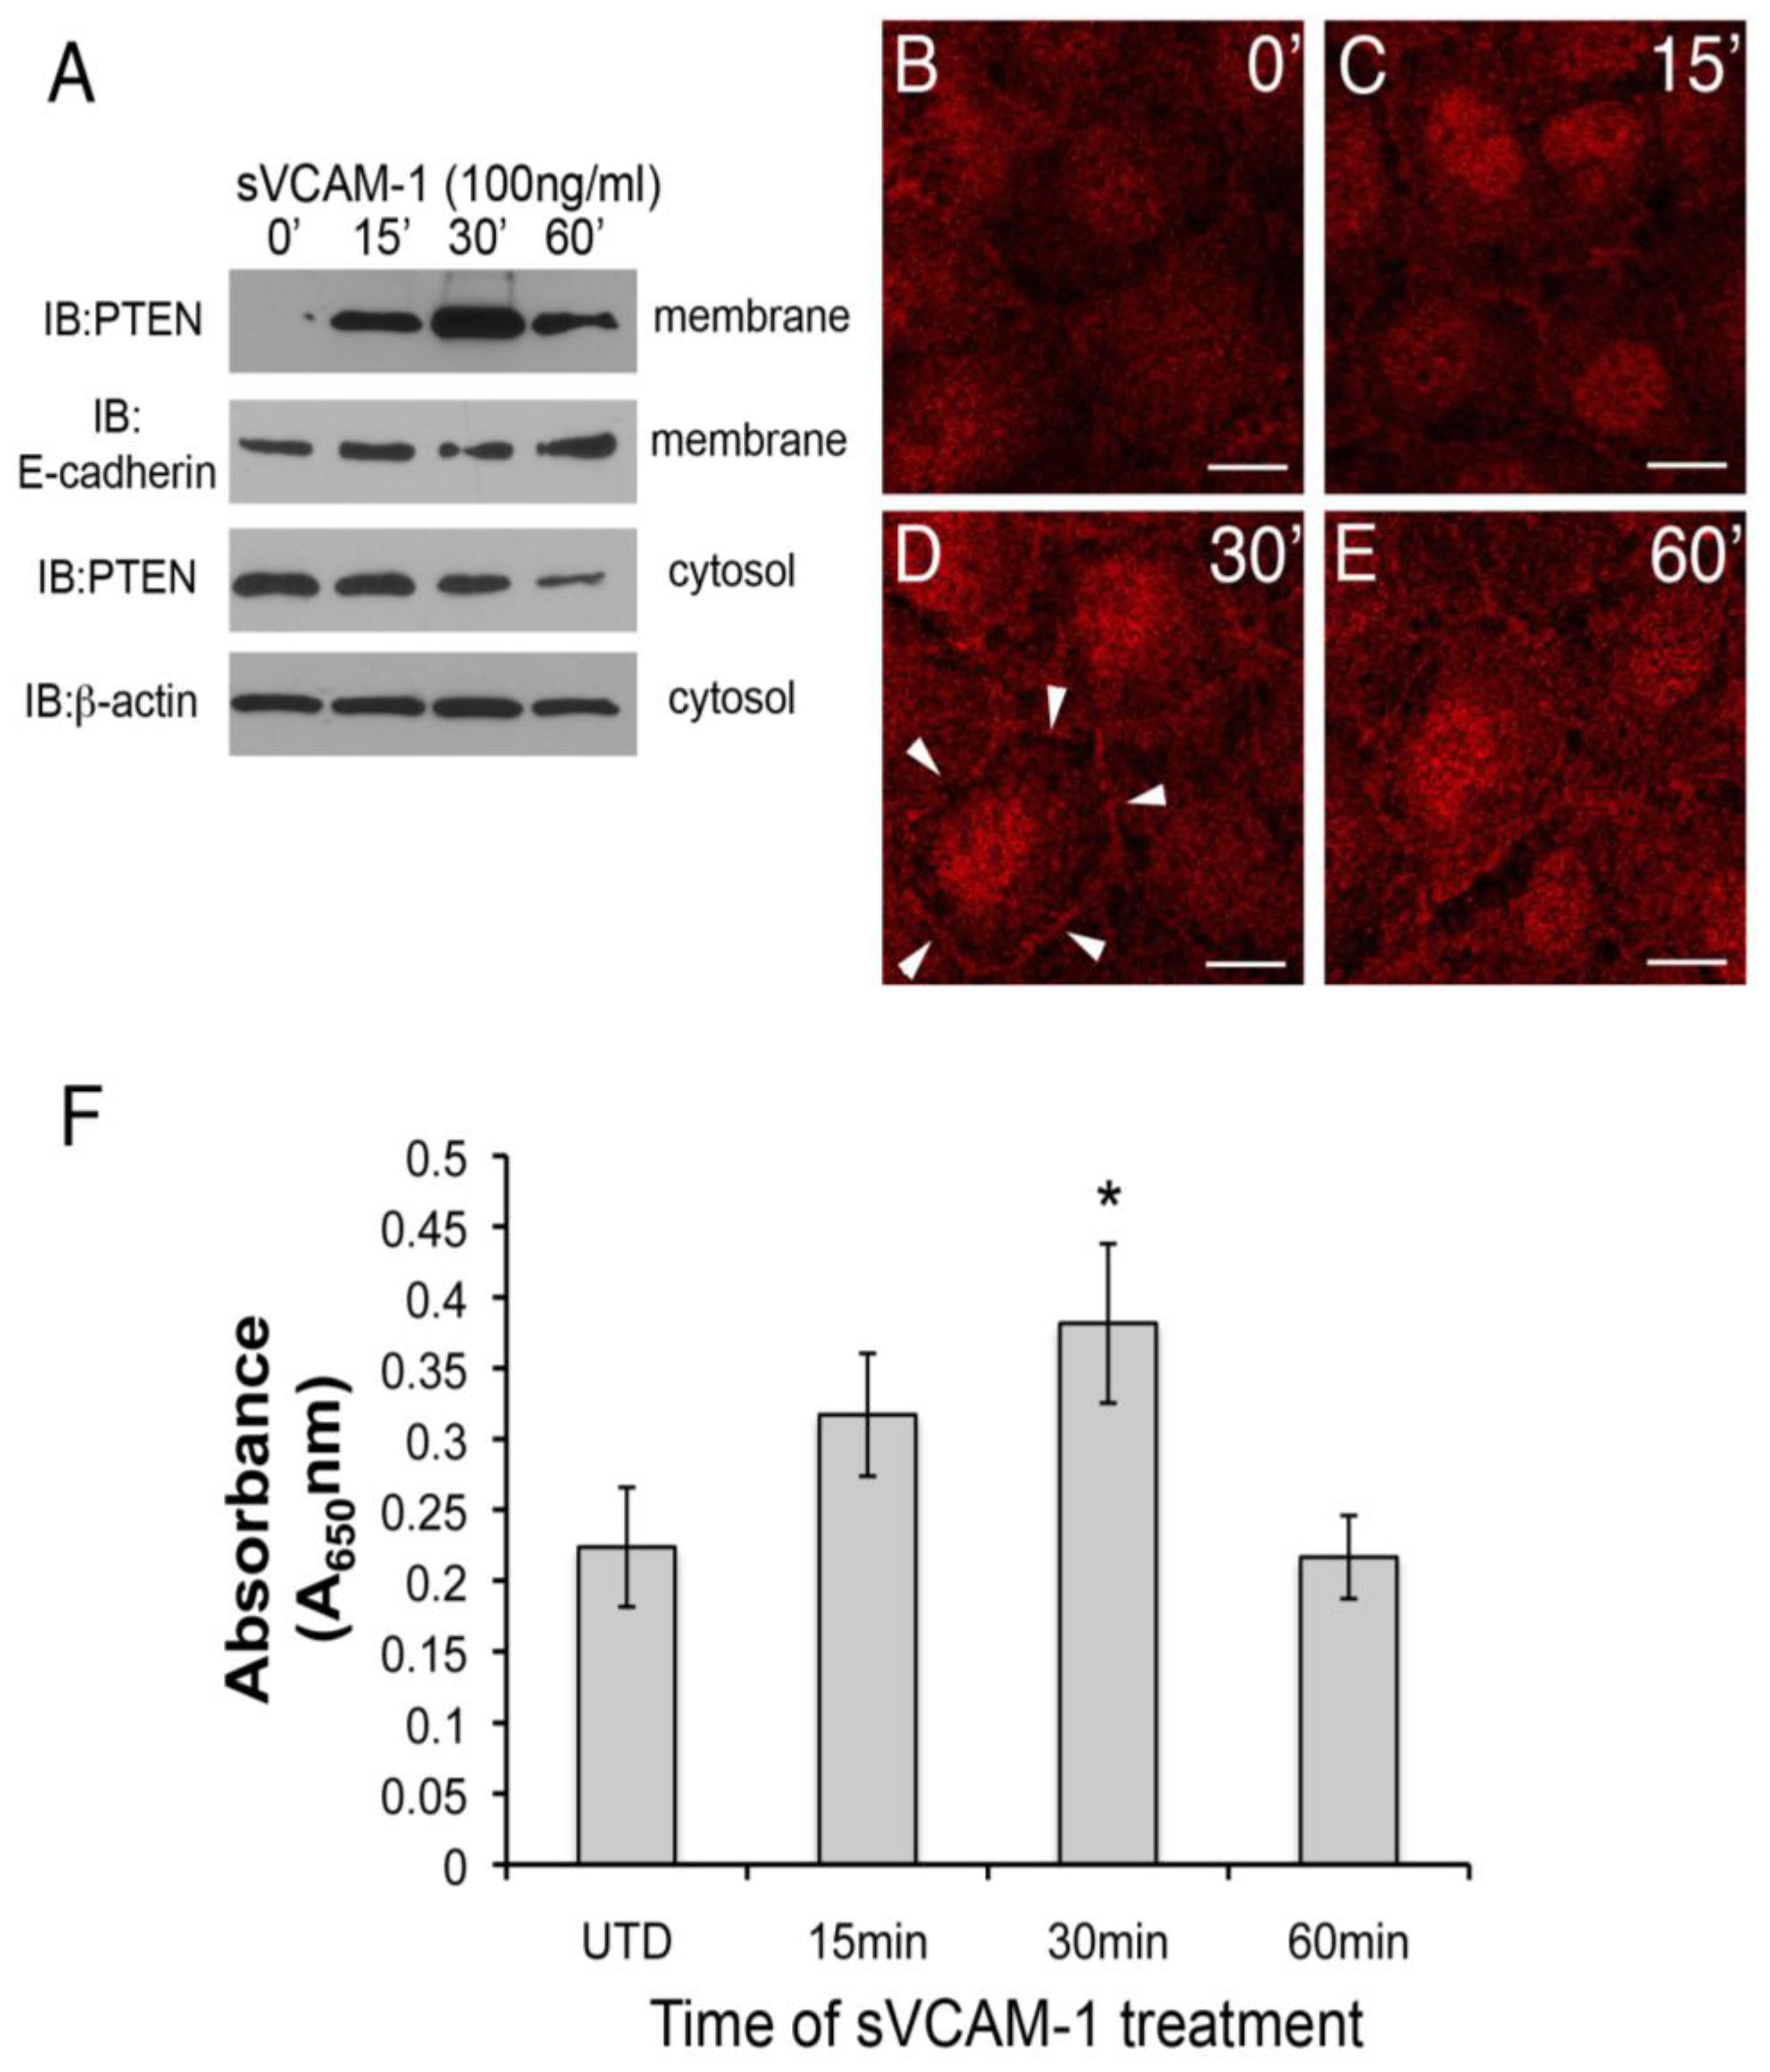
39]. When activated, it moves to the membrane and nucleus where its substrates exist. We therefore investigated if sVCAM-1 treatment of serum-starved rEMCs could alter the sub-cellular localization of PTEN using cell-fractionation. Here, we observed that PTEN could be detected in the membrane fraction of rEMCs 15 min after treatment with sVCAM-1. This accumulation was transient. After peaking at 30 min, PTEN was less abundant in the membrane band at 60 min (Figure 3A). In an independent experiment, we treated serum-starved rEMCs with sVCAM-1 and analyzed the cytosolic fractions for PTEN (Figure 3A, lower two blots). Here, we observed that PTEN protein was successively reduced in the cytosolic fraction after 1 h. Together these experiments suggest that sVCAM-1 activates signaling pathways that alter the sub-cellular localization of PTEN consistent with its activation. To further test this, we treated serum-starved rEMCs with sVCAM-1 for various times and fixed and stained them for PTEN (Figure 3B-E). Here, we observed general cytoplasmic staining in untreated cells (Figure 3B). After 15 min, staining was discernible in intercellular junctions and in nuclei (Figure 3C). The intensity of this localization was greatest at 30 min and then was reduced after 60 min correlating well with our cell fractionation studies. Thus, we conclude that in rEMCs, sVCAM-1 stimulation is sufficient to alter PTEN localization consistent with its activation.
Figure 3. sVCAM-1 alters PTEN localization and activity in rEMCs. (A) Immunoblot analysis of PTEN accumulation in untreated and sVCAM-1 treated, serum-starved rEMCs. Immunoblots were probed for PTEN, E-cadherin (membrane control) and β-actin (cytosolic control). Time of treatment with sVCAM-1 is indicated above each lane. Representative data is shown from two experiments done in triplicate. (B-E) Confocal images of PTEN localization in serum-starved rEMCs treated with sVCAM-1 for 0, 15, 30 and 60 min. Arrowheads in (D) point to junctional localization of PTEN at the 30 min time point. N = 2 in (B-E). Magnification bars represent 20 µm. (F) Lipid phosphatase activity in serum-starved rEMCs after sVCAM-1 treatment. The Y-axis indicates fold-lipid phosphatase activity relative to untreated, serum-starved rEMCs. The X-axis indicates time of treatment with sVCAM-1. Error bars represent SEM. Statistical significance relative to the 0 min time point (*, P < 0.05) was calculated using ANOVA followed by a Newman-Keuls post-test. N = 8 for all time points.
Jdb 01 00159 g003
To confirm that the activity of PTEN could be altered by sVCAM-1 in rEMCs, we performed lipid phosphatase assays. Cells were serum starved and treated with sVCAM-1 at 15 min intervals up to 1 h. PTEN was immunoprecipitated from total protein and incubated with phospholipid vesicles for various times. Phosphate released from the phospholipid vesicles was measured using the BioMol green reagent and absorbance determined at 650 nm. Here, we found that phospholipids were dephosphorylated in increasing amounts up to 30 min, with a statistically significant value at 30 min (Figure 3F). The timing of peak lipid phosphatase activity corresponded well with the timing of changes to the subcellular localization of PTEN that we observed. These findings supported our hypothesis that sVCAM-1 can alter PTEN localization and activity in epicardium, and suggested that PTEN plays an important role in epicardial cells.

3.3. Altering PTEN Function Can Change Epicardial EMT in Vitro

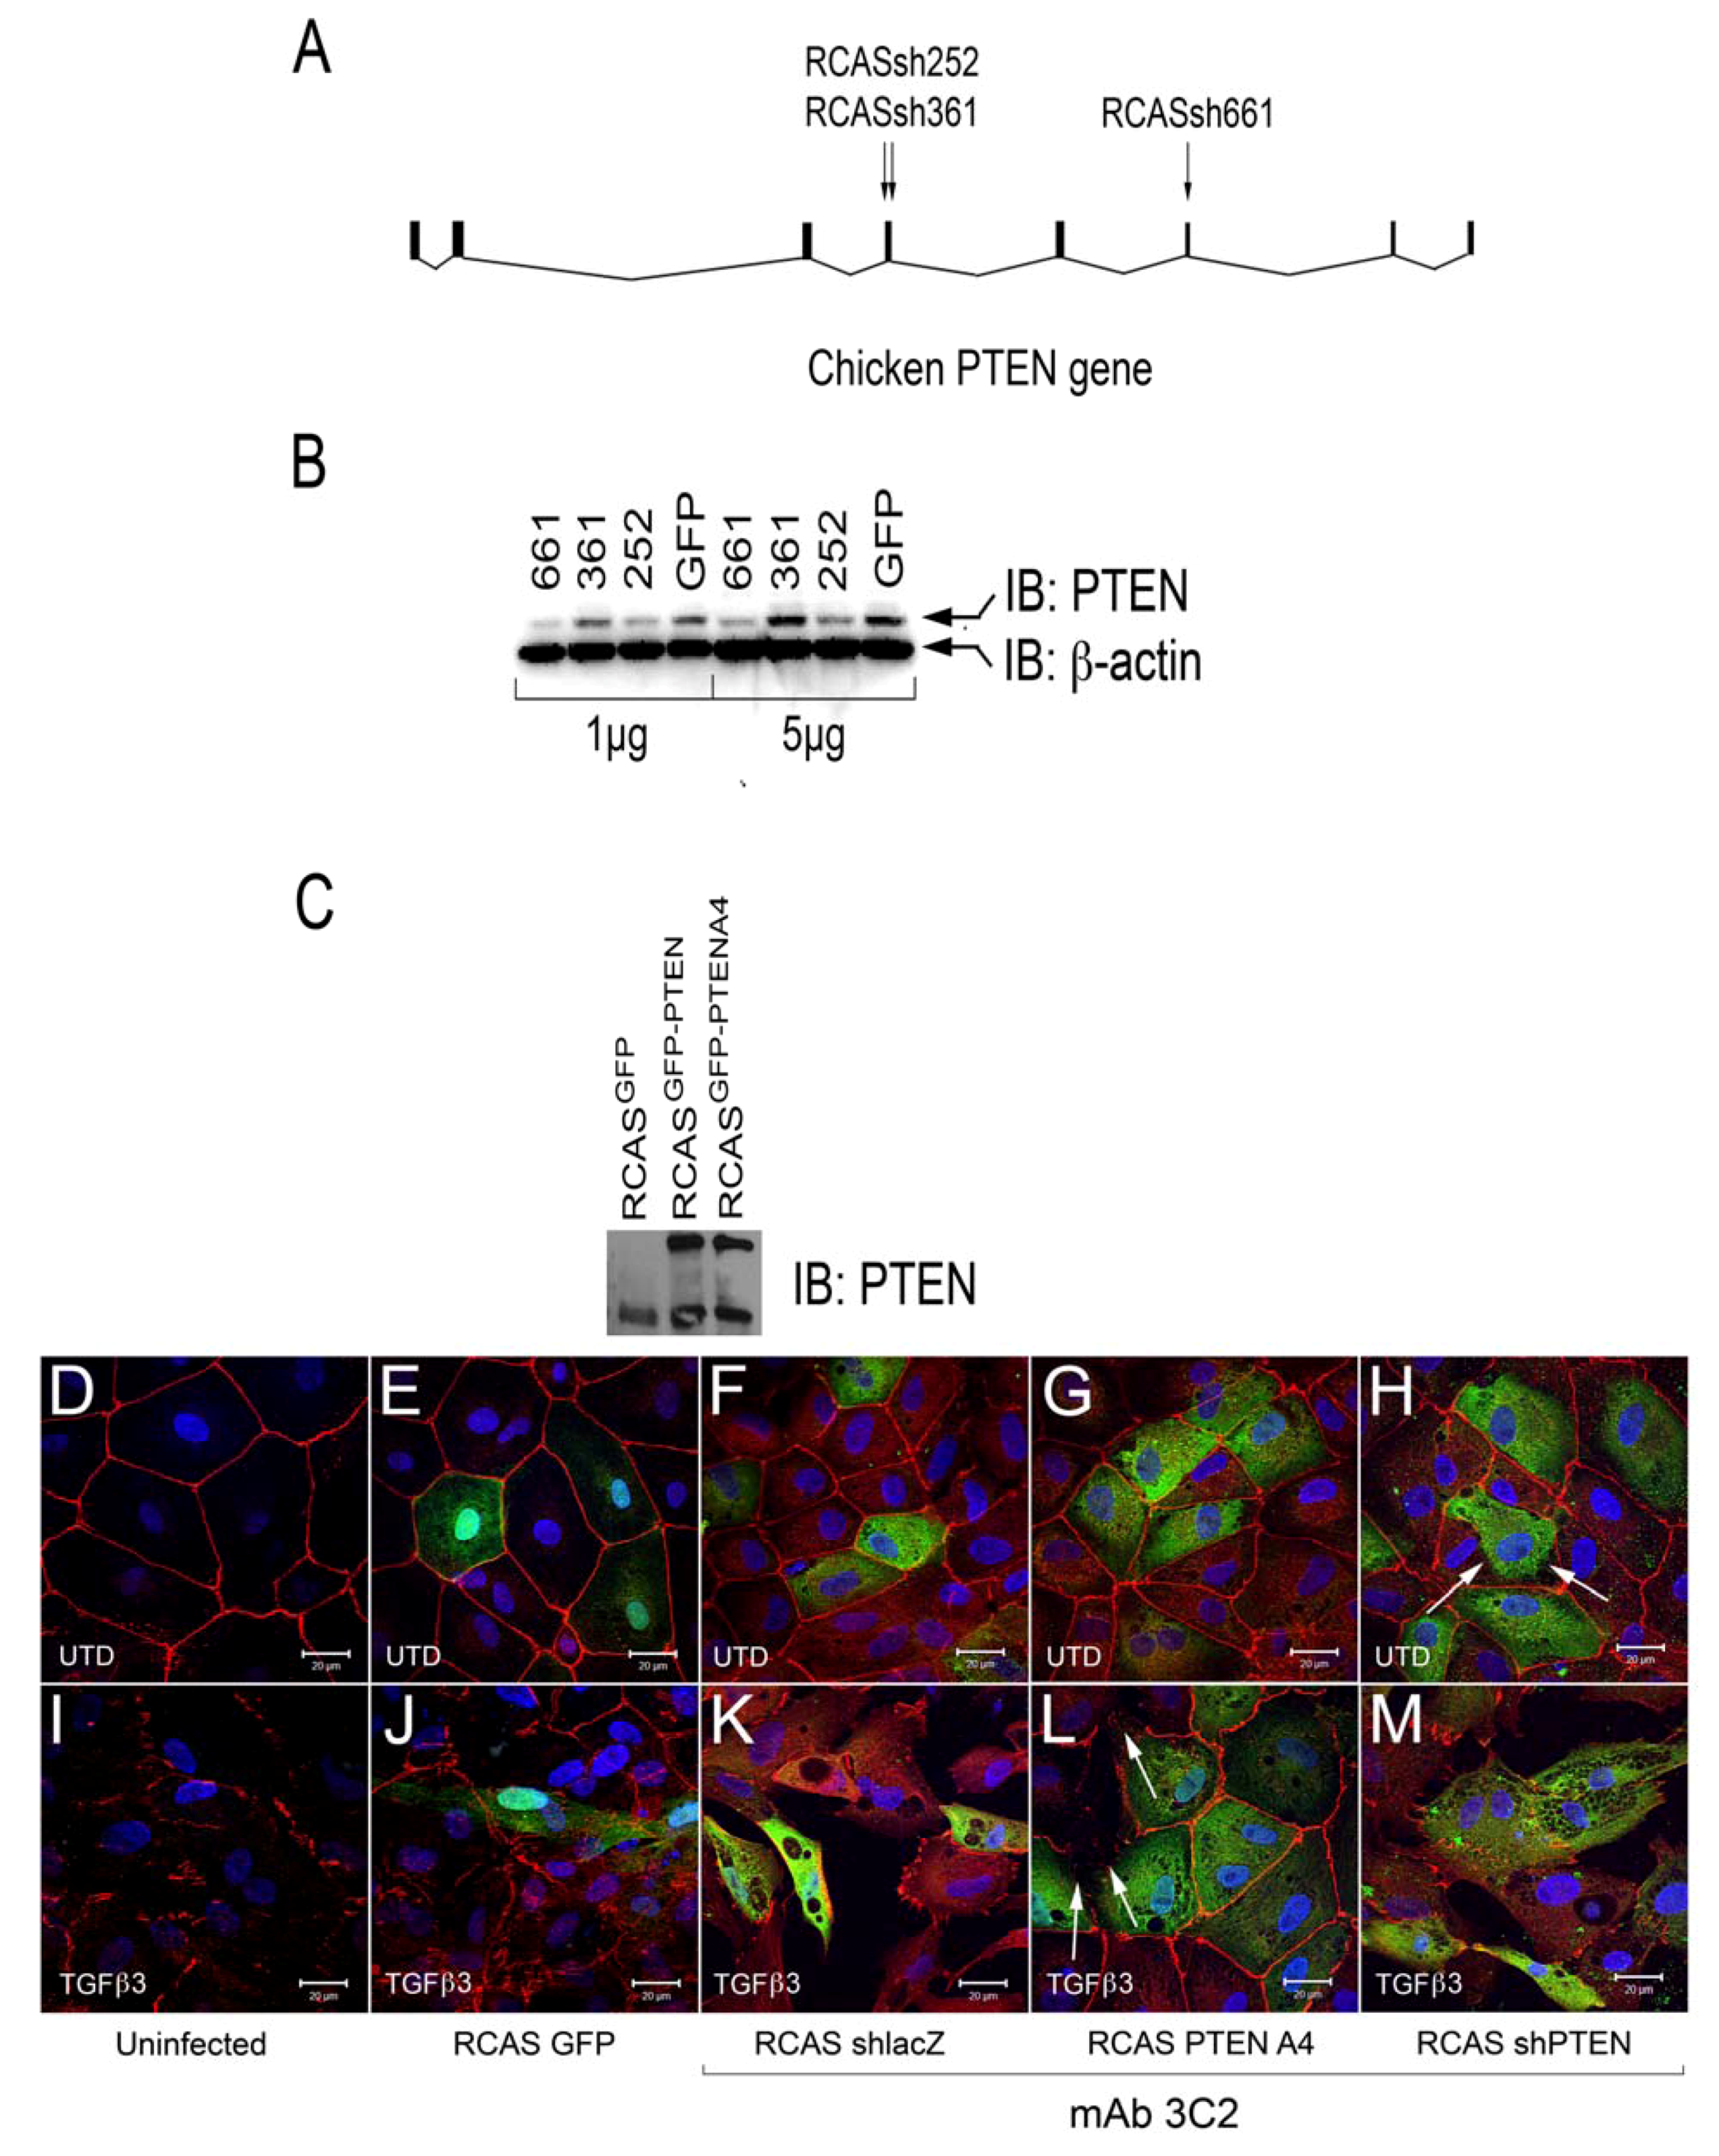
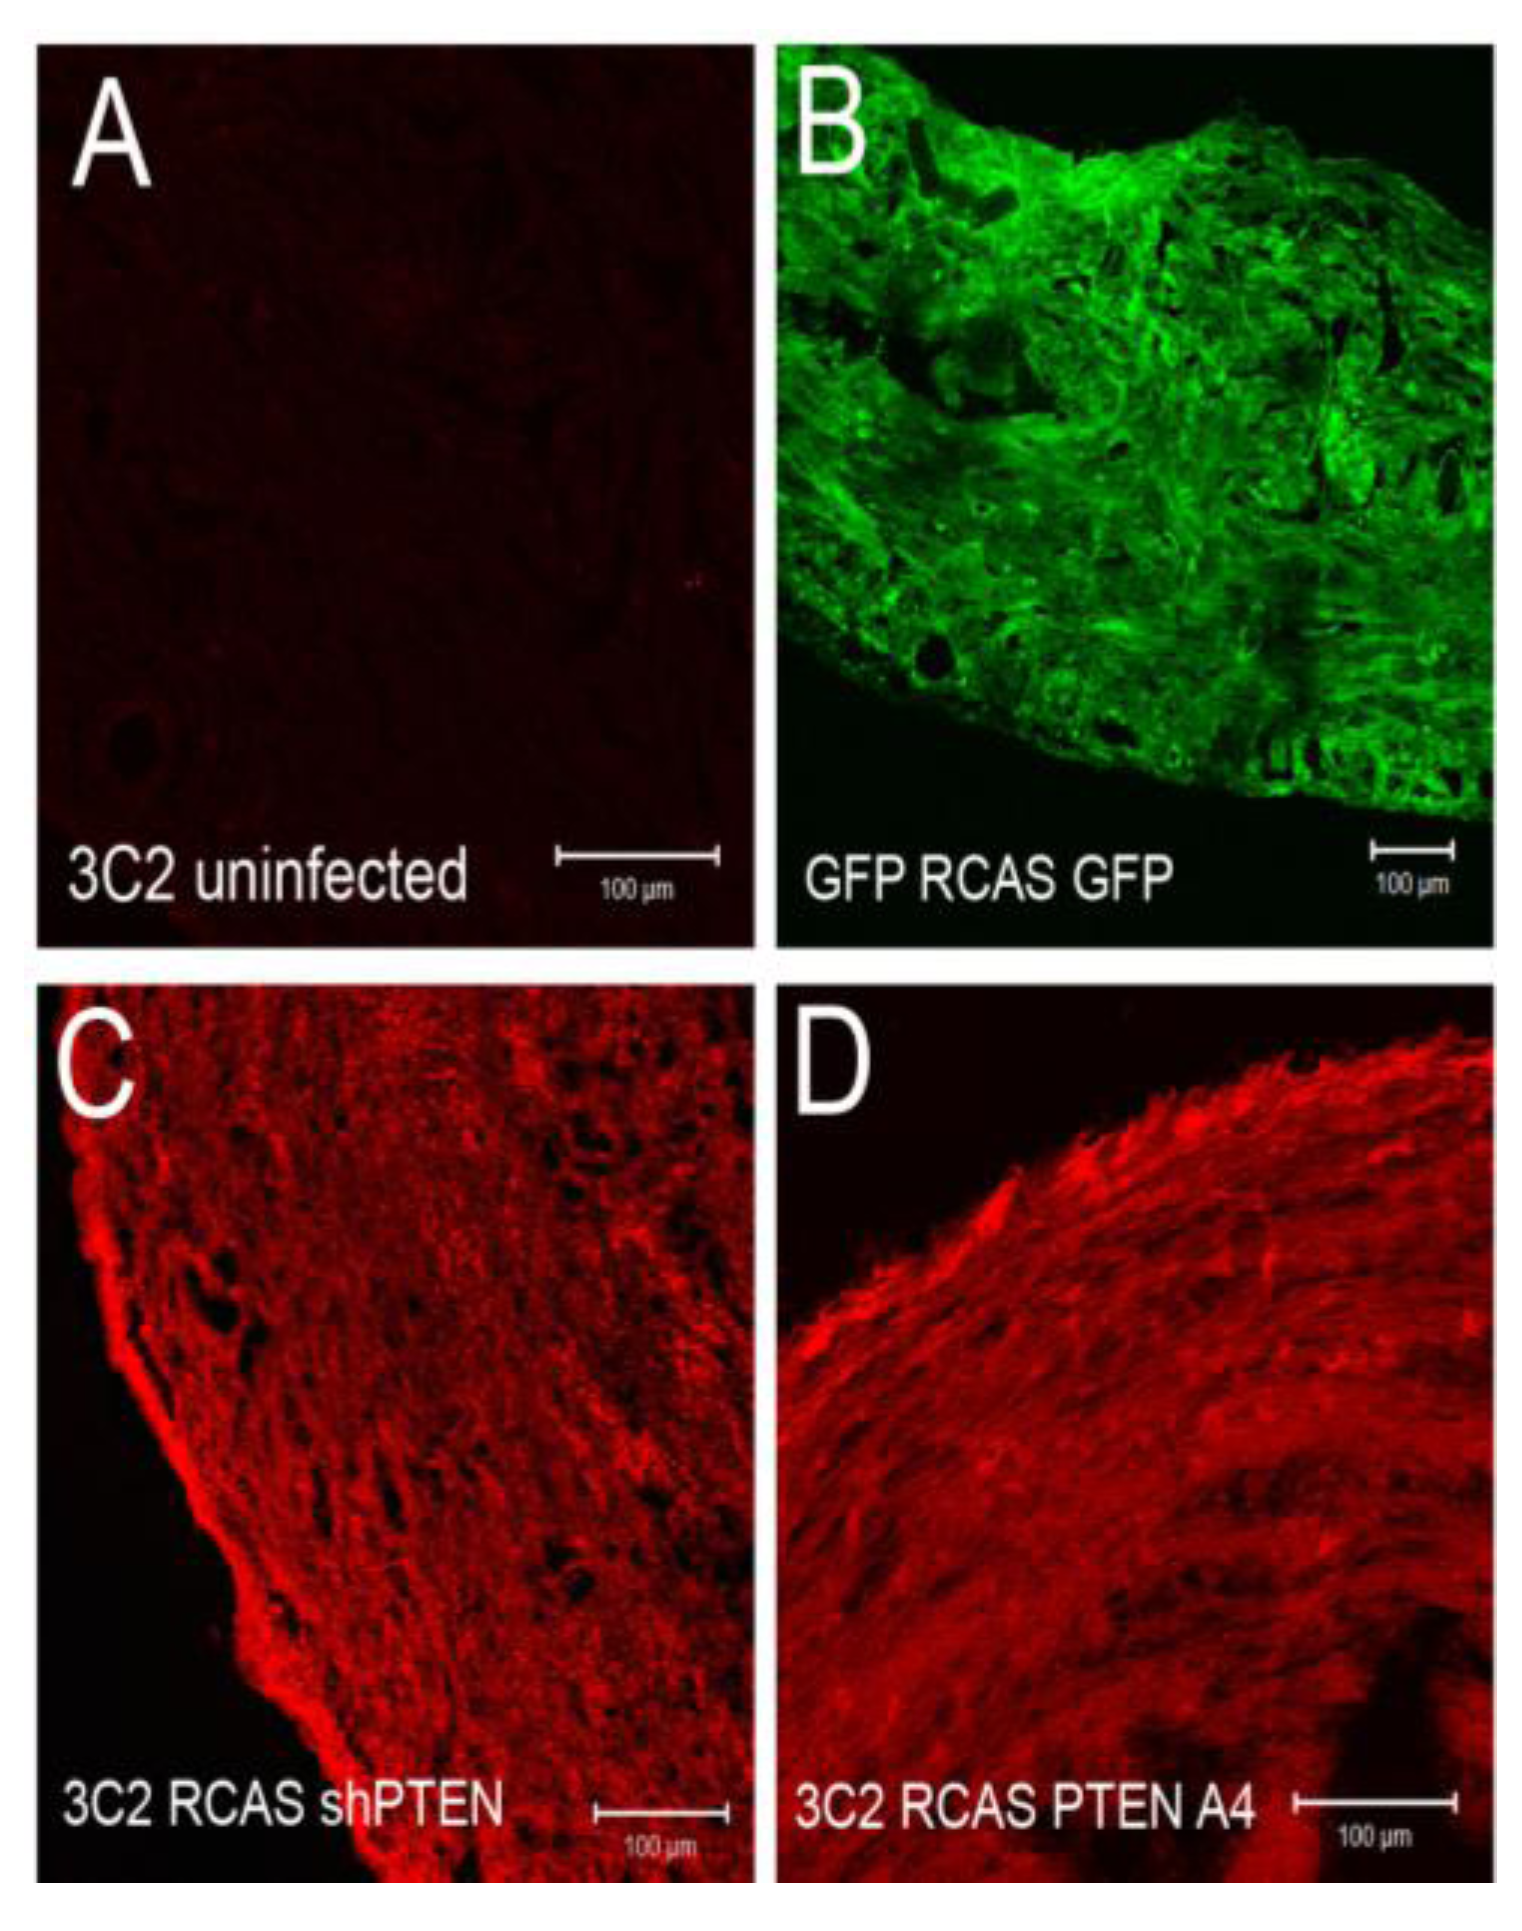
Our observations in rEMCs supported a model in which sVCAM-1 regulation of PTEN plays an important role in regulating epicardial EMT. Consistent with this model, activating PTEN should reduce epicardial EMT and loss of PTEN should promote EMT. To test this hypothesis, we created avian RCAS retroviruses that express either an active variant of human PTEN fused to GFP (called A4) [45] (RCASPTENA4-GFP) or express a short hairpin RNA to chick PTEN (RCASshPTEN) (Figure 4A,B). We also generated control viruses that express EGFP (RCASEGFP), and that express a shRNA to β-galactosidase (RCASshlacZ). Viruses were tested for their ability to knock down chick PTEN (Figure 4B) or express PTEN variants (Figure 4C).
We tested if infection by these viruses altered intercellular junctions either in untreated cells or in EMCs treated with TGFβ3. We infected chick EMCs grown on glass coverslips for 48 h in serum free medium. The medium was replaced with fresh serum free medium or medium containing TGFβ3 (1 ng/mL) and cells were incubated for an additional 24 h. Cells were fixed and stained with anti-ZO1 to label tight junctions and mAb 3C2 (which binds to viral GAG protein) to label RCAS infected cells. Cells were analyzed using confocal microscopy (Figure 4D-M). Infection by RCASGFP (Figure 4E), RCASshlacZ (Figure 4F), RCASPTENA4-GFP (Figure 4G), and RCASshPTEN (Figure 4H), did not result in widespread disruption of junctional complexes in EMCs. For RCASshPTEN infection, only a few infected cells lost contact with their neighbors (Figure 4H, arrows). This observation suggested that loss-of-function of PTEN is not sufficient to stimulate EMT and that additional stimuli are required. When infected EMCs were treated with TGFβ3, they became loosely organized with degrading junctional complexes (Figure 4I-K, M). The exception to this was when cells were infected with RCASPTENA4-GFP (Figure 4L). In this case, infected cells maintained their junctions, whereas neighboring uninfected cells had degraded junctions (Figure 4L, arrows). These observations indicated that loss-of-PTEN by RCASshRNA did not robustly induce loss of junctional complexes, but that expression of the active A4 variant was sufficient to interfere with the TGFβ3 dependent pathways that reduce intercellular adhesion during EMT.
Figure 4. Intercellular junctions in cEMCs are altered in response to changes in PTEN expression. (A) Representation of the structure of the chicken PTEN gene, which contains eight exons and seven introns. We designed three shRNA constucts called sh252, sh361 and sh661 representing the first position of the sequence in the shRNA relative to the sequence in the mRNA. (B) Constructs were tested in chick embryonic fibroblasts for their ability to reduce the PTEN protein product (N = 2). Blot was probed simultaneously with anti-PTEN and anti-beta actin. One or five micrograms of total protein were run for each lane. RCASsh661 reduced PTEN levels by about 80% (renamed RCASshPTEN). (C) Immunoblot of expression of RCASPTENA4-GFP and RCASPTEN-GFP. Bands: intrinsic chick PTEN (lower bands) and GFP-fusion proteins to human PTEN or the PTENA4 variant. RCASGFP infected cells were used as a negative control for the fusion protein. (D-M) Confocal images of chicken embryonic EMCs cultured from HH24 hearts and left untreated (D-H) or treated with TGFβ3 (I-M) for 24 h. Cells are either uninfected (D, I) or infected with RCAS viruses as indicated below each set of panels. Immunofluorescence for ZO-1 is red and nuclear staining with DAPI is blue in every panel. Green fluorescence in (E and J) is EGFP. Green fluorescence in (F-H and K-M) is immunofluorescent staining with mAb 3C2. 3C2 staining resulted in some speckling in these images as retroviruses are present in exocytic vesicles. Arrows in (H and L) point to cells that have disrupted tight junctions. N = 3 in (D-M). Magnification bars represent 20 µm.
Jdb 01 00159 g004
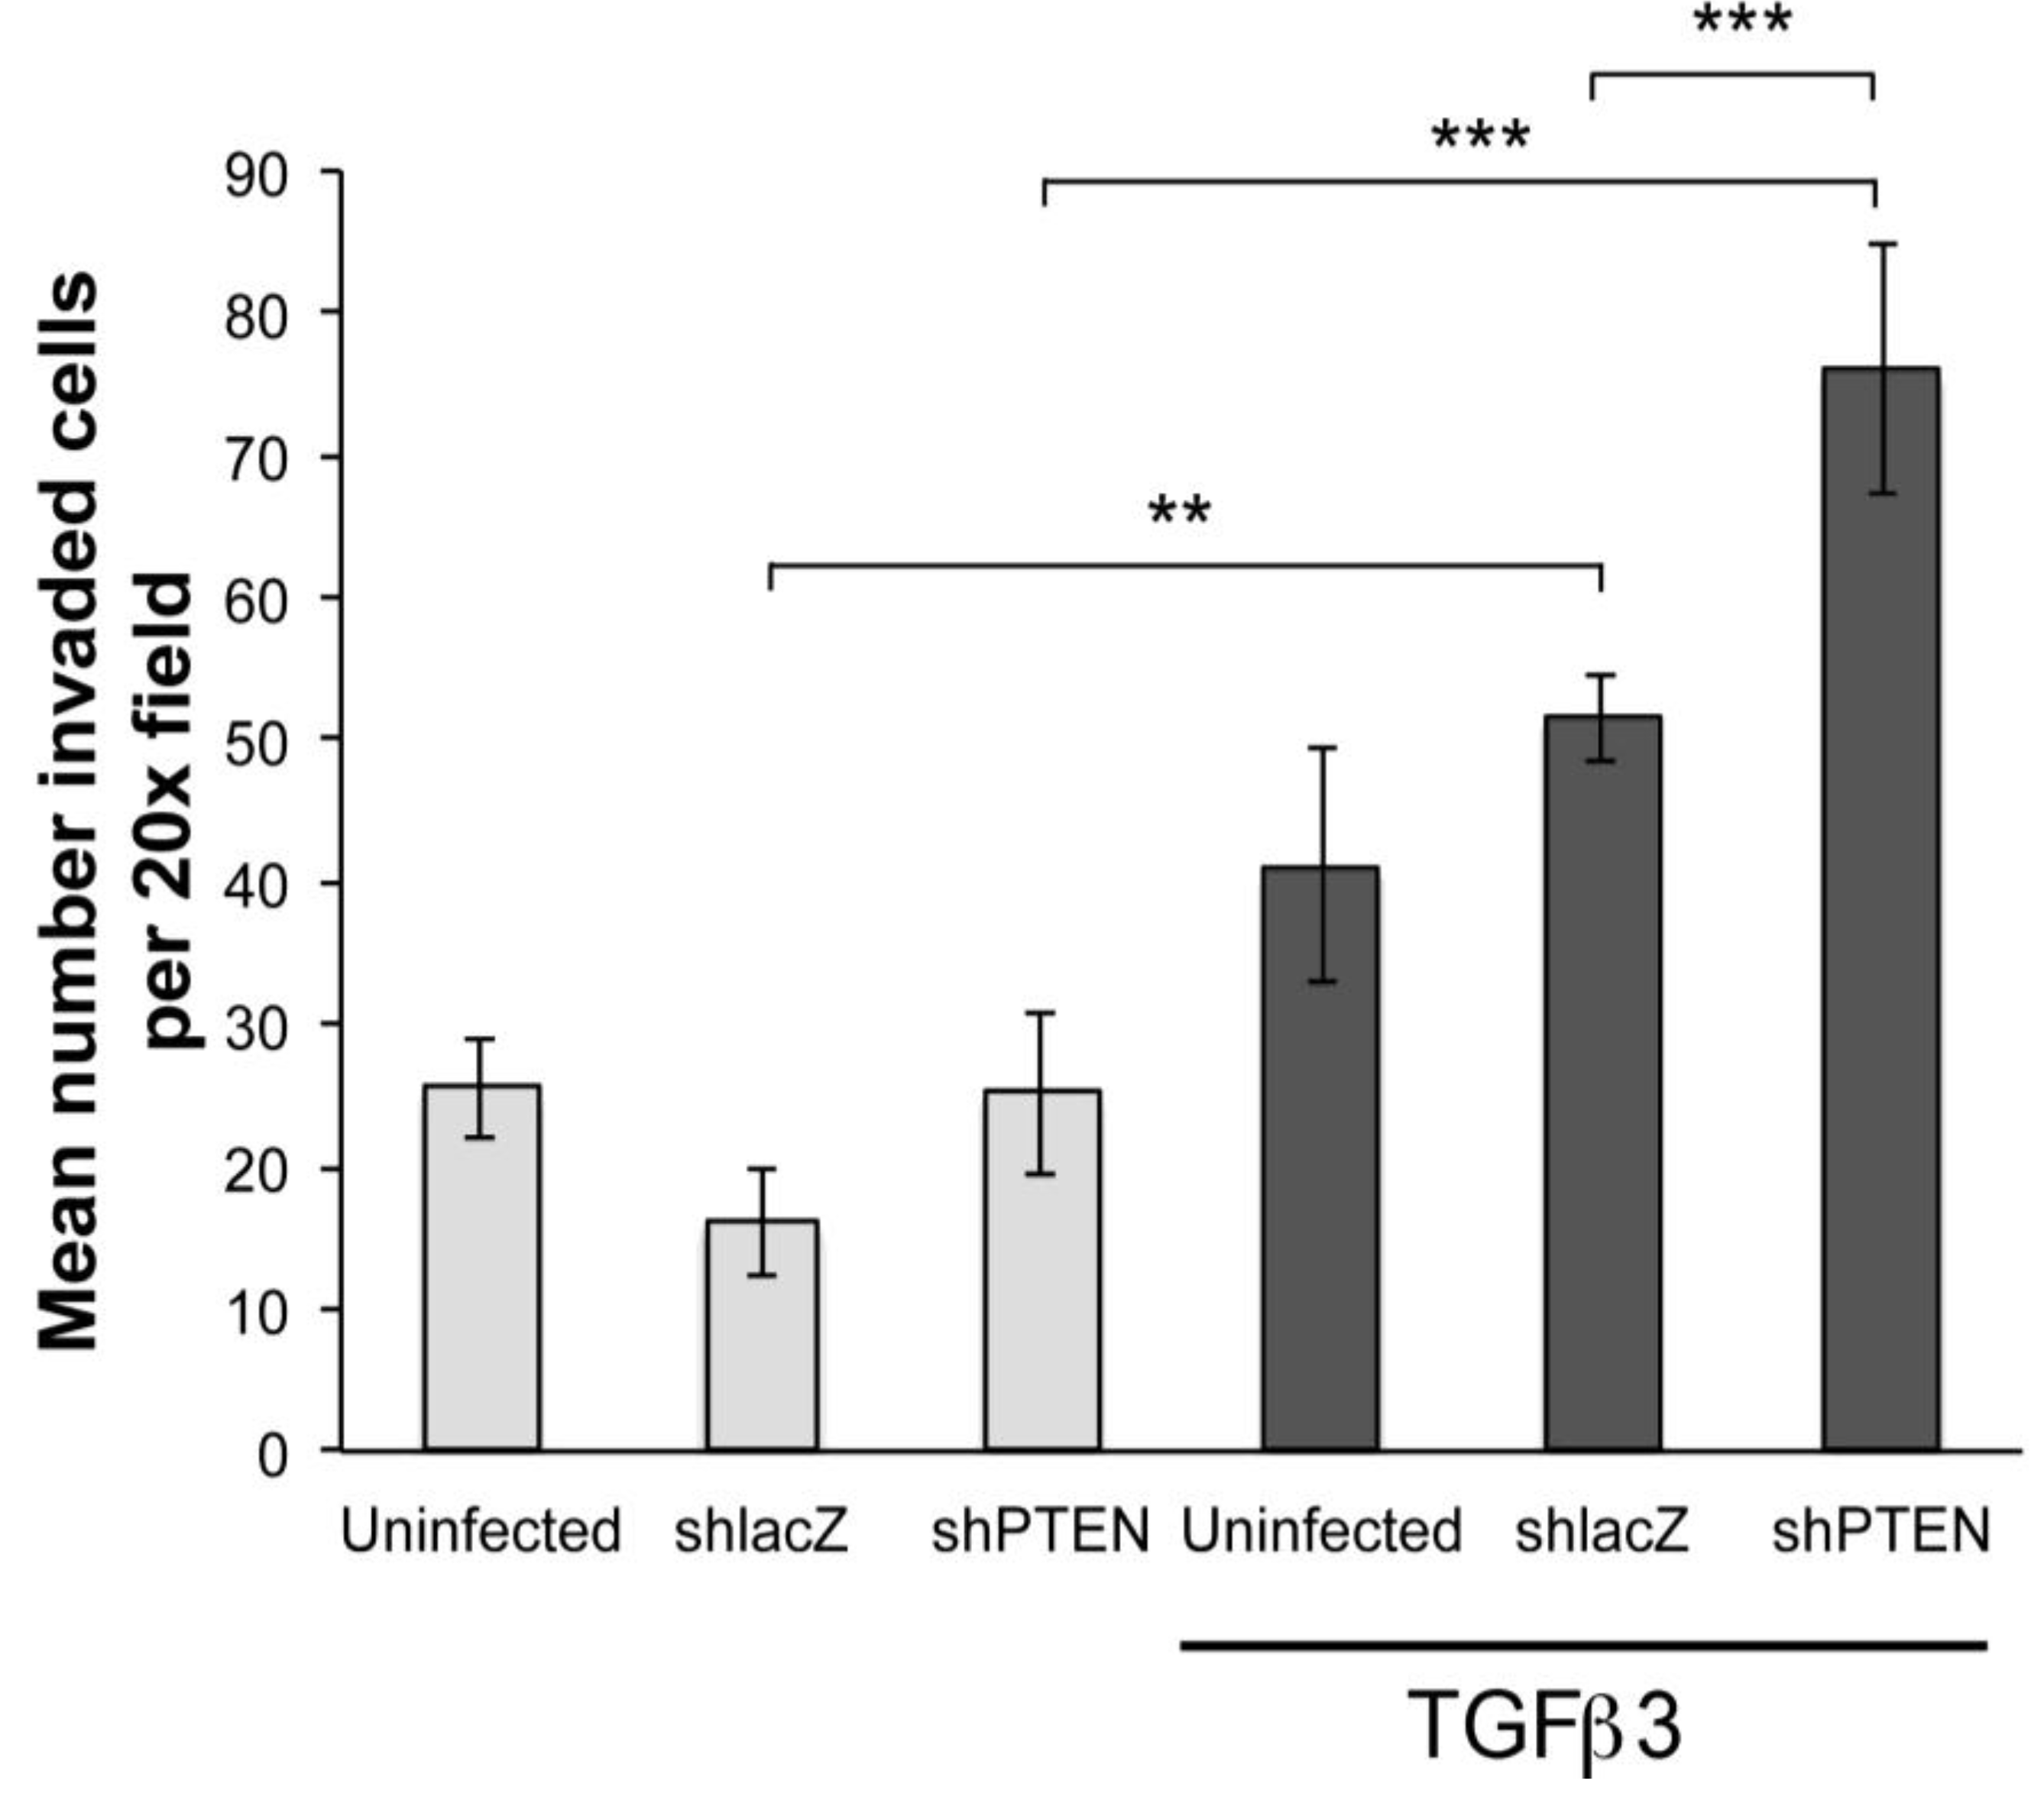
To further investigate if PTEN knockdown was sufficient to induce EMT we performed collagen gel assays. Hearts were infected with RCAS viruses at HH17 (E2.5) in ovo and embryos allowed to develop until HH24 (E4.5). Hearts were removed, explanted to the surface of drained collagen gels and epicardial cells were allowed to migrate to the surface. After 48 h, some gels were treated with TGFβ3 for 24 h. In this study, we made two observations (Figure 5). First, in monolayers not treated with TGFβ3, there were no significant differences between uninfected, RCASshlacZ infected and RCASshPTEN infected cultures (Figure 5, left three bars). However, in cultures treated with TGFβ3, there were three times as many cells inside the collagen when infected with RCASshPTEN as compared with untreated RCASshPTEN cultures (Figure 5, right-most bar). This observation supported the hypothesis that lowering PTEN levels in chick EMCs itself is not sufficient to induce EMT, but that reduced PTEN renders EMCs more susceptible to pro-invasion factors like TGFβ3. RCASshPTEN infected TGFβ3 treated cultures seeded about 1.8 times as many cells as uninfected TGFβ3 treated cultures, and about 1.5 times as many RCASshlacZ infected and TGFβ3 treated cultures. This indicated that knockdown of PTEN can increase the responsiveness of epicardial cells to EMT-stimulatory molecules such as TGFβ3.

3.4. Altering PTEN Function Changes Coronary Blood Vessel Development

Pro-invasive factors may not be present at physiologic levels in collagen gel assays, but are likely to be present in the developing heart. We therefore tested if infection with our RCAS viruses could alter coronary vascular development in chick embryos. Since RCAS viruses are replication competent, they spread throughout the infected embryo. So, infection of the heart is likely to be significant during the course of our experiment. This is what we observed in HH38 hearts using the mAb 3C2 (Figure S2). We injected virus into the pericardial space of HH17 embryos and allowed embryos to develop to HH38. Embryos were removed from eggs and a mixture of dilute India ink and saline was injected into the left ventricle to label coronary vessels. Hearts were sectioned and stained with anti-smooth muscle α-actin. Vessels were quantified in sections (see methods).
Figure 5. PTEN knockdown increases sensitivity of cEMCs to TGFβ3. Bar graph representing collagen gel invasion assay of cEMCs infected with RCAS viruses. Hearts were uninfected or infected with RCASshlacZ or RCASshPTEN in ovo at HH17 and explanted to the collagen gel at HH24. Lighter bars represent untreated and darker bars represent cultures treated with TGFβ3 (1 ng/mL) as indicated below the X-axis. The Y-axis represents the mean number of cells inside the collagen gel per 20x field. A minimum of four fields was counted for each sample. Statistical significance (** P < 0.01, *** P < 0.001) was calculated using ANOVA followed by a Newman-Keuls post test. Sample sizes are as follows: N = 14 for UTD; N = 15 for TGFβ3; N = 6 for RCASshlacZ; N = 6 for RCASshlacZ + TGFβ3; N = 9 for RCASshPTEN; N = 9 for RCASshPTEN + TGFβ3. Error bars are SEM.
Jdb 01 00159 g005
We initially observed that infection with RCAS viruses had varying effects on coronary vessel development. Although the differences between control RCAS viruses (RCASGFP and RCASshlacZ) were not statistically significant, the trend was either to increase muscularized vessels (RCASGFP) or decrease vessels (RCASshlacZ). Here, RCASGFP and RCASPTENA4-GFP expressed recombinant proteins and RCASshlacZ and RCASshPTEN expressed short hairpin RNAs, so the responses we observed might be due to the expression of gene products from each virus. Thus, the use of uninfected hearts as a control may not accurately reflect the effects of the experimental virus. By comparing infection of RCASGFP to RCAS
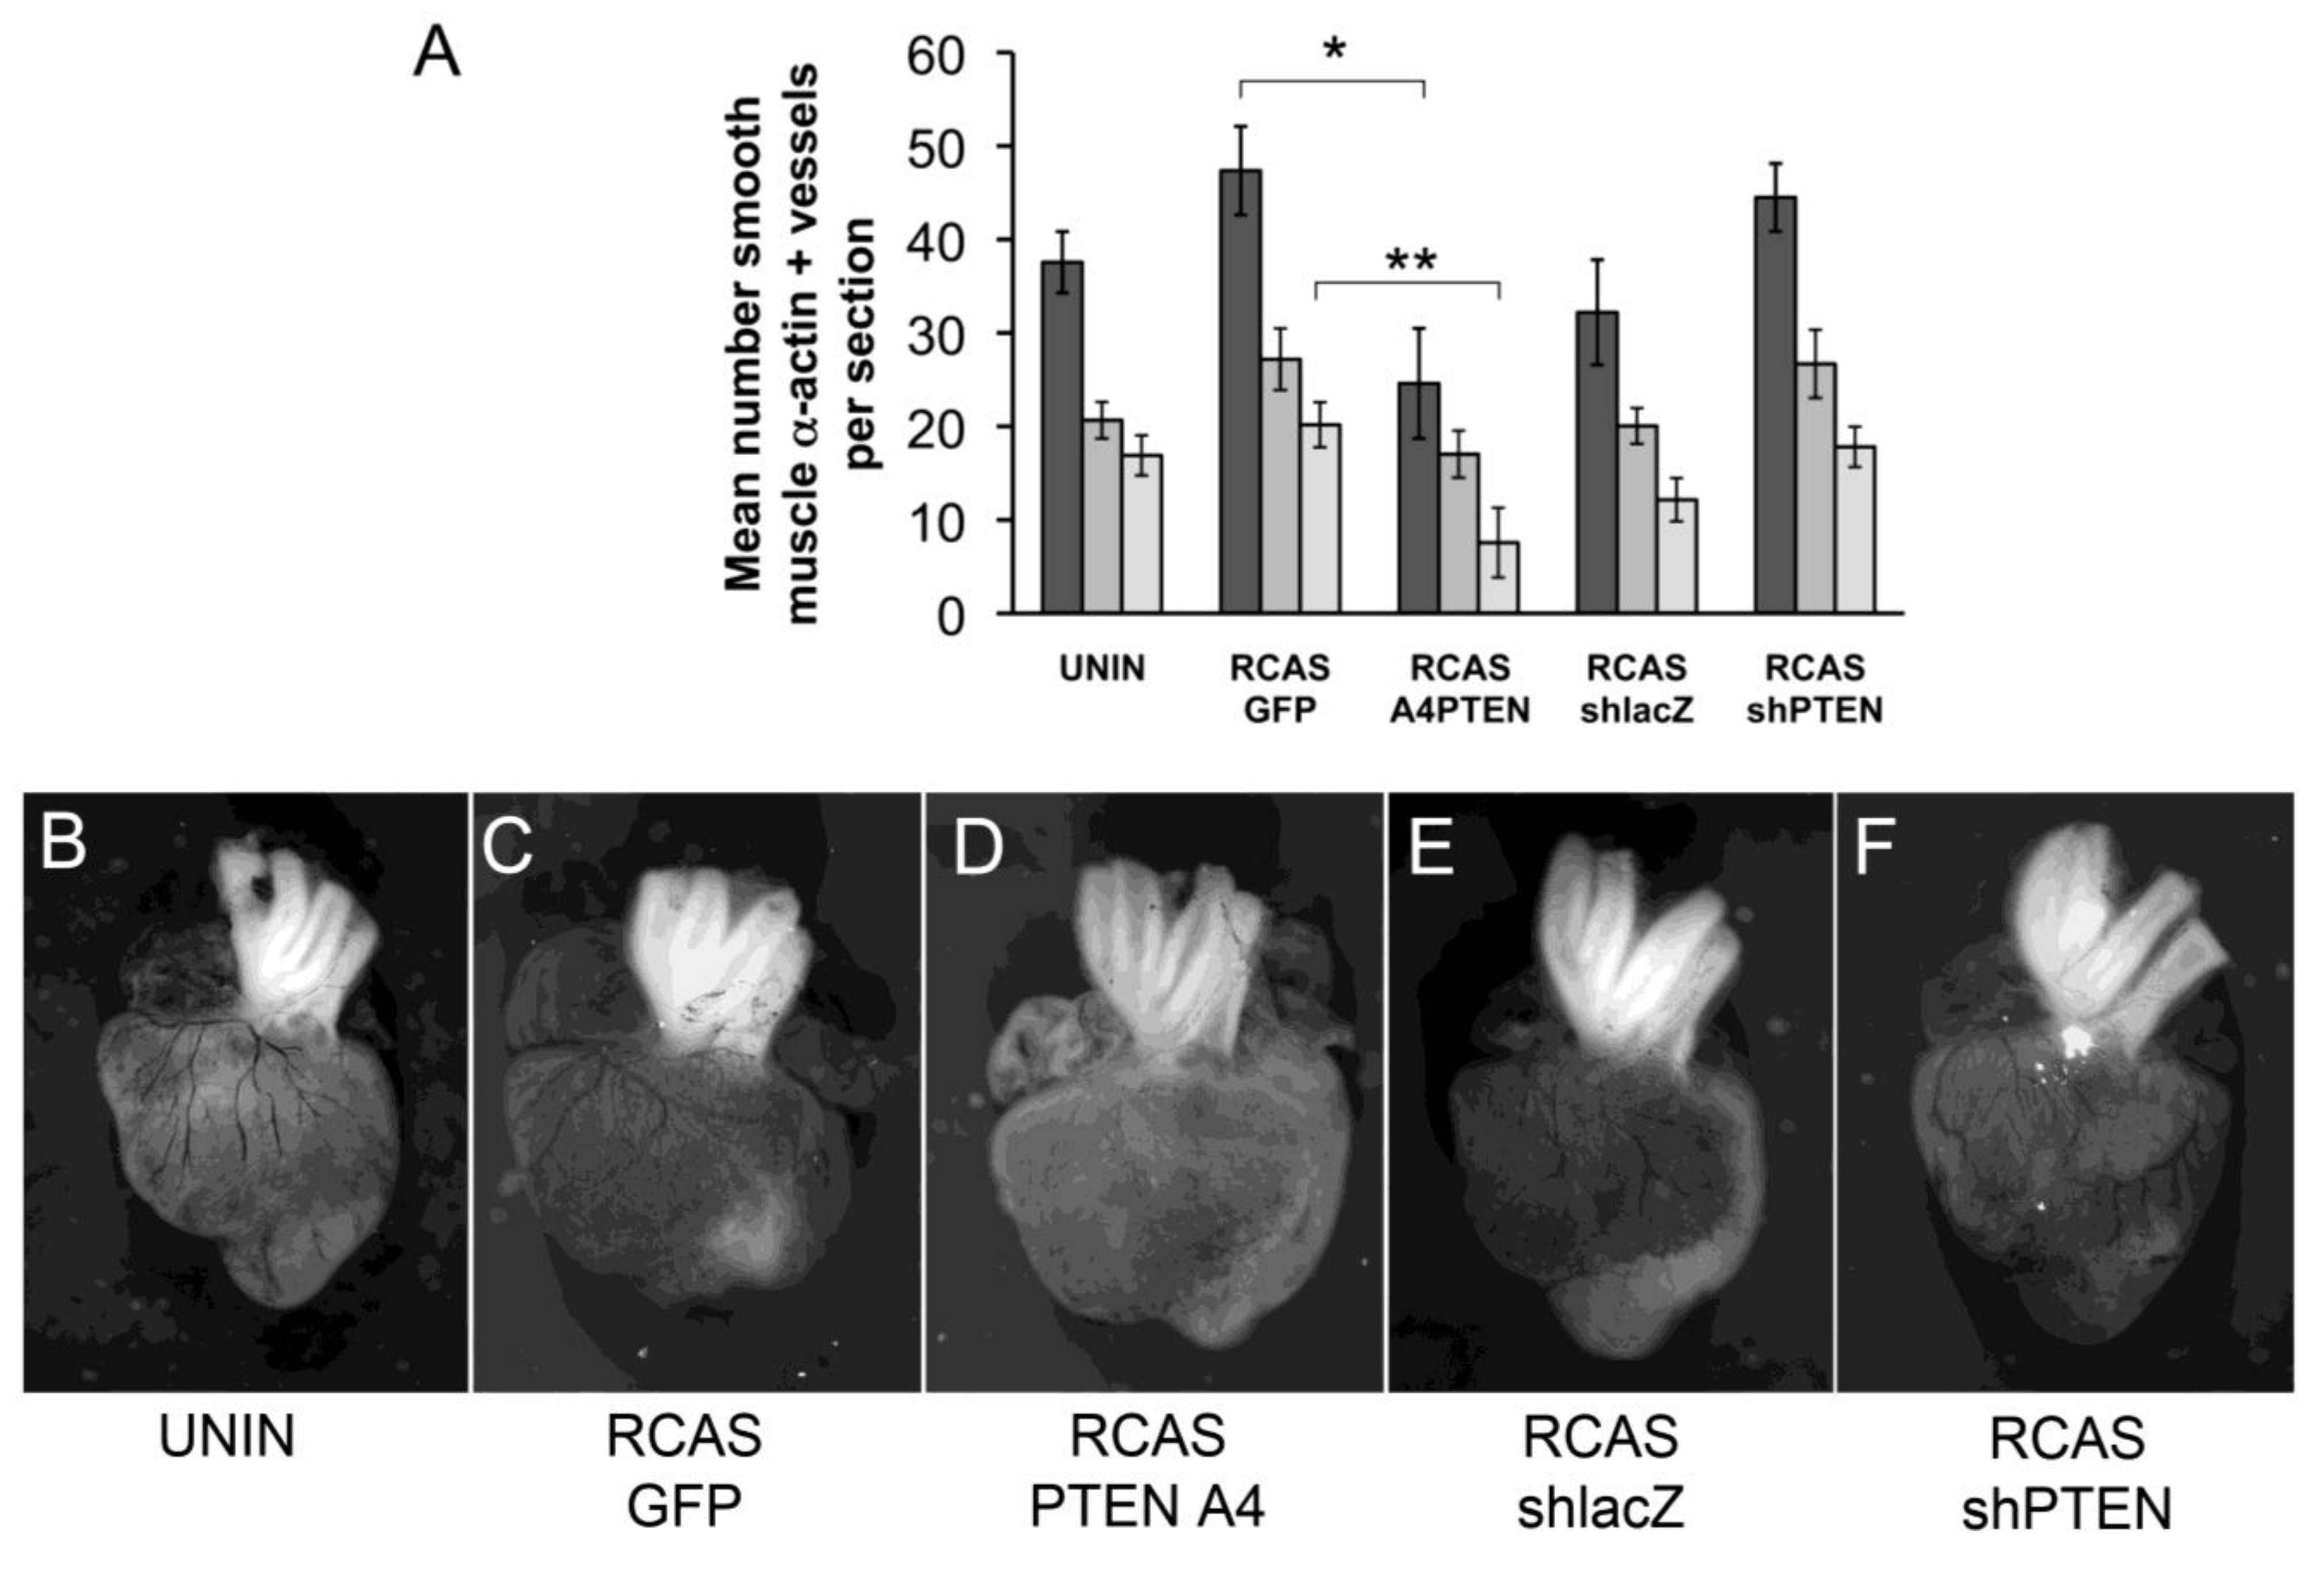
PTENA4-GFP, the effect of expression of PTENA4-GFP was to reduce the total number of muscularized coronary arteries by almost two-fold (from 47.4 per section to 24.6 per section) (Figure 6A,C,D). We wondered if there was a difference in the proportion of vessels in the subepicardial region of the lateral ventricles versus the interventricular septal region when comparing hearts infected with RCASGFP and RCASPTENA4-GFP. Here, we observed that the mean number of vessels in the subepicardium was less in RCASPTENA4-GFP infected hearts than in RCASGFP controls (from 27.1 to 17) (Figure 6A). Similarly, the number of interventricular septum (IVS) vessels was reduced from 20.2 per section to 7.6 per section. However, the proportion of vessels increased in the lateral ventricles in RCASPTENA4-GFP infected hearts by approximately 1.7 times. In other words, the vessels that formed in these hearts were about twice as likely to be in the lateral ventricles as in the IVS septum. This observation may reflect a requirement for regulation of PTEN activity during invasive migration such that cells expressing PTENA4-GFP do not migrate as far as they should into the myocardium.
Figure 6. Changes to coronary arteries in chick hearts infected with RCAS viruses. (A) Bar graph representing the number of coronary arteries in developing chick hearts stained with smooth muscle α-actin. Hearts were uninfected or infected with RCASGFP, RCASPTENA4-GFP, RCASshPTEN or RCASshlacZ in ovo at HH17 and allowed to develop until HH38. The Y-axis represents the mean number of smooth muscle α-actin positive vessels per section counted. Dark grey bars represent the total number of vessels counted. The medium grey bars are the number of vessels in the lateral ventricles. The light grey bars are the number of vessels in the interventricular septum. Statistical significance (*, P < 0.05, **, P < 0.01) was calculated using ANOVA followed by a Newman-Keuls post test. (B-F) Representative India ink injected hearts from this study. Hearts were infected with viruses as indicated below each panel. Sample sizes are as follows: N = 8 for uninfected; N = 9 for RCASGFP; N = 5 for RCASPTENA4-GFP; N = 6 for RCASshlacZ; N = 6 for RCASshPTEN. Error bars are SEM.
Jdb 01 00159 g006
PTEN knockdown by RCASshPTEN infection increased the total number of muscularized vessels, as well as subepicardial and IVS vessels (Figure 6A,E,F). However, this increase was not statistically significant. The ratio of vessels in the lateral ventricles to the IVS remained relatively constant with a ratio of 1.6 in RCASshacZ infected hearts and 1.5 in RCASshPTEN hearts. Thus, loss of PTEN may increase coronary artery development but does not seem to affect the sites of formation of these vessels.

3.5. What is the Significance of Activated PTEN in Epicardial Cells?

Our data support a role for a VCAM-1/α4β1/PTEN pathway in epicardial cells. What is the significance of activated PTEN in PE attachment, directional migration and EMT? Since PTEN catalyzes the dephosphorylation of PIP3 to PIP2, it increases the membrane concentration of PIP2 in the plasma membrane. It should be noted here that dephosphorylation of PIP3 specifically creates the phosphoinositol (4,5) bisphosphate second messenger, a lipid second messenger that differs from phosphoinositol (3,4) bisphosphate and phosphoinositol (3,5) bisphosphate in its ability to modulate critical events in the cell membrane. One example is that increased PIP2 promotes localized actin polymerization. PIP2 is thought to regulate actin polymerization at many levels, including by binding proteins that sever f-actin and proteins that promote actin polymerization, branching and bundling [40,41]. Thus, treatment of serum starved EMCs with sVCAM-1 promotes increased circumferential actin belts as we have observed, likely due to increased interaction of PIP2 with proteins that promote junctional actin polymerization.
A second effect of activated PTEN is the inhibition of the PI3K/AKT signaling pathway. This would have different effects than increasing membrane PIP2 as the PI3K/AKT pathway alters many downstream events such as cell proliferation, migration and differentiation. Activation of Akt is postulated to impact other pathways already implicated in epicardial development [24,42]. For example, Akt is an inhibitor of the Ser/Thr kinase GSK3β, a component of the Wnt/β-catenin destruction complex, which also includes the tumor suppressors Axin and adenomatous polyposis coli (APC), as well as CK1, protein phosphatase 2A (PP2A), and the E3-ubiquitin ligase β-TrCP. In canonical Wnt signaling, the Wnt/β-catenin destruction complex actively traffics cytoplasmic β-catenin to the proteasome, unless it is inhibited via another pathway (reviewed in [43]). Activated Akt phosphorylates GSK3β at Ser-9, and similarly, targets it to the proteasome, and in this way amplifies the signal produced by Wnt ligands [44,45,46]. Wnt signaling has been implicated in epicardial development in a pathway involving WT1, retinoic acid (RA), fibroblast growth factor and Wnts [47,48]. WT1 is expressed in the PE and migrating mesothelium and it participates in the transcriptional activation of the gene encoding retinaldehyde dehydrogenase-2 (RALDH2). RALDH2 catalyzes the conversion of retinaldehyde to RA. RA, through one of its receptors—RxRα, activates expression of epicardial FGFs and Wnts. Conditional loss of epicardial RxRα in the mouse altered epicardial development as well as epicardial expression of FGF2 (basic FGF), β-catenin, and Wnt9b [48]. Loss of RxRα specifically interfered with Wnt9b expression since the epicardial expression of Wnt2a, Wnt8a, and Wnt8b were not affected [48]. Interestingly, loss of β-catenin in RxRα conditonal knockout mice was due to increased instability of the protein and this effect was blocked by inhibiting GSK3β. Thus, signals derived from RxRα promote canonical Wnt signaling by antagonizing the β-catenin destruction complex and by activating Wnt9b synthesis. It is not known if Wnt9b activates PI3K, but it is known that Wnt3a can activate PI3K [49,50]. Active PTEN in the epicardium therefore could attenuate/balance PI3K/Akt effects downstream of Wnt/β-catenin destruction complex signaling in epicardial mesothelial cells.
A third effect of the VCAM-1/α4β1/PTEN pathway is the likely regulation of E-cadherin-based junctions in EMCs. The cornerstone of epithelial cell adhesion is Ca2+ dependent homophilic ligation of E-cadherins [51]. Cadherins themselves are trafficked to the cell membrane and actively recycled. A critical part of this trafficking is regulated by PIP2 (reviewed in [51]). Movement of newly synthesized E-cadherin is mediated by targeted exocytosis and this requires the expression of PIP kinase I𝜸 (PIPK𝜸) [52]. PIPK𝜸 is a type I PIP kinase that catalyzes the formation of PI(4)P to PI(4,5)P2 and directly associates with all cadherins. Genetic ablation of the gene encoding PIPK𝜸 resulted in phenotypes consistent with a role for PIPK𝜸 in mediating formations of epithelial junctions, circumferential actin belts and vesicle trafficking [53]. PIP2 also regulates the “exocyst,” a complex consisting of eight protein subunits that is expressed on exocytic vesicles emerging from the Trans-golgi network (reviewed in [54]). At least two proteins of the exocyst, Exo70 and Sec3, bind to PIP2 to mediate their interactions with the plasma membrane [43,55]. Disruption of the ability of Exo70 to bind to PIP2 interfered with the ability of exocytic vesicles to tether and fuse with the plasma membrane [55]. Thus, PIP2 likely plays an important role in bringing E-cadheren to the plasma membrane to establish or maintain intercellular adhesion. The VCAM-1/α4β1/PTEN pathway could therefore maintain localized levels of PIP2 in EMCs to promote junctional integrity during mesothelial migration.
Once intercellular junctions are established, E-cadherins maintain a dynamic interaction with other proteins inside cells to maintain their adhesion to other cells. This process is intimately involved with actin polymerization near the apical junctional complex as we have discussed above (reviewed in [56]). One way this is known to occur is that PIP2 inhibits the actin severing protein gelsolin, so as to promote longer filaments with cortical actin belts at the basolateral membrane [57]. PIP2 also plays an important role in the rapid recycling of E-cadherins [51]. If the rate of endocytosis of E-cadherins is increased, for example by pathways that stimulate EMT, junctional complexes are weakened and E-cadherin is predominantly targeted to the proteasome. However, in the absence of these signals, cells can rapidly recycle E-cadherin to the basolateral membrane via the exocyst complex, so increased PIP2 could mediate an increased recycling of E-cadherin, thus strengthening junctional complexes.
A fourth, but untested, outcome of modification of PTEN by the VCAM-1/α4β1/PTEN pathway may be to alter Rho/ROCK signaling in epicardium. We observed movement of PTEN in cells from the cytoplasm to the basolateral membrane. This process has been linked to RhoA activation [58] and β-arrestins [59]. In fact, RhoA can also activate PTEN lipid phosphatase activity through ROCK [58,60]. How can this be related to our observations of epicardial cohesion in the presence of sVCAM-1? We had previously found that RhoA was stimulated by TGFβ isoforms in cultured epicardial cells [12] and others have observed that the Y27632 compound, which inhibits ROCK-kinase, inhibits PDGF-BB stimulated epicardial EMT and stress fiber formation [61]. PDGF-BB can stimulate both RhoA/ROCK and PI3K/Akt in epicardium [24,61], so it appears that activation of both pathways is important for EMT. Consistent with this, we have observed that sVCAM-1 strongly inhibits epicardial EMT [12], modulates RhoA through p190RhoGAP and relocalizes and activates PTEN. Critical to this discussion then are two completely unresolved issues: first, can PDGF-BB or TGFβ also activate PTEN through RhoA/ROCK? Second, is activation of these pathways limited to critical subcellular areas? This will be a fruitful area for future studies.

3.6. A Model for the Role of Lipid Signaling in Epicardial Mesothelial Cells

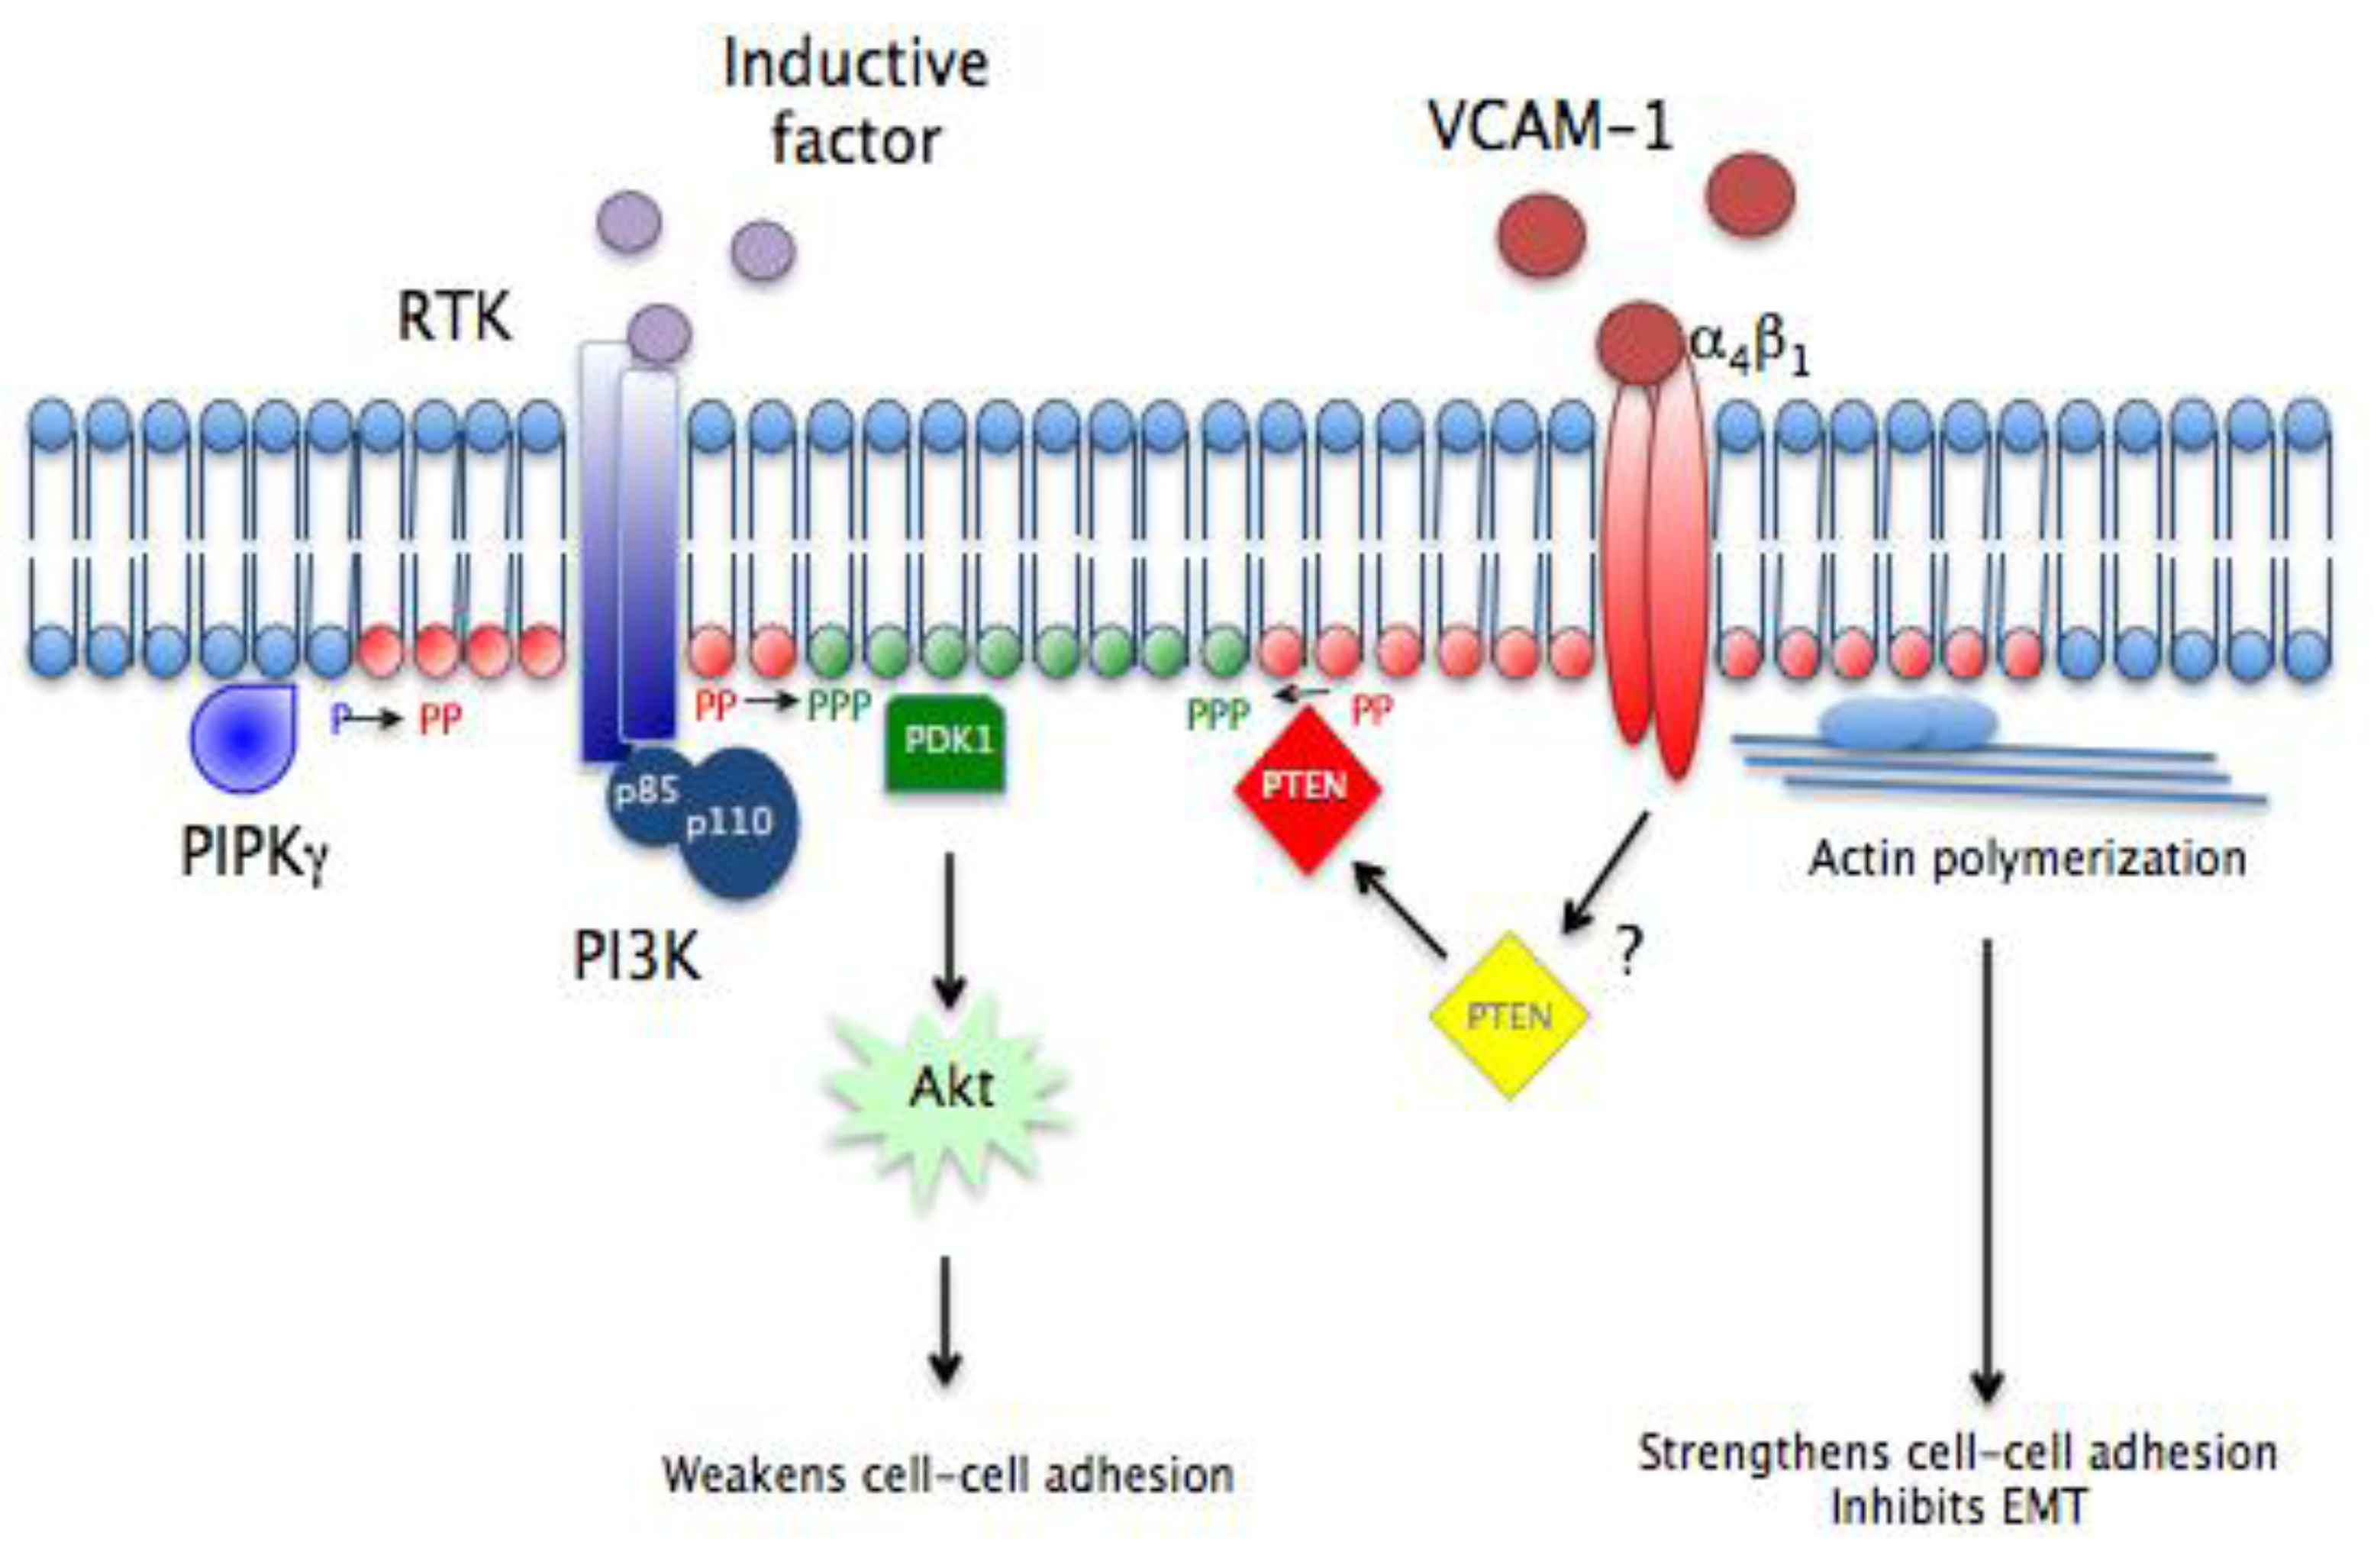
A hypothetical model demonstrating how the VCAM-1/α4β1/PTEN pathway regulates epicardial formation is shown in Figure 7. Our findings linking sVCAM-1 to PTEN activity support a role for myocardial ligands such as VCAM-1 to influence lipid signaling in epicardial mesothelium. The epicardial mesothelium is initially formed on the primary myocardium, which is expressing VCAM-1 [8,9,16]. Three types of interactions between receptors and ligands have now been identified during this initial physical contact: myocardial BMP with epicardial BMPR [62]; myocardial Eph receptor with epicardial ephrin [63]; and myocardial VCAM-1 with epicardial α4β1 integrin. The interaction between α4β1 integrin and VCAM-1 facilitates the migration of EMCs and, we would argue, maintains them in their mesothelial state during this initial migration. At a later time, inductive factors such as TGFβ isoforms or PDGF-BB are presented to EMCs and this activates intracellular signaling pathways, such as PI3K/Akt, or Wnt/β-catenin to stimulate loss of cell adhesion, EMT and invasion. Other pathways like Rho/ROCK and p38MAP kinase are other intracellular signaling pathways likely involved but not included in our model [12,61,64,65,66]. Counteracting these inductive signals is the continued presence of α4β1 integrin bound to its ligands VCAM-1 (or later fibronectin). These ligands activate PTEN and localize it to the basolateral membrane to limit the accumulation of PIP3 within the inner leaflet. Thus, a balance is created, where two opposing pathways maintain the equilibrium between the migrating mesothelium and its mesenchymal derivatives. In situations where inductive signals are stronger, PIP3 increases, PIP2 decreases and cells undergo EMT and invade. Alternately, when the α4β1 integrin signal is stronger, PTEN is activated, PIP3 decreases, PIP2 increases and cells remain in the mesothelium.
We do not know how VCAM-1/α4β1 integrin alters PTEN activity nor do we understand how it can modify its intracellular localization. PIP2 is likely generated in localized regions of the plasma membrane by a member of the PIPK𝜸 family. This PIP2 is then converted to PIP3 by PI3K. This activates Akt and its downstream events, such as inhibiting GSK3β in the Wnt/β-catenin destruction complex. Other pathways are activated to weaken cell-cell junctions, as we have shown that LY294002 blocks weakening of intercellular adhesion. It is possible that the strengthening of junctional complexes we have observed is accomplished simply by increasing plasma membrane PIP2. PIP2 and PTEN then promote epithelial adhesion by binding to and concentrating proteins involved in actin polymerization.

4. Concluding Remarks

The finding that VCAM-1/α4β1 signaling modulates PTEN activity is important because while it was already understood that various pathways altered epicardial behaviors, especially in EMT, it was not clear how these pathways intersected in cells. Now we have the idea that lipid signaling may play a central role in establishing early events in epicardial formation including superficial cell migration and epithelial junctional complexes. It will now be valuable to study how the inductive signals we have discovered in epicardium modify lipid signaling and how proteins that directly modify lipids, like lipid kinases, change the way these signals act to regulate epicardial development.
Figure 7. Model for the role of PTEN/PIP signaling in epicardial mesothelial cells. Phosphatidylinositol lipids are a minor component of the cytosolic side of the plasma membrane and their phosphorylated forms are potent second messengers in intracellular signaling. PIP (light blue head groups), PIP2 (red head groups) and PIP3 (green head groups) and other lipids (yellow head groups) are indicated. PIPK𝜸 converts PIP into PIP2 and PI3K converts PIP2 into PIP3. Inductive factors such as TGFβs, FGFs, Wnts and PDGFs (purple circles) through their cell surface receptors (CSRs) indirectly or directly activate PI3K, depicted as its two subunits p85 and p110. Resulting PIP3 binds PDK1, which activates Akt (green cloud). Akt triggers many downstream events including weakening of intracellular junctions during EMT. α4β1 ligation by sVCAM-1 (red circles) alters an as yet determined pathway (?) that relocalizes cytoplasmic PTEN (yellow diamond) to the basolateral membrane and activating its lipid phosphatase. PTEN increases localized levels of PIP2 at the expense of PIP3 blunting PI3K signaling and promoting the organization of circumferential actin belts (blue lines) by binding to actin organizing proteins at the plasma membrane (light blue ovals). Together these events could maintain epithelial organization of epicardial mesothelial cells as they migrate over the myocardial surface.
Jdb 01 00159 g007

Acknowledgments

We would like to that Dr. Stacy Loftus for the RCAS vectors we used to make our viruses. We would like to thank Connie Runyan for her help in carrying out the cell fractionation studies. This study was supported by American Heart Association grant GIA0855946G. The mAb 3C2 developed by Dr. David Boettiger was obtained from the Developmental Studies Hybridoma Bank developed under the auspices of the NICHD and maintained by The University of Iowa, Department of Biology, Iowa City, IA 52242.

Conflicts of Interest

The authors declare no conflict of interest.

References and Notes

  1. Viragh, S.; Challice, C.E. The origin of the epicardium and the embryonic myocardial circulation in the mouse. Anat. Rec. 1981, 201, 157–168. [Google Scholar] [CrossRef]
  2. Viragh, S.; Gittenberger-de Groot, A.C.; Poelmann, R.E.; Kalman, F. Early development of quail heart epicardium and associated vascular and glandular structures. Anat. Embryol. (Berl) 1993, 188, 381–393. [Google Scholar]
  3. Nahirney, P.C.; Mikawa, T.; Fischman, D.A. Evidence for an extracellular matrix bridge guiding proepicardial cell migration to the myocardium of chick embryos. Dev. Dyn. 2003, 227, 511–523. [Google Scholar] [CrossRef]
  4. Mikawa, T.; Gourdie, R.G. Pericardial mesoderm generates a population of coronary smooth muscle cells migrating into the heart along with ingrowth of the epicardial organ. Dev. Biol. 1996, 174, 221–232. [Google Scholar] [CrossRef]
  5. Dettman, R.W.; Denetclaw, W., Jr.; Ordahl, C.P.; Bristow, J. Common epicardial origin of coronary vascular smooth muscle, perivascular fibroblasts, and intermyocardial fibroblasts in the avian heart. Dev. Biol. 1998, 193, 169–181. [Google Scholar] [CrossRef]
  6. Gittenberger-de Groot, A.C.; Vrancken Peeters, M.P.; Mentink, M.M.; Gourdie, R.G.; Poelmann, R.E. Epicardium-derived cells contribute a novel population to the myocardial wall and the atrioventricular cushions. Circulation Res. 1998, 82, 1043–1052. [Google Scholar] [CrossRef]
  7. Perez-Pomares, J.M.; Macias, D.; Garcia-Garrido, L.; Munoz-Chapuli, R. The origin of the subepicardial mesenchyme in the avian embryo: An immunohistochemical and quail-chick chimera study. Dev. Biol. 1998, 200, 57–68. [Google Scholar] [CrossRef]
  8. Yang, J.T.; Rayburn, H.; Hynes, R.O. Cell adhesion events mediated by alpha 4 integrins are essential in placental and cardiac development. Development 1995, 121, 549–560. [Google Scholar]
  9. Sengbusch, J.K.; He, W.; Pinco, K.A.; Yang, J.T. Dual functions of [alpha]4[beta]1 integrin in epicardial development: initial migration and long-term attachment. J. Cell. Biol. 2002, 157, 873–882. [Google Scholar] [CrossRef]
  10. Stepp, M.A.; Urry, L.A.; Hynes, R.O. Expression of alpha 4 integrin mRNA and protein and fibronectin in the early chicken embryo. Cell. Adhes. Commun. 1994, 2, 359–375. [Google Scholar] [CrossRef]
  11. Dettman, R.W.; Pae, S.H.; Morabito, C.; Bristow, J. Inhibition of alpha4-integrin stimulates epicardial-mesenchymal transformation and alters migration and cell fate of epicardially derived mesenchyme. Dev. Biol. 2003, 257, 315–328. [Google Scholar] [CrossRef]
  12. Dokic, D.; Dettman, R.W. VCAM-1 inhibits TGFbeta stimulated epithelial-mesenchymal transformation by modulating Rho activity and stabilizing intercellular adhesion in epicardial mesothelial cells. Dev. Biol. 2006, 299, 489–504. [Google Scholar] [CrossRef]
  13. Osborn, L.; Hession, C.; Tizard, R.; Vassallo, C.; Luhowskyj, S.; Chi-Rosso, G.; Lobb, R. Direct expression cloning of vascular cell adhesion molecule 1, a cytokine-induced endothelial protein that binds to lymphocytes. Cell 1989, 59, 1203–1211. [Google Scholar] [CrossRef]
  14. Hunkapiller, T.; Goverman, J.; Koop, B.F.; Hood, L. Implications of the diversity of the immunoglobulin gene superfamily. Cold Spring Harb. Symp. Quant. Biol. 1989, 54, 15–29. [Google Scholar] [CrossRef]
  15. Muller, P.S.; Schulz, R.; Maretto, S.; Costello, I.; Srinivas, S.; Bikoff, E.; Robertson, E. The fibronectin leucine-rich repeat transmembrane protein Flrt2 is required in the epicardium to promote heart morphogenesis. Development 2011, 138, 1297–1308. [Google Scholar] [CrossRef]
  16. Kwee, L.; Baldwin, H.S.; Shen, H.M.; Stewart, C.L.; Buck, C.; Buck, C.A.; Labow, M.A. Defective development of the embryonic and extraembryonic circulatory systems in vascular cell adhesion molecule (VCAM-1) deficient mice. Development 1995, 121, 489–503. [Google Scholar]
  17. Gurtner, G.C.; Davis, V.; Li, H.; McCoy, M.J.; Sharpe, A.; Cybulsky, M.I. Targeted disruption of the murine VCAM1 gene: essential role of VCAM-1 in chorioallantoic fusion and placentation. Genes Dev. 1995, 9, 1–14. [Google Scholar] [CrossRef]
  18. Lander, R.; Nasr, T.; Ochoa, S.D.; Nordin, K.; Prasad, M.S.; Labonne, C. Interactions between Twist and other core epithelial-mesenchymal transition factors are controlled by GSK3-mediated phosphorylation. Nat. Commun. 2013, 4, 1542. [Google Scholar] [CrossRef]
  19. Yan, D.; Avtanski, D.; Saxena, N.K.; Sharma, D. Leptin-induced epithelial-mesenchymal transition in breast cancer cells requires beta-catenin activation via Akt/GSK3- and MTA1/Wnt1 protein-dependent pathways. J. Biol. Chem. 2012, 287, 8598–8612. [Google Scholar]
  20. Grille, S.J.; Bellacosa, A.; Upson, J.; Klein-Szanto, A.J.; van Roy, F.; Lee-Kwon, W.; Donowitz, M.; Tsichlis, P.N.; Larue, L. The protein kinase Akt induces epithelial mesenchymal transition and promotes enhanced motility and invasiveness of squamous cell carcinoma lines. Cancer Res. 2003, 63, 2172–2178. [Google Scholar]
  21. Moore, R.; Larue, L. Cell surface molecules and truncal neural crest ontogeny: a perspective. Birth Defects Res. C Embryo Today 2004, 72, 140–150. [Google Scholar] [CrossRef]
  22. Bakin, A.V.; Tomlinson, A.K.; Bhowmick, N.A.; Moses, H.L.; Arteaga, C.L. Phosphatidylinositol 3-kinase function is required for transforming growth factor beta-mediated epithelial to mesenchymal transition and cell migration. J. Biol. Chem. 2000, 275, 36803–36810. [Google Scholar]
  23. Kato, M.; Putta, S.; Wang, M.; Yuan, H.; Lanting, L.; Nair, I.; Gunn, A.; Nakagawa, Y.; Shimano, H.; Todorov, I.; Rossi, J.J.; Natarajan, R. TGF-beta activates Akt kinase through a microRNA-dependent amplifying circuit targeting PTEN. Nat. Cell. Biol. 2009, 11, 881–889. [Google Scholar] [CrossRef]
  24. Mellgren, A.M.; Smith, C.L.; Olsen, G.S.; Eskiocak, B.; Zhou, B.; Kazi, M.N.; Ruiz, F.R.; Pu, W.T.; Tallquist, M.D. Platelet-derived growth factor receptor beta signaling is required for efficient epicardial cell migration and development of two distinct coronary vascular smooth muscle cell populations. Circ. Res. 2008, 103, 1393–1401. [Google Scholar] [CrossRef]
  25. King, W.G.; Mattaliano, M.D.; Chan, T.O.; Tsichlis, P.N.; Brugge, J.S. Phosphatidylinositol 3-kinase is required for integrin-stimulated AKT and Raf-1/mitogen-activated protein kinase pathway activation. Mol. Cell. Biol. 1997, 17, 4406–4418. [Google Scholar]
  26. Ho, B.; Bendeck, M.P. Integrin linked kinase (ILK) expression and function in vascular smooth muscle cells. Cell. Adh. Migr. 2009, 3, 174–176. [Google Scholar] [CrossRef]
  27. White, E.S.; Thannickal, V.J.; Carskadon, S.L.; Dickie, E.G.; Livant, D.L.; Markwart, S.; Toews, G.B.; Arenberg, D.A. Integrin alpha4beta1 regulates migration across basement membranes by lung fibroblasts: a role for phosphatase and tensin homologue deleted on chromosome 10. Am. J. Respir. Crit. Care Med. 2003, 168, 436–442. [Google Scholar] [CrossRef]
  28. Liu, Y.; Bankaitis, V.A. Phosphoinositide phosphatases in cell biology and disease. Prog. Lipid Res. 2010, 49, 201–217. [Google Scholar] [CrossRef]
  29. Mulholland, D.J.; Kobayashi, N.; Ruscetti, M.; Zhi, A.; Tran, L.M.; Huang, J.; Gleave, M.; Wu, H. Pten loss and RAS/MAPK activation cooperate to promote EMT and metastasis initiated from prostate cancer stem/progenitor cells. Cancer Res. 2012, 72, 1878–1889. [Google Scholar] [CrossRef]
  30. Wang, H.; Quah, S.Y.; Dong, J.M.; Manser, E.; Tang, J.P.; Zeng, Q. PRL-3 down-regulates PTEN expression and signals through PI3K to promote epithelial-mesenchymal transition. Cancer Res. 2007, 67, 2922–2926. [Google Scholar] [CrossRef]
  31. Hamburger, V.; Hamilton, H.L. A series of normal stages in the development of the chick embryo. J. Morphol. 1951, 88, 49–92. [Google Scholar] [CrossRef]
  32. Cross, E.E.; Thomason, R.T.; Martinez, M.; Hopkins, C.R.; Hong, C.C.; Bader, D.M. Application of small organic molecules reveals cooperative TGFbeta and BMP regulation of mesothelial cell behaviors. ACS Chem. Biol. 2011, 6, 952–961. [Google Scholar] [CrossRef]
  33. Eid, H.; de Bold, M.L.; Chen, J.H.; de Bold, A.J. Epicardial mesothelial cells synthesize and release endothelin. J. Cardiovasc. Pharmacol. 1994, 24, 715–720. [Google Scholar] [CrossRef]
  34. Eid, H.; Larson, D.M.; Springhorn, J.P.; Attawia, M.A.; Nayak, R.C.; Smith, T.W.; Kelly, R.A. Role of epicardial mesothelial cells in the modification of phenotype and function of adult rat ventricular myocytes in primary coculture. Circ. Res. 1992, 71, 40–50. [Google Scholar] [CrossRef]
  35. Wada, A.M.; Smith, T.K.; Osler, M.E.; Reese, D.E.; Bader, D.M. Epicardial/Mesothelial cell line retains vasculogenic potential of embryonic epicardium. Circ. Res. 2003, 92, 525–531. [Google Scholar] [CrossRef]
  36. Huang, Y.; Hickey, R.P.; Yeh, J.L.; Liu, D.; Dadak, A.; Young, L.H.; Johnson, R.S.; Giordano, F.J. Cardiac myocyte-specific HIF-1alpha deletion alters vascularization, energy availability, calcium flux, and contractility in the normoxic heart. FASEB J. 2004, 18, 1138–1140. [Google Scholar]
  37. Getsios, S.; Huen, A.C.; Green, K.J. Working out the strength and flexibility of desmosomes. Nat. Rev. Mol. Cell. Biol. 2004, 5, 271–281. [Google Scholar] [CrossRef]
  38. Das, S.; Dixon, J.E.; Cho, W. Membrane-binding and activation mechanism of PTEN. Proc. Natl. Acad. Sci. USA 2003, 100, 7491–7496. [Google Scholar] [CrossRef]
  39. Gjorloff-Wingren, A.; Saxena, M.; Han, S.; Wang, X.; Alonso, A.; Renedo, M.; Oh, P.; Williams, S.; Schnitzer, J.; Mustelin, T. Subcellular localization of intracellular protein tyrosine phosphatases in T cells. Eur J. Immunol. 2000, 30, 2412–2421. [Google Scholar] [CrossRef]
  40. Sechi, A.S.; Wehland, J. The actin cytoskeleton and plasma membrane connection: PtdIns(4,5)P(2) influences cytoskeletal protein activity at the plasma membrane. J. Cell. Sci. 2000, 113, 3685–3695. [Google Scholar]
  41. Takenawa, T.; Itoh, T. Phosphoinositides, key molecules for regulation of actin cytoskeletal organization and membrane traffic from the plasma membrane. Biochim. Biophys. Acta. 2001, 1533, 190–206. [Google Scholar]
  42. Smith, C.L.; Baek, S.T.; Sung, C.Y.; Tallquist, M.D. Epicardial-Derived Cell Epithelial-to-Mesenchymal Transition and Fate Specification Require PDGF Receptor Signaling. Circ. Res. 2011, 108, e15–e26. [Google Scholar] [CrossRef]
  43. Liu, J.; Zuo, X.; Yue, P.; Guo, W. Phosphatidylinositol 4,5-bisphosphate mediates the targeting of the exocyst to the plasma membrane for exocytosis in mammalian cells. Mol. Biol. Cell. 2007, 18, 4483–4492. [Google Scholar] [CrossRef]
  44. Sutherland, C.; Leighton, I.A.; Cohen, P. Inactivation of glycogen synthase kinase-3 beta by phosphorylation: new kinase connections in insulin and growth-factor signalling. Biochem. J. 1993, 296, 15–19. [Google Scholar]
  45. Frame, S.; Cohen, P.; Biondi, R.M. A common phosphate binding site explains the unique substrate specificity of GSK3 and its inactivation by phosphorylation. Mol. Cell. 2001, 7, 1321–1327. [Google Scholar] [CrossRef]
  46. Piao, S.; Lee, S.H.; Kim, H.; Yum, S.; Stamos, J.L.; Xu, Y.; Lee, S.J.; Lee, J.; Oh, S.; Han, J.K.; Park, B.J.; Weis, W.I.; Ha, N.C. Direct inhibition of GSK3beta by the phosphorylated cytoplasmic domain of LRP6 in Wnt/beta-catenin signaling. PLoS One 2008, 3, e4046. [Google Scholar] [CrossRef]
  47. Guadix, J.A.; Ruiz-Villalba, A.; Lettice, L.; Velecela, V.; Munoz-Chapuli, R.; Hastie, N.D.; Perez-Pomares, J.M.; Martinez-Estrada, O.M. Wt1 controls retinoic acid signalling in embryonic epicardium through transcriptional activation of Raldh2. Development 2011, 138, 1093–1097. [Google Scholar] [CrossRef]
  48. Merki, E.; Zamora, M.; Raya, A.; Kawakami, Y.; Wang, J.; Zhang, X.; Burch, J.; Kubalak, S.W.; Kaliman, P.; Belmonte, J.C.; Chien, K.R.; Ruiz-Lozano, P. Epicardial retinoid X receptor alpha is required for myocardial growth and coronary artery formation. Proc. Natl. Acad. Sci. USA 2005, 102, 18455–18460. [Google Scholar] [CrossRef]
  49. Kim, S.E.; Lee, W.J.; Choi, K.Y. The PI3 kinase-Akt pathway mediates Wnt3a-induced proliferation. Cell. Signal. 2007, 19, 511–518. [Google Scholar] [CrossRef]
  50. Sonderegger, S.; Haslinger, P.; Sabri, A.; Leisser, C.; Otten, J.V.; Fiala, C.; Knofler, M. Wingless (Wnt)-3A induces trophoblast migration and matrix metalloproteinase-2 secretion through canonical Wnt signaling and protein kinase B/AKT activation. Endocrinology 2010, 151, 211–220. [Google Scholar] [CrossRef]
  51. Schill, N.J.; Anderson, R.A. Out, in and back again: PtdIns(4,5)P(2) regulates cadherin trafficking in epithelial morphogenesis. Biochem J. 2009, 418, 247–260. [Google Scholar] [CrossRef]
  52. Ling, K.; Bairstow, S.F.; Carbonara, C.; Turbin, D.A.; Huntsman, D.G.; Anderson, R.A. Type I gamma phosphatidylinositol phosphate kinase modulates adherens junction and E-cadherin trafficking via a direct interaction with mu 1B adaptin. J. Cell. Biol. 2007, 176, 343–353. [Google Scholar]
  53. Wang, Y.; Lian, L.; Golden, J.A.; Morrisey, E.E.; Abrams, C.S. PIP5KI gamma is required for cardiovascular and neuronal development. Proc. Natl. Acad. Sci. USA 2007, 104, 11748–11753. [Google Scholar] [CrossRef]
  54. Lipschutz, J.H.; Mostov, K.E. Exocytosis: the many masters of the exocyst. Curr. Biol. 2002, 12, R212–R214. [Google Scholar] [CrossRef]
  55. He, B.; Xi, F.; Zhang, X.; Zhang, J.; Guo, W. Exo70 interacts with phospholipids and mediates the targeting of the exocyst to the plasma membrane. EMBO J. 2007, 26, 4053–4065. [Google Scholar] [CrossRef]
  56. Bershadsky, A. Magic touch: how does cell-cell adhesion trigger actin assembly? Trends Cell. Biol. 2004, 14, 589–593. [Google Scholar] [CrossRef]
  57. Janmey, P.A.; Stossel, T.P. Gelsolin-polyphosphoinositide interaction. Full expression of gelsolin-inhibiting function by polyphosphoinositides in vesicular form and inactivation by dilution, aggregation, or masking of the inositol head group. J. Biol. Chem. 1989, 264, 4825–4831. [Google Scholar]
  58. Li, Z.; Dong, X.; Wang, Z.; Liu, W.; Deng, N.; Ding, Y.; Tang, L.; Hla, T.; Zeng, R.; Li, L.; Wu, D. Regulation of PTEN by Rho small GTPases. Nat. Cell. Biol. 2005, 7, 399–404. [Google Scholar] [CrossRef]
  59. Lima-Fernandes, E.; Enslen, H.; Camand, E.; Kotelevets, L.; Boularan, C.; Achour, L.; Benmerah, A.; Gibson, L.C.; Baillie, G.S.; Pitcher, J.A.; Chastre, E.; Etienne-Manneville, S.; Marullo, S.; Scott, M.G. Distinct functional outputs of PTEN signalling are controlled by dynamic association with beta-arrestins. EMBO J. 2011, 30, 2557–2568. [Google Scholar] [CrossRef]
  60. Papakonstanti, E.A.; Ridley, A.J.; Vanhaesebroeck, B. The p110delta isoform of PI 3-kinase negatively controls RhoA and PTEN. EMBO J. 2007, 26, 3050–3061. [Google Scholar] [CrossRef]
  61. Lu, J.; Landerholm, T.E.; Wei, J.S.; Dong, X.R.; Wu, S.P.; Liu, X.; Nagata, K.; Inagaki, M.; Majesky, M.W. Coronary smooth muscle differentiation from proepicardial cells requires rhoA-mediated actin reorganization and p160 rho-kinase activity. Dev. Biol. 2001, 240, 404–418. [Google Scholar] [CrossRef]
  62. Ishii, Y.; Garriock, R.J.; Navetta, A.M.; Coughlin, L.E.; Mikawa, T. BMP signals promote proepicardial protrusion necessary for recruitment of coronary vessel and epicardial progenitors to the heart. Dev. Cell. 2010, 19, 307–316. [Google Scholar] [CrossRef]
  63. Wengerhoff, S.M.; Weiss, A.R.; Dwyer, K.L.; Dettman, R.W. A migratory role for EphrinB ligands in avian epicardial mesothelial cells. Dev. Dyn. 2010, 239, 598–609. [Google Scholar] [CrossRef]
  64. Austin, A.F.; Compton, L.A.; Love, J.D.; Brown, C.B.; Barnett, J.V. Primary and immortalized mouse epicardial cells undergo differentiation in response to TGFbeta. Dev. Dyn. 2008, 237, 366–376. [Google Scholar] [CrossRef]
  65. Sanchez, N.S.; Barnett, J.V. TGFbeta and BMP-2 regulate epicardial cell invasion via TGFbetaR3 activation of the Par6/Smurf1/RhoA pathway. Cell. Signal. 2012, 24, 539–548. [Google Scholar] [CrossRef]
  66. Compton, L.A.; Potash, D.A.; Mundell, N.A.; Barnett, J.V. Transforming growth factor-beta induces loss of epithelial character and smooth muscle cell differentiation in epicardial cells. Dev. Dyn. 2006, 235, 82–93. [Google Scholar] [CrossRef]

Supplementary Materials

Figure S1. Method used to quantify junctional actin ratio in cultured chick EMCs. (A-D) Four confocal images are shown from three channels merged in Image J, red is f-actin, green is E-cadherin and blue is nuclei. Treatments and stains are indicated by panels. A line (sample line) is indicated on each panel to show the line sampled in Image J for pixel intensity (gray values). Lines were chosen in the E-cadherin (green) channel to reduce bias for results in the actin (red) channel. Line graphs below each panel represent gray values along the line for the panel directly above. Green lines are gray values along the line for E-cadherin and red lines are gray values along the line for f-actin. Data was obtained by drawing the line, which was normally between 40 µm and 100 µm in length and using the Analyze>Plot Profile command for both the green and red channels. Numbers are the intensities of the fluorescent pixels in grayscale units from 0–255 in 8-bit images. On this scale 0 denotes black and 255 white. Junctions were defined by manually inspecting the peaks of the green image and determining the positions along each line defined by these peaks (asterisks). Then, gray values at those positions were determined in the data from the red (actin) channel. Here, the values were averaged if they were 1) at the junction and 2) defined the peak gray value at the junction and 3) were within 20% of the peak value. Mean pixel intensity for actin was determined for three junctions in each line. The remaining pixel intensity values along the line were averaged to represent actin filament values inside junctions. The ratio of the two values was calculated to determine the “junctional actin ratio”.
Jdb 01 00159 g008
Figure S2. Degree of RCAS spreading in the embryonic chick heart. (A-D) To determine if RCAS transduction was effective and the degree of viral spreading in the heart, we stained sections of HH35 hearts (that had been infected with viruses at HH17) with mAb 3C2 (red). (B) Representative confocal images are shown as follows: (A) uninfected control, (B) RCASGFP, (C) RCASshPTEN (D) RCASPTENA4-GFP. RCASGFP infected hearts were inspected for GFP expression (green) and not stained with mAb3C2. GFP expression from RCASPTENA4-GFP was weak in sections and so virus spreading had to be visualized with mAb3C2. Magnification bars are shown in the lower left part of each panel.
Jdb 01 00159 g009

