Abstract
Modern smartphones are a great platform for Location Based Services (LBS). While outdoor LBS for smartphones has proven to be very successful, indoor LBS for smartphones has not yet fully developed due to the lack of an accurate positioning technology. In this paper we present an accurate indoor positioning approach for commercial off-the-shelf (COTS) smartphones that uses the innate ability of mobile phones to produce ultrasound, combined with Time-Difference-of-Arrival (TDOA) asynchronous trilateration. We evaluate our indoor positioning approach by describing its strengths and weaknesses, and determine its absolute accuracy. This is accomplished through a range of experiments that involve variables such as position of control point microphones, position of phone within the room, direction speaker is facing and presence of user in the signal path. Test results show that our Lok8 (locate) mobile positioning system can achieve accuracies better than 10 cm in a real-world environment.
1. Introduction
Location Based Services (LBS) take a user’s position as input and use that information to tailor their output making it more task relevant. Outdoor and indoor LBS are usually viewed as two separate domains, likely because outdoor positioning methods generally do not work well indoors. There are several factors that make outdoor LBS an ideal environment for value added application development:
- GPS works most everywhere outdoors. In urban environments it is enhanced with GSM and Wi-Fi positioning to make it even more reliable. This means no new infrastructure is necessary for new applications to emerge.
- There is a well-defined software distribution model. All major mobile operating systems have online software marketplaces, such as App Store and Google Play, that are instantly available to smartphones.
- There is a well-defined content generation model. Business owners are interested in their details being available to popular Location Based Services. Such as Yelp for cafes and restaurants, or Booking.com for hotels. This means that a sufficiently popular service does not need to update their database as it will be done for them.
- Modern smartphones have high definition touchscreens and are able to deliver a large variety of multimedia content in the form of text, audio, and video.
While there are many public buildings that could greatly benefit from indoor LBS, such as museums, airports, hospitals, and universities, there are several factors that make the emergence of such services problematic. For example, for indoor LBS to emerge, an alternative positioning system to GPS must first be installed—a not insignificant obstacle. In addition, today's smartphones do not yet have specialized hardware installed for indoor positioning and standard mobile phone hardware can give locational accuracies of only two to three meters at best. As a result, accurate indoor positioning systems (cm range) use specialized hardware not available on contemporary phones. Although these systems can determine position with great accuracy, they give no immediate benefit to the user, because unlike smartphones they have no feedback mechanism (e.g., a web enabled touchscreen display) to deliver a multi-modal web-service for user interaction.
Also, where custom hardware is required, users do not readily possess it so it must be provided to them. As there is a risk that a user will break, lose, or steal the device, there is a very low price point that companies providing indoor LBS are willing to pay per device. For example, the most popular configuration for virtual museum guides currently appears to be a keypad for entering an exhibit’s number together with a speaker. Compared to modern smartphone capabilities, such primitive devices severely limit the user navigation experience and exhibit interactivity.
Our goal is to make accurate indoor positioning (i.e., sub meter) possible on commercial off-the-shelf smartphones, making these devices great platforms for indoor LBS. Such an LBS will have the following advantages: it is aware of the user’s exact location and therefore capable of giving precise directions; is very flexible and has powerful multimedia capabilities; anyone with a smartphone already has all the hardware necessary to avail of indoor LBS applications. Examples of a possible user scenario for an indoor smartphone LBS are given in the next section.
2. User Scenario
The following user scenario is an example of how centimeter-level positioning, combined with smartrphone multimedia and networking capabilities can be used to effectively deliver a variety of Location Based Services. In a history museum, there is a notice at the entrance that says the museum is equipped with a smartphone virtual tour/navigation infrastructure. There is a QR code under the message. The user scans the QR code that installs the required app. The system then enhances the user experience in the following ways:
- The user notices a small 12th century vase and decides to learn more about it. S/he points the phone at the vase to initiate directional querying. The vase is located high up on a shelf in a row among other vases. Thanks to high accuracy positioning combined with accelerometer (tilt) and digital compass (azimuth) readings, the system is able to identify the correct vase. The smartphone displays a page with a brief description of the exhibit followed by links to relevant text, audio, video, and other interactive material. The user looks at images of the excavation site and even watches a video of the exhibit being excavated, taking advantage of the powerful multimedia capabilities of their own smartphone.
- The user notices a painting they have seen before. S/he does directional querying and finds out it is by Claude Monet, an impressionist. The user decides to read more about impressionism and accesses a Wikipedia page through a 3G connection on their mobile phone. S/he decides that they want to see more impressionist paintings and requests the museum app to guide him. The system generates the most efficient route to cover all the relevant paintings starting from the user’s current location. Thanks to high accuracy positioning, the system is able to map on the display the location of the next painting, making navigation more comfortable and avoiding confusion. Some notable impressionists are not represented in this museum, however the user is able to see their works through high-resolution digital versions of their paintings displayed on their smartphone.
- The user feels the need to find a bathroom. S/he presses the corresponding button in the mobile museum app. The system finds the closest bathroom and guides them there by displaying a map, current location, route, and directions.
- The user realizes that they need assistance from museum staff. S/he presses the corresponding button and is informed to stay put and that they will be assisted shortly. The system locates the nearest staff member, who also has a smartphone with a staff version of the app, and gets quickly directed to the location of the user in need.
Altogether, the new museum experience combines immersion with the tangibility of a traditional museum visit, plus the flexibility, richness, and comprehensiveness of online surfing. While other features of the system can make the visit more comfortable and safe.
3. Related Work
This section introduces positioning methods that are applicable for today’s commercial off-the-shelf (COTS) smartphone hardware. Hardware components found in all modern smartphones, positioning methods that rely on this hardware as well as limitations of the underlying technology, are discussed and compared.
Among positioning methods used for locating smartphones, methods that involve the use of radio frequency (RF) signals are the most prevalent. Four RF hardware sensors normally found on modern smartphones are GPS, GSM, Wi-Fi, and Bluetooth. Position can be calculated using one of the following properties of an RF signal: Time-of-Arrival (ToA), Received Signal Strength (RSS), Bit Error Rate (BER), and Angle of Arrival (AoA).
RF Time-of-Arrival is associated with the use of very precise clocks and very accurate synchronization because RF signals travel at the speed of light. Hardware designed primarily for data transmission is not optimal for this positioning method. GPS is the only sensor normally found in a smartphone designed to accurately detect ToA of an RF signal. Because signals sent from GPS satellites are too weak after travelling through ceilings and walls, indoor GPS positioning uses pseudolites. Presently, the use of pseudolites is associated with a number of problems: pseudolites are fairly expensive and hard to acquire, they tend to interfere with commercial GPS receivers, and they are incompatible with GPS sensors found in smartphones [1]. Despite these hardware limitations, it was shown by Hoene et al. that ToA can be used with Wi-Fi [2]. This technique has not been tested yet on smartphones and reports an accuracy comparable to conventional Wi-Fi based methods (e.g., ±4 m).
Theoretically there exists an inverse relationship between the received signal strength and the distance it travelled [3]. RSS is the most widely used parameter in positioning systems based on GSM or Wi-Fi, and there are several ways in which it can be used to calculate position. RSS readings for multiple control points can be collected for each unique indoor location in a process called fingerprinting. If the number of access points is sufficient and the fingerprint grid is not too dense, each fingerprint reading will be unique, in which case the reading can simply be attributed to a point in the grid. Because such positioning is only as accurate as its grid is dense, collecting all the required fingerprints entails a great deal of manual effort. There is also a need to take multiple readings per point to filter out noise.
The number of required fingerprints can be greatly reduced by creating a model to predict what RSS readings are expected to be in a location that was not fingerprinted. There are two distinct ways to generate such a prediction model. A wave propagation model can be created that takes into account how much the wave will attenuate when passing through obstacles and empty space. In a study done by Mestre et al. it was shown that fingerprinting can be avoided altogether with this approach [4]. Alternatively, RSS readings can be predicted with the help of a mathematical model. Ferris et al. have shown that this can be accurately done with Gaussian Processes (GP) [5]. A significant finding was that GP are able to accurately extrapolate the model into rooms that were not covered during the training phase.
Indoor positioning methods in the literature that rely on Bit Error Rate (BER) do not appear as a viable option. Changes in BER are a byproduct of changes in RSS, and have even worse correlation with distance due to their random nature. It may be practical to use BER where the initial signal strength cannot be obtained, otherwise RSS is a more reliable parameter.
Angle-of-Arrival methods use the direction from which the signal arrived to determine position through triangulation. It is not possible to determine direction from which the signal arrived on a COTS smartphone because it does not have directional antennas. The only scenario that could work is when a phone generates an RF signal that is received at control points with such antennas. There are two positioning systems of note that utilize AoA with Bluetooth and achieve good accuracy. Maddio et al. showed that a Bluetooth beacon can be located with one to two meters of accuracy [6]. Positioning with 20 cm accuracy was demonstrated by Nokia High Accuracy Indoor Positioning (HAIP), using Bluetooth 4.0 [7]. Unfortunately Bluetooth 4 is currently not found on most smartphones. It is also unclear if and when this technology will be available on smartphones not manufactured by Nokia.
Indoor positioning using GSM has some significant limitations. Existing base stations (GSM towers) are spaced far apart and the introduction of new base stations cannot be done independently of a carrier. Five meter accuracy, one of the best results for indoor GSM positioning, was displayed by Otsason et al. with the help of wide signal-strength fingerprinting [8]. Unfortunately wide signal-strength fingerprinting is impossible on many modern phones due to OS restrictions. Other GSM positioning methods are generally impractical for indoor use due to poor accuracy.
Wi-Fi positioning is at least twice as accurate as GSM. It has been thoroughly researched and even implemented by a few companies on a commercial basis. With Google gradually expanding navigation indoors for Google Maps, which comes preinstalled on all Android devices, Wi-Fi fingerprinting is likely to become a de facto standard for mobile indoor positioning [9].
Bluetooth has the shortest range among the three wireless technologies. At the same time Bluetooth hardware is significantly cheaper than Wi-Fi hardware, which makes a dense control point grid affordable. Currently, using RSS measurements with Bluetooth is complicated because it is designed to adjust signal strength when signals become too strong or too weak, making any subsequent distance measurements based on signal strength unreliable. Disabling this feedback loop is discussed by Zhou et al. [10]. An alternative approach is to measure RSS during the inquiry phase, which utilizes static transmission power but results in a lower update rate [11]. Bluetooth AoA however has been used with greater success. Some studies suggest that if the ID of the target Bluetooth device is known, two devices can go straight to the “paging” phase and avoid the 10 second long “discovery” phase [12,13]. Otherwise, a user could potentially walk through a beacon’s area faster than his phone can establish a connection.
Besides electromagnetic waves, smartphones can send and receive sound waves via their onboard speaker(s) and microphone. Compared to electromagnetic (light) waves, sound travels much slower making it more practical to use its time-of-flight for determining position, even on hardware not designed for positioning. Peng et al. [14] showed that it is possible to utilize sound in order to measure the distance between two mobile phones using synchronized time-of-arrival techniques. Although mobile phone hardware was designed to deal with audible frequencies (below 20 KHz), it is actually capable of producing inaudible frequencies up to 22 KHz. In a study done by Borriello et al. [15] it was shown that an ultrasonic signal can be emitted from a mobile device and successfully captured by a conventional microphone.
Limitations of generating ultrasound signals on mobile phones were studied in our previous work [16]. It was observed that all mobile phones tested were able to successfully produce ultrasonic signals without any audible noise as long as speaker volume settings were below a certain threshold, which was unique to each phone. Together, a slow propagation speed and ultrasound support mean noise-free centimeter-level positioning is possible on COTS smartphones and form the basis of our mobile indoor positioning approach.
While ultrasound trilateration of mobile phones does not appear in the literature, there are many examples of indoor positioning systems that utilize custom hardware to send and receive ultrasonic signals [17,18,19,20,21,22]. These systems report centimeter or even millimeter-level accuracy. Sensors and receivers used in such ultrasonic systems normally operate at around 40 KHz, much higher frequencies than what standard mobile phone speakers can produce. Compared to audible frequencies, sound at these frequencies is known to be highly directional, have a high attenuation rate and poor obstacle penetration. The 20–22 KHz range available on smartphones is expected to share some properties with higher frequencies, although to what extent had to be determined through experiment. Directionality and attenuation rate experimental results are described in Section 5.
Positioning methods that do not rely on signal propagation are also possible on smartphones. One such method is computer vision. All modern smartphones have a camera on the back of the phone and sometimes a second camera on the front. Computer vision, while potentially very accurate, is characterized by high computational load, poor performance under low light conditions, complicated procedures of recovery from tracking failures, and susceptibility to camera shake and motion blur. These problems are addressed in studies done by Williams et al. [23] and Wagner et al. [24]. Another difficulty associated with computer vision is that the user is supposed to be looking through the display screen when using the device. Currently Simultaneous Localization and Mapping (SLAM) appears to be the most promising computer vision technique, considered by many as an operational technology still in its infancy [25].
Magnetometers (digital compass), accelerometers, and gyroscopes that are now common sensors found in smartphones could be used for Dead Reckoning (DR). Dead Reckoning is a method of estimating position by continuously projecting current direction and speed from the known initial position (fix) [26]. Apart from the fix, which for example could be obtained from a passive RFID tag located on a doorway, a DR system only needs a constant flow of information about current direction and speed.
There are several ways to estimate current velocity using accelerometers, the most straightforward approach is to monitor acceleration or deceleration of the unit. Unfortunately, accelerometers are very sensitive to vibrations, which is a major problem for mobile devices. Another problem is that, similar to gyroscopes, accelerometers register the rate of change in movement speed, which leads to a buildup of positioning error over time [25], especially if the user “swings” the device by their side while walking or often takes it in/out of their pocket etc.
A much more reliable use of accelerometers for estimating pedestrian movement is step detection. The spikes of acceleration are used to detect if and how frequently the user takes a step. In a study done by Randell et al. [27] it was shown that provided the user received some sort of training, pedestrian Dead Reckoning can offer better accuracy than GPS over short distances. However if an untrained user was equipped with such a system, the results are worse [28]. Another problem with indoor DR is that magnetometers can be very unreliable indoors, which makes direction estimation a major source of error [27].
A comparison of contemporary indoor positioning systems is given in Table 1. It shows that solutions available on mobile phones predominantly use RF technologies but are yet unable to pass the one-meter accuracy threshold. At the same time, ultrasound based systems have centimeter and millimeter accuracy levels, but are not compatible with COTS smartphones. Our solution (Lok8) combines the best of both, bringing together smartphone multimodal flexibility with the positioning accuracy and robustness of least squares based ultrasound trilateration.

Table 1.
Comparison of indoor positioning system accuracy.
| Positioning System | Best Accuracy | Underlying Technology | Available on Smartphones |
|---|---|---|---|
| Wide signal strength fingerprinting | 2.48 m | GSM | no |
| Skyhook(GSM) | 200 m | GSM | yes |
| Navizon(GSM) | 50 m | GSM | yes |
| Skyhook(Wi-Fi) | 10 m | Wi-Fi | yes |
| Navizon(Wi-Fi) | 20 m | Wi-Fi | yes |
| Hybrid Fingerprinting | 3 m | Wi-Fi | yes |
| RADAR | 2 m | WaveLan | no |
| GP for Signal Strength-Based Location Estimation | 2 m | Wi-Fi | yes |
| Goodtry | 4 m | Wi-Fi | no |
| Ekahau | 1 m | Wi-Fi | no |
| Bluetooth Direction of Arrival | 72 cm | Bluetooth | no |
| Nokia High Accuracy Indoor Positioning | 20 cm | Bluetooth 4.0 | not yet |
| The Bat | 3 cm | Ultrasound | no |
| The Cricket | 3 cm | Ultrasound | no |
| DOLPHIN | 15 cm | Ultrasound | no |
| High Performance Privacy Oriented location system | 2 cm | Ultrasound | no |
| Low Cost Indoor Positioning System | 10cm | Ultrasound | no |
| SNoW Bat | 15 mm | Ultrasound | no |
| Lok8 | <10 cm | Ultrasound | YES |
4. Least Squares Methods for Ultrasound Time Difference of Arrival (TDOA) Trilateration
In our scenario of quickly and accurately locating a mobile phone indoors, ToA (Time-of-Arrival) or synchronous approaches require that times from two separate systems with two separate clocks have to be synchronized—a major source of error. As such, it is desirable to compare only the time of signal arrival at each of the microphones and ignore completely the time the signal was originally sent from the phone, making Lok8 a TDOA (Time-Difference-of-Arrival) or asynchronous approach. The problem is illustrated in Figure 1 and the final matrix solution follows. More detail on this approach can be found in [29,30].
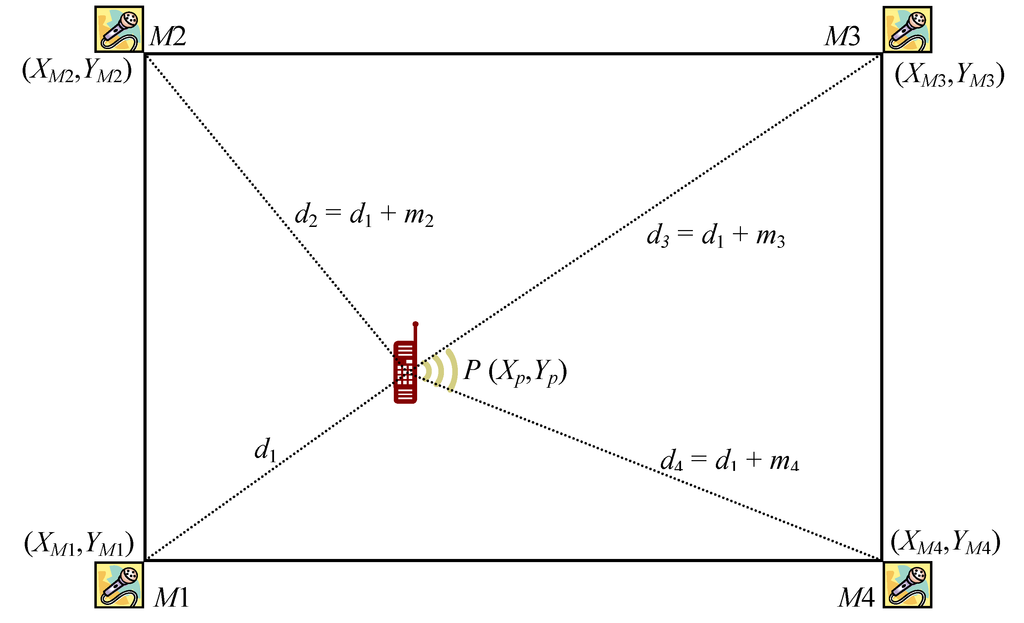
Figure 1.
Time Difference of Arrival Trilateration. Control points M1, M2, M3 and M4 are known microphone positions. Point P is the unknown mobile phone’s position, coordinates of which we are trying to find. Lines d1, d2, d3 and d4 are unknown distances between the phone and each microphone. However, what are known are the differences between the three measurements: m2, m3 and m4.
Problem:
 where:


- Mobile phone (P) has unknown position (XP,YP).
- Four microphones (M1, M2, M3, M4) have known positions (XM1,YM1), (XM2,YM2), (XM3,YM3), (XM4,YM4).
- Four distances (d1, d2, d3, d4) from P to M1, M2, M3, M4 are unknown but the differences between them (m2, m3, m4) are measured ultrasonically; these are the observations.
- Find coordinates of P = (XP,YP) by solving a system of equations (mathematical model) that relates the m = three observations (m2, m3, m4) to the n = two unknown parameters (XP,YP).
- Although the coordinates of P could be found using readings from only three microphones (two observations), four or more mics can be effectively used in the method of Least Squares to determine the Most Probable Value (MPV) for the coordinates of P, plus a Standard Deviation for the MPV. The observation equations are represented in Matrix Methods for Least Squares as:

- m = 3, n = 2
- mAn contains the coefficients of the unknowns (XP, YP)
- nX1 contains the corrections to be applied to the initial estimates for the unknowns (dXP, dYP)
- mL1 contains the measurements (m2, m3, m4)
- mV1 contains the residuals (one for each measurement)
Matrix X contains the corrections to be applied to the original estimates for (XP, YP). These new (XP, YP) coordinates are then used to recalculate updated distances for  . The process is repeated until coordinates of (XP, YP) do not change significantly (e.g., in the 3rd decimal place for mm precision). The initial estimates for XP and YP can be set to the average x and y coordinates of the four microphones, and d1 is then calculated using Pythagoras at XP and YP:

. The process is repeated until coordinates of (XP, YP) do not change significantly (e.g., in the 3rd decimal place for mm precision). The initial estimates for XP and YP can be set to the average x and y coordinates of the four microphones, and d1 is then calculated using Pythagoras at XP and YP:
similarly  can be calculated:


can be calculated:
5. Mobile Ultrasound Range Experiment
While sound propagates with the same speed in all directions, the same cannot be said for intensity. Ultrasound is highly directional, meaning that sound intensity in front of the speaker is much higher than to the sides and behind the speaker. This means the maximum distance that a signal can be detected is significantly longer if the microphone is positioned facing the speaker compared to any other direction. Since the user is free to move and rotate the phone at random, the maximum functional distance will be the longest distance a signal can be detected from any direction.
5.1. Experiment Method
For this range experiment the HTC-G1 phone was placed in the centre of a large room. The 360° area around the phone was divided into eighteen 20° segments. The area is further divided by equally spaced 20 cm concentric circles. There are 40 of these circles, making the radius of the area covered by the experiment 8 m in all directions. Signal intensity at a given direction and distance from the phone was measured by placing a microphone at the corresponding location and pointing it in the direction of the phone. Because signal propagation has rotational symmetry around the axis the speaker is facing, recordings were done for only 180°. Altogether 400 recordings were made. All the signals were recorded at 192 kHz sampling rate and 24 bit depth using a TASCAM HD-P2 portable recording system. The highest intensity of the 22 kHz frequency component was extracted from each file and used to generate the polar contour plot shown in Figure 2, where the “missing” left side of the plot is a mirror image of the right side shown.
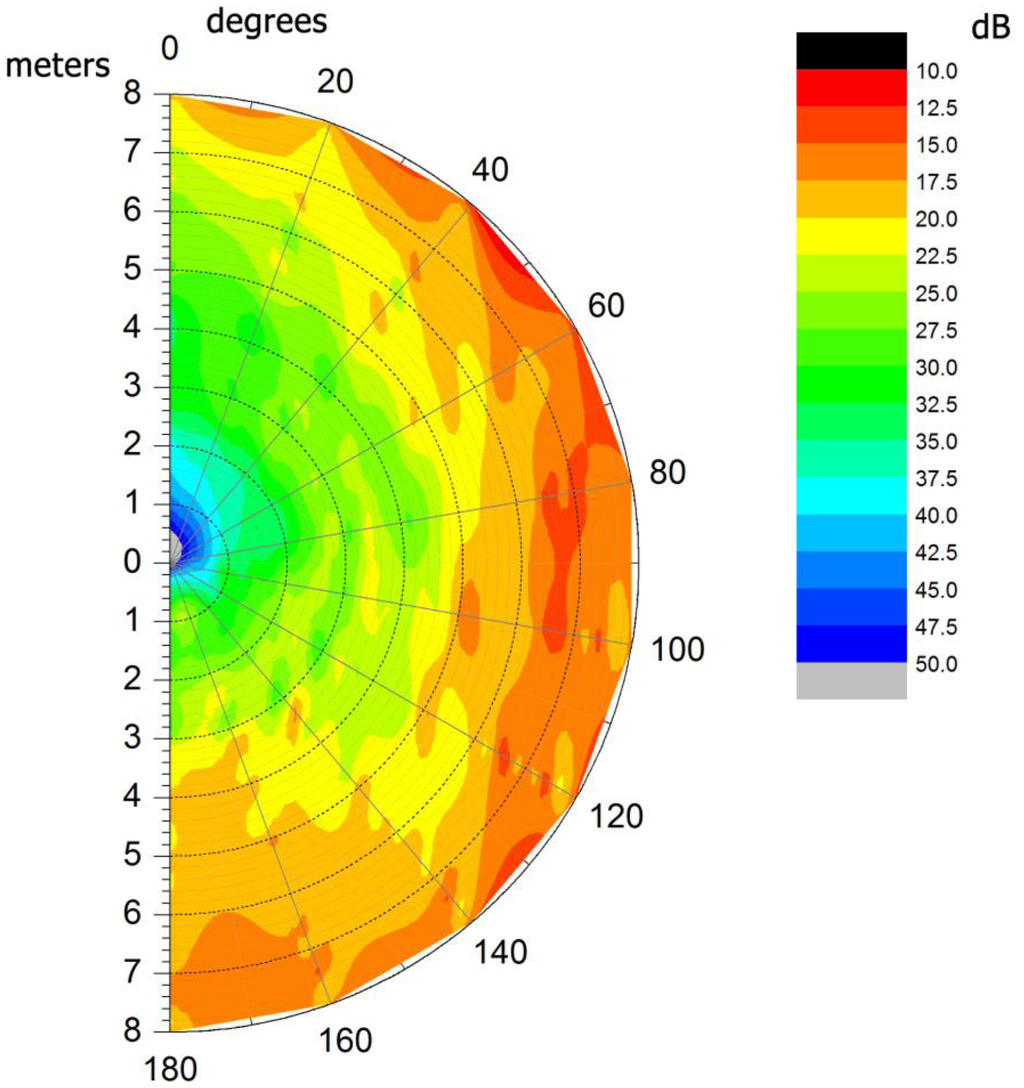
Figure 2.
Polar contour plot for ultrasound energy propagation. The semicircle represents the top-down view of 180° area around the phone out to 8 m distance. Chromatic value represents energy intensity level in dB.
5.2. Discussion
From the contour plot it can be observed that sound intensity propagation for sound intensity levels above 40 dB is highly directional and follows the shape of a cardiod. This is typical for high frequencies. Distribution of energy below 40 dB appears less directional and resembles a subcardioid. Finally, in the entire experiment only one value below 10 dB was registered. This is well above the 21.5 kHz component of background noise, which is around 1 dB. This means that a smartphone ultrasonic signal can be reliably detected from any direction within an 8 m radius. However there is no guarantee that the maximum value belongs to a signal that arrived by direct path and not via a longer multi-path. Provided the readings belong to a signal that arrived via direct path, it should be sufficient to place a microphone in each corner of a room with dimension of ±8 m square. In this way, a phone placed anywhere in the room will always be within an 8 meter range of all four microphones.
6. Positioning Accuracy
The aim of the experiments described in this section is to find out the positioning accuracy of a mobile phone emitting an ultrasound signal calculated using four microphone control points placed just below every ceiling corner (2.83 m high) of a 7 × 7 m room. The ultrasound signal consists of a very short 21.5 KHz “beep”. More details on the design of the ultrasound signal used can be found in [30].
Three experiments were carried out. In Experiment 1 the microphones and the phone were positioned at the same height, 0.12 m below the ceiling. This experiment closely follows the scenario given in [29], where the phone and microphones are all in the same plane. In Experiment 2, the phone was lowered to chest height, putting it roughly 1.6 m below microphone level. No adjustments were made to the trilateration algorithms compared to Experiment 1. During Experiment 3, the phone remained at the same height as in Experiment 2, but a “room calibration factor” was introduced into the trilateration algorithms in order to decrease any impact of height difference on accuracy.
6.1. Experiment Method
DPA microphones were placed just below every ceiling corner and pointed at the opposite floor corner of the room. All microphones were connected to the Avid Mbox Pro audio card, which supports four-channel synchronized input. The audio card was further connected to a PC running the asynchronous trilateration software developed in this project.
The software uses RtAudio API for real-time audio input/output. It is accessed via the Java wrapper JRtAudio, which allowed for quick GUI prototyping in Java. On the PC, RtAudio API supports either DirectSound or ASIO drivers. ASIO support proved essential to us because streaming more than two channels with DirectSound turned out to be very challenging. Audio streams from the audio card are written into a buffer and get processed through a bandpass filter. We found the Bessel bandpass filter [31] with filter order 4, corner frequency one = 21,400 Hz, and corner frequency two = 21,600 Hz, to have the best response to the phone’s inherent ultrasonic signal outputs. This filters out all other frequencies and leaves (almost) only the frequency of the signal.
The ultrasound signal is streamed at 96,000 bit/s sampling rate. Assuming the speed of sound is 346 m/s at normal room temperatures, each sample should be equivalent to 3.6 mm travelled (it is not necessary to account for variations in temperature because changes in office room temperature are practically insignificant). Unfortunately only one out of 10 samples of the bandpass filter is a valid representation of the signal’s intensity. The other 9 samples can be discarded, being a by-product of using a low-order filter. Therefore the real resolution of the system is 3.6 multiplied by 10, or 36 mm. This parameter can be improved by using a high-order filter, which would require more powerful hardware to run in real-time or even the use of a dedicated Digital Signal Processor (DSP).
The same 10 test locations or check points were chosen for all three experiments. Precise coordinates of these check points were pre-measured with a laser measurement device. The phone was then placed at each of these locations with its main speaker pointing directly upward. In Experiment 1 the phone was 0.12 m below the ceiling and during Experiments 2 and 3 it was 1.7 m below the ceiling to mimic normal carrying height. For Experiment 3, the Lok8 positioning software was modified to accommodate multiplication by a “room calibration factor” of 1.1 for each difference in delay. This value appears to compensate well for the height difference between microphones and the phone, and was found by trial and error. In all three experiments the phone was made to produce an ultrasonic “beep” 100 times at each of the 10 check point locations with an interval of one second between beeps to provide enough measurement data for statistical analysis. These signals were captured by the four microphones and processed by the Lok8 positioning software to independently estimate coordinates of the signal source for each detected signal. These coordinates as well as the standard deviation for the trilateration procedure were recorded into text files. This resulted in 3,000 readings; 300 per each unique check point location, 1,000 per experiment.
6.2. Discussion
All 100 readings collected at each check point during each of the three experiments were treated as one sample. For each sample the Most Probable Value (MPV) was calculated. The difference between MPV and true position of the check point as well as its standard deviation can be found in Table 2.
Table 2.
Difference between Most Probable Value (MPV) and true position ± standard deviation. First column contains the check point number, which are used to identify each of the ten known test positions. Columns 2, 3, and 4 contain error and standard deviation for each test in each of the three experiments.
| Check Point Number | Experiment 1 Error ± Standard Deviation (m) | Experiment 2 Error ± Standard Deviation (m) | Experiment 3 Error ± Standard Deviation (m) |
|---|---|---|---|
| 1 | 0.072 ± 0.051 | 0.172 ± 0.047 | 0.070 ± 0.043 |
| 2 | 0.219 ± 0.097 | 0.236 ± 0.063 | 0.081 ± 0.035 |
| 3 | 0.184 ± 0.076 | 0.257 ± 0.048 | 0.083 ± 0.046 |
| 4 | 0.121 ± 0.053 | 0.122 ± 0.049 | 0.086 ± 0.039 |
| 5 | 0.140 ± 0.057 | 0.144 ± 0.057 | 0.133 ± 0.028 |
| 6 | 0.064 ± 0.056 | 0.166 ± 0.048 | 0.080 ± 0.030 |
| 7 | 0.151 ± 0.042 | 0.089 ± 0.044 | 0.097 ± 0.033 |
| 8 | 0.187 ± 0.068 | 0.288 ± 0.058 | 0.061 ± 0.039 |
| 9 | 0.175 ± 0.048 | 0.182 ± 0.078 | 0.033 ± 0.099 |
| 10 | 0.277 ± 0.082 | 0.153 ± 0.142 | 0.099 ± 0.041 |
| Average | 0.159 ± 0.063 | 0.181 ± 0.063 | 0.082 ± 0.043 |
On average, Experiment 3 (3D trilateration with room calibration factor) showed the best accuracy and Experiment 2 (3D trilateration without room calibration) the worst. Average difference in accuracy between Experiments 1 (2D trilateration) and 2 is only around 14%, whereas Experiment 3 has twice the accuracy of 1 and more than twice the accuracy of 2. In addition, Experiment 3 on average has a smaller standard deviation. Interestingly, test point 5, located in the middle of the room, gave approximately the same error in all three experiments. Overall, the three experiments produced stable sub-meter accuracy. Only in Experiment 2, the worst reading (test point 10) was calculated to be more than half a meter away from its true position, although when averaged with the other readings at this point produced an error of only 15.3 cm. Experiment 3, on average, had sub-decimeter accuracy (<10 cm).
In order to analyze whether there was a systematic direction/pattern in which trilateration calculations (on average) were displaced in relation to true position, arrow vectors drawn to scale indicating distance, and direction of error displacement were placed on the floor plan for each of the three experiments (Figure 3). In Experiment 1 there is no clear trend in which the error vector occurs, so it is unlikely to have been caused by systematic error. When compared to Experiment 3, the error vector is relatively large. Most likely this is the direct result of the mobile phone and microphones being positioned in the same plane. The speaker on the phone was pointing directly upward, so being on the same plane meant the source (mobile speaker) was rotated roughly 90 degrees away from each microphone. Given the highly directional nature of ultrasound, this resulted in weaker, less stable signal detection even though the average distance to each microphone was shorter. In the other two experiments, the phone was roughly 1.6 m lower than the microphones, resulting in the source speaker being positioned at an angle substantially less than 90 degrees to the microphones.
For Experiment 2, it can be observed that arrows mostly point inward, towards the center of the room—a predictable outcome. In Experiments 2 and 3, delay is calculated based on signals that arrived via direct line-of-sight, whereas the 2D position of the phone is calculated based on the projection of these direct lines-of-sight onto a 2D plane. A bigger height difference between microphones and the phone generally means reduced difference in the time-of-arrival, causing readings to appear closer to the center of the room. Unfortunately, the relationship between distance to microphones and delay reduction is not linear, making it necessary to know a phone’s position before the required compensation can be calculated. Since in our case the phone’s position is unknown before trilateration is done, it becomes necessary to calculate the projection of direct lines-of-sight onto a plane and incorporate them into the asynchronous trilateration procedure. This is a complex task and is left for future work, although overall positioning accuracy is still sub-meter without introduction of this correction. In Experiment 3 a simpler constant multiplier (room calibration factor) was used instead.
In Experiment 3 each delay was multiplied by a constant value of 1.1 (room calibration factor), which produced significant improvements in accuracy over Experiment 2 from 18 cm to 8 cm. Although the use of a constant multiplier may in some cases result in a decrease in accuracy, it appears to affect accuracy relatively less when compared to other factors. The biggest factor appears to be poor signal reception when the phone is moved to the corners or along the walls. Usually this happens if the microphone is located far away and the direction it is pointing is substantially different from the direction in which the phone is located. Possible solutions to this problem could be to use microphones that are less directional or add more microphones throughout the room. Reception in these extreme areas was also influenced by yaw-orientation of the phone. This was an unexpected factor. Theoretically, since the speaker points directly upwards, yaw-orientation should have no influence on the strength of the signal upon arrival, unless the phone’s speaker is also somewhat directional in its manufacture.
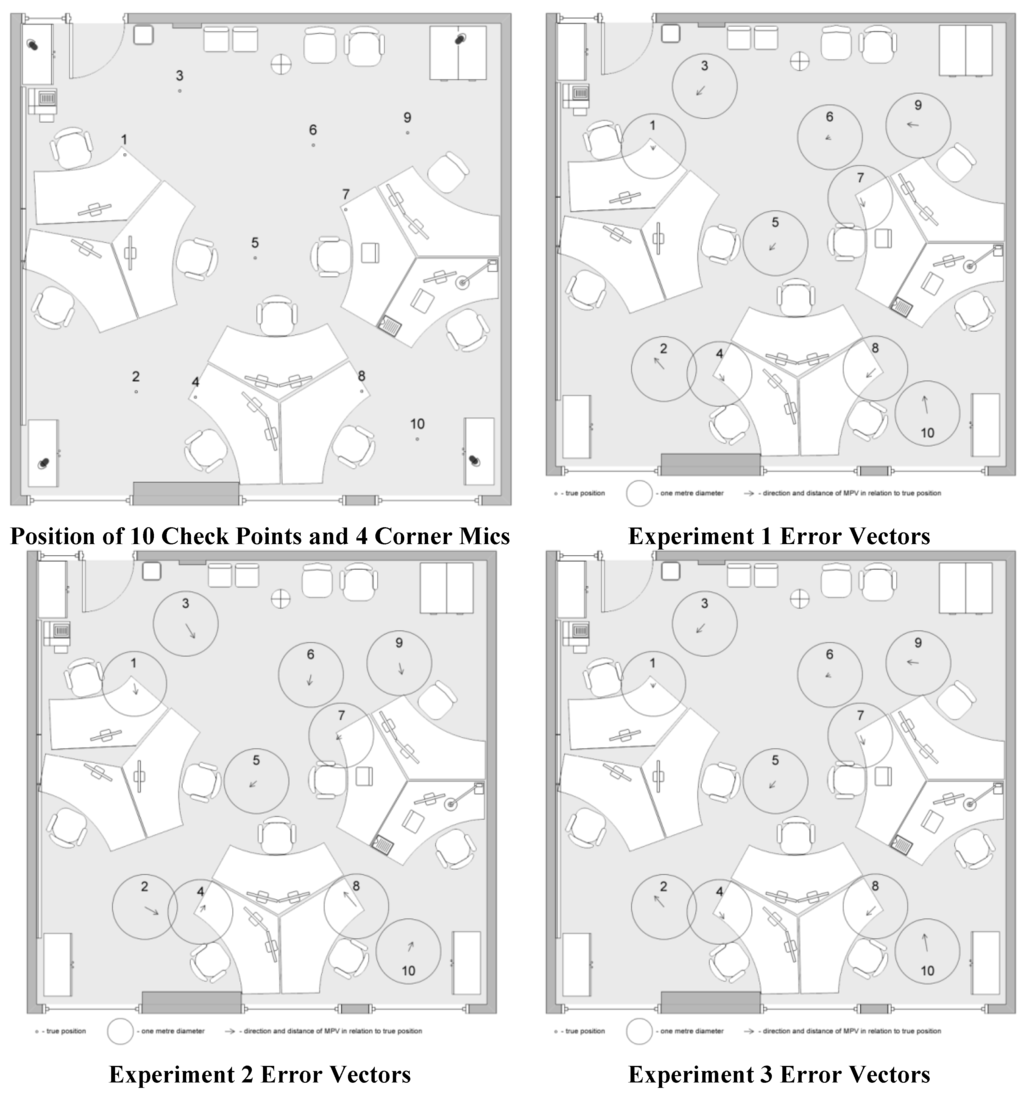
Figure 3.
The position of 10 test locations or check points (centerpoint of 1 m diameter circles) and error vector direction and distance from true position to MPV for Experiments 1, 2, and 3.
7. Speaker Tilt Angle Variation
In the previous section all experiments were done with the phone’s speaker facing upwards. This orientation should be optimal for maximizing signal reception if microphones were placed just below the ceiling in each corner of the room. Because ultrasound is very directional, it is important to minimize the angle between the direction the speaker is facing and the line-of-sight to all four microphones. With the speaker pointing upwards this angle will never exceed 90 degrees, which is important for this implementation as reception at four microphones is the minimum required.
Unfortunately the speaker on the front of the phone (used as the earpiece) is not very powerful. The multimedia speaker used for ringtones and other sounds that are supposed to be heard at distance is normally placed on the back of the phone. However, when the user interacts with the touchscreen, the speaker will normally be facing downwards. Therefore the aim of the next experiment is to test how well the positioning system works with the phone speaker inclined at various angles other than pointing straight up.
Unless the speaker is pointing directly upwards or downwards, it becomes important what yaw orientation the mobile phone has in addition to its tilt (pitch). Another factor is the introduction of the user holding the phone. He may or may not be blocking the direct line-of-sight to one of the four microphones. Because this test setup introduces so many new variables, some of them had to be taken out of the equation. Yaw orientation for each location was chosen in such a way that the speaker is facing the farthest microphone. In addition, the user tries not to block direct line-of-sight to each of the microphones if possible. The experiment is designed to measure what effects phone tilt (pitch) variation alone can have on positioning accuracy and failure rate. The variables omitted in this experiment are addressed in the next section.
7.1. Experiment Method
From this point onwards only 3D trilateration with room calibration was used for positioning. The same 10 check points were used as in Section 2. At each check point the user stood in such a way as not to block direct line-of-sight to any of the microphones. The phone was held in five different tilt orientations: speaker pointing downwards (0 degrees), halfway between horizontal and downwards (45 degrees), speaker pointing horizontal (90 degrees), halfway between horizontal and upwards (135 degrees), and speaker pointing upwards (180 degrees) (see Figure 4). For each of the five orientations 10 readings were made. For each check point, yaw angle was chosen in such a way that the speaker is oriented towards the farthest microphone in order to improve overall signal detection.
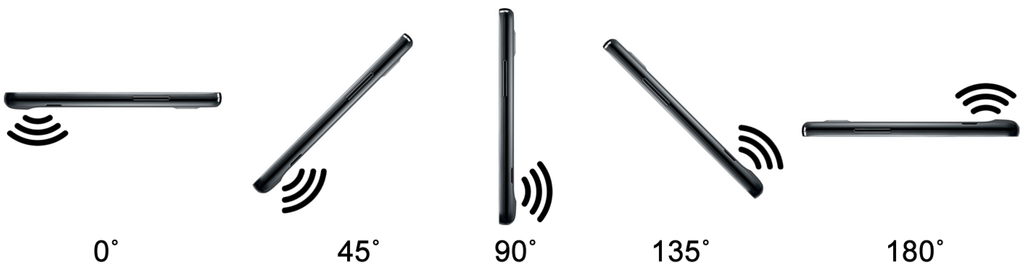
Figure 4.
Five different tilt orientations in which phone was tested. The curved sound bars show direction and orientation of the phone’s main speaker as it gets rotated from downwards to upwards.
7.2. Discussion
All 10 readings collected at the five different tilt angles at each check point were treated as one sample. For each sample the Most Probable Value (MPV) was calculated. The difference between MPV and true position of the check point as well as its standard deviation can be found in Table 3. Signal detection rates can be found in Table 4. From the average of all 10 check points it appears that accuracy steadily increases as the speaker is rotated from downward to upward orientation. However this trend is not true for every single point individually (see Figure 5).
Table 3.
Difference between MPV and true position ± standard deviation for different tilt angles. First column contains the check point number. Columns 2–6 contain error and standard deviation for each angle at which the phone was held. The bottom row shows average of all 10 check points.
| Chk Pt.# | 0° (downwards) | 45° | 90° | 135° | 180° (upwards) |
|---|---|---|---|---|---|
| 1 | 0.315 ± 0.106 | 0.319 ± 0.116 | 0.105 ± 0.062 | 0.076 ± 0.036 | 0.087 ± 0.016 |
| 2 | 0.728 ± 0.282 | 0.286 ± 0.045 | 0.203 ± 0.045 | 0.176 ± 0.023 | 0.032 ± 0.032 |
| 3 | 0.255 ± 0.038 | 0.209 ± 0.042 | 0.174 ± 0.026 | 0.191 ± 0.018 | 0.132 ± 0.022 |
| 4 | 0.199 ± 0.138 | 0.221 ± 0.049 | 0.140 ± 0.121 | 0.200 ± 0.132 | 0.115 ± 0.028 |
| 5 | 0.159 ± 0.107 | 0.077 ± 0.061 | 0.698 ± 0.040 | 0.209 ± 0.024 | 0.171 ± 0.013 |
| 6 | 0.412 ± 0.144 | 0.033 ± 0.094 | 0.127 ± 0.022 | 0.026 ± 0.029 | 0.062 ± 0.013 |
| 7 | 0.256 ± 0.200 | 0.537 ± 0.054 | 0.066 ± 0.049 | 0.319 ± 0.020 | 0.175 ± 0.021 |
| 8 | 0.492 ± 0.052 | 0.457 ± 0.210 | 0.553 ± 0.472 | 0.079 ± 0.035 | 0.27 ± 0.025 |
| 9 | 0.674 ± 0.099 | 0.735 ± 0.026 | 0.210 ± 0.035 | 0.147 ± 0.037 | 0.122 ± 0.013 |
| 10 | 0.243 ± 0.023 | 0.423 ± 0.105 | 0.559 ± 0.139 | 0.255 ± 0.043 | 0.102 ± 0.031 |
| Avg | 0.373 ± 0.119 | 0.330 ± 0.080 | 0.283 ± 0.101 | 0.168 ± 0.040 | 0.127 ± 0.021 |
Table 4.
Percentage of detected signals for different speaker orientations. First column contains the check point number. Columns 2, 3, 4, 5, and 6 contain the percentage of detected signals for each angle at which the phone was held.
| Chk Pt.# | 0° (downwards) | 45° | 90° | 135° | 180° (upwards) |
|---|---|---|---|---|---|
| 1 | 100 | 100 | 100 | 100 | 100 |
| 2 | 100 | 100 | 100 | 100 | 100 |
| 3 | 80 | 100 | 100 | 80 | 100 |
| 4 | 90 | 100 | 100 | 90 | 100 |
| 5 | 100 | 90 | 100 | 100 | 100 |
| 6 | 100 | 100 | 100 | 100 | 100 |
| 7 | 90 | 100 | 100 | 70 | 100 |
| 8 | 100 | 100 | 100 | 100 | 100 |
| 9 | 70 | 100 | 100 | 100 | 100 |
| 10 | 30 | 80 | 100 | 100 | 100 |
Angles 90° (horizontal) and 180° (upward) are the only speaker angles that have 100% detection. However 90° has a huge spread in accuracy from some of the worst results to results on par with upward orientation. Interestingly, accuracies for tilt angle 90° tend to be either very good or very bad, which illustrates the importance of direction when dealing with sound waves. The worst accuracy for 90° was recorded at check point five, which is roughly the centre of the room. Average results for 180° (speaker up) are 4.5 cm worse than reported in Table 2 probably due to a real user now holding the phone—instead of placing the phone on a tripod. Holding the phone in hand makes exact placement of the phone over the check point less accurate and the user’s body could also interfere with direct line-of-sight of the signal. Accuracies for some check points at 0° may appear misleading. For example point 10, which is the farthest point from the centre of the room appears to have good accuracy (24 cm) at tilt angle 0°, however detection rate for this point and angle is only 30%. Angle 45° has a much better detection rate than angles 0° and 135°, and has the greatest spread of accuracies when compared to every other orientation. From a practical point of view, angle 135° has little importance, because a user is not likely to hold the phone in such an awkward orientation through normal usage.
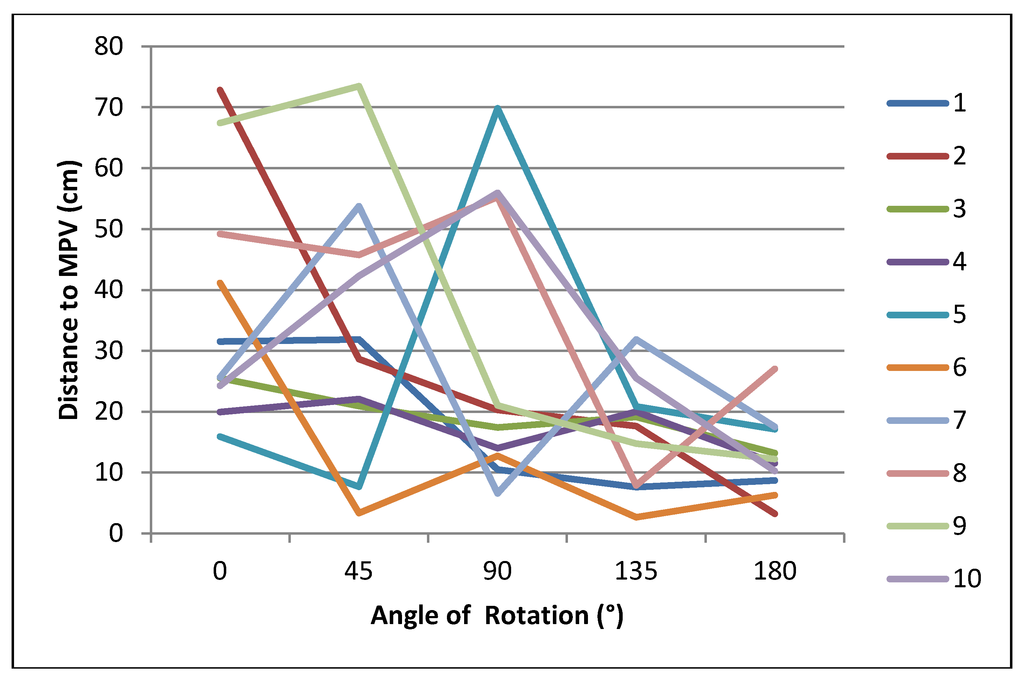
Figure 5.
The change of distance (in cm) between MPV and correct position as the speaker is tilted from downward to upward orientation. Each color represents one check point. Vertical axis is distance measured in cm. Horizontal axis is angle of rotation with 0° being downward and 180° being upward. Note how accuracy increases as speaker angle approaches 180° (upwards). In all cases positioning accuracy remains sub-meter.
In terms of accuracy, detection rate, and consistency, speaker angle 180° (upward) is undoubtedly the most reliable orientation. This suggests that unless some parameters of the system are changed such as increased sound volume, less directional microphones, or lower signal detection thresholds, the most accurate approach would be to instruct users to momentarily flip their phone upside down (i.e., point display screen at floor) and employ the phone’s accelerometers to detect this flip to trigger the ultrasonic “beep” procedure. Although this may not be ideal for user interface interaction, increased positional accuracy and reliability can be a valuable trade off for enhancing the user’s navigation experience. However, it should be noted that overall positioning accuracy is still sub-meter in all speaker orientations.
8. Speaker Direction and Signal Obstruction
This section explores two factors excluded from above experiments to reduce the number of variables:
- Yaw orientation of the phone: Ultrasound is very directional and orientation of the speaker in relation to a microphone has significant effect on reception quality. Unless the speaker is pointing directly upward or downward, its yaw orientation (rotation about Z axis) is going to impact reception quality at each of the four microphones. This in turn can influence quality of signal arrival timestamping and therefore trilateration accuracy.
- User obstructing direct line-of-sight between phone and microphone: Unlike low frequency sounds that have a long wavelength, ultrasound with it high frequency sound has poor obstacle penetration. This means that maintaining a direct line-of-sight between the phone and all four microphones is important in order to achieve best accuracy. Blocking direct line-of-sight to one of the microphones can negatively impact signal intensity on reception and introduce lag due to the signal arriving via diffraction. Both poor reception and lag can reduce trilateration accuracy. The most likely scenario where one of the microphones would be blocked is when the user himself is standing in the path of the signal. Although microphones were placed on the ceiling to mitigate this problem, in some cases direct line-of-sight can still be blocked.
8.1. Experiment Method
Positioning was done in the same test lab as in the previous section. However a different set of four check points (P1,P2,P3,P4) was used this time. The first check point (P1) is located precisely in the center of the room and each next check point falls along a straight line to one of the corner mics at 1 m intervals. At each of the four check points the user stood in eight different locations around the check point while holding the phone directly over the check point (Figure 6). In positions B, D, F, H the user would stand in the direct line-of-sight between the phone and one of the microphones. These positions are referred to as “blocked”. In positions A, C, E, G the user stands in such a way as to not block the path to any microphone. These positions are referred to as “direct”.
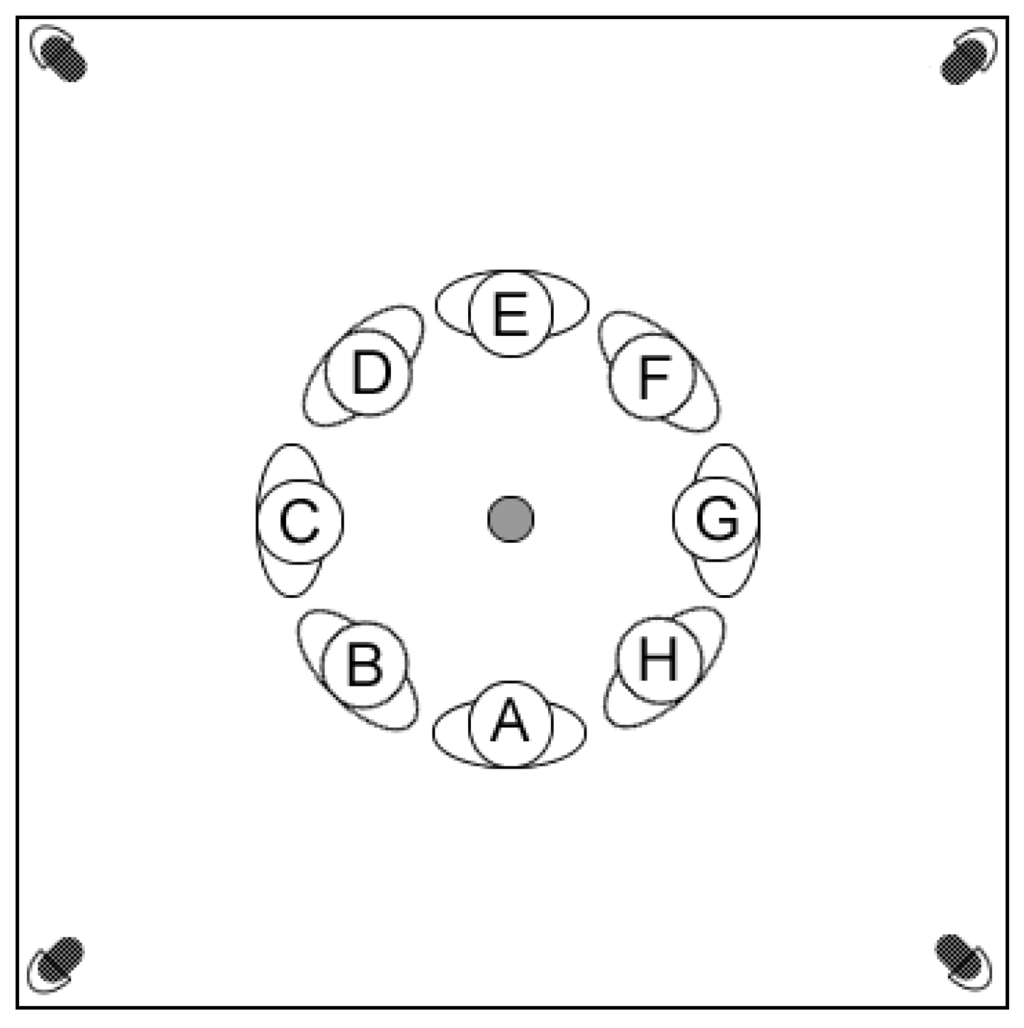
Figure 6.
Locations where user stands around each check point. Grey circle in centre indicates check point, over which the smartphone is held. The 8 silhouettes marked A–H show a top view of the user standing with their back facing outwards in all cases.
In each of the eight positions the phone was held in three different tilt orientations: speaker facing upwards (up), facing the user (back), and facing away from the user (forward). In each orientation the ultrasound signal was produced 10 times, which is treated as one sample. Altogether for this experiment 960 signals were sent, making 96 samples.
8.2. Discussion
For each sample the MPV was calculated and the difference between MPV and true position of the check point was calculated. The results for each checkpoint were divided into two groups: blocked (B, D, F, H), where the user stands in the way of one of the microphones and direct (A, C, E, G), where the user is not in the path to any microphone. The results can be found in Table 5.
Table 5.
Difference between MPV and true position ± standard deviation for each check point, user location, and orientation. First column identifies combination of phone orientation and user location. Columns 2–5 contain results for each of the four check points in meters.
| Orientation | Check Point 1 | Check Point 2 | Check Point 3 | Check Point 4 |
|---|---|---|---|---|
| back-blocked | 0.293 ± 0.109 | 0.353 ± 0.115 | 0.424 ± 0.071 | 0.460 ± 0.075 |
| back-direct | 0.330 ± 0.085 | 0.305 ± 0.082 | 0.318 ± 0.081 | 0.907 ± 0.232 |
| forward-blocked | 1.464 ± 0.149 | 1.428 ± 0.131 | 1.771 ± 0.160 | 1.074 ± 0.103 |
| forward-direct | 0.266 ± 0.080 | 0.270 ± 0.108 | 0.295 ± 0.044 | 1.539 ± 0.222 |
| up-blocked | 0.142 ± 0.020 | 0.172 ± 0.047 | 0.110 ± 0.025 | 0.141 ± 0.041 |
| up-direct | 0.114 ± 0.015 | 0.135 ± 0.030 | 0.139 ± 0.033 | 0.141 ± 0.016 |
In terms of accuracy, upward speaker orientation gives consistent results in the 10–20 cm range regardless of where the user stands, which suggests that in this orientation, the user’s location has little or no effect on accuracy. Regarding the other four configurations, forward-blocked is consistently very inaccurate across all four check points, a direct result of a disadvantageous combination of user location and speaker orientation. Ultrasound is very directional and will have the least energy directly behind the speaker. In forward orientation, the user stands directly behind the speaker, making the signal even weaker in this direction. In back-blocked configurations, a microphone that is directly in front of the speaker is the one being blocked, which makes the two factors cancel each other out. As a result, back-blocked and the other two horizontal configurations where the user does not block any microphones show very similar accuracy for check points 1–3, ranging between 20 and 40 cm. Results for check point 4 show the worse accuracy ranging from 40 cm to 1.5 m. However, these results are less reliable since around half of the signals were not detected at all, which resulted in a smaller sample size.
Analysis of the signal detection failure rate reveals similar trends with discrepancy between the first three check points and the last check point being more pronounced. Upward orientation has 0% failure rate at check points 1–3. At check point 4 there was 2.5% failure rate in direct configuration and 10% failure rate in blocked configuration. Because the phone is far from the centre of the room at check point 4, the signal reception is very weak at the opposite corner and almost as weak at the two other corners.
9. Conclusions
Ultrasound trilateration was identified as a very promising approach for indoor mobile positioning. Signals travelling at the speed of sound offer very good accuracy, well below one meter, even with standard smartphone speaker hardware. In addition, the 20–22 kHz range is normally inaudible to humans but can be reproduced by mobile phone speakers and captured with cheap, standard microphones. Because no specialized hardware is used on the client side, the user only needs to make a software (app) installation to use the Lok8 positioning system. The highly directional nature of ultrasound, susceptibility to certain high frequency background noises, and the need for line-of-sight between speaker and receiver were identified as the biggest obstacles to positioning accuracy.
A prototype of the positioning system was developed and tested in an office environment for accuracy and other possible shortcomings. Despite the obstacles listed above, it was possible to get full positioning coverage of a 7 × 7 m room with four microphones placed directly below the ceiling corners and achieve a satisfactory degree of reliability. On average the system produced accuracies approaching ±10 cm, an order of magnitude better than contemporary indoor locationing approaches.
The developed indoor positioning system can be evaluated in terms of the user scenarios given in Section 2. Scenarios 1 and 2 involve pointing the phone at an object and doing directional querying. Scenarios 2–4 involve guiding a user around the building. Centimeter-level accuracy means that objects the size of a vase can be correctly identified and queried, provided that orientation of the phone can also be determined with sufficient accuracy. In addition, a positioning fix can be done almost instantly without the need for the system to run continuously in the background, which is ideal for scenarios like directional querying and for improving battery life. The fact that the phone should be momentarily flipped upside-down (i.e., speaker facing up) to get the best accuracy is a disadvantage. Doing a positional fix with the screen up (i.e., speaker facing down), results in positional accuracy dropping to 30–40 cm.
Although ultrasound positioning, in most cases, will not work well from inside a bag or pocket, this is not a problem in any of the given scenarios because there is no need for tracking the user continuously in the background. As soon as the user takes out the phone and starts to interact with the app, his position will be immediately calculated and used by the program. The ability to work in the background is only important if we want to track and record how people move in the building, which was not among our objectives.
The Lok8 positioning system was tested in a typical university office/lab environment where it was possible to maintain a direct line-of-sight to all four microphones. There are many environments where this is practical: hospitals, museums, conference halls. In environments where tall obstacles (e.g., store shelves, cubicle partitions) are prevalent, line-of-sight can still be maintained by placing more microphones in the space. Considering microphones can be fairly inexpensive to purchase, this is not impractical. There are occasional problems with accuracy when line-of-sight is blocked or the user is outside the optimal reception space of one of the microphones. This problem can also be addressed by adding more microphones or possibly by using omnidirectional microphones. Notwithstanding these limitations, the Lok8 mobile positioning system is currently the only indoor locationing solution for commercial off-the-shelf smartphones that can offer such reliable indoor positioning consistently with sub-meter accuracy in real-time.
Acknowledgments
The authors wish to thank the Higher Education Authority (HEA) in Ireland and their Technological Sector Research Strand III for funding the ultrasound work in the Lok8 project. Preparation of this publication and the asynchronous trilateration work was funded by a Strategic Research Cluster Grant (07/SRC/I1168) by Science Foundation Ireland under the National Development Plan. The authors gratefully acknowledge this support.
Conflict of Interest
The authors declare no conflict of interest.
References
- Borio, D.; O’Driscoll, C.; Fortuny-Guasch, J. Pulsed Pseudolite Signal Effects on Non-Participating GNSS Receivers. In Proceedings of 2011 International Conference on Indoor Positioning and Indoor Navigation (IPIN), Guimarães, Portugal, 21–23 September 2011; pp. 1–6.
- Hoene, C.; Willmann, J. Four-Way TOA and Software-Based Trilateration of IEEE 802.11 Devices. In Proceedings of IEEE 19th International Symposium on PersonalIndoor and Mobile Radio Communications, 2008 (PIMRC 2008), Cannes, France, 15–18 September 2008; pp. 1–6.
- Thapa, K.; Case, S. An Indoor Positioning Service for Bluetooth Ad Hoc Networks. In Proceedings of MICS, Duluth, MN, USA, 11–12 April 2003.
- Mestre, P.; Serodio, C.; Coutinho, L.; Reigoto, L.; Matias, J. Hybrid Technique for Fingerprinting Using IEEE802.11 Wireless Networks. In Proceedings of 2011 International Conference on Indoor Positioning and Indoor Navigation (IPIN), Guimarães, Portugal, 21–23 September 2011.
- Ferris, B.; Hähnel, D.; Fox, D. Gaussian Processes for Signal Strength-Based Location Estimation. In Proceedings of Robotics Science and Systems, Philadelphia, PA, USA, 16–19 August 2006.
- Maddio, S.; Bencini, L.; Cidronali, A.; Manes, G. A Single Anchor Direction of Arrival Positioning System Augmenting Standard Wireless Communication Technology. In Proceedings of IPIN 2010, Zurich, Switzerland, 15–17 September 2010; pp. 19–20.
- Perez, M. Nokia Shows off Super Accurate, In-Door 3D Mapping. Available online: www.intomobile.com/2011/11/29/nokia-shows-off-super-accurate-3d-indoor-mapping/ (accessed on 17 January 2012).
- Otsason, V.; Varshavsky, A.; LaMarca, A.; De Lara, E. Accurate GSM Indoor Localization. In Proceedings of 7th International Conference UbiComp 2005, Tokyo, Japan, 11–14 September 2005; pp. 141–158.
- Ball, M. Sensors & Systems, Google Has a Strong Start on the Indoor Location Frontier. 2012. Available online: http://www.sensysmag.com/dialog/interviews/28563-google-has-a-strong-start-on-the-indoor-location-frontier.html (accessed on 6 November 2012).
- Zhou, S.; Pollard, J. Position measurement using bluetooth. IEEE Trans. Consum. Electron. 2006, 52, 555–558. [Google Scholar] [CrossRef]
- Pei, L.; Chen, R.; Liu, J.; Kuusniemi, H.; Tenhunen, T.; Chen, Y. Inquiry-Based Bluetooth Indoor Positioning via RSSI Probability Distributions. In Proceedings of The Second International Conference on Advances in Satellite and Space Communications (SPACOMM 2010), Athens, Greece, 13–19 June 2010.
- Pals, H.; Dai, Z.; Grabowski, J.; Neukirchen, H. UML-Based Modeling of Roaming with Bluetooth Devices. In Proceedings of The First Hangzhou-Lübeck Workshop on Software Engineering 2003, Hangzhou, China, 1–2 November 2003.
- Subhan, F.; Hasbullah, H. Designing a Roaming Protocol for Bluetooth Networks. In Proceedings of National Postgraduate Conference (NPC) 2009, Universiti Teknologi Petronas, Perak, Malaysia, 25–26 March 2009.
- Peng, C.; Shen, G.; Zhang, Y.; Li, Y.; Tan, K. BeepBeep: A High Accuracy Acoustic Ranging System Using COTS Mobile Devices. In Proceedings of the 5th International Conference on Embedded Networked Sensor Systems (SenSys ’07), Sydney, Australia, 6–9 November 2007; pp. 1–14.
- Borriello, G.; Liu, A.; Offer, T.; Palistrant, C.; Sharp, R. WALRUS: Wireless Acoustic Location with Room-Level Resolution Using Ultrasound. In Proceedings of the 3rd International Conference on Mobile Systems, Applications, and Services (MobiSys 2005), Seattle, WA, USA, 6–8 June 2005; pp. 191–203.
- Filonenko, V.; Cullen, C.; Carswell, J. Investigating Ultrasonic Positioning on Mobile Phones. In Proceedings of International Conference on Indoor Positioning and Indoor Navigation (IPIN), Zürich, Switzerland, 15–17 September 2010.
- Harter, A.; Hopper, A.; Steggles, P.; Ward, A.; Webster, P. The Anatomy of a Context-Aware Application. In Proceedings of The 5th Annual ACM/IEEE International Conference on Mobile Computing and Networking (MobiCom ’99), Seattle, WA, USA, 15–19 August 1999; pp. 59–68.
- Addlesee, M.; Curwen, R.; Hodges, S.; Newman, J.; Steggles, P.; Ward, A.; Hopper, A. Implementing a sentient computing system. Computer 2001, 34, 50–56. [Google Scholar]
- Priyantha, N. The Cricket Indoor Location System. Ph.D. Thesis, Department of Electrical Engineering and Computer Science, Massachusetts Institute of Technology, Cambridge, MA, USA, 2005. [Google Scholar]
- Minami, M.; Fukuju, Y.; Hirasawa, K.; Yokoyama, S.; Mizumachi, M.; Morikawa, H.; Aoyama, T. DOLPHIN: A practical approach for implementing a fully distributed indoor ultrasonic positioning system. Lect. Note. Comput. Sci. 2004, 3205, 347–365. [Google Scholar]
- Hazas, M.; Hopper, A. Broadband ultrasonic location systems for improved indoor positioning. IEEE Trans. Mob. Comput. 2006. [Google Scholar] [CrossRef]
- Randell, C.; Muller, H. Low cost indoor positioning system. Lect. Note. Comput. Sci. 2001, 2201, 42–48. [Google Scholar] [CrossRef]
- Williams, B.; Klein, G.; Reid, I. Real-Time SLAM Relocalisation. In Proceedings of IEEE 11th International Conference on Computer Vision, 2007 (ICCV 2007), Rio de Janeiro, Brazil, 14–20 October 2007; pp. 1–8.
- Wagner, D.; Schmalstieg, D. First Steps Towards Handheld Augmented Reality. In Proceedings of 7th IEEE International Symposium on Wearable Computers, White Plains, USA, 21–23 October 2003; pp. 127–136.
- Siciliano, B.; Khatib, O. Springer Handbook of Robotics; Springer: Berlin, Germany, 2008. [Google Scholar]
- Bowditch, N. Dead Reckoning. In The American Practical Navigator: An Epitome of Navigation; Reprint Services Corp: Temecula, CA, USA, 1995. [Google Scholar]
- Randell, C.; Djiallis, C.; Muller, H. Personal Position Measurement Using Dead Reckoning. In Proceedings of 7th IEEE International Symposium on Wearable Computers, White Plains, NY, USA, 21–23 October 2003; pp. 166–173.
- Goyal, P.; Ribeiroy, V.; Saranz, H.; Kumarx, A. Strap-Down Pedestrian Dead-Reckoning System. In Proceedings of 2011 International Conference on Indoor Positioning and Indoor Navigation (IPIN), Guimarães, Portugal, 21–23 September 2011; pp. 1–7.
- Filonenko, V.; Cullen, C.; Carswell, J. Asynchronous ultrasonic trilateration for indoor positioning of mobile phones. Lect. Note. Comput. Sci. 2012, 7236, 33–46. [Google Scholar] [CrossRef]
- Filonenko, V. Asynchronous Ultrasonic Trilateration for Indoor Positioning of Mobile Phones. Ph.D. Thesis, Dublin Institute of Technology, Dublin, Ireland, 2012. [Google Scholar]
- Paarmann, L. Design and Analysis of Analog Filters: A Signal Processing Perspective; Springer: Berlin, Germany, 2001. [Google Scholar]
© 2013 by the authors; licensee MDPI, Basel, Switzerland. This article is an open access article distributed under the terms and conditions of the Creative Commons Attribution license (http://creativecommons.org/licenses/by/3.0/).