Systematic Observation of EUV Spectra from Highly Charged Lanthanide Ions in the Large Helical Device


1
National Institute for Fusion Science, 322-6 Oroshi-cho, Toki 509-5292, Japan
2
Sophia University, 7-1 Kioi-cho, Chiyoda-ku, Tokyo 102-8554, Japan
3
SOKENDAI (The Graduate University for Advanced Studies), Shonan Village, Hayama 240-0193, Japan
4
Chubu University, 1200 Matsumoto-cho, Kasugai 487-8501, Japan
*
Author to whom correspondence should be addressed.
Atoms 2018, 6(2), 24; https://doi.org/10.3390/atoms6020024
Submission received: 27 March 2018
/
Revised: 24 April 2018
/
Accepted: 25 April 2018
/
Published: 1 May 2018
(This article belongs to the Special Issue Current Developments and Applications of Atomic Structure and Radiative Process Investigations)
Abstract
:We have systematically observed extreme ultraviolet (EUV) spectra from highly charged ions of nine lanthanide elements with atomic numbers from 60–70 in optically thin plasmas produced in the Large Helical Device (LHD). Discrete spectral features with isolated lines from relatively higher charge states around Cu-like ions are observed under high temperature conditions around 2 keV, while narrowed quasicontinuum features from charge states around Ag-like ions are observed under low temperature conditions below 1 keV. The positions of the lines and the quasicontinuum features systematically move to shorter wavelengths as the atomic number increases. The wavelengths of the main peaks in the quasicontinuum features agree well with those of singlet transitions of Pd-like ions reported previously. We have easily identified discrete spectral lines from Cu-like and Ag-like ions, some of which are experimentally identified for the first time in the LHD. Their wavelengths are compared with theoretical calculations using a GRASP family of atomic codes. The theoretical values are synthesized to the LHD experimental data for the cases of Ag- and Pd-like ions.
1. Introduction
It is well known that bright emission spectra from highly charged ions of lanthanide elements (Z = 57–71) appear in the extreme ultraviolet (EUV) or soft X-ray wavelength range [1,2]. In particular, emissions due to n = 4–4 transitions of lanthanide ions having N shell outermost electrons mainly fall into the wavelength range of 5–12 nm. The emission spectra corresponding to this type of transition attract interest in the field of basic atomic physics because of the more pronounced influences of the relativistic effects and multi-electron correlation [3,4]. In addition, another interest has recently been prompted by their possible application to the next generation light sources for EUV lithography [5,6,7,8,9,10,11].
The spectral features of this type of emission have systematically been investigated so far using laser-produced plasmas. O’Sullivan and Carroll [1] carried out systematic observations of EUV spectra involving lanthanide elements through lutetium (Lu) using photographic plates. More recently, Zeng et al. [2] recorded a similar series of spectra for the elements with atomic numbers Z = 57–82 using a microchannel plate detector. In these studies, quasicontinuum band emissions, the so-called unresolved transition array (UTA) [12], originating from ion stages with 4d and 4f outermost electrons have been observed with fewer isolated lines. Reader and Luther [13,14] observed the spectra of some of the lanthanide elements using a high-energy laser-produced plasma, which resulted in the identifications of some isolated lines of the n = 4–4 transitions of highly charged Cu-like ions. However, it is generally difficult to investigate emission spectra from laser-produced plasmas because higher opacities often make the spectra quite complex with less structure.
Magnetically-confined plasmas for fusion research having higher electron temperatures ( > 1 keV) and lower electron densities ( ≃ 10 m) would be good complementary light sources for this kind of spectroscopic study because of their lower opacities. In the Texas Experimental Tokamak (TEXT), the lanthanide elements of praseodymium (Pr), europium (Eu), gadolinium (Gd), dysprosium (Dy) and ytterbium (Yb) have been injected into plasmas by the laser blow off technique. The UTA features with bandwidths of about 1 nm were observed together with some isolated lines of highly charged Cu-, Zn- and Ga-like ions [15,16,17,18]. On the other hand, charge-separated EUV spectra from samarium (Sm), Gd, Dy, erbium (Er) and Yb have recently been observed in electron beam ion trap (EBIT) facilities for relatively higher electron beam energies [19,20,21,22].
We have already reported the observations of EUV spectra from highly charged ions of neodymium (Nd), Gd, terbium (Tb) and Dy in the Large Helical Device (LHD), a large-scale facility for magnetically-confined plasmas at the National Institute for Fusion Science [23,24,25]. Our studies are different from the earlier works in TEXT; we injected the elements directly deep inside the plasmas by a tracer encapsulated solid pellet (TESPEL) [26,27], which leads to a more dynamic change in electron temperature followed by the formation of plasmas with hollow temperature profiles. This gives rise to absolutely discrete features and very narrowed UTA features unlike those in the earlier works.
We have recently extended similar experiments to the other lanthanide elements, which results in new experimental identifications of some of the isolated spectral lines, as briefly reported in [28]. In this article, we describe the details of a series of EUV spectra observed in the LHD for the elements with atomic numbers Z = 60–70 in terms of Z dependence. To help the present identification of the spectral lines, we have also carried out atomic structure calculations based on a multi-configuration Dirac–Fock (MCDF) approximation. The results have been compared with the present experiment, as well as previous ones in the literature. For the cases of Ag-like and Pd-like ions, we have fitted the theoretical values to the LHD experiments and have obtained a set of synthesized spectral wavelengths that are predictable for all the lanthanide elements.
2. Experimental
The experimental setup and procedure for all the lanthanide elements are the same as those in our previous works [23,24,25]. The LHD is one of the so-called helical devices dedicated for magnetically-confined fusion research. High temperature hydrogen (or its isotopes) plasmas are confined in nested magnetic flux surfaces produced in a torus-shape vacuum chamber, in a similar way to the so-called tokamaks. Unlike tokamaks, however, the magnetic flux surfaces for the plasma confinement are produced only by external coils without any plasma current drive in helical devices. In the LHD, the magnetic fields of about 2.7 T are stably sustained by several superconducting coil systems. An overview of the recent results in the LHD can be found in [29].
In the present experiments, optically thin hydrogen plasmas are produced by neutral beam injection (NBI) heating in the LHD. The duration of the neutral beams is typically 2–3 s. Small amounts (≃10 atoms) of powders or fragments of pure lanthanide metals were introduced into the hydrogen plasmas using the TESPEL injection system [26,27]. Typical electron temperature and density in the plasma core are 2 keV and 3 × 10 m before the TESPEL injection, respectively. If we assume the uniform distribution of the injected elements over the entire plasma, the concentration of the impurity ion is less than 0.1% because the volume of the LHD plasma is approximately 30 m. In order to investigate a wide range of electron temperature in a single discharge, the NBI heating power is usually reduced by several tens of percent from the initial value (≃10–13 MW) at some timing after the TESPEL injection. In general, the temperature begins to drop from the plasma core after the reduction of the heating power, which is often followed by the formation of hollow plasmas, in which the core temperature is zero, but a cold plasma is still maintained in the surrounding region. Examples of this phenomenon for Gd and Tb injections have been described in [23,25].
Time evolutions of EUV spectra are recorded by a 2-m Schwob–Fraenkel grazing incidence spectrometer [30] with a frame rate of 5 or 10 Hz. A grating with a 600-mm groove density is selected for better wavelength resolution (≃0.01 nm) and a moderate width of the wavelength coverage (≃3 nm) with a 50 mm-long microchannel plate detector movable along a Rowland circle. The wavelength range was tuned to where the UTA emissions of n = 4–4 transitions of open 4d subshell ions are expected to appear. Therefore, the choice of the wavelength range depends on the element. The FWHM (full width at half maximum) of the measured spectral lines in these wavelength ranges is roughly 0.015–0.020 nm, which primarily originates from the instrumental width due to a spread of an electron cloud at the exit of the microchannel plate. Stark or other line broadenings are ignorable in comparison with the instrumental width because the electron density is as low as 10 m. The line of sight of the spectrometer was fixed along a line passing through the plasma center. Electron density and temperature distributions along the line of sight are measured by a Thomson scattering diagnostic system with high spatial and temporal resolutions [31,32]. Line-averaged electron density is measured by a far infrared (FIR) interferometer, which can be utilized for the absolute calibration of the electron density distributions measured by the Thomson scattering. The absolute wavelength has been calibrated using the positions of well-known lines of intrinsic (boron, carbon, iron and nickel) and intentionally injected (nitrogen and neon) impurity ions. The uncertainty of the calibrated wavelength depends on the wavelength range and the choice of the reference lines. Judging from the discrepancy between the fitting curves and the reference lines, the wavelength uncertainty for all the lanthanide elements in this study is approximately less than 0.004 nm.
3. Theoretical Calculation
To help the present spectral line analysis, we have carried out atomic structure calculations based on the MCDF approximation. We employed the General purpose Relativistic Atomic Structure Program 92 (GRASP92) [33] with a modification for the electronic structure, and the Relativistic Atomic Transition and Ionization Properties (RATIP) code [34] for the transition wavelengths and strengths. One of the advantages of these programs is that we can treat the two electron non-local exchange integrals as they are [35]; we can properly evaluate the electron correlations through the interactions between the relevant configuration state functions (CSFs). Though the Breit interactions and quantum electrodynamics (QED) corrections are also included in the codes as perturbation, their effects are unimportant in the present case.
An atomic state function (ASF) , which is the target for the optimization in an MCDF calculation, is a linear combination of the CSFs . That is, where is the expansion coefficient, which reflects the interactions between the CSFs and can be called the mixing coefficient due to the configuration interactions (CIs). Both and the single electron orbitals in are optimized simultaneously in the MCDF procedure. We optimize multiple ASFs simultaneously with equal weights in the present calculation. Although we can take into account the orbital relaxations in RATIP, we adopt a common basis orbital set in both states before and after the optical transitions. Because we are considering the intra-N-shell transitions of open N-shell atomic ions, the relaxation of the inner-shell orbitals due to the transition is expected to be quite small. Further on, by using the common basis orbitals, we can avoid the risk of large errors in the energy offset that comes from the core electrons.
In the MCDF procedure of the present calculation, we included all the CSFs with one electron excitations to the subshell orbitals in the N-shell from the N-shell orbitals in the ground states, and further, orbitals are also considered as correlation orbitals. For instance, to calculate , we considered the configurations , , and as reference configurations. To gain better accuracy, we further tried to carry out the MCDF optimization restricting the ASFs to a pair of lower and upper energy levels of the relevant optical transition. In the second step, we performed a CI procedure allowing for the excitations of up to two electrons from the ground state configuration. By using the RATIP package [34], we calculated the wavelengths and the strengths of electric dipole transitions for the combinations of the ASFs relevant to the desired transition.
4. Z Dependence of the Spectra
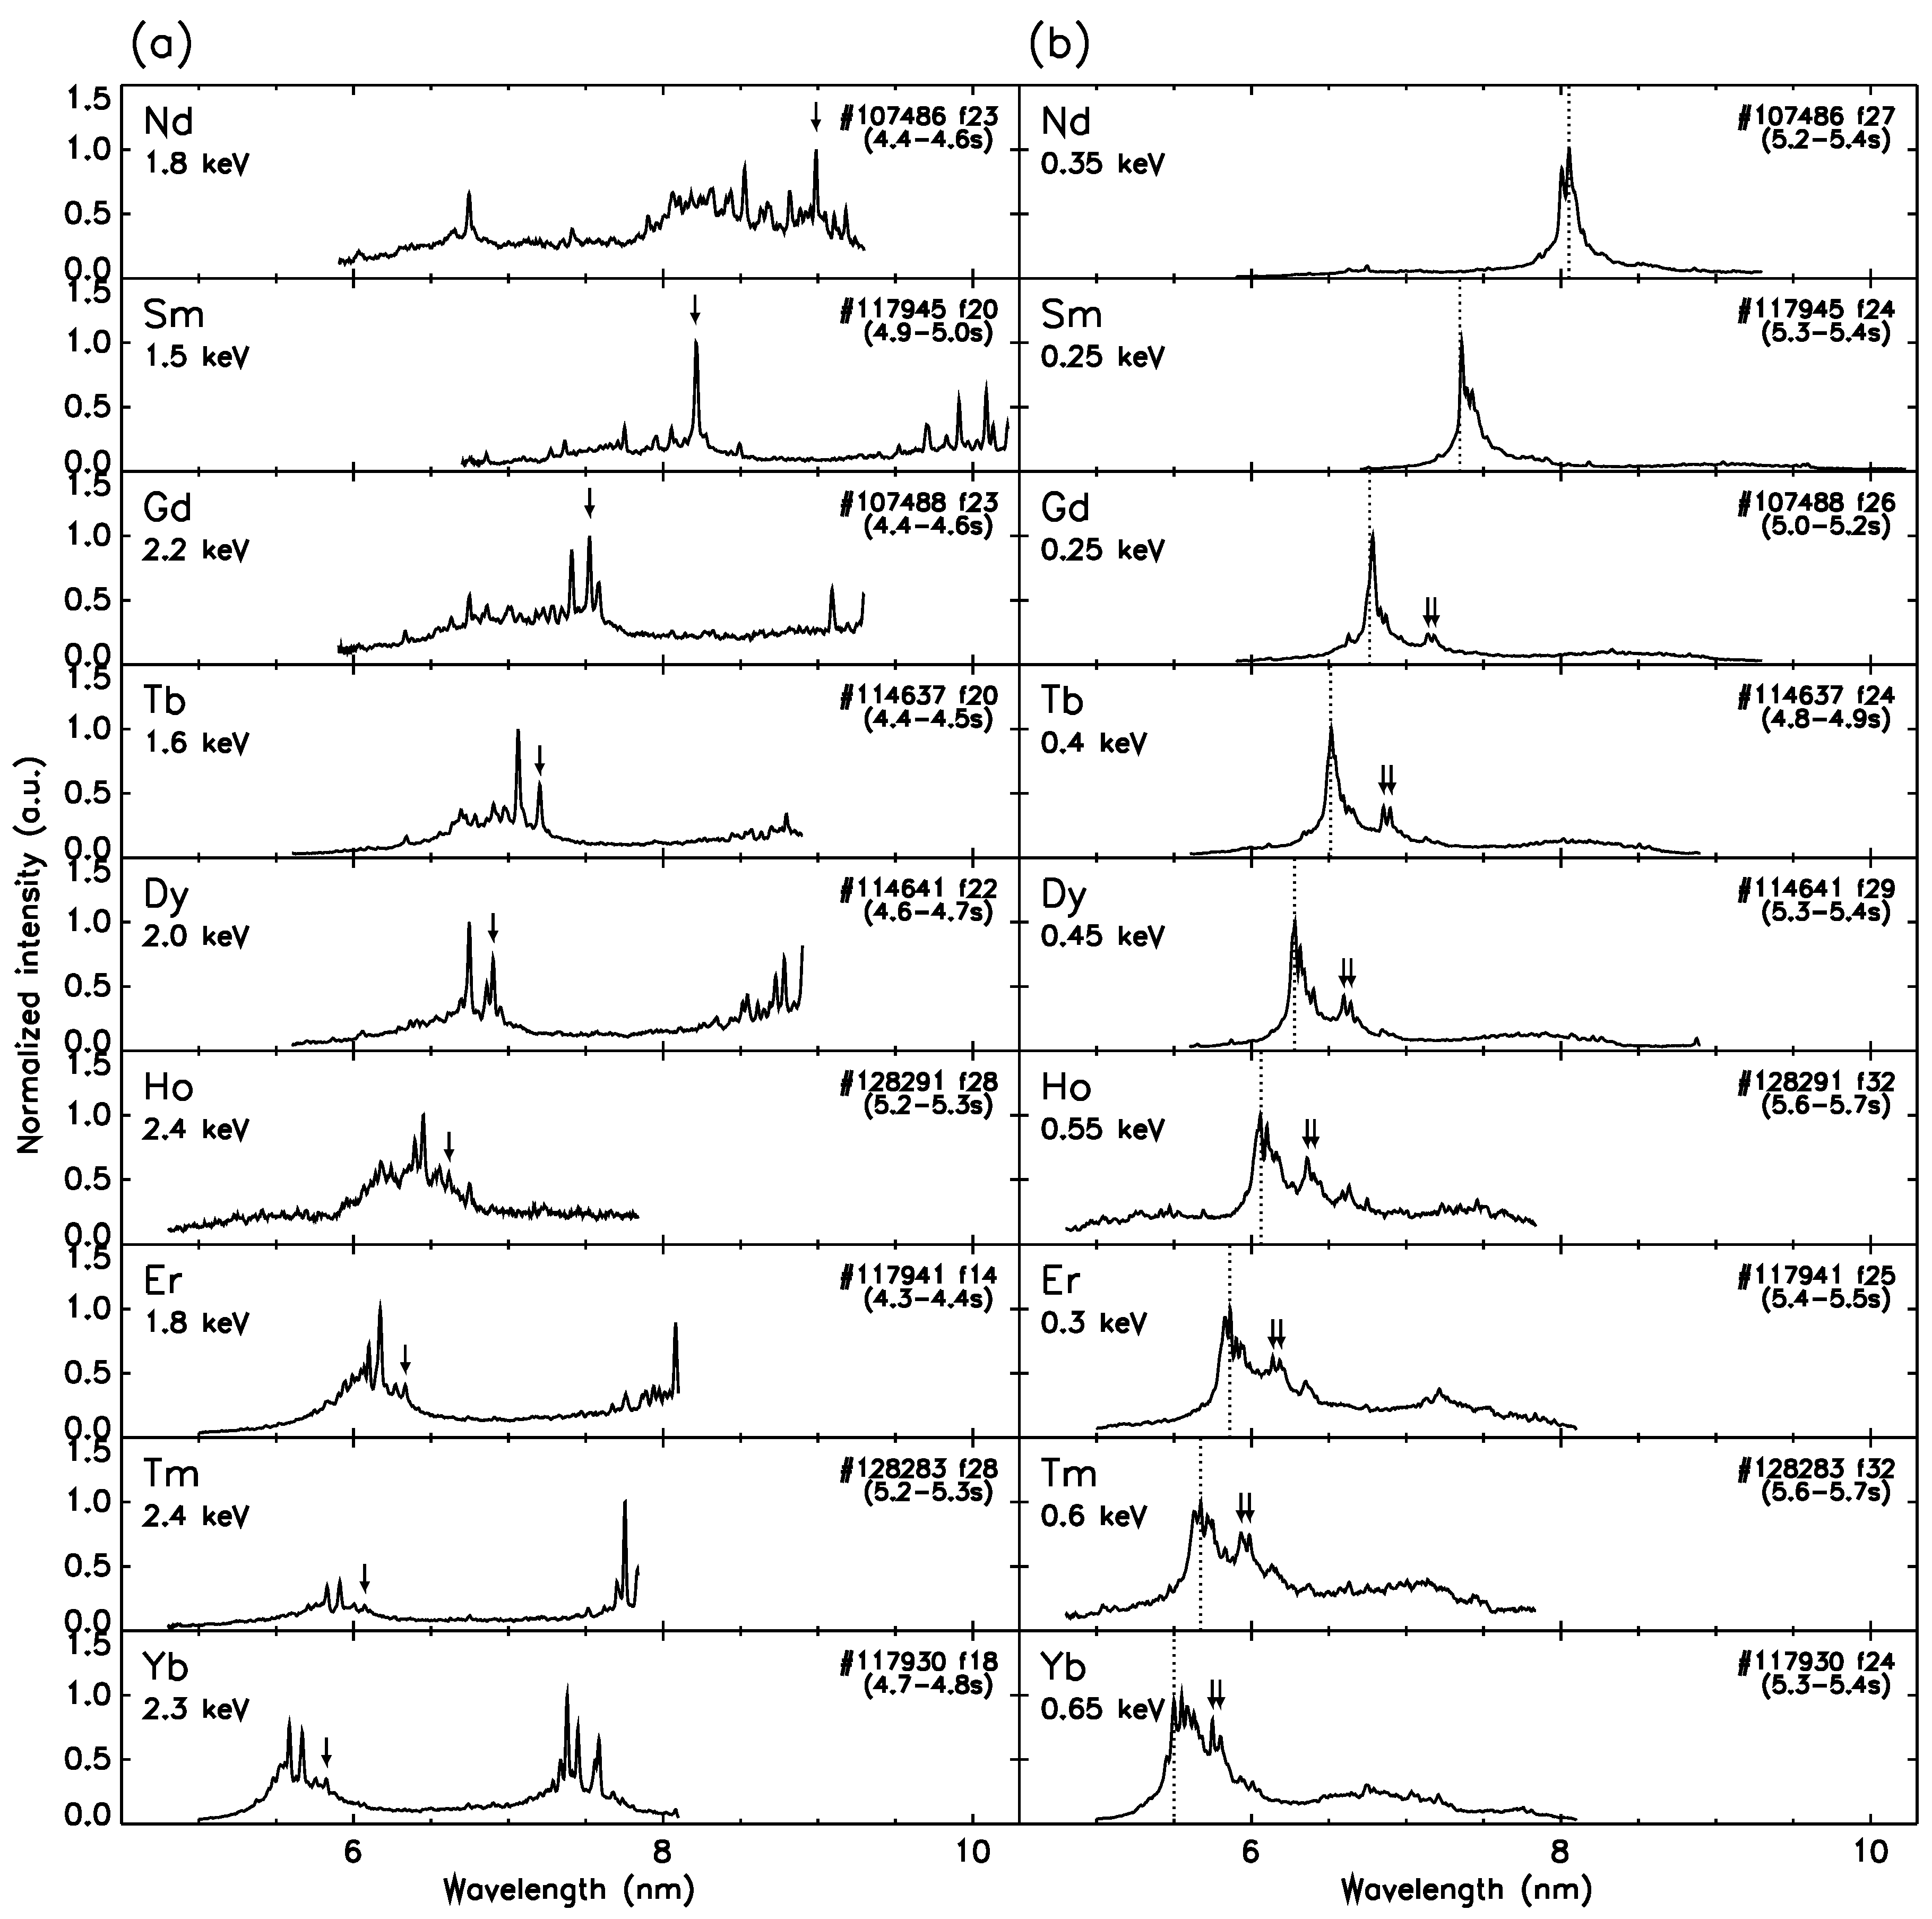
As mentioned in Section 2, the control of the NBI heating power makes it possible to measure a number of different types of EUV spectra under a wide range of electron temperatures in a single discharge. In general, the spectral feature tends to be discrete with less of a continuum structure under a high temperature condition around 2 keV, while the quasicontinuum UTA feature is dominant under a low temperature condition below 1 keV. Figure 1 summarizes typical EUV spectra measured in the LHD for nine lanthanide elements with Z from 60–70 under high- and low temperature conditions. Each pair of high-/low temperature spectra for each element is taken from different frames in the same discharge. Note that all the spectra are normalized to each maximum, and the intensities of the UTA emissions in Figure 1b are generally much stronger than those of the discrete features in Figure 1a. Though the spectra of Nd, Gd, Tb and Dy have already been published [23,25], those are replotted in Figure 1 for comparison with the other elements on the same wavelength scale. The high temperature ( > 1.5 keV at peak) spectra in Figure 1a were taken at the timings between the TESPEL injection and the reduction of the NBI heating power, while the low temperature ( < 0.65 keV at peak) spectra in Figure 1b were chosen from the timings when the extremely narrowed UTA features were observed. The peak electron temperatures along the line of sight of the spectrometer are also shown in each panel of Figure 1. With the exception of the case of Yb, the temperature profiles were hollow shaped when the low temperature spectra in Figure 1b were observed. All the spectra in Figure 1 seem to be accompanied by weak continuum backgrounds, which originate probably from bound-free or free-free transitions from proton or intrinsic impurity (carbon, iron, etc.) ions.
As clearly shown in Figure 1a, discrete spectral features with a number of isolated lines are observed in the high temperature conditions for all the elements in this study. Though the longer wavelength sides are truncated due to the limited coverage of the detector, two blocks of the isolated lines separated in wavelength, the position of which moves systematically to a shorter wavelength as Z increases, are clearly seen in Figure 1a. According to the previous studies for Sm, Gd, Dy and Er in TEXT and EBITs [15,16,17,18,19,20,21,22], these isolated lines mostly originate from n = 4–4 transitions of open 4s or 4p subshell ions such as Cu-, Zn-, Ga- and Ge-like ions. Indeed, the lines due to the 4p-4d transitions of Cu-like ions are easily identified, as marked by the arrows in Figure 1a, which will be discussed in detail in Section 5. The further discussions including the other charge states based on the comparisons with atomic structure calculations and the collisional radiative models will be given in separate papers. As discussed in [24], the spectral feature tends to be discrete for open 4s or 4p subshell ions, while quasicontinuum UTA is formed for open 4d or 4f subshell ions, mainly because of the difference in the numbers of relevant energy levels. Unlike the spectra recorded in TEXT, the UTA feature expected from 4p-4d transitions of open 4d or 4f ions is well suppressed in the spectra in Figure 1a, despite the fact that the line of sight also passes through the low temperature region. This is probably because the impurities are directly introduced by TESPEL into the core plasmas and are well accumulated in the central region where the electron temperature is around 1–2 keV, which is higher than that in TEXT. As a result, open 4s or 4p subshell ions seem to be the dominant emitters in these conditions.
In contrast, the low temperature spectra shown in Figure 1b are characterized by the narrowed UTA feature on which some discrete structure is superposed, the center position of which again moves to shorter wavelength as Z increases. Though the bandwidth of the UTA largely depends on the electron temperature as described in [25] for Tb, the spectra with the most narrowed bandwidth are drawn in Figure 1b. The bandwidth of this UTA is clearly narrower than that recorded in the TEXT tokamak and that expected from the contributions of all the 4p subshell ions. Furthermore, the peak positions of this UTA are very close to the expected positions of the resonance lines of 4d S–4d4f P transitions of Pd-like ions having ground states with the 4d closed shell, as shown by the vertical dotted lines in Figure 1b. This indicates that the dominant emitters are a small number of charge states around Pd-like ions, including Ag- and Rh-like ions. Indeed, as indicated by the arrows in Figure 1b, the characteristic doublet peak due to the 4d-4f transition of Ag-like ions is easily identified for higher Z elements from Gd–Yb at the longer wavelength side of the narrowed UTA, which could not be clearly seen in TEXT due to wider UTA bandwidths. These structures of Ag- and Pd-like ions are discussed again in Section 5. Furthermore, the bandwidth gradually increases from about 0.12 nm–0.37 nm as Z increases from 60–70. This trend qualitatively agrees with that in the theoretical calculations of the distributions of line strengths.
5. Wavelengths of the Lines from Simple Ions
Because the ground state of Cu-like ions has a single 4s electron outside a closed shell, their spectral lines are expected to be simple and well isolated. Though the resonance lines of the 4s-4p transitions of Cu-like ions should be very strong, they appear in the wavelength region much longer than that in this study (e.g., 10.247 nm for Gd [19]). Nevertheless, isolated lines due to the 4p-4d or 4d-4f transitions between excited states are easily found with enough intensity in the LHD. For example, the wavelengths of the identified lines of Cu-like ions due to the transition 3d4p P– 3d4d D are listed in Table 1 together with the available literature values [14,19,21,22,36,37]. We also listed the wavelengths calculated with GRASP92 [33] and RATIP [34], as well as their deviations from the present experimental values. The GRASP92/RATIP calculations were performed as noted in Section 3 for all the lanthanide elements. The wavelengths measured in the LHD are in excellent agreement with the literature values and the calculations. Though no earlier experimental data are available for the lines for Tb, holmium (Ho) and thulium (Tm), they are easily found by the comparisons with the calculation and the prediction from the interpolation. Consequently, we could identify the lines of Cu-like Tb, Ho and Tm ions for the first time in the LHD [28]. Note that the line of Sm at 8.215 nm is suggested to be blended with a 4s-4p resonance transition of Ga-like Sm according to the recent EBIT data [22]. The positions of these lines are marked by the arrows in Figure 1a, which indicates that the intensity of the line decreases as Z increases. This is reasonable because the fractional abundance of Cu-like ions should decrease with increasing Z at a similar electron temperature.
Similarly, spectra from Ag-like ions should be simple because their ground states have a single 4f electron outside a closed 4d subshell for the elements from Sm onward [38,39,40]. As mentioned in Section 4, the narrowing of the UTA in the low temperature spectra makes it possible to easily identify the doublet peak due to the 4d4f F–4d4f G transition of Ag-like ions for higher Z elements from Gd onward, as marked by the arrows in Figure 1b. The wavelengths of the doublet are summarized in Table 2 with the previous experimental values and the calculated values in a similar way to Table 1. The measured wavelengths agree very well with the literature values given by Sugar et al. [39,41] in which the values for Tm are missing. Comparing with the expected wavelengths for Tm from an interpolation of Z dependence, we could newly identify the doublet of Tm at 5.933 nm (F–G) and 5.986 nm (F–G) for the first time in the LHD [28]. As shown in Figure 1b, the doublet peak is unclear or missing for Nd and Sm. This is probably because the ground state configuration is not 4d4f, but 4d5s for Nd, and probably because the 4d4f term energies are strongly perturbed by the configuration interaction with the 4d5g term for Sm, as discussed in the previous papers [38,39,40]. In contrast to Cu-like ions, the calculated wavelengths for this transition of Ag-like ions are systematically shifted to shorter wavelengths by 0.19–0.11 nm. This discrepancy could be attributed to the difficulty in the exact evaluation of the correlation energy among N shell electrons in inner subshell excited configurations such as 4d4f. The 4f orbital in 4d4f should be slightly different from the one in 4d4f due to the 4f-4f correlations in the upper state 4f configuration. Although this type of interaction could be evaluated by the CI from the higher lying configurations such as 5f, 6f or others, we were unsuccessful in including such configurations in the present calculation.
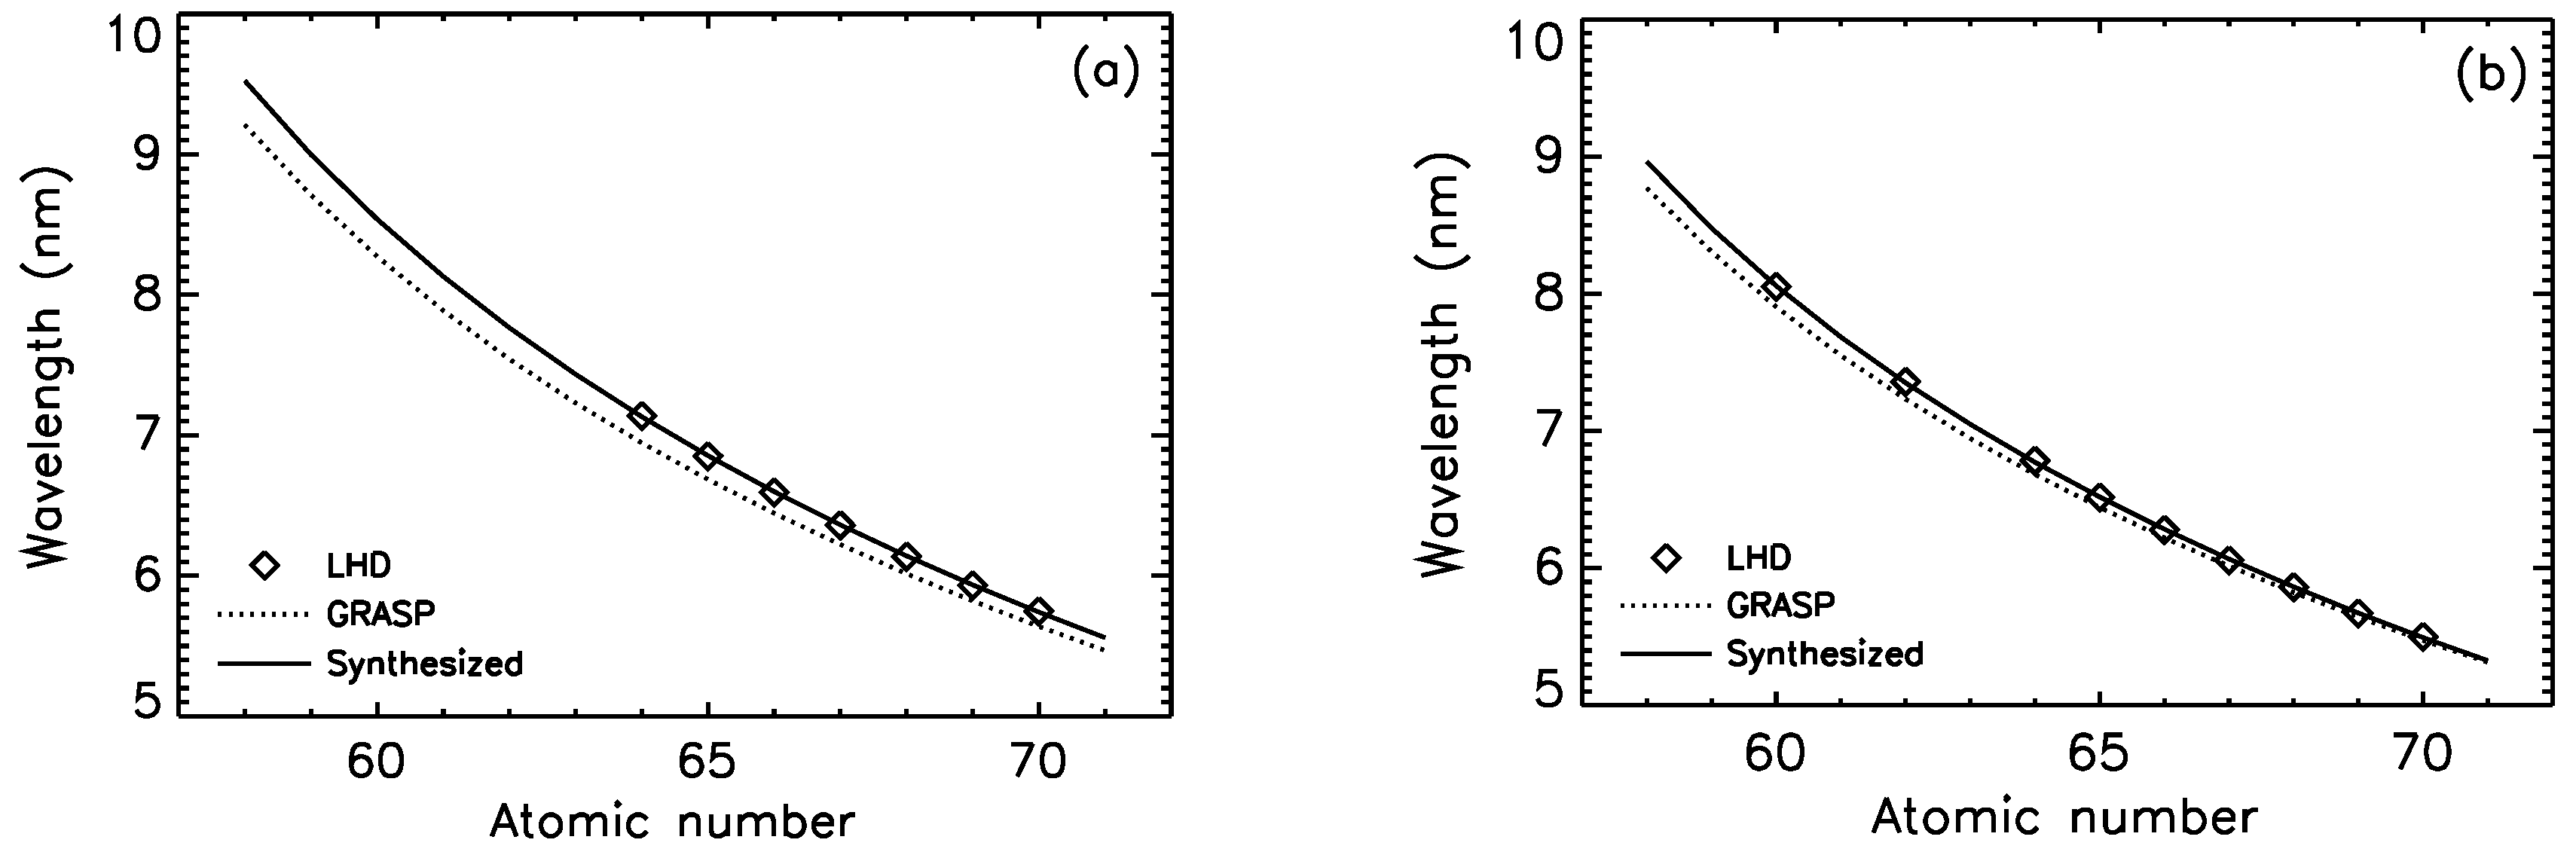
We further analyzed the difference between the results of the LHD experiment and the present GRASP92/RATIP calculation, which is suspected to consist of a constant offset and a term proportional to the inverse square of the effective nuclear charge. To synthesize the data, we have fitted this difference to a function of the form by means of the analysis, where A and B are fitting parameters and is a screening constant, which has been fixed at after several trial fittings. Since is quite insensitive to the value of , we may fix at a rather arbitrary value. The present value is roughly about a half of the number of electrons of the Ag-like system (47), which may be accepted as a screening constant for valence electrons. We have obtained with = 1.4 × 10 for F – G transitions and with = 2.2 × 10 for F – G transitions. The synthesized transition wavelengths and their discrepancy from the measurements are also tabulated in Table 2, including the elements that are not measured in the present LHD experiment. Atomic number dependences of the measured, calculated and synthesized wavelengths for Z=58–71 are plotted in Figure 2a for the F–G transitions. We find that the synthesized wavelengths agree quite well with the wavelengths measured in the LHD, suggesting that the wavelengths for the other elements are also quite reliable. Exceptionally, the previous experimental wavelengths for Sm, which are not found in the LHD, are largely red-shifted from the synthesized ones. This suggests that the previous values for these lines need to be evaluated more carefully.
A singlet resonance transition 4d S–4d4f P of Pd-like ions is predicted to be very strong because of the closed shell of the ground state. However, this transition tends to be blended with the lines from adjacent charge states such as Ag- and Rh-like ions because the positions of this resonance are close to the center of the UTA as illustrated in Figure 1b by vertical dotted lines. Nevertheless, we have made comparisons between the previous values [42,43,44] and the peak positions nearest to them in the LHD, as listed in Table 3 with the values calculated by GRASP92/RATIP. The peak positions measured in the LHD are generally in good agreement with the previous values, which implies that the individual lines are well resolved in the narrowed UTA features observed in the LHD. The calculated wavelengths are systematically shifted to shorter wavelengths by 0.15–0.03 nm, probably due to insufficient evaluation of the relaxation of the 4d subshell at the excitation of one 4d electron to the 4f orbital. We have tried to evaluate such a relaxation effect by including 5f as a correlation orbital. However, the improvement to the transition energy was not very significant; for instance, 0.004 nm for Sm and 0.002 nm for Er. We have tried to synthesize the wavelength also for the present Pd-like ions. We have obtained with = 3.0 × 10 for the difference between the LHD and the GRASP92/RATIP wavelengths. The synthesized transition wavelengths are also tabulated in Table 3 and plotted in Figure 2b. The synthesized wavelengths agree quite well with the LHD wavelengths, suggesting that the wavelengths for the other elements are also quite reliable.
6. Summary
We have recorded a series of EUV spectra from highly charged lanthanide ions with atomic numbers from 60–70 under high and low temperature conditions using the LHD plasmas. The control of the heating power combined with the TESPEL injection system is helpful for the measurements of extremely discrete or narrowed UTA features depending on the electron temperature, unlike the earlier experiments. Consequently, we could identify some of the spectral lines of Cu- and Ag-like ions, including new experimental identifications in the series of measurements in the LHD. Furthermore, we have found strong peaks that can be assigned to the singlet resonance transitions of Pd-like ions in the narrowed UTA features.
Author Contributions
C.S. carried out the spectroscopic measurements and data analyses. F.K. and I.M. contributed to the theoretical calculations. N.T. and S.S designed and operated TESPEL.
Acknowledgments
The authors acknowledge the LHD experiment group for their assistance. This work was carried out with the support and under the auspices of the NIFS collaboration research program (NIFS15KLPF038). This work was supported also by JSPS KAKENHI Grant Numbers 15H03759 and 15H04234.
Conflicts of Interest
The authors declare no conflict of interest.
References
- O’Sullivan, G.; Carroll, P.K. 4d-4f emission resonances in laser-produced plasmas. J. Opt. Soc. Am. 1981, 71, 227. [Google Scholar] [CrossRef]
- Zeng, G.M.; Daido, H.; Nishikawa, T.; Takabe, H.; Nakayama, S.; Aritome, H.; Murai, K.; Kato, Y.; Nakatsuka, M.; Nakai, S. Soft X-ray spectra of highly ionized elements with atomic numbers ranging from 57 to 82 produced by compact lasers. J. Appl. Phys. 1994, 75, 1923. [Google Scholar] [CrossRef]
- Mandelbaum, P.; Finkenthal, M.; Schwob, J.L.; Klapisch, M. Interpretation of the quasicontinuum band emitted by highly ionized rare-earth elements in the 70–100-Å range. Phys. Rev. A 1987, 35, 5051. [Google Scholar] [CrossRef]
- Koike, F.; Fritzsche, S. Relativistic calculations for highly correlated atomic and highly charged ionic systems. Rad. Phys. Chem. 2007, 76, 404. [Google Scholar] [CrossRef]
- Churilov, S.S.; Kildiyarova, R.R.; Ryabtsev, A.N.; Sadovsky, S.V. EUV spectra of Gd and Tb ions excited in laser-produced and vacuum spark plasmas. Phys. Scr. 2009, 80, 045303. [Google Scholar] [CrossRef]
- Otsuka, T.; Kilbane, D.; White, J.; Higashiguchi, T.; Yugami, N.; Yatagai, T.; Jiang, W.; Endo, A.; Dunne, P.; O’Sullivan, G. Rare-earth plasma extreme ultraviolet sources at 6.5–6.7 nm. Appl. Phys. Lett. 2010, 97, 111503. [Google Scholar] [CrossRef]
- Kilbane, D.; O’Sullivan, G. Extreme ultraviolet emission spectra of Gd and Tb ions. J. Appl. Phys. 2010, 108, 104905. [Google Scholar] [CrossRef]
- Higashiguchi, T.; Otsuka, T.; Yugami, N.; Jiang, W.; Endo, A.; Li, B.; Kilbane, D.; Dunne, P.; O’Sullivan, G. Extreme ultraviolet source at 6.7 nm based on a low-density plasma. Appl. Phys. Lett. 2011, 99, 191502. [Google Scholar] [CrossRef]
- Li, B.; Otsuka, T.; Higashiguchi, T.; Yugami, N.; Jiang, W.; Endo, A.; Dunne, P.; O’Sullivan, G. Investigation of Gd and Tb plasmas for beyond extreme ultraviolet lithography based on multilayer mirror performance. Appl. Phys. Lett. 2012, 101, 013112. [Google Scholar] [CrossRef]
- O’Sullivan, G.; Li, B.; Dunne, P.; Hayden, P.; Kilbane, D.; Lokasani, R.; Long, E.; Ohashi, H.; O’Reilly, F.; Sheil, J.; et al. Sources for beyond extreme ultraviolet lithography and water window imaging. Phys. Scr. 2015, 90, 054002. [Google Scholar] [CrossRef]
- O’Sullivan, G.; Li, B.; D’Arcy, R.; Dunne, P.; Hayden, P.; Kilbane, D.; McCormack, T.; Ohashi, H.; O’Reilly, F.; Sheridan, P.; et al. Spectroscopy of highly charged ions and its relevance to EUV and soft X-ray source development. J. Phys. B At. Mol. Opt. Phys. 2015, 48, 144025. [Google Scholar]
- Bauche, J.; Bauche-Arnoult, C.; Klapisch, M. Unresolved transition arrays. Phys. Scr. 1988, 37, 659. [Google Scholar] [CrossRef]
- Reader, J.; Luther, G. Spectra of very highly charged Cu- and Zn-like ions. Phys. Rev. Lett. 1980, 45, 609. [Google Scholar] [CrossRef]
- Reader, J.; Luther, G. The copper isoelectronic sequence: Ba27+–W45+. Phys. Scr. 1981, 24, 732. [Google Scholar] [CrossRef]
- Finkenthal, M.; Lippmann, A.S.; Huang, L.K.; Yu, T.L.; Stratton, B.C.; Moos, H.W.; Klapisch, M.; Mandelbaum, P.; Bar Shalom, A.; Hodge, W.L.; et al. The spectrum of highly ionized praseodymium and dysprosium from the Texas tokamak plasma in the 50–250-Å range. J. Appl. Phys. 1986, 59, 3644. [Google Scholar] [CrossRef]
- Finkenthal, M.; Moos, H.W.; Bar-Shalom, A.; Spector, N.; Zigler, A.; Yarkoni, E. Electron-density dependence of line intensities of Cu I-like Sm33+ to Yb41+ emitted from tokamak and laser-produced plasmas. Phys. Rev. A 1988, 38, 288. [Google Scholar] [CrossRef]
- Finkenthal, M.; Lippmann, S.; Huang, L.K.; Moos, H.W.; Lee, Y.T.; Spector, N.; Zigler, A.; Yarkoni, E. Δn = 0 N-shell emission of rare-earth ions (Z = 59 to 70) emitted from low and high-density tokamak and laser-produced plasmas. Phys. Scr. 1990, 41, 445. [Google Scholar] [CrossRef]
- Fournier, K.B.; Goldstein, W.H.; Osterheld, A.; Finkenthal, M.; Lippmann, S.; Huang, L.K.; Moos, H.W.; Spector, N. Soft x-ray emission of galliumlike rare-earth atoms produced by high temperature low-density tokamak and high-density laser plasmas. Phys. Rev. A 1994, 50, 2248. [Google Scholar] [CrossRef] [PubMed]
- Kilbane, D.; O’Sullivan, G.; Gillaspy, J.D.; Ralchenko, Yu.; Reader, J. EUV spectra of Rb-like to Cu-like gadolinium ions in an electron-beam ion trap. Phys. Rev. A 2012, 86, 042503. [Google Scholar] [CrossRef]
- Ohashi, H.; Sakaue, H.A.; Nakamura, N. Extreme ultra-violet emission spectroscopy of highly charged gadolinium ions with an electron beam ion trap. Phys. Scr. 2013, T156, 014013. [Google Scholar] [CrossRef]
- Kilbane, D.; O’Sullivan, G.; Podpaly, Y.A.; Gillaspy, J.D.; Reader, J.; Ralchenko, Yu. EUV spectra of Rb-like to Ni-like dysprosium ions in an electron beam ion trap. Eur. Phys. J. D 2014, 68, 222. [Google Scholar] [CrossRef]
- Podpaly, Y.A.; Gillaspy, J.D.; Reader, J.; Ralchenko, Yu. Measurements and identifications of extreme ultraviolet spectra of highly-charged Sm and Er. J. Phys. B At. Mol. Opt. Phys. 2015, 48, 025002. [Google Scholar] [CrossRef]
- Suzuki, C.; Koike, F.; Murakami, I.; Tamura, N.; Sudo, S. Observation of EUV spectra from gadolinium and neodymium ions in the Large Helical Device. J. Phys. B At. Mol. Opt. Phys. 2012, 45, 135002. [Google Scholar] [CrossRef]
- Suzuki, C.; Koike, F.; Murakami, I.; Tamura, N.; Sudo, S.; Sakaue, H.A.; Nakamura, N.; Morita, S.; Goto, M.; Kato, D.; et al. EUV spectroscopy of highly charged high Z ions in the Large Helical Device plasmas. Phys. Scr. 2014, 89, 114009. [Google Scholar] [CrossRef]
- Suzuki, C.; Koike, F.; Murakami, I.; Tamura, N.; Sudo, S. Temperature dependent EUV spectra of Gd, Tb and Dy ions observed in the Large Helical Device. J. Phys. B At. Mol. Opt. Phys. 2015, 48, 144012. [Google Scholar] [CrossRef]
- Sudo, S.; Tamura, N.; Khlopenkov, K.; Muto, S.; Funaba, H.; Viniar, I.; Sergeev, V.; Sato, K.; Ida, K.; Kawahata, K.; et al. Particle transport diagnostics on CHS and LHD with tracer-encapsulated solid pellet injection. Plasma Phys. Control. Fusion 2002, 44, 129. [Google Scholar] [CrossRef]
- Sudo, S.; Tamura, N. Tracer-encapsulated solid pellet injection system. Rev. Sci. Instrum. 2012, 83, 023503. [Google Scholar] [CrossRef] [PubMed]
- Suzuki, C.; Murakami, I.; Koike, F.; Tamura, N.; Sakaue, H.A.; Morita, S.; Goto, M.; Kato, D.; Ohashi, H.; Higashiguchi, T.; Sudo, S.; O’Sullivan, G. Extreme ultraviolet spectroscopy and atomic models of highly charged heavy ions in the Large Helical Device. Plasma Phys. Control. Fusion 2017, 59, 144012. [Google Scholar] [CrossRef]
- Takeiri, Y.; Morisaki, T.; Osakabe, M.; Yokoyama, M.; Sakakibara, S.; Takahashi, H.; Nakamura, Y.; Oishi, T.; Motojima, G.; Murakami, S.; et al. Extension of the operational regime of the LHD towards a deuterium experiment. Nucl. Fusion 2017, 57, 102023. [Google Scholar] [CrossRef]
- Schwob, J.L.; Wouters, A.W.; Suckewer, S.; Finkenthal, M. High-resolution duo-multichannel soft-X-ray spectrometer for tokamak plasma diagnostics. Rev. Sci. Instrum. 1987, 58, 1601. [Google Scholar] [CrossRef]
- Narihara, K.; Yamada, I.; Hayashi, H.; Yamauchi, K. Design and performance of the Thomson scattering diagnostic on LHD. Rev. Sci. Instrum. 2001, 72, 1122. [Google Scholar] [CrossRef]
- Yamada, I.; Narihara, K.; Funaba, H.; Hayashi, H.; Kohmoto, T.; Takahashi, H.; Shimozuma, T.; Kubo, S.; Yoshimura, Y.; Igami, H.; et al. Improvements of data quality of the LHD Thomson scattering diagnostics in high temperature plasma experiments. Rev. Sci. Instrum. 2010, 81, 10D522. [Google Scholar] [CrossRef] [PubMed]
- Parpia, F.A.; Fischer, C.F.; Grant, I.P. GRASP92: A package for large-scale relativistic atomic structure calculations. Comput. Phys. Commun. 1996, 94, 249. [Google Scholar] [CrossRef]
- Fritzsche, S. The RATIP program for relativistic calculations of atomic transition, ionization and recombination properties. Comput. Phys. Commun. 2012, 183, 1525. [Google Scholar] [CrossRef]
- Koike, F.; Fritzsche, S.; Nishihara, K. MCDF calculations for EUV-emissions of 4d-open shell ions based on the features of non-local exchange integrals. J. Phys. Conf. Ser. 2007, 58, 157. [Google Scholar] [CrossRef]
- Doschek, G.A.; Feldman, U.; Brown, C.M.; Seely, J.F.; Ekberg, J.O.; Behring, W.E.; Richardson, M.C. Spectra and energy levels of Sm XXXIV, Eu XXXV, Gd XXXVI, and Yb XXXXII. J. Opt. Soc. Am. B 1988, 5, 243. [Google Scholar] [CrossRef]
- Kania, D.R.; MacGowan, B.J.; Keane, C.J.; Brown, C.M.; Ekberg, J.O.; Seely, J.F.; Feldman, U.; Reader, J. Transitions and energy-levels for Cu-like Yb41+, Ta44+, and U63+. J. Opt. Soc. Am. B 1990, 7, 1993. [Google Scholar]
- Sugar, J.; Kaufman, V. Tokamak-generated tungsten radiation identified in AgI isoelectronic sequence (W XXVIII). Phys. Rev. A 1980, 21, 2096. [Google Scholar] [CrossRef]
- Sugar, J.; Kaufman, V. Ag I isoelectronic sequence: Wavelengths and energy-levels for Ce XII through Ho XXI and for W XXVIII. Phys. Scr. 1981, 24, 742. [Google Scholar] [CrossRef]
- Ding, X.; Koike, F.; Murakami, I.; Kato, D.; Sakaue, H.A.; Dong, C.; Nakamura, N. M1 transition energies and probabilities between the multiplets of the ground state of Ag-like ions with Z = 47–92. J. Phys. B: At. Mol. Opt. Phys. 2012, 45, 035003. [Google Scholar] [CrossRef]
- Sugar, J.; Kaufman, V.; Rowan, W.L. Spectra of Ag I isoelectronic sequence observed from Er21+ to Au32+. J. Opt. Soc. Am. B 1993, 10, 1321. [Google Scholar] [CrossRef]
- Sugar, J.; Kaufman, V. Resonance Lines in the Pd I Isoelectronic Sequence: I VIII to Ho XXII. Phys. Scr. 1982, 24, 419. [Google Scholar] [CrossRef]
- Churilov, S.S.; Ryabtsev, A.N.; Wyart, J.-F.; Tchang-Brillet, W.-U.L.; Joshi, Y.N. Analysis of the Spectra of Pd-Like Praseodymium and Neodymium (Pr XIV and Nd XV). Phys. Scr. 2005, 71, 589. [Google Scholar] [CrossRef]
- Sugar, J.; Kaufman, V.; Rowan, W.L. Observation of Pd-like resonance lines through Pt32+ and Zn-like resonance lines of Er38+ and Hf42+. J. Opt. Soc. Am. B 1993, 10, 799. [Google Scholar] [CrossRef]
Figure 1.
EUV spectra from nine lanthanide ions with Z from 60 (Nd)–70 (Yb) observed in LHD plasmas under (a) high temperature and (b) low temperature time frames in the same discharge. The peak electron temperatures corresponding to each spectrum are shown in each panel. All the spectra drawn here are normalized to each maximum. Hollow plasmas are formed in (b), except for Yb. The arrows in (a) indicate the positions of 3d4p P– 3d4d D transitions of Cu-like ions, while those in (b) indicate the 4d4f F–4d4f G doublet of Ag-like ions. Dotted lines in (b) denote the positions of the 4d S–4d4f P transitions of Pd-like ions.

Figure 2.
Atomic number dependences of the wavelengths for the transitions (a) 4d4f F–4d4f G of Ag-like ions and (b) 4d S–4d4f P of Pd-like ions. The wavelengths measured in the LHD are plotted with diamond symbols, while those calculated by GRASP92/RATIP are drawn with dotted lines. Solid lines denote the wavelengths synthesized with the fitting (see the text in Section 5 for details).


Table 1.
Wavelengths of the identified lines of 3d4p P–3d4d D transitions of Cu-like ions. The wavelengths observed in the present study (LHD) are listed with those in the previous experiments and those calculated with GRASP92 and RATIP. The uncertainty of the wavelengths measured in the LHD is estimated to be less than ±0.004 nm. The discrepancies of the calculated values from the LHD values are listed in the last column. References: a [14], b [36], c [22], d [19], e [21], f [37].
| Z | Ion | Wavelength (nm) | |||
|---|---|---|---|---|---|
| LHD | Previous | Calculated | Discrepancy | ||
| 60 | Nd | 8.987 | 8.9844 | 8.984 | −0.003 |
| 61 | Pm | — | 8.591 | ||
| 62 | Sm | 8.215 | 8.2206 , 8.2155 , 8.2176 | 8.218 | +0.003 |
| 63 | Eu | — | 7.864 | ||
| 64 | Gd | 7.524 | 7.5316 , 7.5259 , 7.527 | 7.528 | +0.004 |
| 65 | Tb | 7.203 * | — | 7.209 | +0.006 |
| 66 | Dy | 6.902 * | 6.9080 , 6.905 e | 6.905 | +0.003 |
| 67 | Ho | 6.614 | — | 6.614 | +0.000 |
| 68 | Er | 6.334 | 6.3403 , 6.3391 | 6.338 | +0.004 |
| 69 | Tm | 6.072 | — | 6.074 | +0.002 |
| 70 | Yb | 5.824 | 5.8265 , 5.8190 , 5.8209 | 5.822 | −0.002 |
* Slightly changed (±0.001 nm) from [25] due to recalibration.
Table 2.
Wavelengths of the identified lines of the 4d4f F–4d4f G transitions of Ag-like ions. The wavelengths observed in the present study (LHD) are listed with those in the previous experiments and those calculated with GRASP92 and RATIP. The lines of Nd and Sm are unclear and hardly observed in the LHD spectra. The uncertainty of the wavelengths measured in the LHD is estimated to be less than ±0.004 nm. The synthesized wavelengths are also listed (see the text for details). The discrepancies of the synthesized values from the LHD values are listed in the last column. References: a [39], b [41].
| Z | Ion | Wavelength (nm) | ||||
|---|---|---|---|---|---|---|
| LHD | Previous | Calculated | Synthesized | Discrepancy | ||
| 4d4f F–4d4f G | ||||||
| 60 | Nd | (unclear) | 8.5302 | 8.273 | 8.538 | — |
| 61 | Pm | — | 7.887 | 8.131 | ||
| 62 | Sm | (unclear) | 7.9170 | 7.542 | 7.765 | — |
| 63 | Eu | 7.4741 | 7.230 | 7.434 | ||
| 64 | Gd | 7.139 * | 7.1430 | 6.945 | 7.132 | −0.007 |
| 65 | Tb | 6.852 | 6.8578 | 6.685 | 6.855 | +0.003 |
| 66 | Dy | 6.595 | 6.5967 | 6.445 | 6.599 | +0.004 |
| 67 | Ho | 6.361 | 6.3590 | 6.222 | 6.362 | +0.001 |
| 68 | Er | 6.138 | 6.1394 | 6.015 | 6.141 | +0.003 |
| 69 | Tm | 5.933 | — | 5.821 | 5.935 | +0.002 |
| 70 | Yb | 5.748 | 5.7451 | 5.639 | 5.741 | −0.007 |
| 4d4f F–4d4f G | ||||||
| 60 | Nd | (unclear) | 8.5610 | 8.320 | 8.573 | — |
| 61 | Pm | — | 7.934 | 8.166 | ||
| 62 | Sm | (unclear) | 7.9287 | 7.589 | 7.802 | — |
| 63 | Eu | 7.5103 | 7.278 | 7.473 | ||
| 64 | Gd | 7.181 * | 7.1853 | 6.994 | 7.173 | −0.008 |
| 65 | Tb | 6.896 * | 6.9029 | 6.734 | 6.898 | +0.002 |
| 66 | Dy | 6.642 * | 6.6437 | 6.495 | 6.644 | +0.002 |
| 67 | Ho | 6.401 | 6.4073 | 6.273 | 6.408 | +0.007 |
| 68 | Er | 6.184 | 6.1887 | 6.067 | 6.190 | +0.006 |
| 69 | Tm | 5.986 | — | 5.874 | 5.985 | −0.001 |
| 70 | Yb | 5.801 | 5.7973 | 5.693 | 5.792 | −0.009 |
* Slightly changed (±0.001 nm) from [25] due to recalibration.
Table 3.
Comparisons of the reported wavelengths of the 4d S–4d4f P transitions of Pd-like ions with the nearest peak measured in the LHD. The wavelengths calculated by GRASP92 and RATIP are listed, as well. The uncertainty of the wavelengths measured in the LHD is estimated to be less than ±0.004 nm. The synthesized wavelengths are also listed (see the text for details). The discrepancies of the synthesized values from the LHD values are listed in the last column. References: a [42], b [43], c [44].
| Z | Ion | Wavelength (nm) | ||||
|---|---|---|---|---|---|---|
| LHD Peak | Previous | Calculated | Synthesized | Discrepancy | ||
| 60 | Nd | 8.053 | 8.0512 , 8.0508 | 7.904 | 8.057 | +0.004 |
| 61 | Pm | — | 7.549 | 7.684 | ||
| 62 | Sm | 7.359 | 7.3462 | 7.232 | 7.351 | -0.008 |
| 63 | Eu | 7.0404 | 6.945 | 7.049 | ||
| 64 | Gd | 6.784 | 6.7636 | 6.683 | 6.772 | -0.012 |
| 65 | Tb | 6.517 | 6.5122 | 6.443 | 6.519 | +0.002 |
| 66 | Dy | 6.280 | 6.2778 | 6.221 | 6.284 | +0.004 |
| 67 | Ho | 6.058 | 6.0626 | 6.015 | 6.067 | +0.009 |
| 68 | Er | 5.863 | 5.8609 | 5.823 | 5.864 | +0.001 |
| 69 | Tm | 5.672 | — | 5.643 | 5.673 | +0.001 |
| 70 | Yb | 5.500 | 5.4996 | 5.473 | 5.494 | -0.006 |
© 2018 by the authors. Licensee MDPI, Basel, Switzerland. This article is an open access article distributed under the terms and conditions of the Creative Commons Attribution (CC BY) license (http://creativecommons.org/licenses/by/4.0/).
Share and Cite
MDPI and ACS Style
Suzuki, C.; Koike, F.; Murakami, I.; Tamura, N.; Sudo, S. Systematic Observation of EUV Spectra from Highly Charged Lanthanide Ions in the Large Helical Device. Atoms 2018, 6, 24. https://doi.org/10.3390/atoms6020024
AMA Style
Suzuki C, Koike F, Murakami I, Tamura N, Sudo S. Systematic Observation of EUV Spectra from Highly Charged Lanthanide Ions in the Large Helical Device. Atoms. 2018; 6(2):24. https://doi.org/10.3390/atoms6020024
Chicago/Turabian StyleSuzuki, Chihiro, Fumihiro Koike, Izumi Murakami, Naoki Tamura, and Shigeru Sudo. 2018. "Systematic Observation of EUV Spectra from Highly Charged Lanthanide Ions in the Large Helical Device" Atoms 6, no. 2: 24. https://doi.org/10.3390/atoms6020024
Note that from the first issue of 2016, this journal uses article numbers instead of page numbers. See further details here.