A Facile Profiling Method of Short Chain Fatty Acids Using Liquid Chromatography-Mass Spectrometry


1
Department of Convergence Medicine, Asan Institute for Life Sciences, Asan Medical Center, University of Ulsan College of Medicine, Seoul 05505, Korea
2
School of Biological Sciences, University of Ulsan, Ulsan 44610, Korea
*
Author to whom correspondence should be addressed.
Metabolites 2019, 9(9), 173; https://doi.org/10.3390/metabo9090173
Submission received: 27 June 2019
/
Revised: 9 August 2019
/
Accepted: 23 August 2019
/
Published: 28 August 2019
Abstract
:Short chain fatty acids (SCFAs) are the main products of dietary fibers that are not digested by the human body, and they have been shown to affect human metabolism and inflammation. The amount of SCFAs in the body is related to many human diseases, and studies have focused on elucidating their roles and target molecules in both metabolic and immune responses. Thus, the quantitation of SCFAs in biological samples becomes crucial in understanding their important roles in the human body. Herein, a facile profiling method of SCFAs using liquid chromatography-tandem mass spectrometry (LC-MS/MS) was developed and then applied to biological samples. C2-C6 SCFAs were derivatized while using 4-acetamido-7-mercapto-2,1,3-benzoxadiazole for 5 min. at room temperature prior to LC-MS/MS analysis, and characteristic fragmentation patterns and increased hydrophobicity after chemical derivatization enabled specific discrimination among 12 SCFAs. Derivatization was fast and reliable, and the reaction products were stable for a week at 4 °C. The developed method was applied to measure SCFAs in mouse feces, plasma, and human exhaled breath condensates. This fast and simple method can save labor and effort to profile SCFAs from various biological samples.
1. Introduction
Short chain fatty acids (SCFAs) contain less than six carbons, and they are mainly produced by the fermentation of dietary fibers in the human body [1]. One of the major roles of the gut microbiota is to help catabolize dietary fibers into SCFAs. SCFAs are taken up by the host and are used as energy sources or regulators [2]. The main SCFAs are acetate (C2), propionate (C3), and butyrate (C4), and they constitute 95% of total SCFAs. Straight chain SCFAs are derived from dietary fibers, while the branched chain SCFAs are derived from catabolism of branched chain amino acids [2]. SCFAs are metabolized at various sites in the body, transported from the intestinal lumen into the blood, and found in various tissues. Recent studies demonstrated that the gut microbiota plays an important role in regulating host metabolism and immune responses [3,4]. Thus, measuring the type and amount of SCFAs is important for understanding their roles in complex biological systems.
Mass spectrometry (MS) has grown in popularity as an analytical method for the determination of various biomolecules, and it is frequently used in combination with separation techniques, such as GC or HPLC, because biological samples are too complex for direct analysis by MS alone. SCFAs have been derivatized by methyl-, ethyl-, and propyl-chloroformate, as well as trimethylsilylation, and determined by GC-MS [5,6,7,8]. Liquid chromatography-mass spectrometry (LC-MS) has been often used in metabolomics studies with minimal sample preparation as compared with GC or GC-MS [9,10]. However, the quantitation of SCFAs without chemical derivatization requires harsh experimental conditions in LC-MS, such as an aqueous mobile phase containing 1.5 mM hydrochloric acid [11]. In addition, their hydrophilicity results in poor chromatographic separation and insufficient ionization in electrospray ionization (ESI) [11]. Thus, it was difficult to detect SCFAs by LC-MS, because their masses were in the lower mass range in mass spectra, where numerous interfering peaks from solvents and additives were present. To overcome these problems, several chemical derivatization methods have been introduced to quantify SCFAs while using LC-MS. However, these derivatization requires longer reaction time or specific reaction condition. SCFAs were derivatized with 12C- or 13C-labeled aniline and analyzed while using a reversed-phase LC column, where derivatization was performed for 2 h at 4 °C, and quenching was necessary to avoid unintended reactions [12]. In other studies, optimal reaction condition for derivatization of SCFAs with 3-nitrophenylhydrazine and O-benzylhydroxylamine was determined in 30 min. at 40 °C and 1 h at 25 °C, respectively [13,14].
In the present study, we aimed to develop a simple profiling method of SCFAs from various biological samples. SCFAs were derivatized with 4-acetoamido-7-mercapto-2,1,3-benzoxadiazole (AABD-SH) for 5 min. at room temperature. Derivatization reaction condition was optimized, and the performance of this method was evaluated with standard solutions and biological samples.
2. Materials and Methods
2.1. Materials
Acetic acid (C2), propionic acid (C3), butyric acid(C4), isobutyric acid (C4; 2-methylpropionic acid), 2-methylbutyric acid (C5), isovaleric acid (C5; 3-methylbutyric acid), valeric acid (C5; pentanoic acid), 2,2-dimethylpropionic acid (C5), caproic acid (C6;hexanoic acid), 2,2-dimethylbutyric acid(C6), 2-ethylbutyric acid (C6), and 2-methylvaleric acid (C6; 2-methylpentanoic acid) were purchased from Sigma-Aldrich (St. Louis, MO, USA). Isotope-labeled internal standards, including acetic acid-d3 (C2-2,2,2-d3), propionic acid-d6 (C3-d6), butyric acid-d7 (C4-d7), valeric acid-d4 (C5-2,2,3,3-d4), and caproic acid-d5 (C6-5,5,6,6,6-d5), were purchased from Sigma-Aldrich (St. Louis, MO). All of the stock solutions were prepared in water and stored at −20 °C. 4-Acetoamido-7-mercapto-2,1,3-benzoxadiazole (AABD-SH) was purchased from Tokyo Chemical Industry Co., Ltd (Tokyo, Japan). Triphenylphosphine (TPP), 2,2’-dipyridyl disulfide (DPDS), and other reagents, including mobile phase solvents, were from Sigma-Aldrich or J. T. Bakers (Center Valley, PA, USA).
2.2. Sample Preparation
380 μL water and 20 μL internal standard solution (10 μM each of five internal standards in water) were added to 20–25 mg mouse feces, and the feces sample was homogenized while using a tissueLyzer (Qiagen Inc., Valentia, CA, USA) at 30 Hz for 1.5 min. The sample was centrifuged at 18,900× g for 10 min. at 4 °C, and the supernatant was collected. Afterwards, the solution was transferred to membrane filter (Nanosep 3K centrifugal device, Omega membrane, Pall Corporation, New York, USA) and it was centrifuged at 19,000× g for 20 min. to remove any floating particulates in the supernatant.
For plasma, 380 μL water and 20 μL internal standard solution were added to 200 μL mouse plasma, and mixed well. For exhaled breath condensate, 20 μL internal standard solution was added to 1 mL human exhaled breath condensate (EBC), and mixed well. The mixtures were centrifuged at 19,500× g for 10 min. at 4 °C, and the supernatants were then collected.
For derivatization of SCFAs, 20 μL each of 20 mM AABD-SH, 20 mM TPP, and 20 mM DPDS in dichloromethane were added to the supernatant of a biological sample in a glass tube, and derivatization was performed at room temperature for 5 min while vortexing. The reaction solution was dried under vacuum, and then reconstituted with 20 μL methanol prior to LC-MS/MS analysis. The calibration curves were generated with standard solutions (100 nM to 1 mM).
2.3. Biological Samples
Mice were housed at 21–23 °C with 12 h light/12 h dark cycles at the SPF Animal Facility at the University of Ulsan, with free access to water and rodent chow. All of the animal care and procedures were conducted according to the protocols and guidelines that the University of Ulsan Animal Care and Use Committee approved. Mice feces were collected from 23-week-old male C57BL/6 mice fed a high-fat chow (60% kcal% fat, Research diets, Inc., New Brunswick, NJ, USA) or low-fat chow (10% kcal% fat, Research diets, Inc.) for 12 weeks. Mice feces were frozen in liquid nitrogen and stored at −80 °C until processing. Mice plasma were prepared after anesthesia of male C57BL/6 mice at eight weeks of age. Human EBCs were obtained while using RtubeTM (Respiraotry Research Inc., Austin, TX), following manufacturer’s instruction. The study protocol was approved by the Institutional Review Board (IRB) of Asan Medical Center (2018-0789).
2.4. Liquid Chromatography-Tandem Mass Spectrometry (LC-MS/MS)
An LC-MS/MS system that was equipped with a 1290 HPLC instrument (Agilent Technologies, Glostrup, Denmark), a QTRAP 5500 (ABSciex, Framingham, MA, USA), and a reversed-phase column (Pursuit 5 C18 150 × 2.0 mm; Agilent Technologies, Santa Clara, USA) was employed. MS was conducted in positive ion mode with a turbo ion-spray voltage of 5500 V, while using 20 psi curtain gas, 50 psi nebulizer gas, and 50 psi drying gas at a temperature of 400 °C. The sample injection volume was 3 µL. LC separation was performed while using mobile phase A (0.1 % formic acid in water) and mobile phase B (0.1% formic acid in acetonitrile), at a flow rate of 500 µL/min and a temperature of 40 °C. The separation gradient was as follows: 30% B at 0 min., 30 to 50% B in 30 min., 50 to 30% B in 0.1 min., and 30% B in 4.9 min. A collision energy of 15 V was used for multiple reaction monitoring (MRM), and LC-MS/MS data were analyzed by Analyst 1.5.2 software (AB Sciex). Peak area of each isotope-labeled internal standard was used to normalize that of straight or branched SCFA having the same number of carbons.
2.5. Method Validation
LOQ (limit of quantitation) was obtained from a calibration curve and calculated while using the formula 10 × Sa/b, where Sa is the standard deviation of the Y-intercept of linear regression line, and b is the slope of the calibration curve. [15] Intra- and inter-day reproducibility for standard solutions and biological samples were expressed as relative standard deviation (RSD, %) of three measurements. For intra-day reproducibility, a sample was analyzed three times on the same day. For inter-day reproducibility, a sample was repeatedly analyzed on three consecutive days, while the solution was stored at 4 °C. The quantitation accuracy was assessed by comparing the amount of each SCFA in the spiked and non-spiked supernatants. The known amount of SCFAs was spiked into half of the supernatant of a biological sample after prepared, as described above, and the remaining half of the supernatant was used as the non-spiked control. Additionally, the amounts of spiked SCFAs in the supernatant were expressed as molar concentrations. Quantitation accuracy (%) was calculated while using the equation of (the measured amount of SCFA in spiked supernatant—the measured amount of SCFA in non-spiked control) ÷ the known amount of spiked SCFA in spiked supernatant × 100. The stability of derivatizatives was determined by the repeated injection of the sample solution on day 1, 5, and 7, while they were kept at 4 °C. On each day, three measurements were performed.
3. Results and Discussion
3.1. Liquid Chromatography-Tandem Mass Spectrometry (LC-MS/MS) of Derivatized Short Chain Fatty Acids
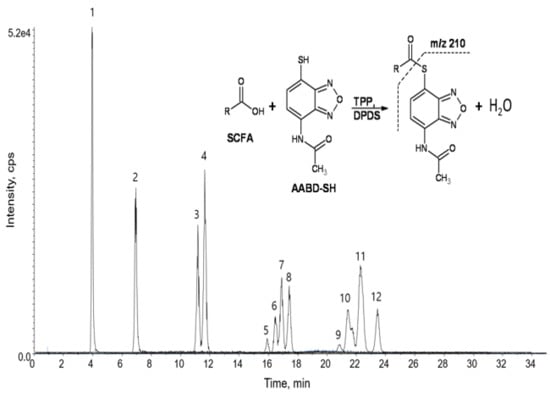
SCFAs were derivatized with AABD-SH. This compound has been used as a fluorescent derivatization reagent for carboxylic acid moieties, such as fatty acids, bile acids, and prostaglandins [16]. Biological samples contain many kinds of carboxylic acids, hence MS is suitable for the specific detection of biomolecules derivatized with AABD-SH. Derivatized SCFAs with AABD-SH resulted in reasonable chromatographic separation and good electrospray ionization (ESI). The specific detection of each SCFA was possible from the unique fragmentation pattern during collision-induced dissociation (CID). Derivatized SCFAs could be separated while using a reversed-phase LC column, and different retention times among 12 SCFAs provide another feature for specific analysis.
Figure 1 shows MS/MS spectra of derivatized acetic acid (C2) and valeric acid (C5). The most abundant product ion in MS/MS was m/z 210.2, corresponding to the derivatization reagent, hence this peak was used for quantitation. For isotope-labeled internal standards of acetic acid, propionic acid, butyric acid, and valeric acid, the product ion was m/z 211.2, due to the presence of deuterium at C-2 position of carboxylic acid (Figure S1), where the deuterium was transferred to thiol group of a derivatization reagent when it was cleavaged during CID process. Internal standard of caproic acid does not have any deuterium at C-2 position of carboxylic acid, and the product ion during CID was m/z 209.8. Table 1 summarizes the instrumental parameters, MS/MS transitions, and analytical parameters of this method. Figure 2 shows the extracted ion chromatogram (EIC) of each SCFA and its corresponding internal standard (EICs for 12 SCFAs in various biological samples can be found in Figure S2). The derivatization of SCFAs with AABD-SH increased both the size and hydrophobicity of the molecules, and it resulted in longer retention times on reversed-phase LC. SCFAs with 4–6 carbons consist of several structural isomers. This strategy afforded good separation of structural isomers. Shorter SCFAs eluted earlier than longer SCFAs, and straight chain SCFAs eluted later than the branched chain SCFAs, as expected.
3.2. Optimization of the Derivatization Reaction and Method Validation
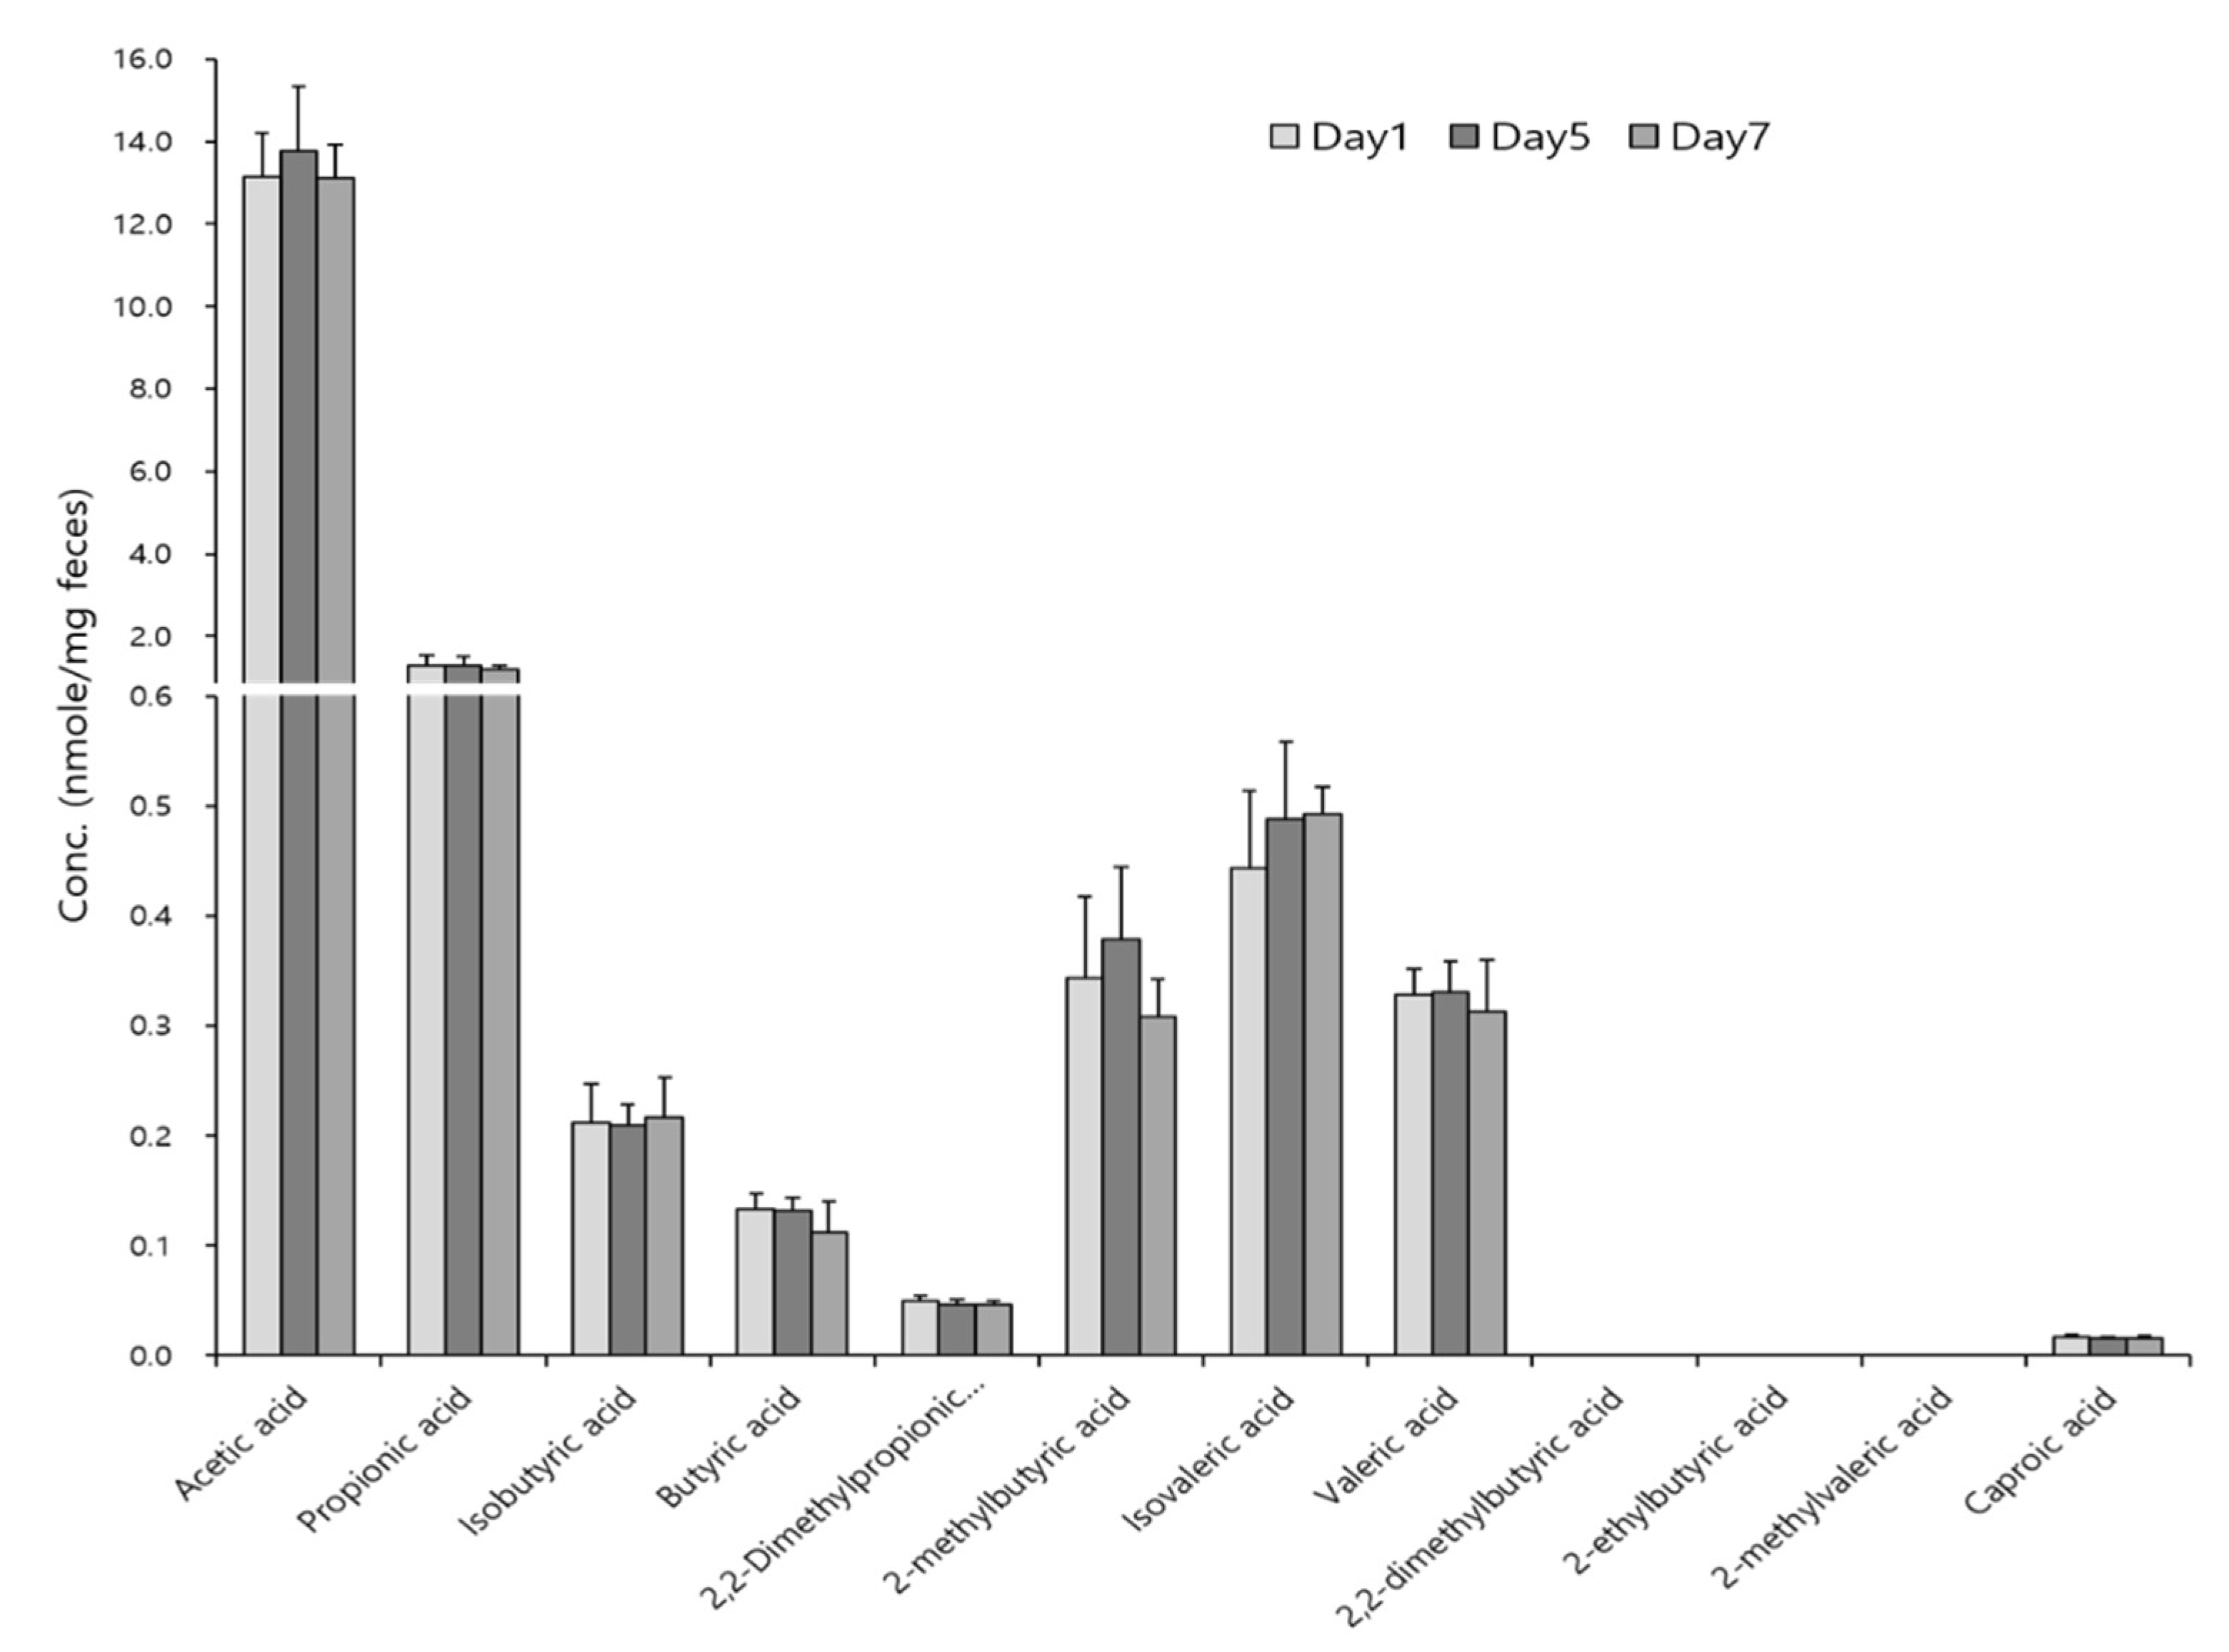
The reaction duration was optimized first at room temperature and it was not a critical factor for derivatization (Figure 3A). Next, we investigated the effect of reaction temperature on derivatization, and the differences of peak abundances at different temperatures (4 °C, room temperature, and 40 °C) were negligible (Figure 3B). Thus, chemical derivatization was performed for 5 min. at room temperature in subsequent experiments. The main advantage of the method is that the derivatization reaction duration is short, and the conditions are mild (room temperature) and barely affect the experimental results. The derivatized reaction products were stable for a week (Figure 4). The calibration curve for each SCFA can be found in Figure S3, and analytical parameters, such as LOQ, accuracy, and reproducibility, are shown in Table 1. The reproducibility of this method was also evaluated with biological samples (Table 2). RSD was less than 10 % for intra- and inter-day measurements with few exceptions.
Quantitation accuracy was determined with the amount of recovered SCFA after spiking known amount of standard solutions into the supernatants of biological samples (Table S1). The quantitation accuracies for straight chain SCFAs ranged from 85 to 114%. However, the quantitation accuracies for branched chain SCFAs ranged from 51 to 130 %. The internal standards used for this study were all isotope-labeled straight chain SCFAs, thus use of isotope-labeled branched chain SCFAs may improve the quantitation accuracies for branched chain SCFAs. Other research groups also reported similar observations [17,18]. To best of our knowledge, this is the first measurement of SCFAs in human exhaled breath condensates (EBCs), although only several SCFAs were observed. Recently, the role of the microbiome in pulmonary diseases has drawn attention, and SCFAs have been determined in diverse airway samples, such as sputum and bronchoalveolar lavage [19,20,21]. Thus, we suspected that SCFAs would be present in human EBCs. The determination of SCFAs in EBCs could be useful for investigating the relationships between the microbiome and lung diseases.
This simple and robust derivatization reaction facilitates LC-MS/MS analysis of SCFAs. However, LC separation among structural isomers of C5 SCFAs would be improved, as shown in Figure S4, where the complete baseline separation for 12 SCFAs was achieved with less steep gradient and lower column temperature in longer LC run time (65 min.). Instead, we chose shorter LC run time (35 min.), as shown in Figure 2, although baseline separation between peak 6 and peak 7 was not achieved. Resolution (Rs) between two peaks is defined as the difference in the retention times between two peaks, divided by the combined widths of the two peaks (2 × (tR2 − tR1) / (w1 + w2)) and Rs between peak 6 and peak 7 in Figure 2 was 1. A study reported that the integration error was less than about 2% for Rs = 1 when a smaller peak is about 60 % of a larger peak, and drop method and peak area were used for quantitation [22,23]. In our study, the peak height of peak 6 was approximately 60 % of that of peak 7, and we also used drop method and peak area for quantitation. Thus, the quantitation error for peak 6 and peak 7 may not be serious, although it should depend on the type of your research. The integration error could be decreased further if peak height was used instead of peak area for quantitation [22]. If more accurate measurement was necessary for all structural isomers of C5 SCFAs, experimental condition used in Figure S4 should be used. Analysis of large number of samples is often required in biological studies. Only small number of samples could be analyzed in a batch when 65 min. LC run time is used, considering analysis of calibration solutions and QC samples in every batch. For high throughput analysis, experimental conditions using 35 min. LC run time was chosen in our study. Alternatively, C8 reversed-phase column may perform similarly as C18 reversed-phase column in a shorter run time, although a significant effort needs to optimize chromatographic condition [24,25]. Various kinds of metabolites in biological samples often contain carboxylic acids. Thus, the precursor ion scan of 210 for derivatized metabolites with AABD-SH would be useful for profiling metabolites with carboxylic acid moiety in metabolomics studies.
3.3. Profiling of SCFAs in Biological Samples
The developed method was applied to profile SCFAs in mice feces of high-fat or low-fat diet shown in Table 3. Lower acetic acid and propionic acid were observed in the mice feces of high-fat diet. However, butyric acid and valeric acid were increased in high-fat diet mice. One research group showed that fecal acetic acid, propionic acid, and butyric acid were decreased in high-fat diet when compared to low fat diet [26]. Another research group reported that dietary fat resulted in decreased acetic acid, propionic acid, and butyric acid in cecum content of pigs [27]. Fecal SCFAs of high-fat diet mice were also compared with those of normal diet mice. High-fat diet induced significant weight gain and reduced fecal SCFAs [28,29]. These studies generally reported that high-fat diet induced decreased fecal SCFAs. In our study, more than half of the fecal SCFAs were reduced in high fat diet as compared to low fat diet. Variations in fecal SCFAs may be attributed to the specific experimental conditions, such as the amount of fat intake, feeding periods, and ages of mice.
4. Conclusions
A simple profiling method of SCFAs using LC-MS/MS was developed. The derivatization reaction was finished for 5 min. at room temperature. Good accuracy and reproducibility were obtained at various biological matrices. This method can facilitate the profiling of SCFAs in various biological samples, in which the SCFA content is highly variable due to diet or microbiome.
Supplementary Materials
The following are available online at https://www.mdpi.com/2218-1989/9/9/173/s1, Table S1: Quantitation accuracies of spiked SCFAs in mouse feces, mouse plasma and human EBC. Figure S1: Tandem mass spectrometry (MS/MS) spectra of (A) derivatized acetic acid-2,2,2-d3 (internal standard for C2), (B) derivatized valeric acid-2,2,3,3-d4 (internal standard for C5), (C) derivatized Caproic acid-5,5,6,6,6-d5 (internal standard for C6), Figure S2: Extracted ion chromatograms of SCFAs in (A) a standard solution (1μM) and (B) mouse feces (C) mouse plasma, and (D) human EBC, Figure S3: Calibration curves for 12 SCFAs, Figure S4: Extracted ion chromatograms of 12 SCFAs in a standard solution (10 μM, 65 min. LC run time).
Author Contributions
Conceptualization, H.J.Y.; Data curation, S.J.K.; Formal analysis, H.E.S. and H.Y.L.; Funding acquisition, S.H.B. and H.J.Y.; Methodology, H.E.S.; Project administration, H.J.Y.; Resources, S.H.B.; Writing – original draft, H.J.Y.; Writing – review & editing, H.J.Y. and S.H.B.
Funding
This research was funded by a grant (W17-789) from the Asan Institute of Life Sciences, Asan Medical Center, Seoul, and by the Basic Science Research Program through the National Research Foundation of Korea (NRF) funded by the Ministry of Science, ICT & Future Planning (2016R1D1A1B03935517) and Priority Research Centers Programs (2014R1A6A1030318), Republic of Korea.
Acknowledgments
We thank the Metabolomics core at the Convergence Medicine Research Center, Asan Medical Center for support and instrumentation.
Conflicts of Interest
The authors declare no conflict of interest.
References
- Topping, D.L.; Clifton, P.M. Short-chain fatty acids and human colonic function: roles of resistant starch and nonstarch polysaccharides. Physiol. Rev. 2001, 81, 1031–1064. [Google Scholar] [CrossRef] [PubMed]
- Den Besten, G.; van Eunen, K.; Groen, A.K.; Venema, K.; Reijngoud, D.J.; Bakker, B.M. The role of short-chain fatty acids in the interplay between diet, gut microbiota, and host energy metabolism. J. Lipid Res. 2013, 54, 2325–2340. [Google Scholar] [CrossRef] [PubMed] [Green Version]
- Byrne, C.S.; Chambers, E.S.; Morrison, D.J.; Frost, G. The role of short chain fatty acids in appetite regulation and energy homeostasis. Int. J. Obes. (Lond.) 2015, 39, 1331–1338. [Google Scholar] [CrossRef] [PubMed] [Green Version]
- Canfora, E.E.; Jocken, J.W.; Blaak, E.E. Short-chain fatty acids in control of body weight and insulin sensitivity. Nat. Rev. Endocrinol. 2015, 11, 577–591. [Google Scholar] [CrossRef] [PubMed]
- Gao, X.; Pujos-Guillot, E.; Martin, J.F.; Galan, P.; Juste, C.; Jia, W.; Sebedio, J.L. Metabolite analysis of human fecal water by gas chromatography/mass spectrometry with ethyl chloroformate derivatization. Analyt. Biochem. 2009, 393, 163–175. [Google Scholar] [CrossRef] [PubMed]
- Zheng, X.; Qiu, Y.; Zhong, W.; Baxter, S.; Su, M.; Li, Q.; Xie, G.; Ore, B.M.; Qiao, S.; Spencer, M.D.; et al. A targeted metabolomic protocol for short-chain fatty acids and branched-chain amino acids. Metabolomics 2013, 9, 818–827. [Google Scholar] [CrossRef] [PubMed] [Green Version]
- Kvitvang, H.F.; Andreassen, T.; Adam, T.; Villas-Boas, S.G.; Bruheim, P. Highly sensitive GC/MS/MS method for quantitation of amino and nonamino organic acids. Anal. Chem. 2011, 83, 2705–2711. [Google Scholar] [CrossRef] [PubMed]
- Zhang, S.; Wang, H.; Zhu, M.J. A sensitive GC/MS detection method for analyzing microbial metabolites short chain fatty acids in fecal and serum samples. Talanta 2019, 196, 249–254. [Google Scholar] [CrossRef]
- Zhou, B.; Xiao, J.F.; Tuli, L.; Ressom, H.W. LC-MS-based metabolomics. Mol. Biosyst. 2012, 8, 470–481. [Google Scholar] [CrossRef]
- Perez, E.R.; Knapp, J.A.; Horn, C.K.; Stillman, S.L.; Evans, J.E.; Arfsten, D.P. Comparison of LC-MS-MS and GC-MS Analysis of Benzodiazepine Compounds Included in the Drug Demand Reduction Urinalysis Program. J. Anal. Toxicol. 2016, 40, 201–207. [Google Scholar] [CrossRef]
- Van Eijk, H.M.; Bloemen, J.G.; Dejong, C.H. Application of liquid chromatography-mass spectrometry to measure short chain fatty acids in blood. J. Chromatogr. 2009, 877, 719–724. [Google Scholar] [CrossRef] [PubMed]
- Chan, J.C.; Kioh, D.Y.; Yap, G.C.; Lee, B.W.; Chan, E.C. A novel LCMSMS method for quantitative measurement of short-chain fatty acids in human stool derivatized with (12)C- and (13)C-labelled aniline. J. Pharm. Biomed. Anal. 2017, 138, 43–53. [Google Scholar] [CrossRef] [PubMed]
- Zeng, M.; Cao, H. Fast quantification of short chain fatty acids and ketone bodies by liquid chromatography-tandem mass spectrometry after facile derivatization coupled with liquid-liquid extraction. J. Chromatogr. 2018, 1083, 137–145. [Google Scholar] [CrossRef] [PubMed]
- Han, J.; Lin, K.; Sequeira, C.; Borchers, C.H. An isotope-labeled chemical derivatization method for the quantitation of short-chain fatty acids in human feces by liquid chromatography-tandem mass spectrometry. Anal. Chim. Acta. 2015, 854, 86–94. [Google Scholar] [CrossRef] [PubMed]
- Sengul, U. Comparing determination methods of detection and quantification limits for aflatoxin analysis in hazelnut. J. Food Drug Anal. 2016, 24, 56–62. [Google Scholar] [CrossRef] [PubMed] [Green Version]
- Santa, T.; Okamoto, T.; Uchiyama, S.; Mitsuhashi, K.; Imai, K. A new fluorogenic reagent for carboxylic acids, 7-acetylamino-4-mercapto-2,1,3-benzoxadiazole (AABD-SH), derived from an empirical method for predicting fluorescence characteristics. Analyst 1999, 124, 1689–1693. [Google Scholar] [CrossRef]
- Garcia-Villalba, R.; Gimenez-Bastida, J.A.; Garcia-Conesa, M.T.; Tomas-Barberan, F.A.; Carlos Espin, J.; Larrosa, M. Alternative method for gas chromatography-mass spectrometry analysis of short-chain fatty acids in faecal samples. J. Sep. Sci. 2012, 35, 1906–1913. [Google Scholar] [CrossRef] [PubMed]
- Lotti, C.; Rubert, J.; Fava, F.; Tuohy, K.; Mattivi, F.; Vrhovsek, U. Development of a fast and cost-effective gas chromatography-mass spectrometry method for the quantification of short-chain and medium-chain fatty acids in human biofluids. Anal. Bioanal. Chem. 2017, 409, 5555–5567. [Google Scholar] [CrossRef] [PubMed]
- Molyneaux, P.L.; Cox, M.J.; Willis-Owen, S.A.; Mallia, P.; Russell, K.E.; Russell, A.M.; Murphy, E.; Johnston, S.L.; Schwartz, D.A.; Wells, A.U.; et al. The role of bacteria in the pathogenesis and progression of idiopathic pulmonary fibrosis. Am. J. Respir. Crit. Care Med. 2014, 190, 906–913. [Google Scholar] [CrossRef]
- Mirkovic, B.; Murray, M.A.; Lavelle, G.M.; Molloy, K.; Azim, A.A.; Gunaratnam, C.; Healy, F.; Slattery, D.; McNally, P.; Hatch, J.; et al. The Role of Short-Chain Fatty Acids, Produced by Anaerobic Bacteria, in the Cystic Fibrosis Airway. Am. J. Respir. Crit. Care Med. 2015, 192, 1314–1324. [Google Scholar] [CrossRef] [PubMed]
- Molyneaux, P.L.; Cox, M.J.; Wells, A.U.; Kim, H.C.; Ji, W.; Cookson, W.O.; Moffatt, M.F.; Kim, D.S.; Maher, T.M. Changes in the respiratory microbiome during acute exacerbations of idiopathic pulmonary fibrosis. Respir. Res. 2017, 18, 29. [Google Scholar] [CrossRef] [PubMed]
- Bicking, M.K. Integration Errors in Chromatographic Analysis, Part I: Peaks of Approximately Equal Size. LCGC 2006, 24, 402–414. [Google Scholar]
- Meyer, V.R. Errors in the Area Determination of Incompletely Resolved Chromatographic Peaks. J. Chrom. Sci. 1996, 33, 26–33. [Google Scholar] [CrossRef]
- Cledera-Castro, M.; Santos-Montes, A.; Izquierdo-Hornillos, R.; Gonzalo-Lumbreras, R. Comparison of the performance of different reversed-phase columns for liquid chromatography separation of 11 pollutant phenols. J. Sep. Sci. 2007, 30, 699–707. [Google Scholar] [CrossRef] [PubMed]
- Tuzimski, T.; Sherma, J. High Performance Liquid Chromatography in Pesticide Residue Analysis; CRC Press: Boca Raton, FL, USA, 2015; p. 109. [Google Scholar]
- Lu, Y.; Fan, C.; Li, P.; Lu, Y.; Chang, X.; Qi, K. Short Chain Fatty Acids Prevent High-fat-diet-induced Obesity in Mice by Regulating G Protein-coupled Receptors and Gut Microbiota. Sci. Rep. 2016, 6, 37589. [Google Scholar] [CrossRef] [PubMed] [Green Version]
- Yan, H.; Potu, R.; Lu, H.; Vezzoni de Almeida, V.; Stewart, T.; Ragland, D.; Armstrong, A.; Adeola, O.; Nakatsu, C.H.; Ajuwon, K.M. Dietary fat content and fiber type modulate hind gut microbial community and metabolic markers in the pig. PLoS ONE 2013, 8, e59581. [Google Scholar] [CrossRef]
- Agus, A.; Denizot, J.; Thevenot, J.; Martinez-Medina, M.; Massier, S.; Sauvanet, P.; Bernalier-Donadille, A.; Denis, S.; Hofman, P.; Bonnet, R.; et al. Western diet induces a shift in microbiota composition enhancing susceptibility to Adherent-Invasive E. coli infection and intestinal inflammation. Sci. Rep. 2016, 6, 19032. [Google Scholar] [CrossRef]
- Pizzolla, A.; Oh, D.Y.; Luong, S.; Prickett, S.R.; Henstridge, D.C.; Febbraio, M.A.; O’Hehir, R.E.; Rolland, J.M.; Hardy, C.L. High Fat Diet Inhibits Dendritic Cell and T Cell Response to Allergens but Does Not Impair Inhalational Respiratory Tolerance. PLoS ONE 2016, 11, e0160407. [Google Scholar] [CrossRef]
Figure 1.
Tandem mass spectrometry (MS/MS) spectra of (A) derivatized acetic acid (C2) and (B) derivatized valeric acid (C5). Collision energies were 15 V.
Figure 1.
Tandem mass spectrometry (MS/MS) spectra of (A) derivatized acetic acid (C2) and (B) derivatized valeric acid (C5). Collision energies were 15 V.
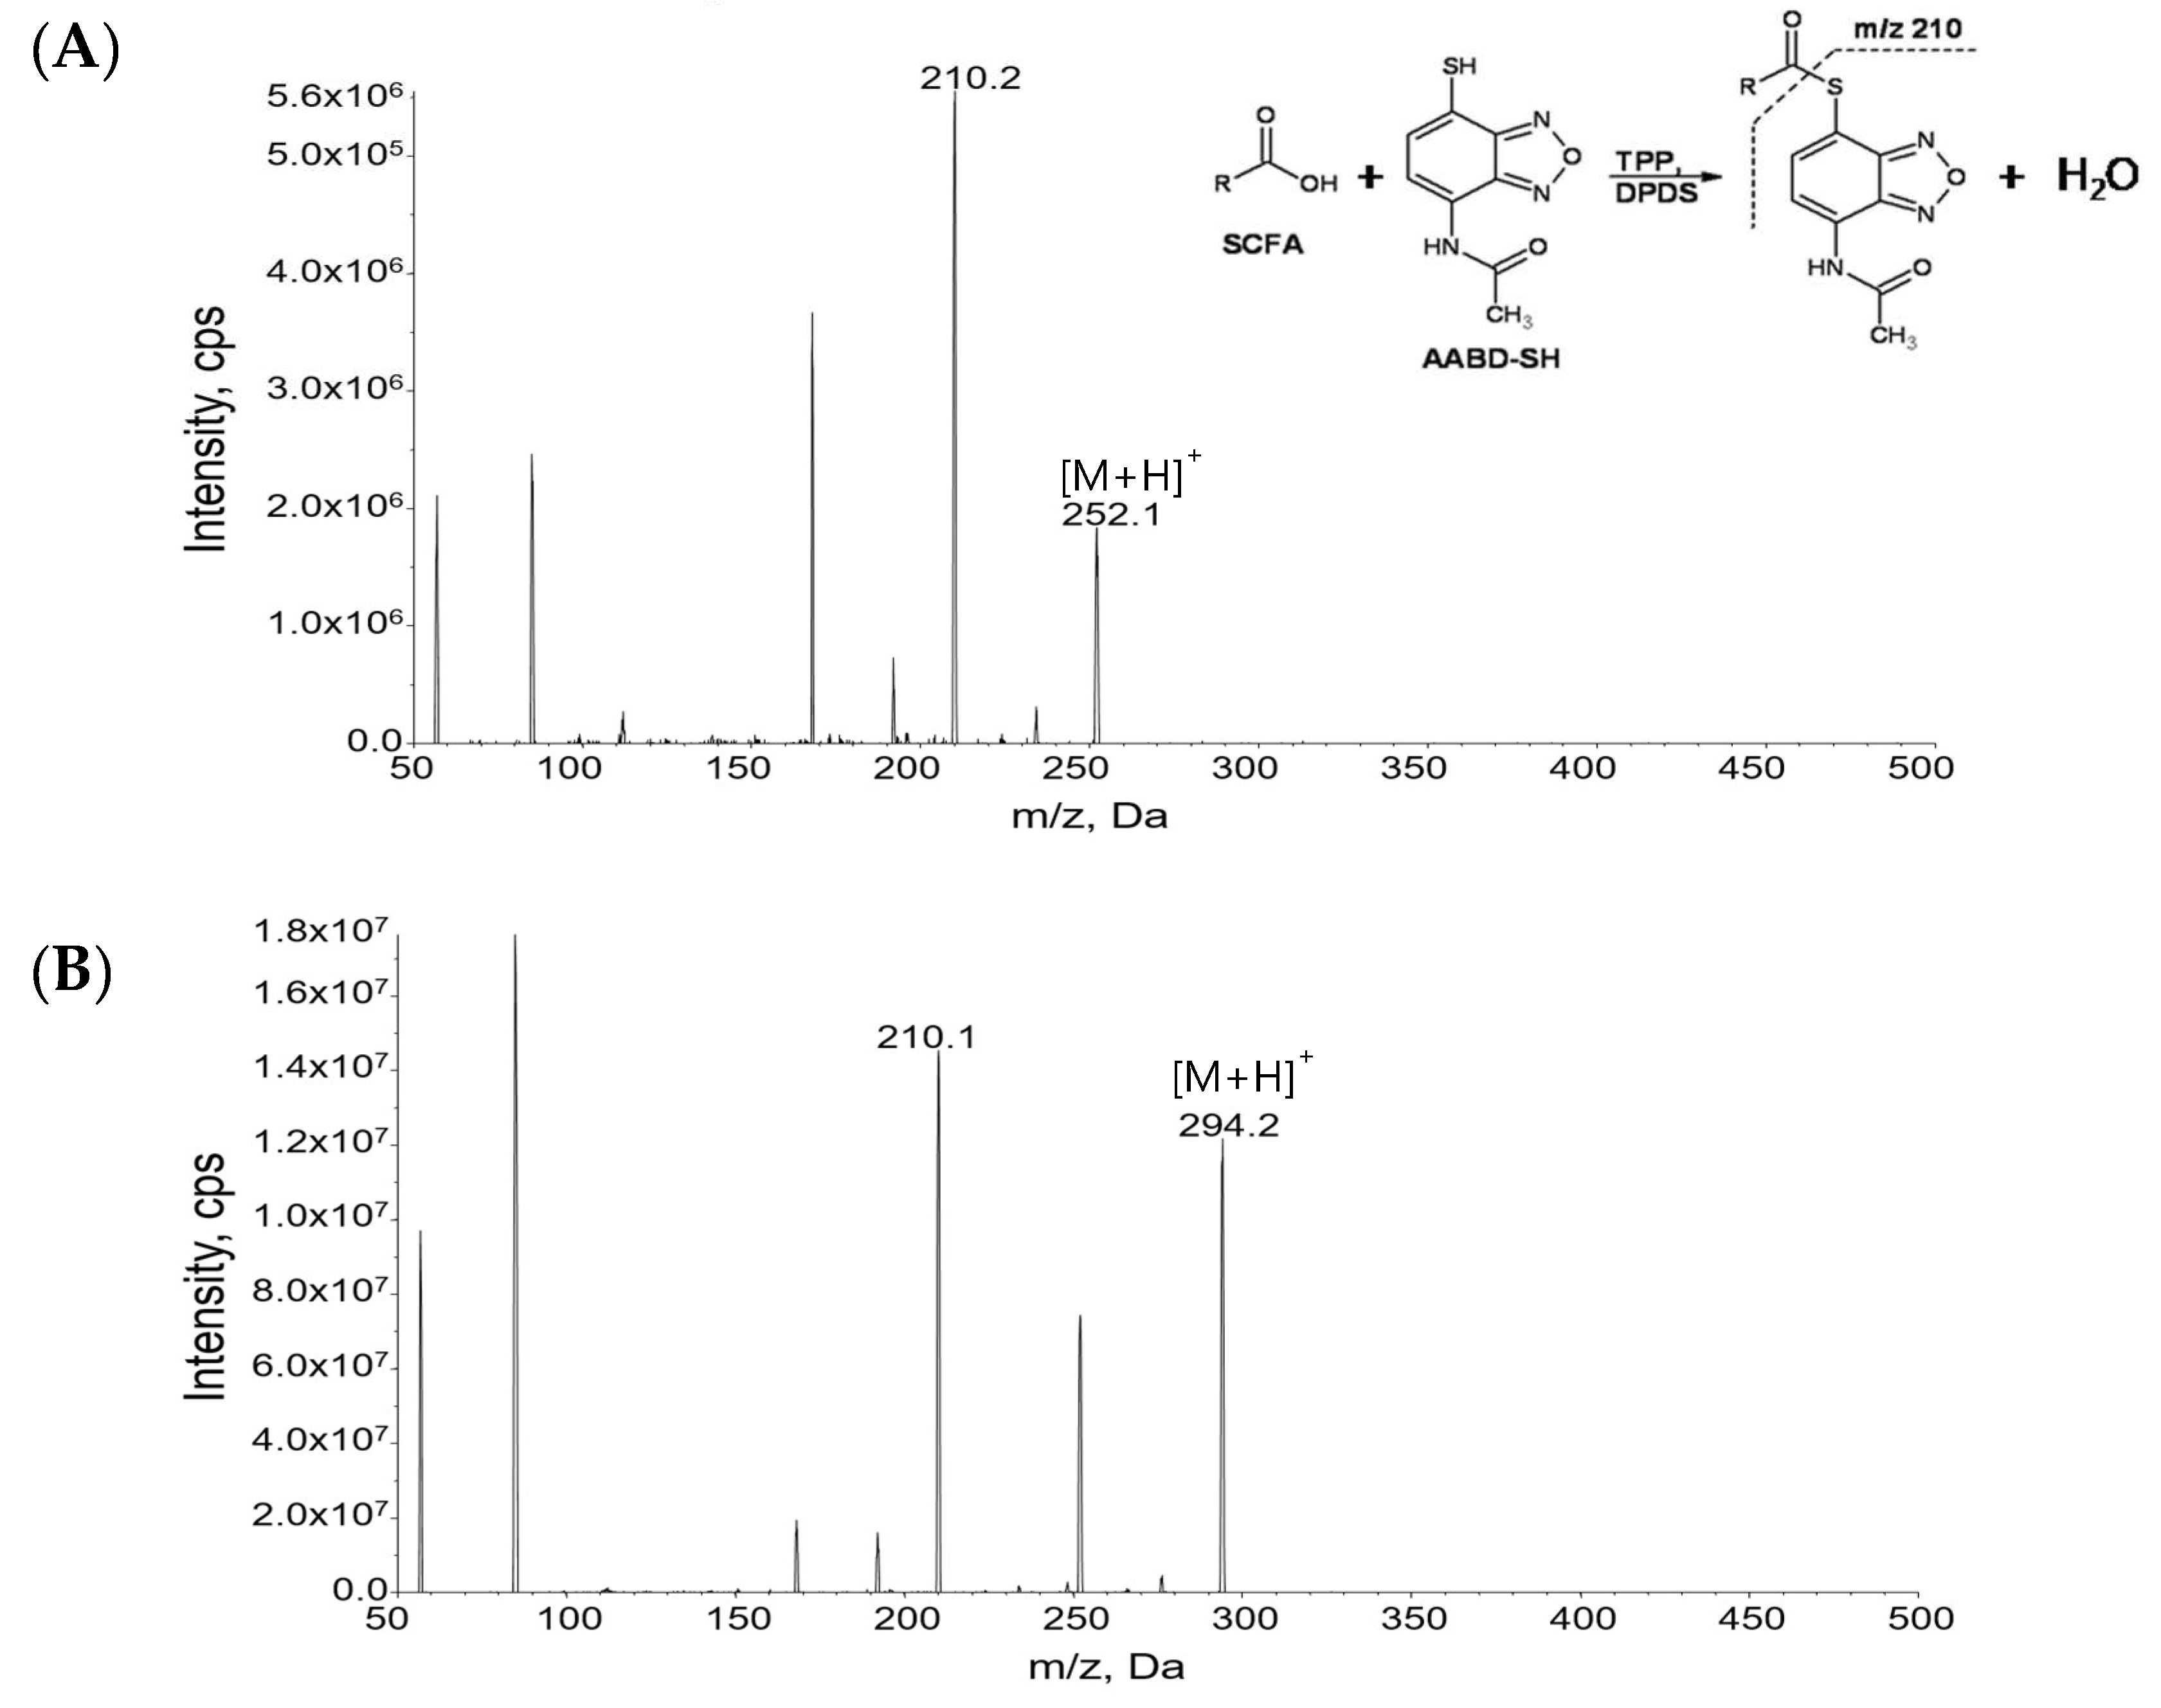
Figure 2.
Extracted ion chromatograms of (A) SCFAs and (B) internal standards in a standard solution (10 μM). The number on top of each peak represents each SCFA (1: acetic acid; 2: propionic acid; 3: isobutyric acid; 4: butyric acid; 5: 2,2-dimethylpropionic acid; 6: 2-methylbutyric acid; 7: isovaleric acid; 8: valeric acid; 9: 2,2-dimethylbutyric acid; 10: 2-ethylbutyric acid; 11: 2-methylvaleric acid; 12: caproic acid). IS represents internal standard.
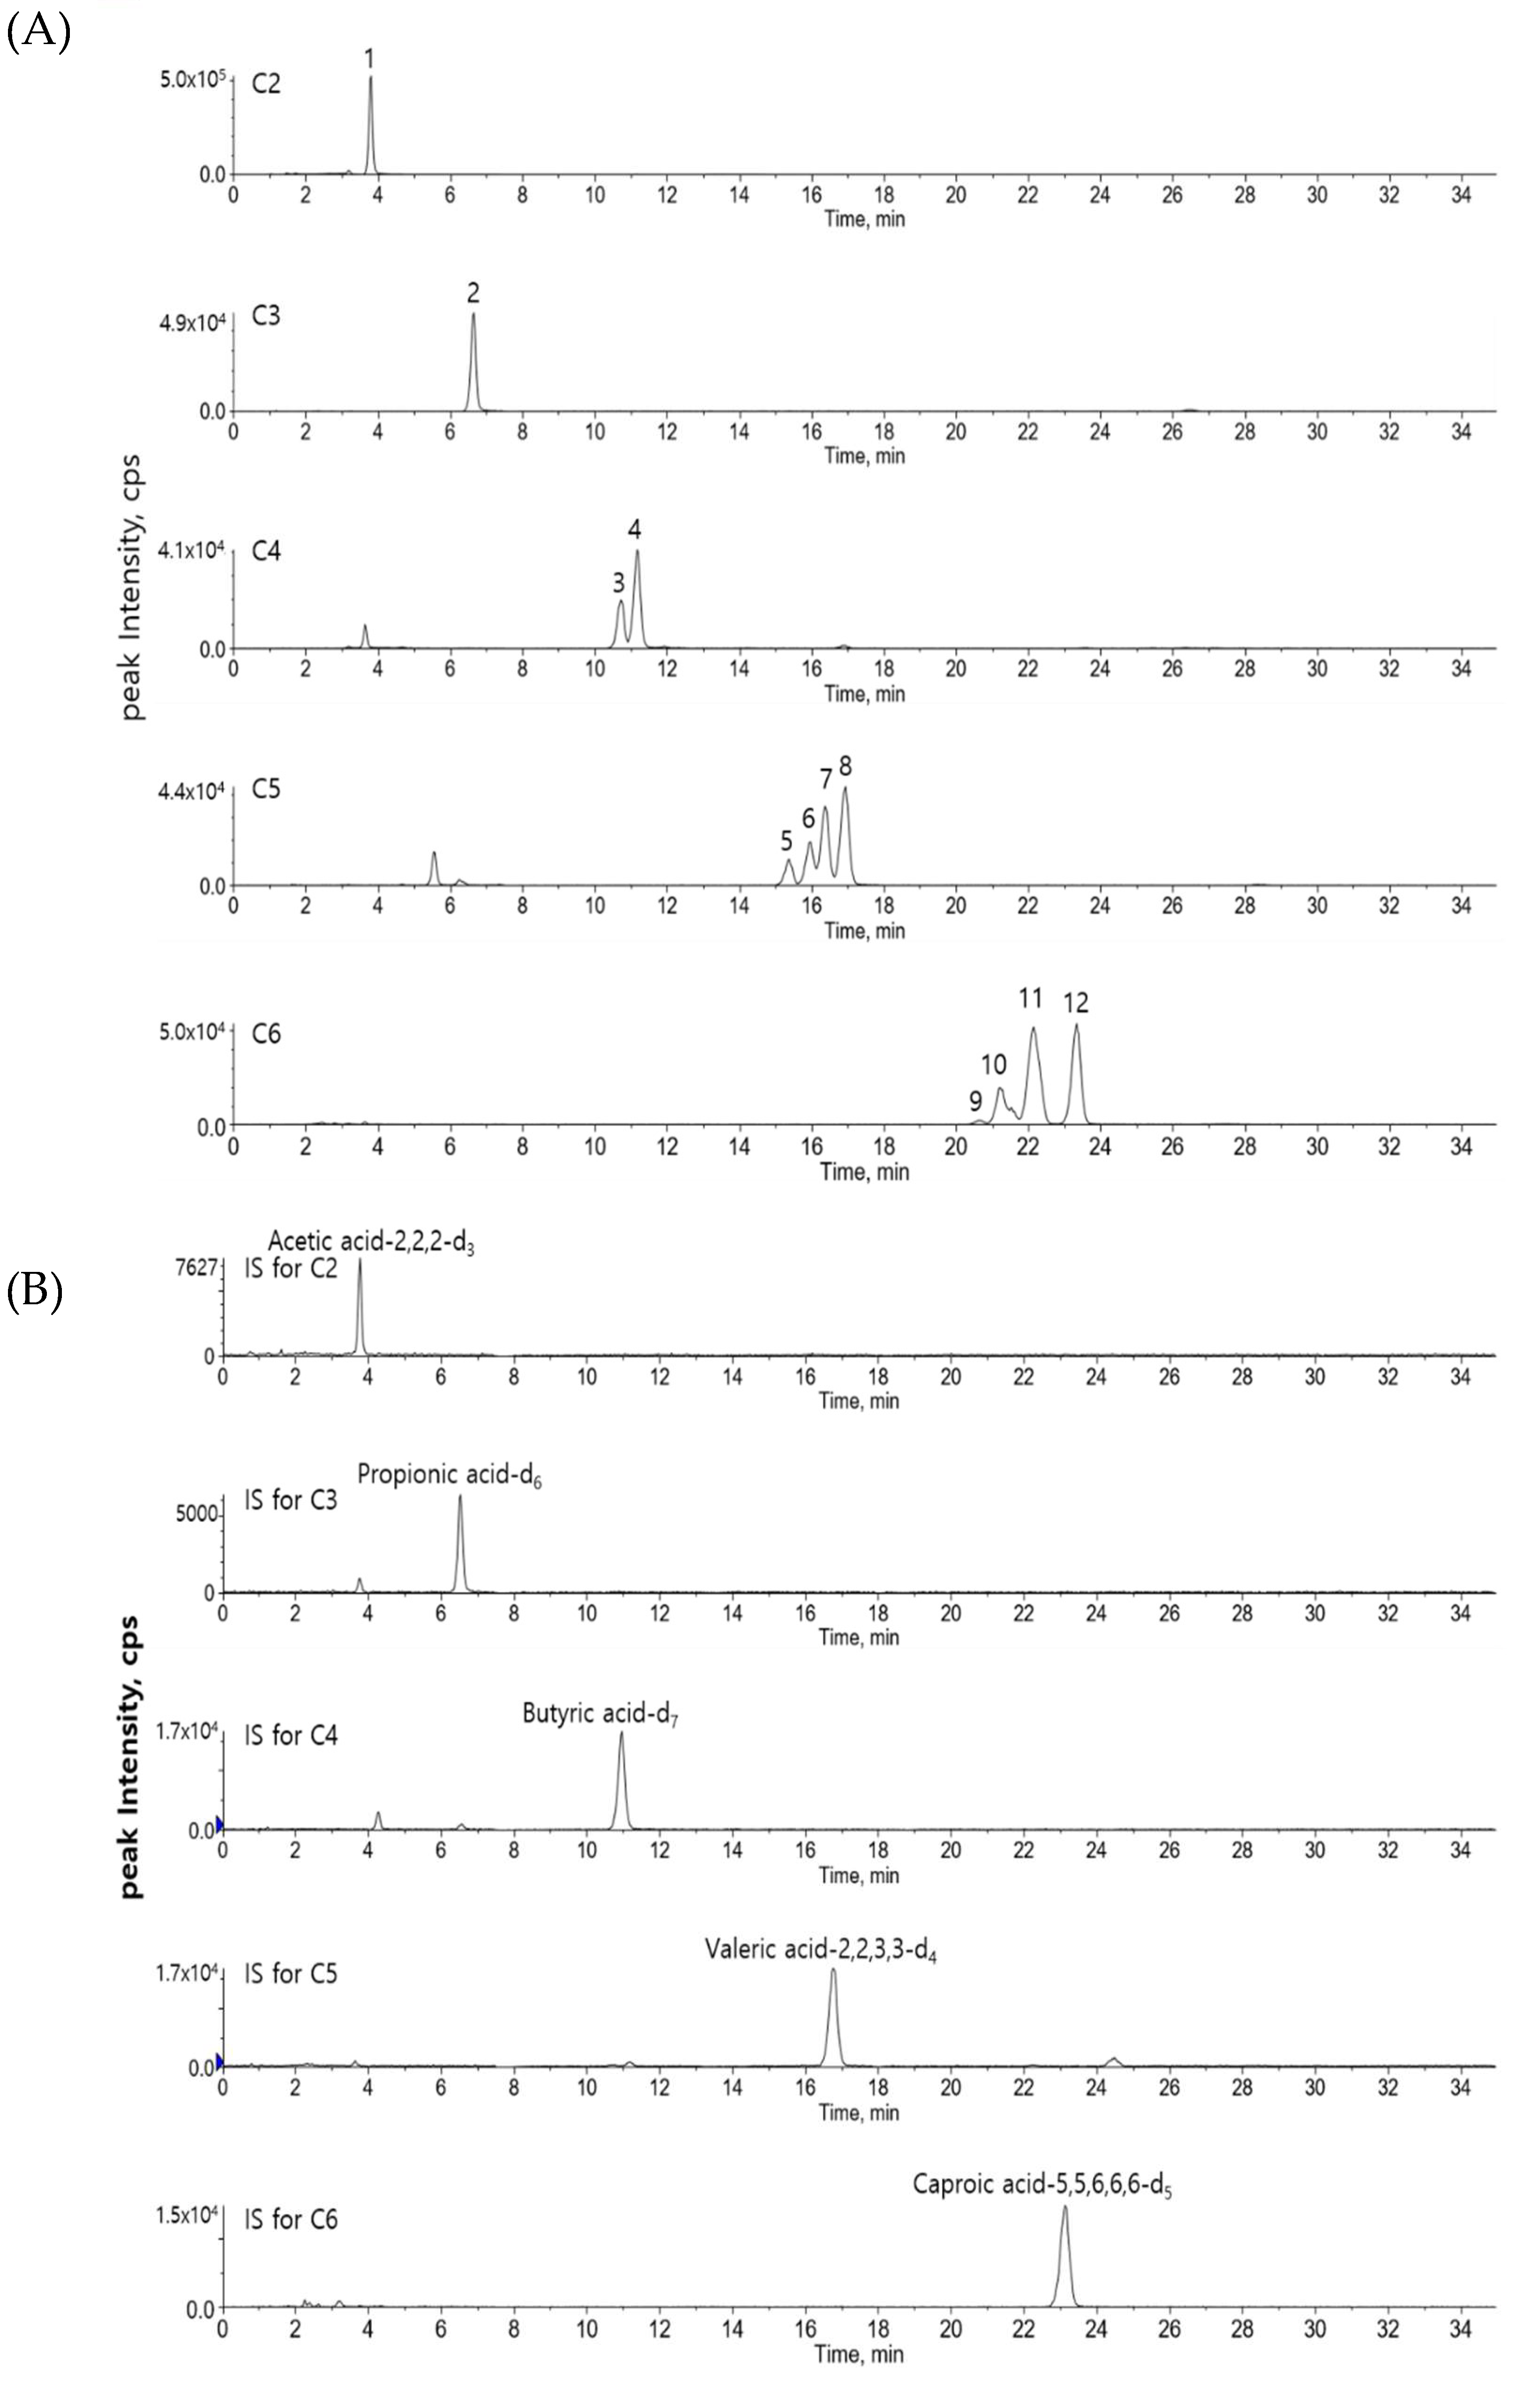
Figure 3.
Optimization of derivatization reaction in terms of (A) reaction time and (B) reaction temperature. Optimized reaction conditions were evaluated using three independent determinations of SCFAs in mouse feces on each condition. Error bar represents the standard deviation of three measurements. RT represents room temperature.
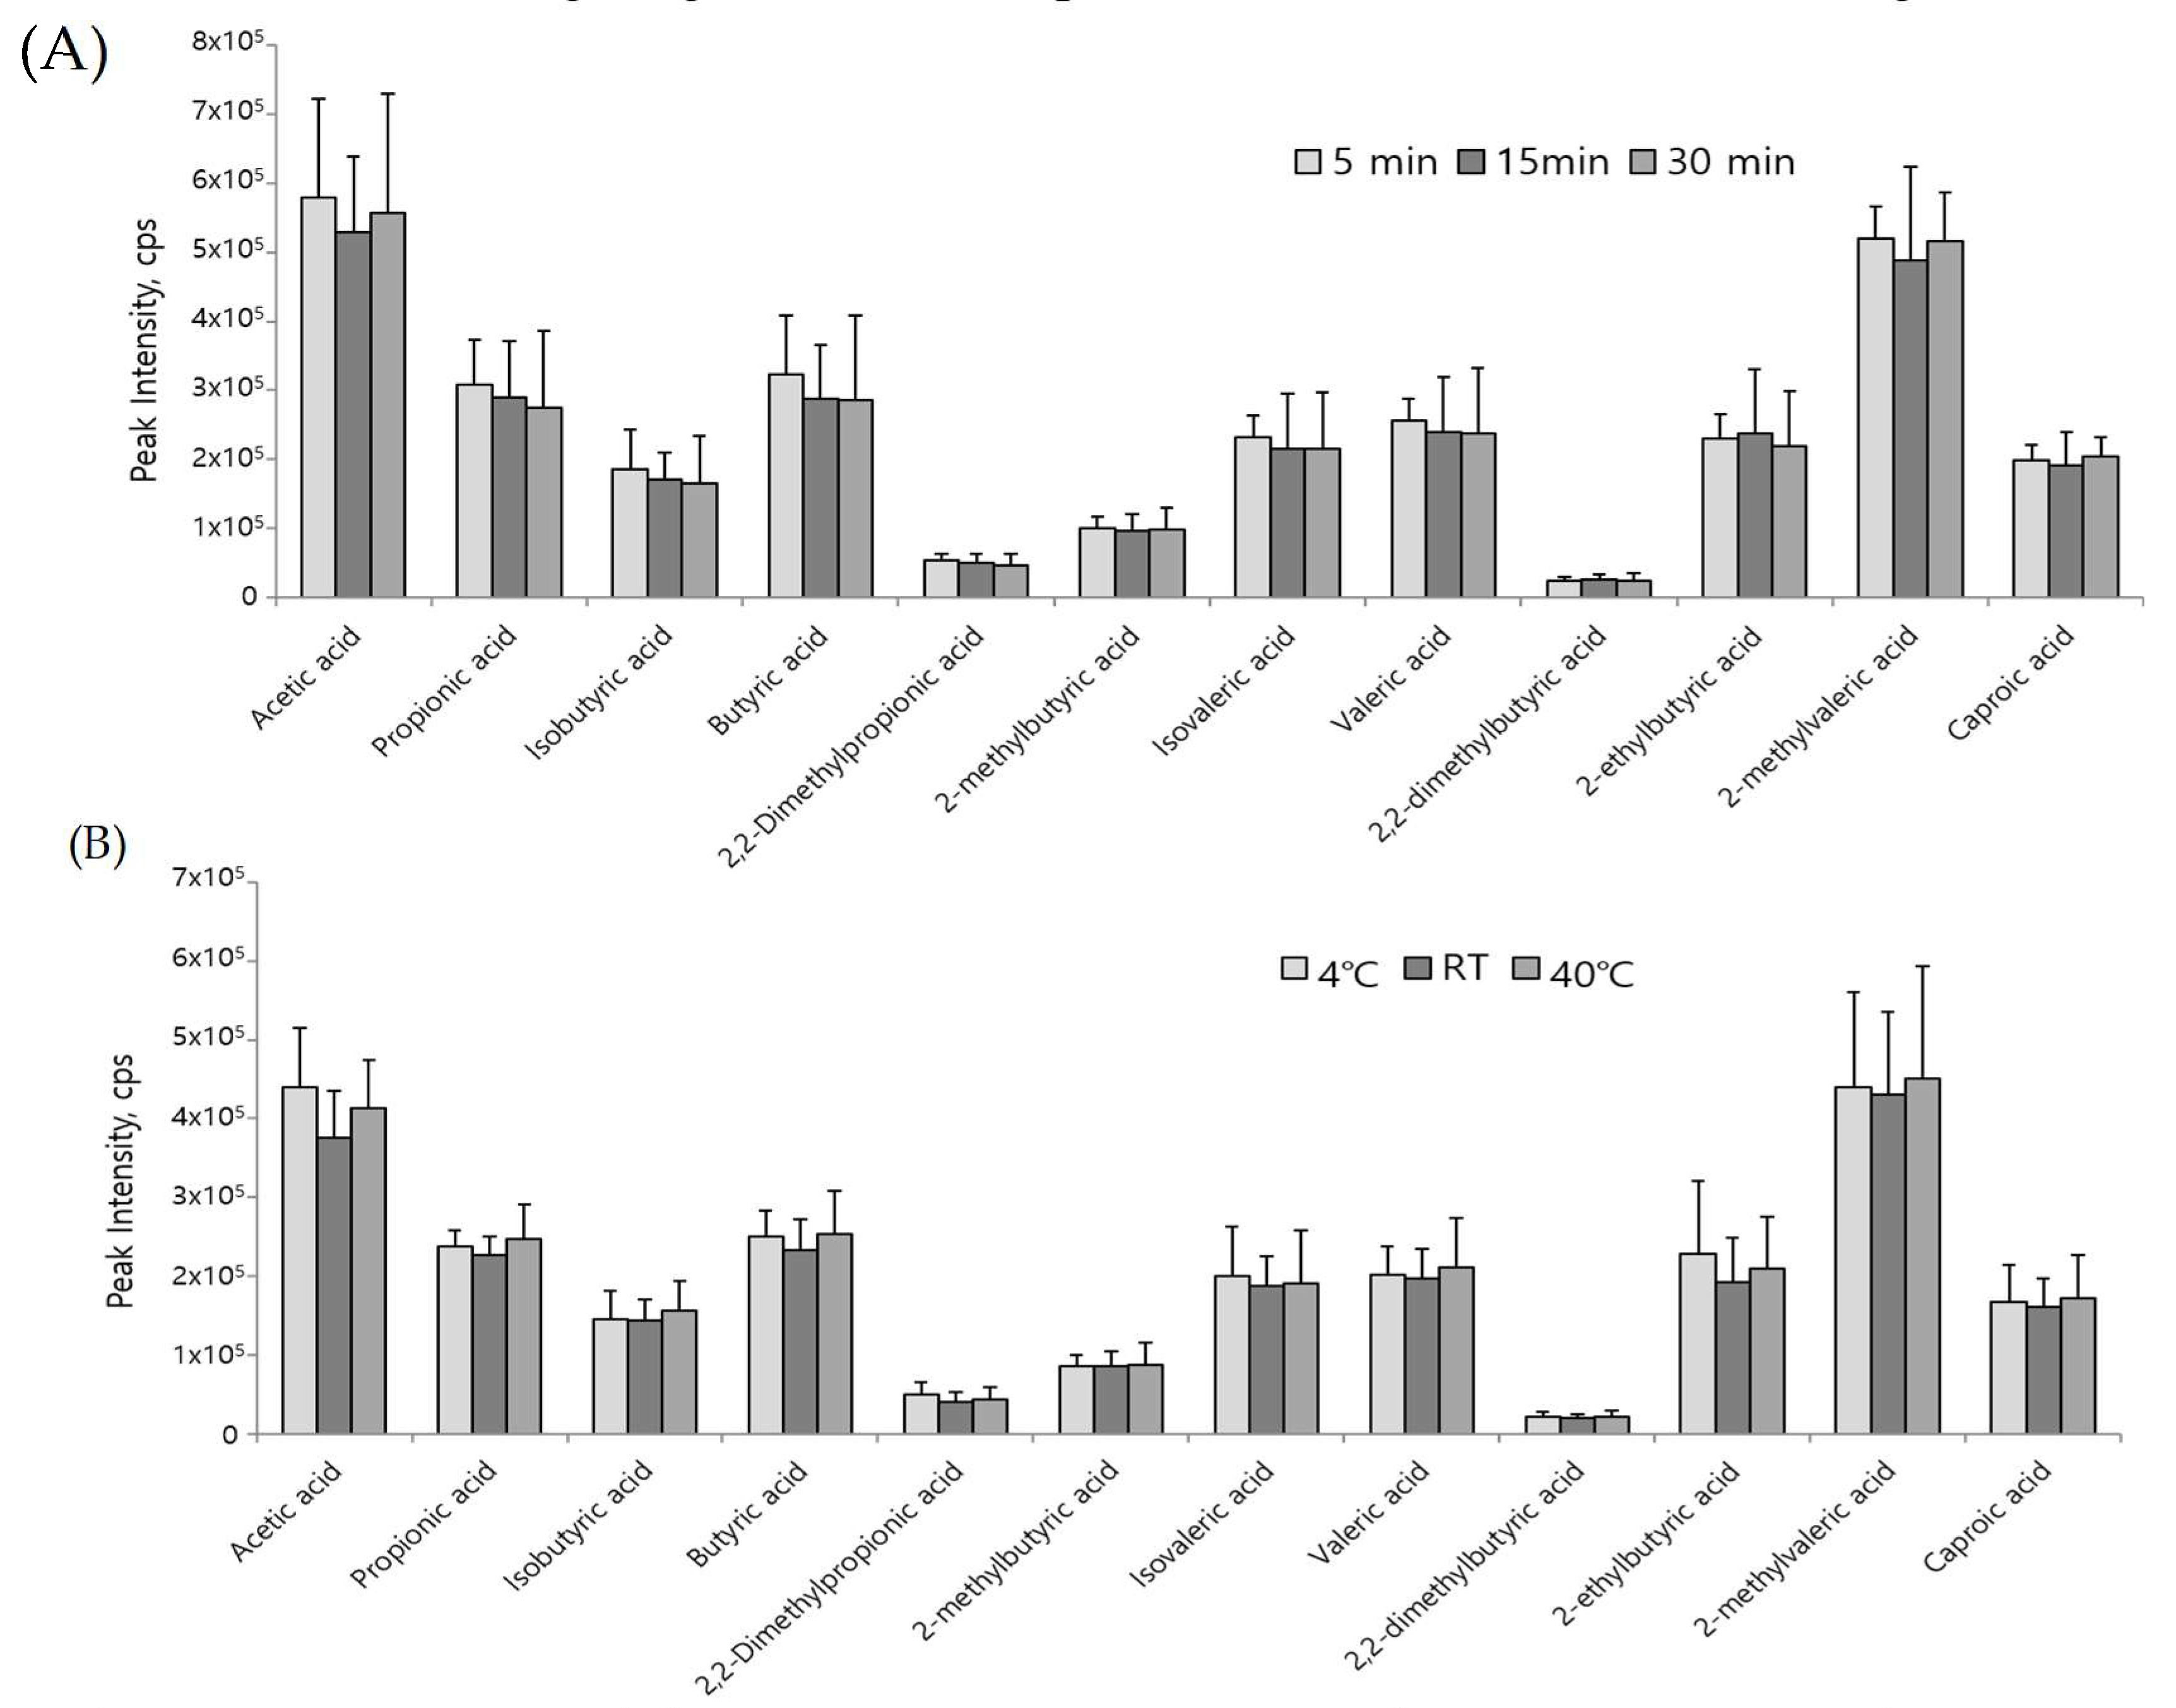
Figure 4.
Stability of derivatized SCFAs in mouse feces. Sample solutions containing derivatized SCFAs were stored at 4 °C and measured on day 1, 5, and 7. Three measurements were performed on each day. Error bar represents the standard deviation of three measurements.
Figure 4.
Stability of derivatized SCFAs in mouse feces. Sample solutions containing derivatized SCFAs were stored at 4 °C and measured on day 1, 5, and 7. Three measurements were performed on each day. Error bar represents the standard deviation of three measurements.

Table 1.
Instrumental parameters, MS/MS transitions used in multiple reaction monitoring (MRM) mode, and analytical parameters, including LOQ (limit of quantitation), accuracy, and reproducibility were shown (n = 3). CE (collision energy) and CXP (collsion cell exit potential) for all short chain fatty acids (SCFAs) and internal standards were 15 V and 20 V, respectively, except CXP (10 V) for acetic acid and propionic acid. DP represents declustering potential, and EP represents entrance potential. R2 is correlation coefficient of a calibration curve. IS represents internal standard.
| Compound | DP | EP | MRM Transitions | IS | Calibration Curve | LOQ, μM (ng/mL) | Intraday (10 μM) | Interday (10 μM) | ||
|---|---|---|---|---|---|---|---|---|---|---|
| (V) | (V) | Q1 | Q3 | Calibration Range (μM) | R2 | RSD, % (Accuracy, %) | RSD, % (Accuracy, %) | |||
| Acetic acid | 70 | 8 | 252 | 210 | A | 1–1000 | 1 | 1.03 (61.8) | 6.66 (98.5) | 14.9 (103) |
| Propionic acid | 30 | 10 | 266 | 210 | B | 0.1–1000 | 0.999 | 0.293 (21.7) | 0.909 (110) | 15.1 (97.4) |
| Isobutyric acid | 70 | 6 | 280 | 210 | C | 0.1–1000 | 0.999 | 0.450 (39.6) | 1.05 (110) | 7.97 (93.2) |
| Butyric acid | 70 | 6 | 280 | 210 | C | 0.1–1000 | 1 | 0.158 (13.9) | 1.72 (116) | 13.4 (97.0) |
| 2,2-dimethylpropionic acid | 50 | 10 | 294 | 210 | D | 0.1–100 | 0.989 | 0.470 (47.9) | 1.75 (110) | 11.3 (86.1) |
| 2-Methylbutyric acid | 50 | 10 | 294 | 210 | D | 0.1–500 | 0.998 | 0.773 (78.8) | 1.50 (102) | 8.87 (86.9) |
| Isovaleric acid | 50 | 10 | 294 | 210 | D | 0.1–100 | 0.999 | 0.624 (63.6) | 2.11 (103) | 9.09 (91.4) |
| Valeric acid | 50 | 10 | 294 | 210 | D | 0.1–1000 | 0.997 | 0.451 (46.0) | 0.475 (101) | 6.00 (87.0) |
| 2,2-Dimethylbutyric acid | 70 | 10 | 308 | 210 | E | 0.1–100 | 0.997 | 0.430 (49.9) | 7.67 (116) | 11.6 (85.7) |
| 2-Ethylbutyric acid, | 70 | 10 | 308 | 210 | E | 0.1–100 | 0.999 | 0.546 (63.3) | 4.83 (108) | 12.2 (96.0) |
| 2-Methylvaleric acid | 70 | 10 | 308 | 210 | E | 0.1–500 | 0.983 | 0.773 (89.7) | 3.38 (112) | 4.49 (105) |
| Caproic acid | 70 | 10 | 308 | 210 | E | 0.1–1000 | 0.994 | 0.609 (70.6) | 1.66 (89.8) | 4.74 (89.3) |
| Acetic acid-2,2,2-d3 (A) | 70 | 6 | 255 | 211 | - | - | - | - | - | - |
| Propionic acid-d6 (B) | 30 | 8 | 272 | 211 | - | - | - | - | - | - |
| Butyric acid- d7 (C) | 70 | 8 | 287 | 211 | - | - | - | - | - | - |
| Valeric acid-2,2,3,3-d4 (D) | 50 | 8 | 298 | 211 | - | - | - | - | - | - |
| Caproic-5,5,6,6,6-d5 (E) | 70 | 8 | 313 | 210 | - | - | - | - | - | - |
Table 2.
Average amounts of SCFAs in biological samples, and their intra- and inter-day reproducibilities. ND represents “not detected”. (n = 3 for intra- or inter-day reproducibility).
Table 2.
Average amounts of SCFAs in biological samples, and their intra- and inter-day reproducibilities. ND represents “not detected”. (n = 3 for intra- or inter-day reproducibility).
| Mouse Feces (nmol/mg) | Mouse plasma (μM) | Human EBC (μM) | |||||||
|---|---|---|---|---|---|---|---|---|---|
| Average | Intraday | Interday | Average | Intraday | Interday | Average | Intraday | Interday | |
| RSD (%) | RSD (%) | RSD (%) | RSD (%) | RSD (%) | RSD (%) | ||||
| Acetic acid | 19.5 | 3.25 | 8.04 | 77.4 | 1.61 | 8.03 | 66.4 | 1.27 | 6.02 |
| Propionic acid | 3.54 | 0.866 | 2.88 | 8.08 | 3.1 | 2.27 | 13.4 | 1.17 | 2.41 |
| Isobutyric acid | 0.802 | 4.87 | 9.23 | 31.1 | 7.37 | 9.74 | 2.43 | 5.2 | 6.15 |
| Butyric acid | 0.0934 | 8.13 | 11.2 | 20.7 | 5.46 | 8.98 | 2.79 | 6.01 | 2.28 |
| 2,2-Dimethylpropionic acid | ND | - | - | 35.9 | 5.17 | 9.73 | ND | - | - |
| 2-Methylbutyric acid | 0.645 | 1.12 | 10 | 14.3 | 6.54 | 12.5 | ND | - | - |
| Isovaleric acid | 0.379 | 1.29 | 8.84 | 9.92 | 6.95 | 18 | ND | - | - |
| Valeric acid | 0.224 | 1.64 | 4.53 | 6.16 | 10.4 | 11.5 | ND | - | - |
| 2,2-Dimethylbutyric acid | ND | - | - | ND | - | - | ND | - | - |
| 2-Ethylbutyric acid | ND | - | - | 0.651 | 7.36 | 11.1 | ND | - | - |
| 2-Methylvaleric acid | ND | - | - | 2.09 | 6.07 | 2.01 | ND | - | - |
| Caproic acid | 0.0125 | 8.74 | 9.61 | 0.711 | 6.66 | 8.95 | ND | - | - |
Table 3.
Quantitation of SCFAs in mice feces fed with high-fat (HFD) or low-fat (LFD) diet. Averages and STDs (standard deviations) of SCFAs were calculated by using three feces samples taken from three mice. ** indicates if p-value < 0.01 and * if p < 0.05 (t test). ND represents “not detected”.
Table 3.
Quantitation of SCFAs in mice feces fed with high-fat (HFD) or low-fat (LFD) diet. Averages and STDs (standard deviations) of SCFAs were calculated by using three feces samples taken from three mice. ** indicates if p-value < 0.01 and * if p < 0.05 (t test). ND represents “not detected”.
| HFD Mouse Feces, (nmol/mg) | LFD Mouse Feces, (nmol/mg) | t Test | |||
|---|---|---|---|---|---|
| Average | STD | Average | STD | ||
| Acetic acid | 16.4 | 0.659 | 19.5 | 1.57 | * |
| Propionic acid | 2.99 | 0.118 | 3.54 | 0.102 | ** |
| Isobutyric acid | 0.416 | 0.0655 | 0.802 | 0.074 | ** |
| Butyric acid | 0.821 | 0.0352 | 0.0934 | 0.0105 | ** |
| 2,2-dimethylpropionic acid | ND | - | ND | - | |
| 2-Methylbutyric acid | 0.534 | 0.0503 | 0.645 | 0.0646 | |
| Isovaleric acid | 0.675 | 0.0046 | 0.379 | 0.0335 | ** |
| Valeric acid | 1.389 | 0.0698 | 0.223 | 0.0101 | ** |
| 2,2-Dimethylbutyric acid | ND | - | ND | - | |
| 2-Ethylbutyric acid | ND | - | ND | - | |
| 2-Methylvaleric acid | ND | - | ND | - | |
| Caproic acid | 0.00478 | 0.000357 | 0.0125 | 0.0012 | ** |
© 2019 by the authors. Licensee MDPI, Basel, Switzerland. This article is an open access article distributed under the terms and conditions of the Creative Commons Attribution (CC BY) license (http://creativecommons.org/licenses/by/4.0/).
Share and Cite
MDPI and ACS Style
Song, H.E.; Lee, H.Y.; Kim, S.J.; Back, S.H.; Yoo, H.J. A Facile Profiling Method of Short Chain Fatty Acids Using Liquid Chromatography-Mass Spectrometry. Metabolites 2019, 9, 173. https://doi.org/10.3390/metabo9090173
AMA Style
Song HE, Lee HY, Kim SJ, Back SH, Yoo HJ. A Facile Profiling Method of Short Chain Fatty Acids Using Liquid Chromatography-Mass Spectrometry. Metabolites. 2019; 9(9):173. https://doi.org/10.3390/metabo9090173
Chicago/Turabian StyleSong, Ha Eun, Hyo Yeong Lee, Su Jung Kim, Sung Hoon Back, and Hyun Ju Yoo. 2019. "A Facile Profiling Method of Short Chain Fatty Acids Using Liquid Chromatography-Mass Spectrometry" Metabolites 9, no. 9: 173. https://doi.org/10.3390/metabo9090173
Note that from the first issue of 2016, this journal uses article numbers instead of page numbers. See further details here.