
Metabolic Flux Distribution during Defatting of Steatotic Human Hepatoma (HepG2) Cells

Abstract
:1. Introduction
2. Results

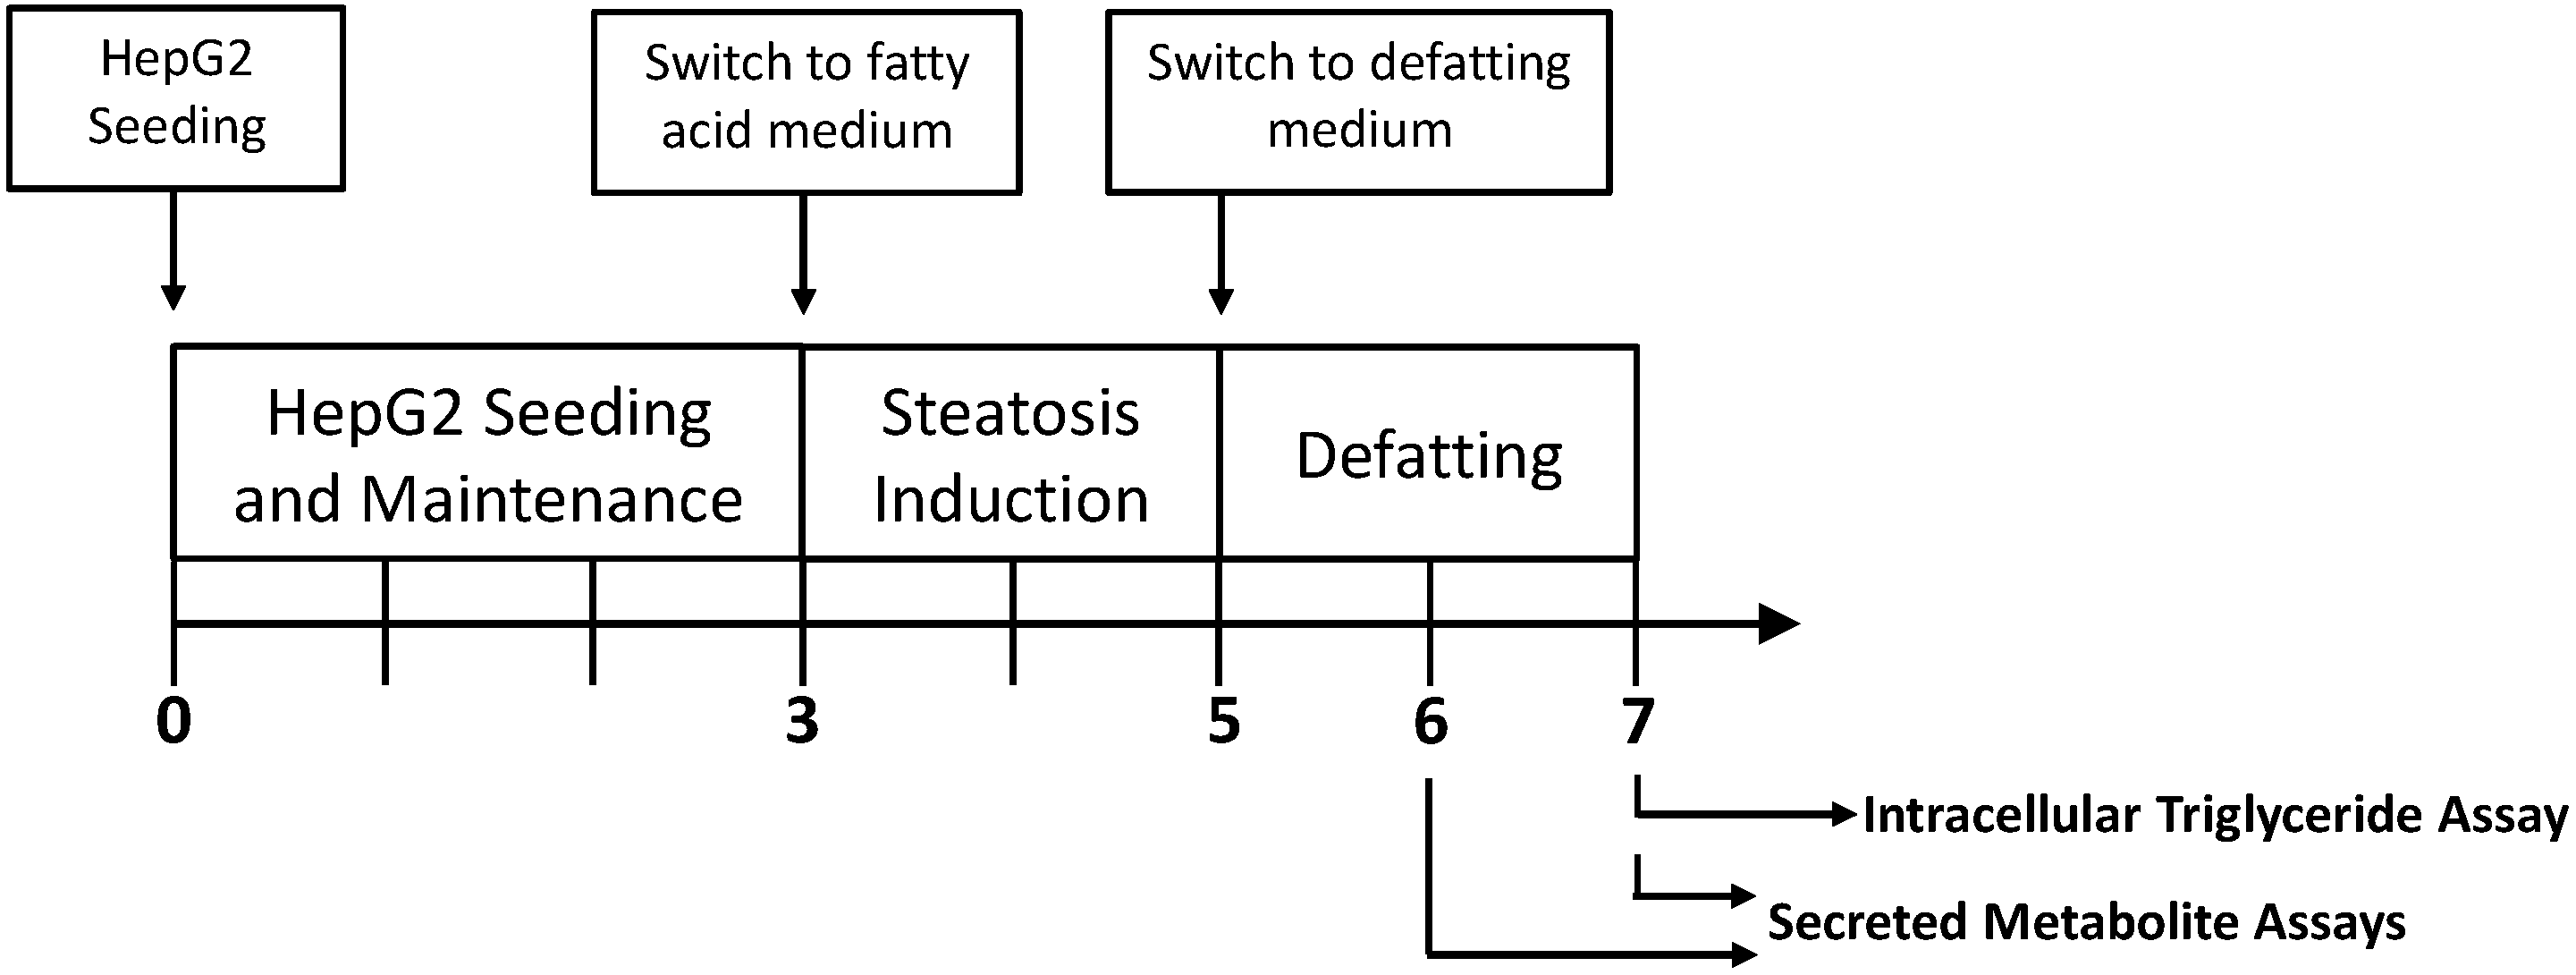
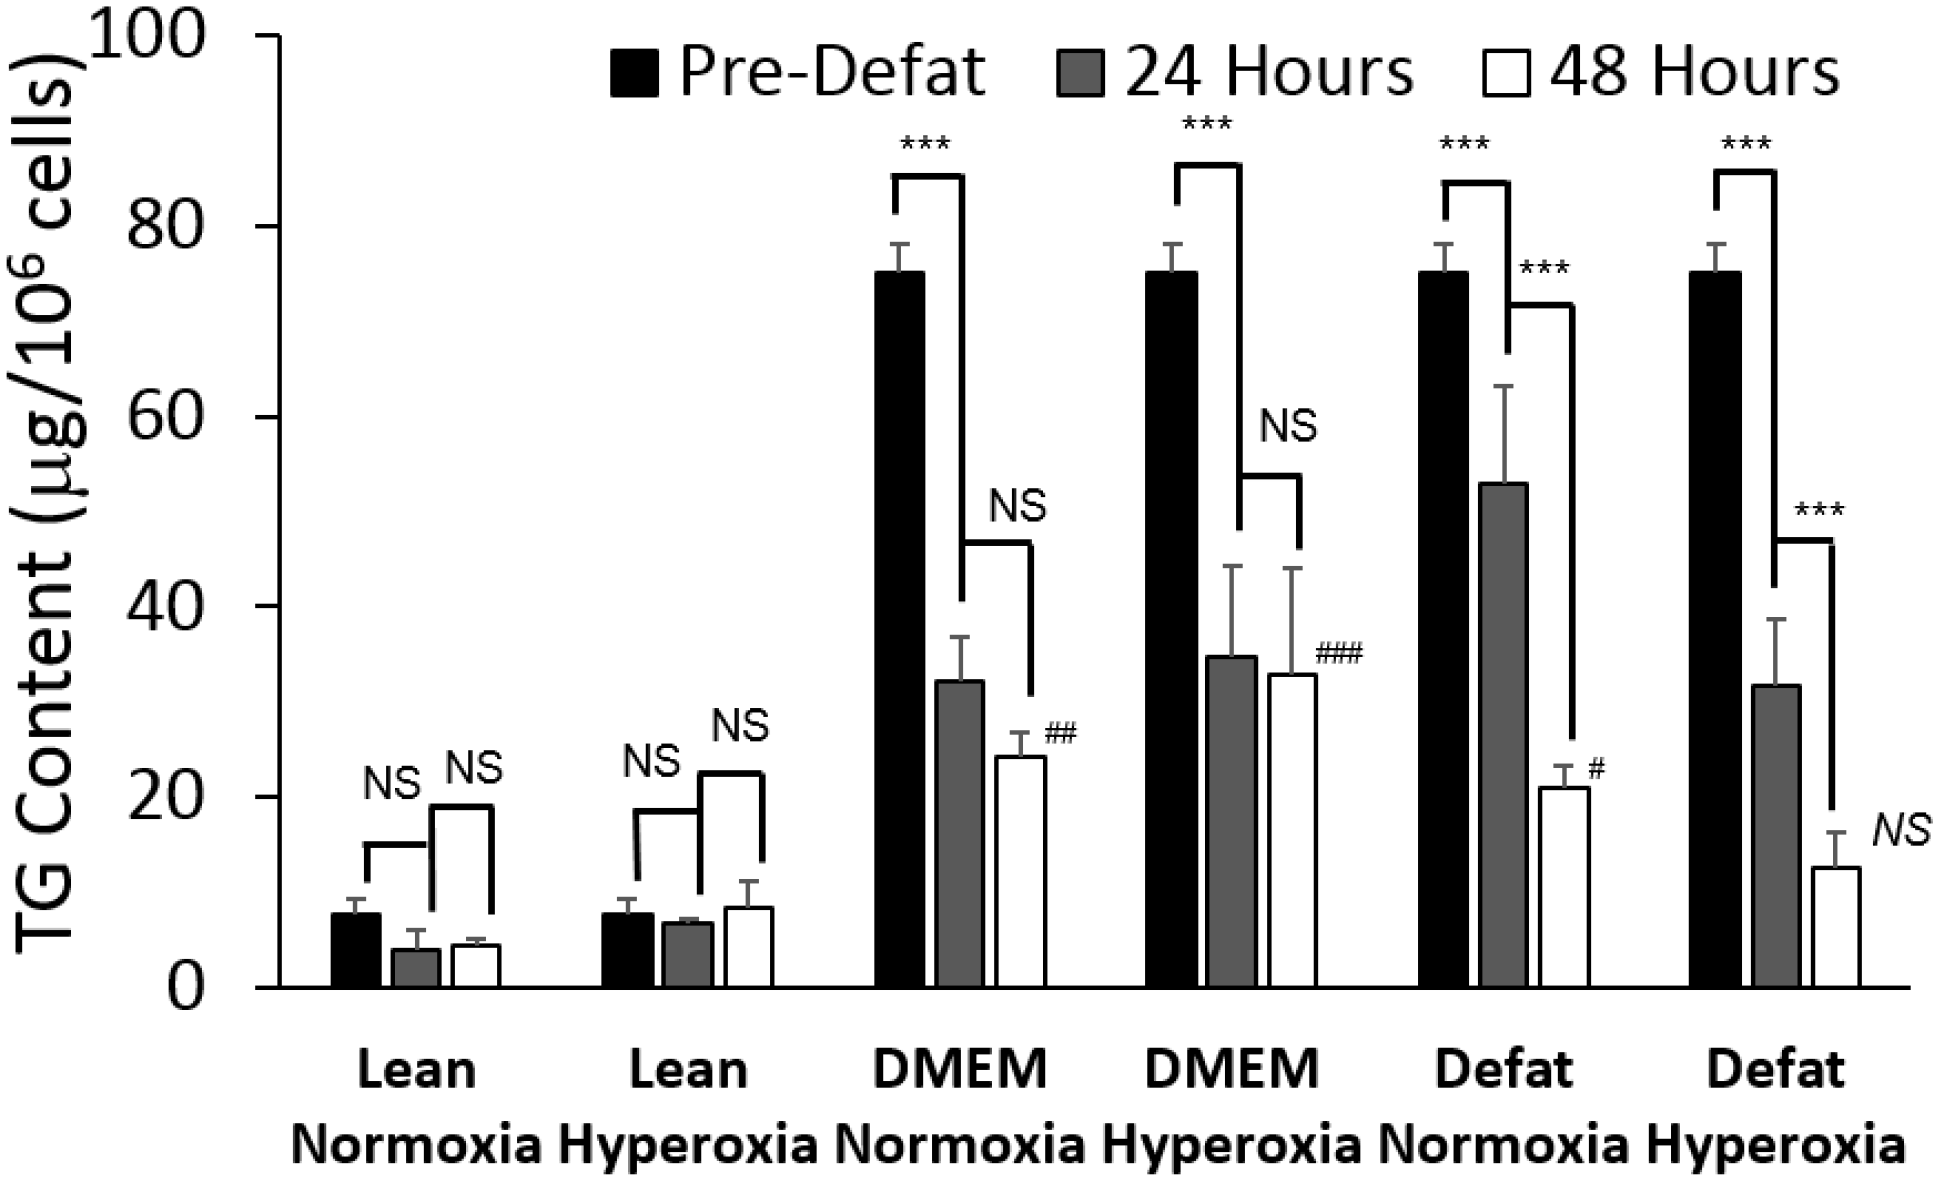
2.1. Triglyceride Storage

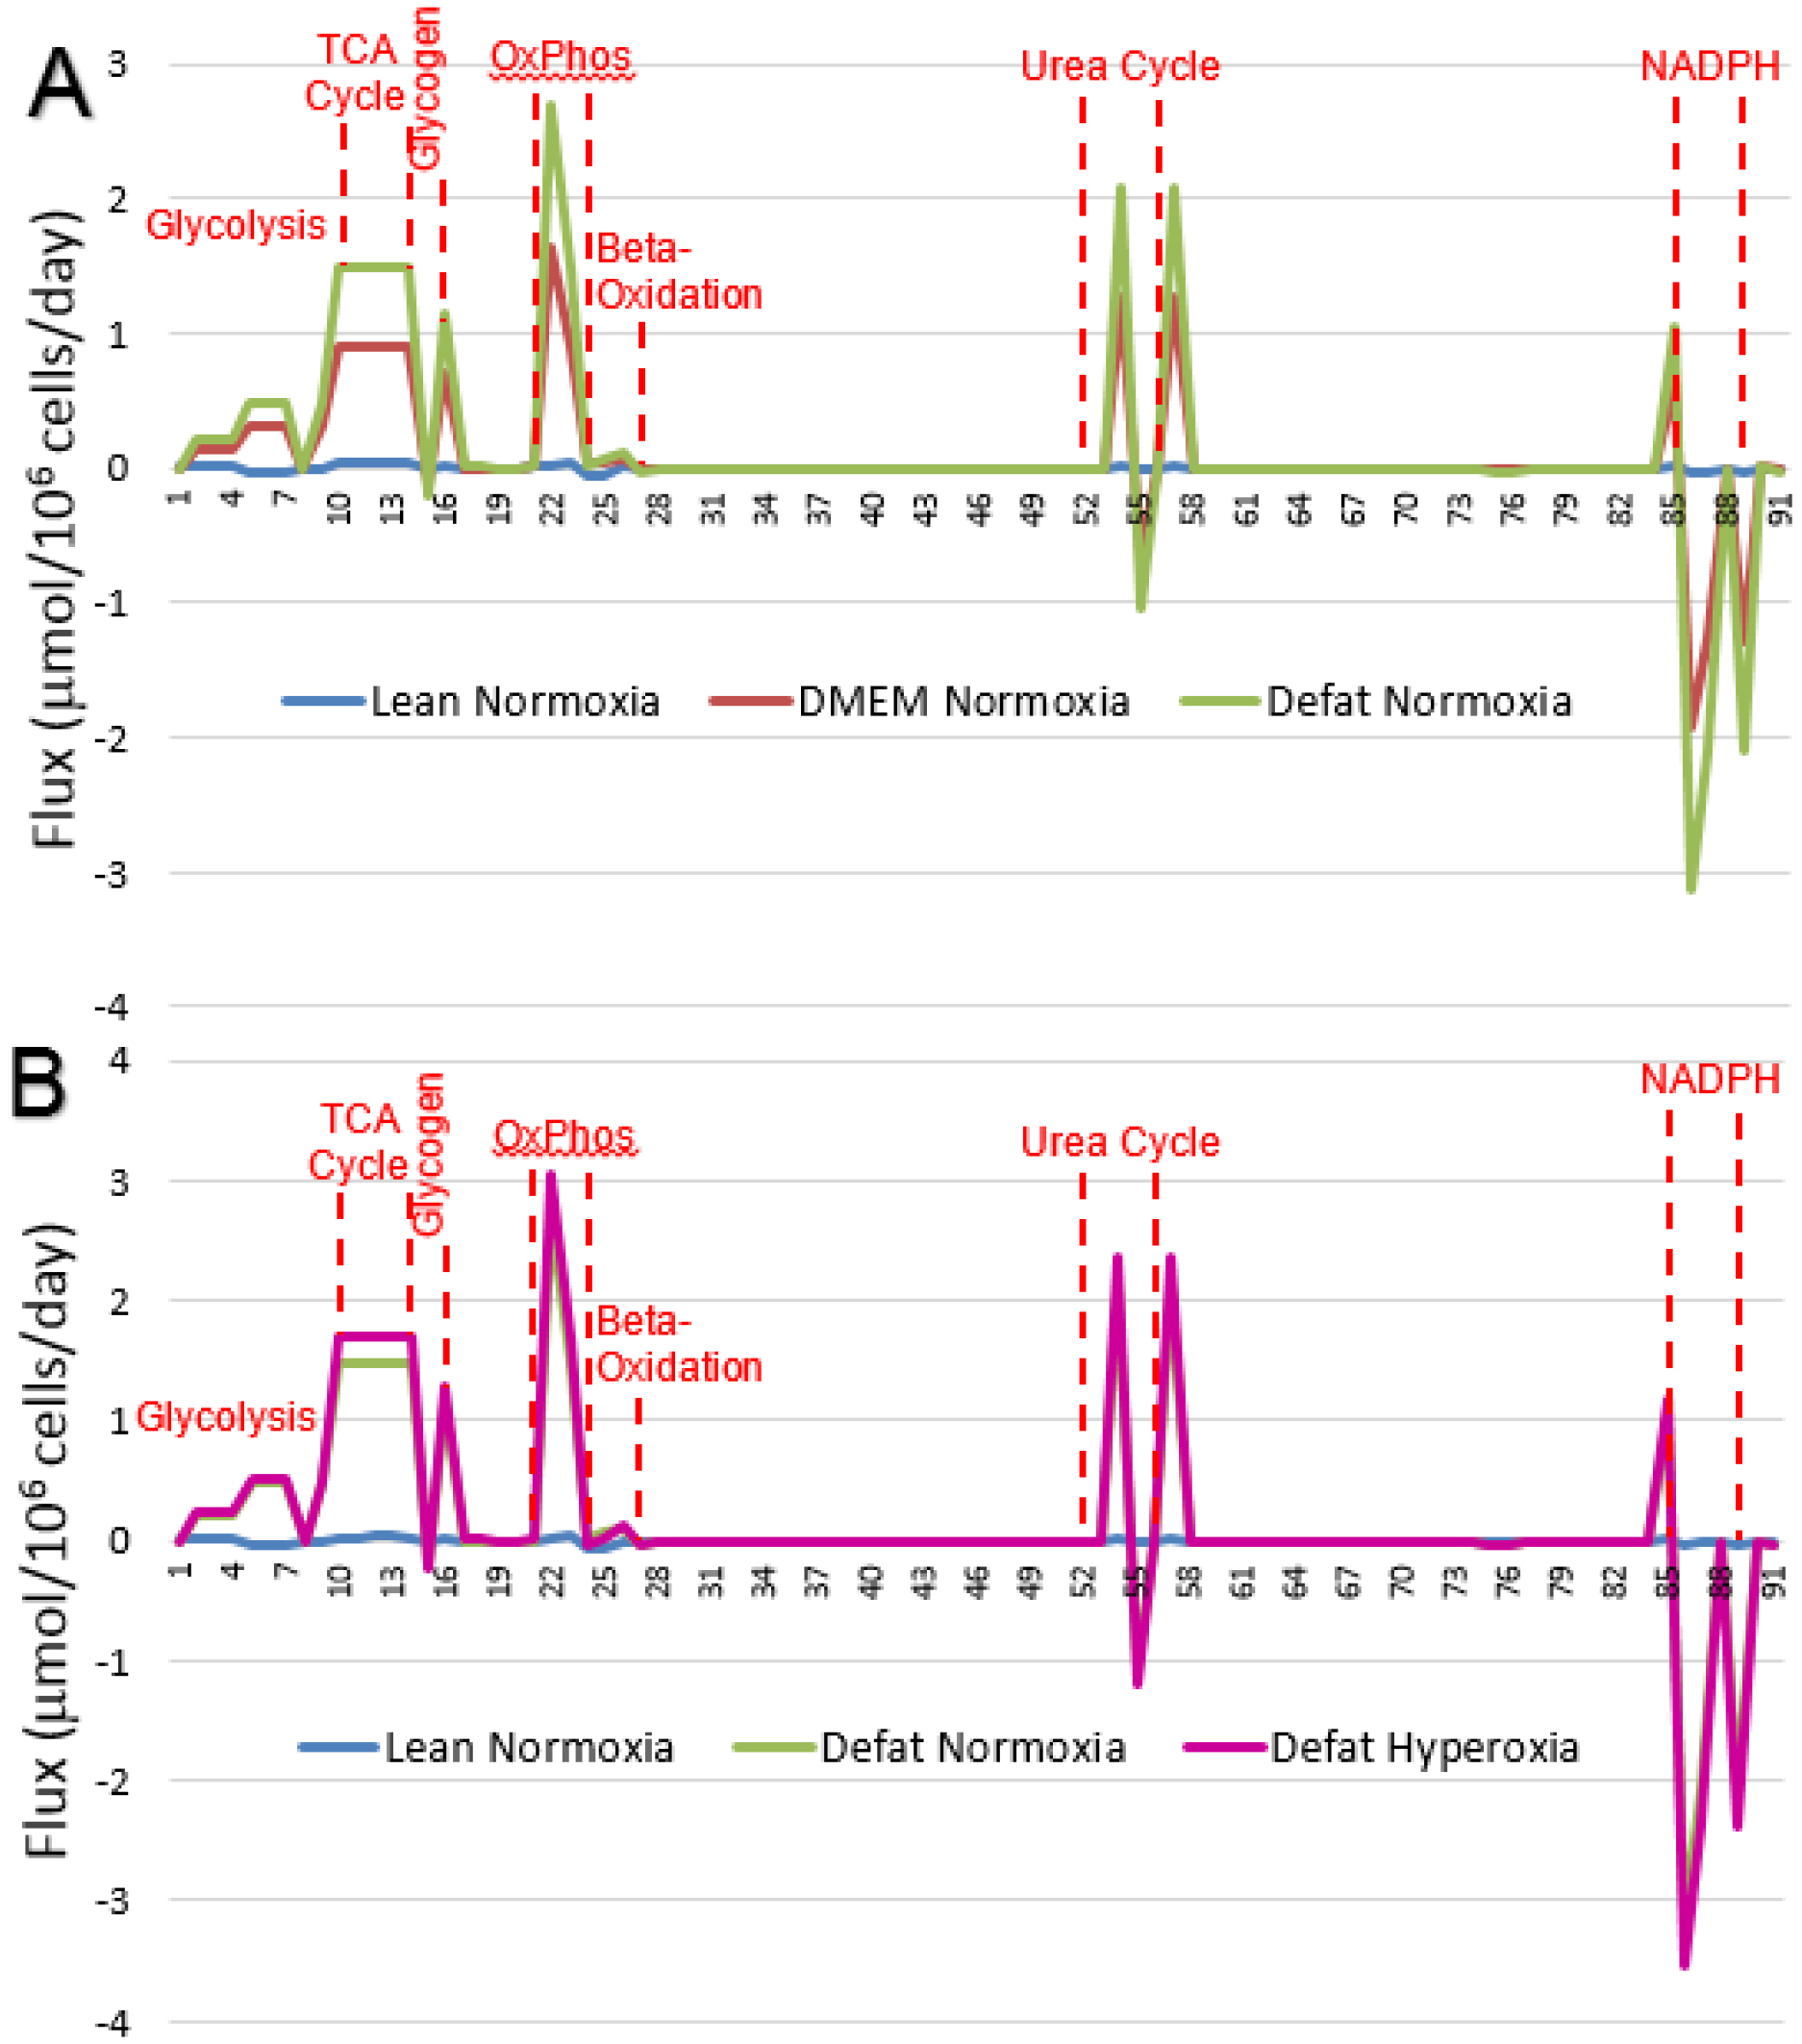
2.2. Measured Metabolic Fluxes

| Metabolite | Reaction Number | Lean Normoxia | DMEM Normoxia | Defat Normoxia | Defat Hyperoxia |
|---|---|---|---|---|---|
| Glycolysis | |||||
| Glucose uptake | 1 | 9.49 ± 1.19 | −1.63 ± 0.15 | 0.53 ± 0.18 | 0.70 ± 0.32 |
| Lactate uptake | 8 | −14.90 ± 1.09 | −1.28 ± 0.08 | 2.33 ± 0.33 | 4.80 ± 1.48 |
| Ketone Bodies | |||||
| Acetoacetate release | 19 | −0.42 ± 0.11 | 0.91 ± 0.45 | 3.06 ± 1.11 | 3.88 ± 1.39 |
| Beta−hydroxybutyrate release | 20 | −0.13 ± 0.04 | 0.75 ± 0.13 | 2.71 ± 0.61 | 3.83 ± 1.15 |
| Oxidative Phosphorylation | |||||
| Oxygen uptake | 21 | 3.79 ± 1.86 | 3.79 ± 1.86 | 3.79 ± 1.86 | 22.15 ± 7.16 |
| Amino Acid Metabolism | |||||
| Serine (Ser) uptake | 28 | 0.010 ± 0.001 | 0.006 ± 0.000 | 0.004 ± 0.002 | 0.011 ± 0.002 |
| Glutamine (Gln) uptake | 30 | 0.125 ± 0.040 | 0.106 ± 0.014 | 0.057 ± 0.005 | 0.082 ± 0.010 |
| Histidine (His) uptake | 31 | 0.018 ± 0.009 | 0.020 ± 0.009 | 0.023 ± 0.002 | 0.003 ± 0.001 |
| Aspartic acid (Asp) uptake | 32 | 0.013 ± 0.003 | 0.005 ± 0.001 | 0.010 ± 0.004 | 0.013 ± 0.002 |
| Glutamic acid (Glu) uptake | 33 | 0.005 ± 0.002 | 0.001 ± 0.000 | 0.007 ± 0.002 | 0.012 ± 0.002 |
| Glycine (Gly) uptake | 34 | 0.002 ± 0.000 | 0.008 ± 0.001 | 0.003 ± 0.001 | 0.002 ± 0.000 |
| Ammonia (NH3+NH4+) uptake | 36 | −2.530 ± 0.091 | −2.530 ± 1.081 | −2.530 ± 0.987 | 0.540 ± 0.245 |
| Arginine (Arg) uptake | 37 | 0.016 ± 0.008 | 0.064 ± 0.010 | 0.049 ± 0.022 | 0.040 ± 0.013 |
| Threonine (Thr) uptake | 38 | 0.022 ± 0.001 | 0.016 ± 0.001 | 0.013 ± 0.001 | 0.012 ± 0.006 |
| Alanine (Ala) uptake | 39 | 0.007 ± 0.003 | 0.005 ± 0.002 | 0.005 ± 0.000 | 0.002 ± 0.001 |
| Proline (Pro) uptake | 41 | 0.010 ± 0.002 | 0.007 ± 0.003 | 0.010 ± 0.000 | 0.009 ± 0.004 |
| Cysteine (Cys) uptake | 42 | 0.008 ± 0.003 | 0.007 ± 0.003 | 0.014 ± 0.007 | 0.005 ± 0.001 |
| Tyrosine (Tyr) uptake | 43 | 0.014 ± 0.001 | 0.011 ± 0.005 | 0.021 ± 0.007 | 0.008 ± 0.000 |
| Valine (Val) uptake | 45 | 0.003 ± 0.001 | 0.023 ± 0.009 | 0.018 ± 0.007 | 0.008 ± 0.003 |
| Ornithine (Orn) uptake | 46 | 0.001 ± 0.000 | 0.007 ± 0.000 | 0.001 ± 0.000 | 0.004 ± 0.001 |
| Lysine (Lys) uptake | 47 | 0.028 ± 0.002 | 0.036 ± 0.016 | 0.042 ± 0.018 | 0.039 ± 0.001 |
| Isoleucine (Ile) uptake | 48 | 0.029 ± 0.014 | 0.018 ± 0.006 | 0.018 ± 0.005 | 0.023 ± 0.001 |
| Leucine (Leu) uptake | 49 | 0.022 ± 0.008 | 0.024 ± 0.011 | 0.009 ± 0.001 | 0.021 ± 0.005 |
| Phenylalanine (Phe) uptake | 50 | 0.020 ± 0.002 | 0.007 ± 0.002 | 0.009 ± 0.004 | 0.016 ± 0.001 |
| Lipid Metabolism | |||||
| Glycerol uptake | 24 | −63.39 ± 2.02 | 30.32 ± 3.92 | 27.42 ± 3.71 | −23.14 ± 9.40 |
| Triglyceride (TG) uptake # | 27 | −0.75 ± 0.22 | −20.10 ± 1.52 | −36.35 ± 1.96 | −44.27 ± 10.58 |
| Cholesterol ester uptake | 74 | 0.010 ± 0.002 | 0.003 ± 0.002 | 0.005 ± 0.002 | 0.008 ± 0.002 |
| Free fatty acid (FFA) uptake | 84 | 0.000 ± 0.000 | 0.000 ± 0.000 | 0.000 ± 0.000 | 0.000 ± 0.000 |
| Cholesterol uptake | 90 | 3.24 ± 0.21 | 6.72 ± 2.24 | 3.72 ± 1.59 | 2.91 ± 1.40 |
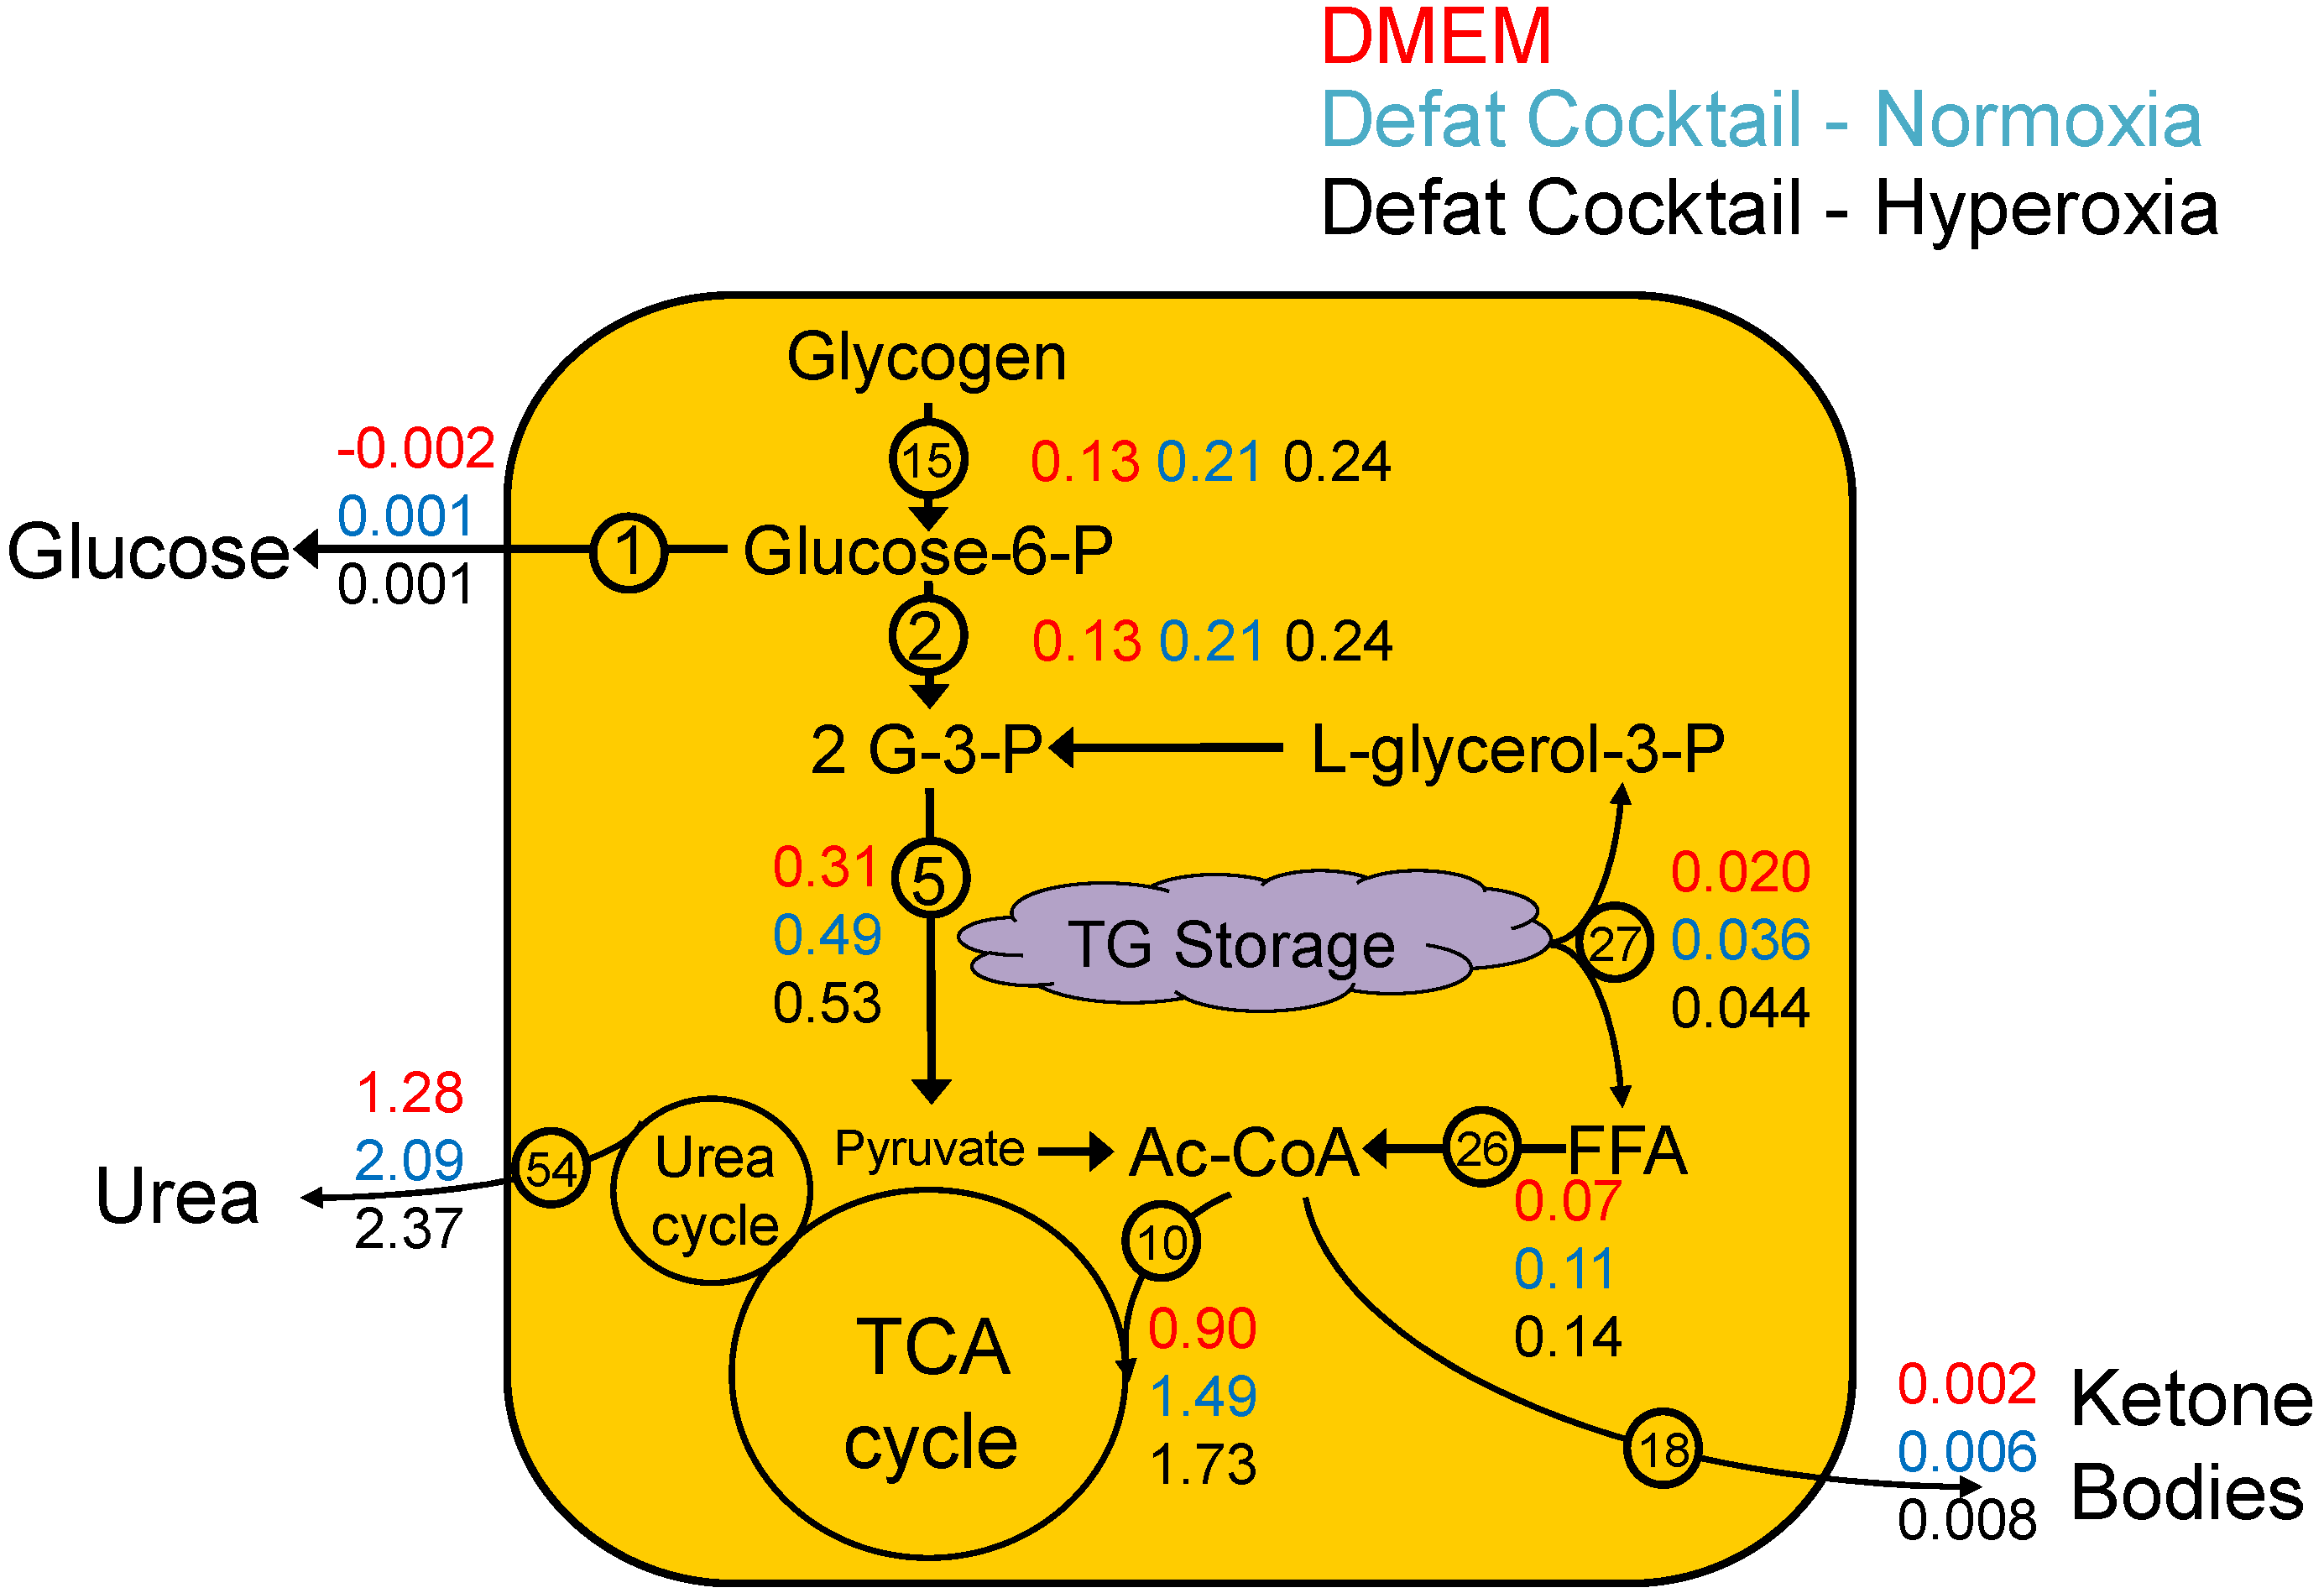
2.3. Calculated Fluxes

| Stoichiometry | Rxn Number | Lean Normoxia | DMEM Normoxia | Defat Normoxia | Defat Hyperoxia |
|---|---|---|---|---|---|
| Glycolysis | |||||
| Glucose + ATP --> G-6-P | 1 | 0.010 ± 0.001 | −0.002 ± 0.000 | 0.001 ± 0.000 | 0.001 ± 0.000 |
| G-6-P --> F-6-P | 2 | 0.013 ± 0.002 | 0.128 ± 0.009 | 0.212 ± 0.011 | 0.242 ± 0.059 |
| F-6-P + ATP --> Glyceraldehyde-3-P + DHAP | 3 | 0.013 ± 0.002 | 0.128 ± 0.009 | 0.212 ± 0.011 | 0.242 ± 0.059 |
| DHAP --> Glyceraldehyde-3-P | 4 | 0.013 ± 0.002 | 0.128 ± 0.009 | 0.212 ± 0.011 | 0.242 ± 0.059 |
| Glyceraldehyde-3-P --> 3-PGA | 5 | −0.036 ± 0.005 | 0.306 ± 0.021 | 0.488 ± 0.025 | 0.505 ± 0.128 |
| 3PGA --> PEP + NADH + 2ATP | 6 | −0.036 ± 0.005 | 0.306 ± 0.021 | 0.488 ± 0.025 | 0.505 ± 0.128 |
| PEP --> Pyruvate | 7 | −0.036 ± 0.005 | 0.306 ± 0.021 | 0.488 ± 0.025 | 0.505 ± 0.128 |
| Pyruvate + NADH --> Lactate | 8 | −0.015 ± 0.001 | −0.001 ± 0.000 | 0.002 ± 0.000 | 0.005 ± 0.001 |
| Pyruvate --> Acetyl-CoA + NADH +CO2 | 9 | −0.021 ± 0.005 | 0.307 ± 0.021 | 0.486 ± 0.025 | 0.500 ± 0.128 |
| TCA Cycle | |||||
| Acetyl-CoA + OAA --> Citrate | 10 | 0.033 ± 0.010 | 0.909 ± 0.066 | 1.491 ± 0.079 | 1.709 ± 0.414 |
| Citrate --> alpha-KG + NADPH +CO2 | 11 | 0.033 ± 0.010 | 0.909 ± 0.066 | 1.491 ± 0.079 | 1.709 ± 0.414 |
| alpha-KG --> Succinyl-CoA + NADH + CO2 | 12 | 0.034 ± 0.010 | 0.911 ± 0.066 | 1.492 ± 0.079 | 1.710 ± 0.414 |
| Succinyl-CoA --> Fumarate + FADH2 + ATP | 13 | 0.034 ± 0.010 | 0.911 ± 0.066 | 1.492 ± 0.079 | 1.710 ± 0.414 |
| Fumarate --> OAA + NADH | 14 | 0.033 ± 0.010 | 0.909 ± 0.066 | 1.491 ± 0.079 | 1.709 ± 0.414 |
| Pentose Phosphate Pathway and Glycogen Metabolism | |||||
| (Glucose)n-1 + G-6-P --> (Glucose)n | 15 | −0.004 ± 0.001 | −0.129 ± 0.009 | −0.212 ± 0.011 | −0.241 ± 0.059 |
| G-6-P --> 12 NADPH + 6 CO2 | 16 | 0.000 ± 0.000 | 0.000 ± 0.000 | 0.000 ± 0.000 | 0.000 ± 0.000 |
| Ketone Body Production | |||||
| 2 Acetyl-COA --> Acetoacetyl-CoA | 17 | −0.002 ± 0.000 | 0.001 ± 0.001 | 0.005 ± 0.001 | 0.007 ± 0.002 |
| Acetoacetyl-CoA --> Acetoacetate | 18 | −0.001 ± 0.000 | 0.002 ± 0.001 | 0.006 ± 0.001 | 0.008 ± 0.002 |
| Acetoacetate Out | 19 | 0.000 ± 0.000 | 0.001 ± 0.000 | 0.003 ± 0.001 | 0.004 ± 0.001 |
| Acetoacetate + NADH --> B-OH butyrate | 20 | 0.000 ± 0.000 | 0.001 ± 0.000 | 0.003 ± 0.001 | 0.004 ± 0.001 |
| Oxidative Phosphorylation | |||||
| Oxygen In | 21 | 0.004 ± 0.002 | 0.004 ± 0.002 | 0.004 ± 0.002 | 0.022 ± 0.007 |
| NADH + 0.5 O2 --> 2.5 ATP | 22 | 0.014 ± 0.019 | 1.641 ± 0.118 | 2.686 ± 0.141 | 3.059 ± 0.738 |
| FADH2 + 0.5 O2 --> 2 ATP | 23 | 0.035 ± 0.010 | 0.912 ± 0.066 | 1.493 ± 0.079 | 1.711 ± 0.414 |
| Glycerol and Fatty Acid Metabolism | |||||
| Glycerol + ATP --> Glycerol-3-P | 24 | −0.063 ± 0.002 | 0.030 ± 0.004 | 0.027 ± 0.004 | −0.023 ± 0.009 |
| Glycerol-3-P --> Glyceraldehyde-3-P + NADH | 25 | −0.063 ± 0.002 | 0.050 ± 0.004 | 0.064 ± 0.004 | 0.021 ± 0.014 |
| FA-CoA --> 8(9) Acetyl-CoA + 14(16) NADH | 26 | 0.006 ± 0.001 | 0.067 ± 0.005 | 0.113 ± 0.006 | 0.136 ± 0.032 |
| FA-CoA + DAG --> TG | 27 | −0.001 ± 0.000 | −0.020 ± 0.002 | −0.036 ± 0.002 | −0.044 ± 0.011 |
| Amino Acid Metabolism | |||||
| Ser In | 28 | 0.000 ± 0.000 | 0.000 ± 0.000 | 0.000 ± 0.000 | 0.000 ± 0.000 |
| Ser --> NH3 + Pyr | 29 | 0.000 ± 0.000 | 0.000 ± 0.000 | 0.000 ± 0.000 | 0.000 ± 0.000 |
| Gln In | 30 | 0.000 ± 0.000 | 0.000 ± 0.000 | 0.000 ± 0.000 | 0.000 ± 0.000 |
| His --> Glu + NH4+ | 31 | 0.000 ± 0.000 | 0.000 ± 0.000 | 0.000 ± 0.000 | 0.000 ± 0.000 |
| Asp In | 32 | 0.000 ± 0.000 | 0.000 ± 0.000 | 0.000 ± 0.000 | 0.000 ± 0.000 |
| Glu In | 33 | 0.000 ± 0.000 | 0.000 ± 0.000 | 0.000 ± 0.000 | 0.000 ± 0.000 |
| Gly In | 34 | 0.000 ± 0.000 | 0.000 ± 0.000 | 0.000 ± 0.000 | 0.000 ± 0.000 |
| Gly --> 2 CO2 + NH3 + NADH + THF + ATP | 35 | 0.000 ± 0.000 | 0.000 ± 0.000 | 0.000 ± 0.000 | 0.000 ± 0.000 |
| NH4+ In | 36 | −0.003 ± 0.000 | −0.003 ± 0.001 | −0.003 ± 0.001 | 0.001 ± 0.000 |
| Arg In | 37 | 0.000 ± 0.000 | 0.000 ± 0.000 | 0.000 ± 0.000 | 0.000 ± 0.000 |
| Thr --> Pyr + CO2 + NH4+ + 2 NADH + FADH2 | 38 | 0.000 ± 0.000 | 0.000 ± 0.000 | 0.000 ± 0.000 | 0.000 ± 0.000 |
| Ala In | 39 | 0.000 ± 0.000 | 0.000 ± 0.000 | 0.000 ± 0.000 | 0.000 ± 0.000 |
| Glu + Pyr --> Ala + aKG | 40 | 0.000 ± 0.000 | 0.000 ± 0.000 | 0.000 ± 0.000 | 0.000 ± 0.000 |
| Pro In | 41 | 0.000 ± 0.000 | 0.000 ± 0.000 | 0.000 ± 0.000 | 0.000 ± 0.000 |
| Cys In | 42 | 0.000 ± 0.000 | 0.000 ± 0.000 | 0.000 ± 0.000 | 0.000 ± 0.000 |
| Tyr In | 43 | 0.000 ± 0.000 | 0.000 ± 0.000 | 0.000 ± 0.000 | 0.000 ± 0.000 |
| Tyr + aKG + 2 O2 --> Glu + CO2 + Acetoacetate + Fumarate | 44 | 0.000 ± 0.000 | 0.000 ± 0.000 | 0.000 ± 0.000 | 0.000 ± 0.000 |
| Val + aKG --> Glu + CO2 + 2NADH + FADH2 + Succ-CoA | 45 | 0.000 ± 0.000 | 0.000 ± 0.000 | 0.000 ± 0.000 | 0.000 ± 0.000 |
| Orn In | 46 | 0.000 ± 0.000 | 0.000 ± 0.000 | 0.000 ± 0.000 | 0.000 ± 0.000 |
| Lys + 2 aKG + NADPH --> 2Glu + Acetoacetyl-CoA + 2CO2 + 4 NADH + FADH2 | 47 | 0.000 ± 0.000 | 0.000 ± 0.000 | 0.000 ± 0.000 | 0.000 ± 0.000 |
| Ile + aKG --> Glu + Succ-CoA + Acetyl-CoA + NADH + FADH2 | 48 | 0.000 ± 0.000 | 0.000 ± 0.000 | 0.000 ± 0.000 | 0.000 ± 0.000 |
| Leu + aKG --> Glu + Acetyl-CoA + Acetoacetate + CO2 + NADH + FADH2 | 49 | 0.000 ± 0.000 | 0.000 ± 0.000 | 0.000 ± 0.000 | 0.000 ± 0.000 |
| Phe + O2 --> Tyr | 50 | 0.000 ± 0.000 | 0.000 ± 0.000 | 0.000 ± 0.000 | 0.000 ± 0.000 |
| Glu + Cys + Gly --> GSH | 51 | 0.000 ± 0.000 | 0.000 ± 0.000 | 0.000 ± 0.000 | 0.000 ± 0.000 |
| Urea Cycle | |||||
| HCO3- + NH4+ + Orn + 2 ATP --> Citrulline | 52 | −0.002 ± 0.000 | −0.002 ± 0.000 | −0.002 ± 0.000 | −0.002 ± 0.000 |
| Citrulline + Asp + ATP --> Fumarate + Arginine | 53 | −0.002 ± 0.000 | −0.002 ± 0.000 | −0.002 ± 0.000 | −0.002 ± 0.000 |
| Arginine --> Orn + Urea | 54 | 0.023 ± 0.014 | 1.276 ± 0.092 | 2.089 ± 0.110 | 2.366 ± 0.576 |
| Urea Out | 55 | −0.013 ± 0.007 | −0.638 ± 0.046 | −1.046 ± 0.055 | −1.182 ± 0.288 |
| Orn + alpha-KG + 0.5 NADPH + 0.5 NADH --> Pro | 56 | 0.001 ± 0.000 | 0.001 ± 0.000 | 0.001 ± 0.000 | 0.001 ± 0.000 |
| Amino Acid Metabolism (Cont’d) | |||||
| Gln --> Glu + NH4+ | 57 | 0.015 ± 0.015 | 1.267 ± 0.092 | 2.083 ± 0.110 | 2.407 ± 0.576 |
| Asp + NH4+ --> Asn | 58 | 0.000 ± 0.000 | 0.000 ± 0.000 | 0.000 ± 0.000 | 0.000 ± 0.000 |
| Thr --> Pyr + CO2 + NH4+ + 2 NADH + FADH2 | 59 | 0.000 ± 0.000 | 0.000 ± 0.000 | 0.000 ± 0.000 | 0.000 ± 0.000 |
| Val + aKG --> Glu + CO2 + 2NADH + FADH2 + Succ-CoA | 60 | 0.000 ± 0.000 | 0.000 ± 0.000 | 0.000 ± 0.000 | 0.000 ± 0.000 |
| Lys + 2 aKG + NADPH --> 2Glu + Acetoacetyl-CoA + 2CO2 + 4 NADH + FADH2 | 61 | 0.000 ± 0.000 | 0.000 ± 0.000 | 0.000 ± 0.000 | 0.000 ± 0.000 |
| Ile + aKG --> Glu + Succ-CoA + Acetyl-CoA + NADH + FADH2 | 62 | 0.000 ± 0.000 | 0.000 ± 0.000 | 0.000 ± 0.000 | 0.000 ± 0.000 |
| Leu + aKG --> Glu + HMG-CoA + NADH + FADH2 | 63 | 0.000 ± 0.000 | 0.000 ± 0.000 | 0.000 ± 0.000 | 0.000 ± 0.000 |
| Phe + O2 --> Tyr | 64 | 0.000 ± 0.000 | 0.000 ± 0.000 | 0.000 ± 0.000 | 0.000 ± 0.000 |
| Phospholipid, Sphingolipid, and Cholesterol Metabolism | |||||
| Ser + 1 Palm-CoA + 1 FA-CoA + NADPH --> Ceramide + CO2 + FADH2 | 65 | 0.000 ± 0.000 | 0.000 ± 0.000 | 0.000 ± 0.000 | 0.000 ± 0.000 |
| Ceramide + Phosphatidylcholine --> Sphingomyelin | 66 | 0.000 ± 0.000 | 0.000 ± 0.000 | 0.000 ± 0.000 | 0.000 ± 0.000 |
| Acetoacetyl-CoA + Acetyl-CoA --> HMG-CoA | 67 | 0.000 ± 0.000 | 0.000 ± 0.000 | 0.000 ± 0.000 | 0.000 ± 0.000 |
| HMG-CoA + 2 NADPH (+ 3ATP) --> IPP | 68 | 0.000 ± 0.000 | 0.000 ± 0.000 | 0.000 ± 0.000 | 0.000 ± 0.000 |
| 2 IPP --> Geranyl-PP | 69 | 0.000 ± 0.000 | 0.000 ± 0.000 | 0.000 ± 0.000 | 0.000 ± 0.000 |
| Geranyl-PP + IPP --> Farnesyl-PP | 70 | 0.000 ± 0.000 | 0.000 ± 0.000 | 0.000 ± 0.000 | 0.000 ± 0.000 |
| 2 Farnesyl-PP + 0.5 NADPH + 0.5 NADH --> Squalene | 71 | 0.000 ± 0.000 | 0.000 ± 0.000 | 0.000 ± 0.000 | 0.000 ± 0.000 |
| Squalene + O2 + NADPH --> Lanosterol | 72 | 0.000 ± 0.000 | 0.000 ± 0.000 | 0.000 ± 0.000 | 0.000 ± 0.000 |
| Lanosterol + 10.5 NADPH + 4.5 NADH + 10 O2 --> Chol + 3 CO2 | 73 | 0.000 ± 0.000 | 0.000 ± 0.000 | 0.000 ± 0.000 | 0.000 ± 0.000 |
| Cholesterol Ester --> Chol + FA-CoA | 74 | 0.000 ± 0.000 | 0.000 ± 0.000 | 0.000 ± 0.000 | 0.000 ± 0.000 |
| 2 FA-CoA + Glycerol-3-P --> Phosphatidate | 75 | −0.001 ± 0.000 | −0.020 ± 0.002 | −0.036 ± 0.002 | −0.044 ± 0.011 |
| Phosphatidate --> DAG | 76 | −0.001 ± 0.000 | −0.020 ± 0.002 | −0.036 ± 0.002 | −0.044 ± 0.011 |
| Phosphatidate --> CDP-DAG | 77 | 0.000 ± 0.000 | 0.000 ± 0.000 | 0.000 ± 0.000 | 0.000 ± 0.000 |
| CDP-DAG + Ser --> PhosphatidylSerine | 78 | 0.000 ± 0.000 | 0.000 ± 0.000 | 0.000 ± 0.000 | 0.000 ± 0.000 |
| PhosphatidylSerine --> PhosphatidylEthanolamine + CO2 | 79 | 0.000 ± 0.000 | 0.000 ± 0.000 | 0.000 ± 0.000 | 0.000 ± 0.000 |
| CDP-DAG + G-3-P --> PhosphatidylGlycerol | 80 | 0.000 ± 0.000 | 0.000 ± 0.000 | 0.000 ± 0.000 | 0.000 ± 0.000 |
| 2 PG --> Cardiolipin + Glycerol | 81 | 0.000 ± 0.000 | 0.000 ± 0.000 | 0.000 ± 0.000 | 0.000 ± 0.000 |
| DAG + CDP-Choline --> PhosphatidylCholine | 82 | 0.000 ± 0.000 | 0.000 ± 0.000 | 0.000 ± 0.000 | 0.000 ± 0.000 |
| DAG + CDP-Ethanolamine --> PhosphatidylEthanolamine | 83 | 0.000 ± 0.000 | 0.000 ± 0.000 | 0.000 ± 0.000 | 0.000 ± 0.000 |
| Cholesterol Out | 84 | 0.000 ± 0.000 | 0.000 ± 0.000 | 0.000 ± 0.000 | 0.000 ± 0.000 |
| Polyamine and NADPH | |||||
| Arg --> Putrescine + 2 CO2 + 2 NH3 | 85 | 0.011 ± 0.007 | 0.637 ± 0.046 | 1.045 ± 0.055 | 1.181 ± 0.288 |
| Arg --> Putrescine + CO2 + Urea | 86 | −0.036 ± 0.022 | −1.914 ± 0.138 | −3.134 ± 0.165 | −3.548 ± 0.864 |
| Putrescine + alpha-KG + O2 --> NH3 + NADH + Glu + NADPH + Succinate | 87 | −0.022 ± 0.015 | −1.273 ± 0.092 | −2.087 ± 0.110 | −2.364 ± 0.576 |
| Putrescine + 2 alpha-KG --> 1.5 NADH + 2 Glu + 0.5 NADPH + Succinate | 88 | −0.003 ± 0.000 | −0.004 ± 0.002 | −0.003 ± 0.002 | −0.003 ± 0.001 |
| Glu + 2 NADPH --> Pro | 89 | −0.025 ± 0.015 | −1.278 ± 0.092 | −2.090 ± 0.110 | −2.367 ± 0.576 |
| FA --> FA-CoA | 90 | 0.003 ± 0.000 | 0.007 ± 0.002 | 0.004 ± 0.002 | 0.003 ± 0.001 |
| 8 Acetyl-CoA + 14 NADPH --> Palm-CoA | 91 | −0.001 ± 0.000 | −0.020 ± 0.002 | −0.036 ± 0.002 | −0.044 ± 0.011 |
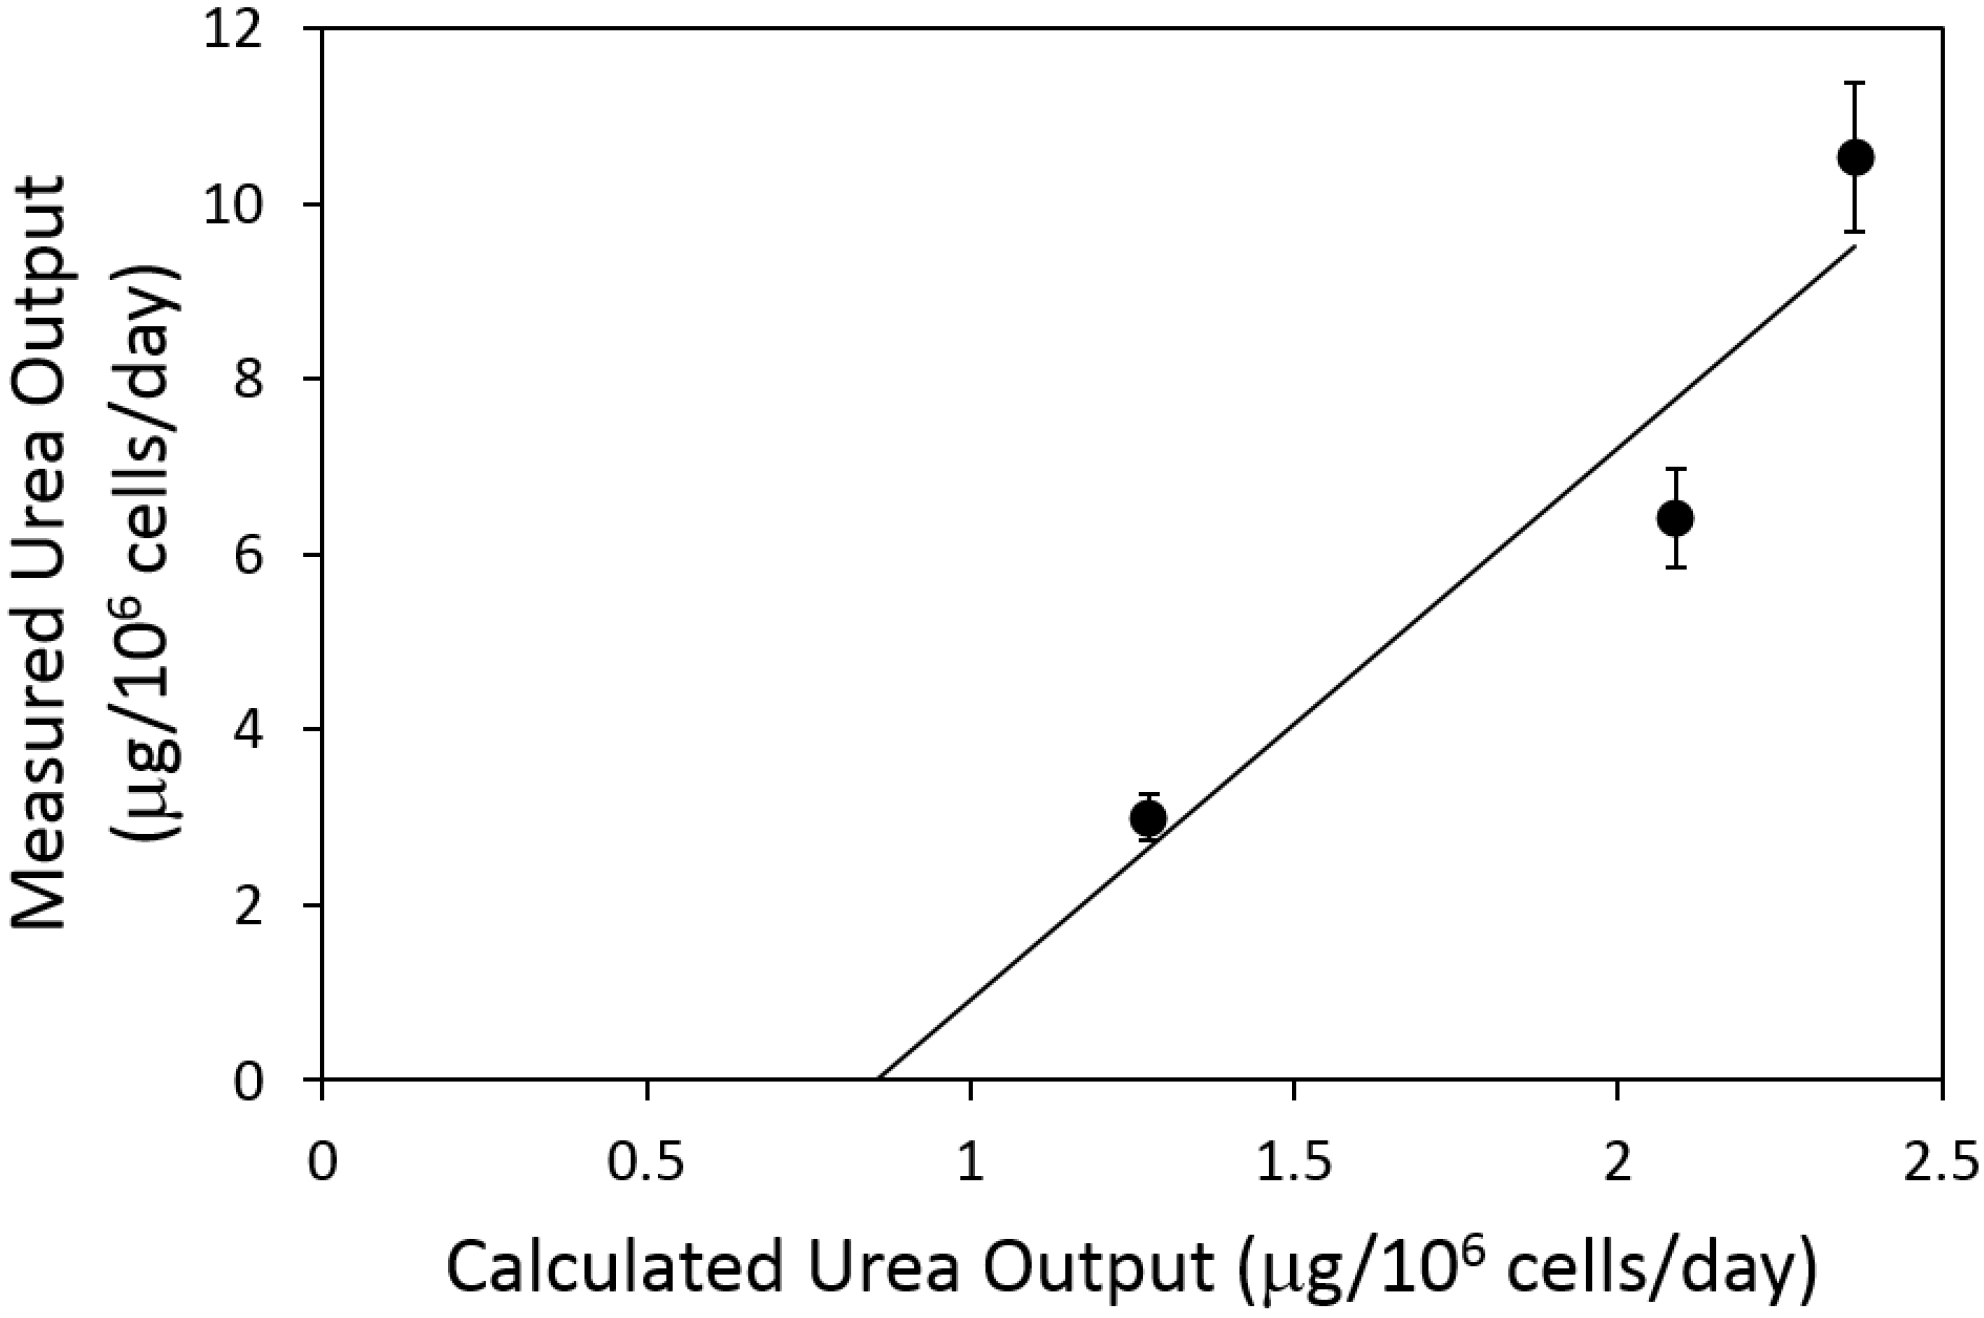
2.4. Urea Flux Validation
3. Discussion
4. Materials and Methods
4.1. Materials
4.2. HepG2 Cell Culture
4.3. Steatotic Induction and Removal
4.4. Metabolite Measurements and Extracellular Flux Calculations
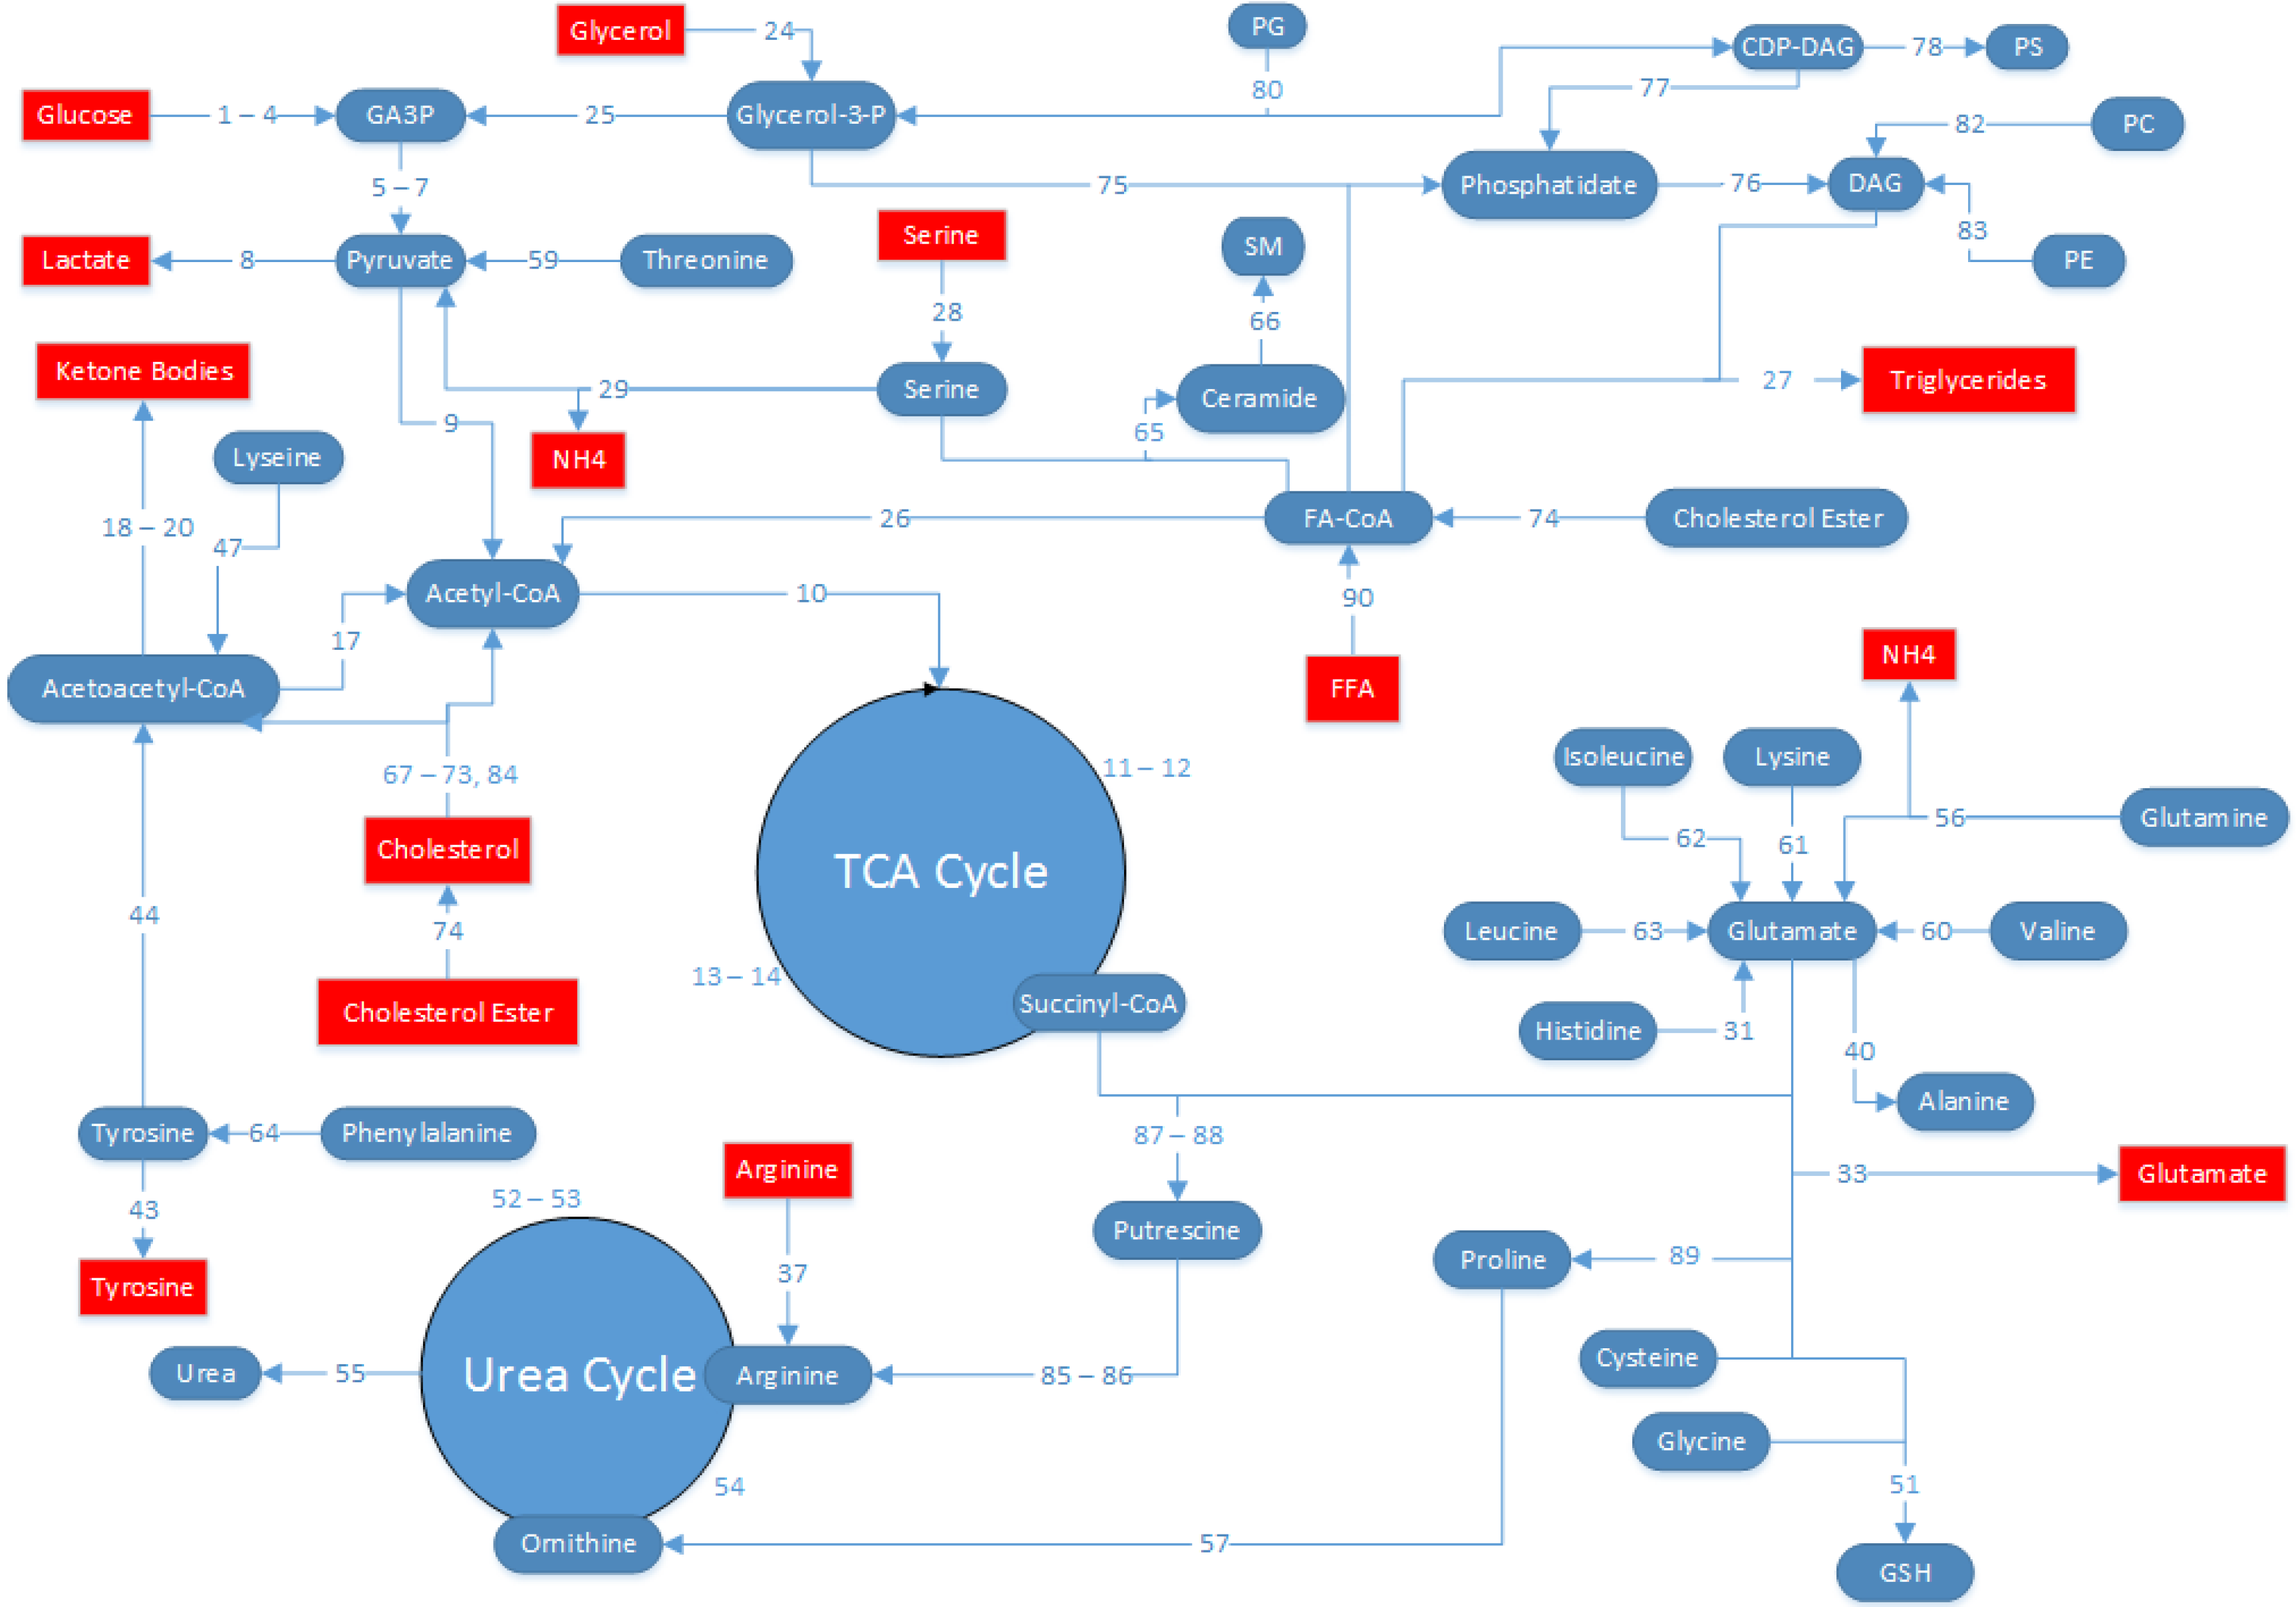
4.5. MFA Model Establishment
- (1)
- The HepG2 cells are in a glycolytic state, and conversion of pyruvate into oxaloacetate by pyruvate carboxylase is assumed to be zero. All pyruvate from glycolysis is either converted to lactate by lactate dehydrogenase, or to acetyl-CoA by pyruvate dehydrogenase.
- (2)
- Glycogen nor PPP fluxes were experimentally measured, and was therefore not possible to independently estimate each separately. Since the model predicts a net generation of glucose 6-phosphate from sources other than glucose, it was assumed that PPP fluxes were negligible (flux no.16) and the source of glucose 6-phosphate was entirely from glycogen (flux no. 15).
- (3)
- Because we did not measure protein synthesis or degradation, we assumed that there is no contribution of protein synthesis or degradation to the amino acid fluxes. Previously, it was found that albumin (the main protein product from hepatocytes) accounted for little of central carbon and nitrogen metabolism [26].
- (4)
- Although measurements were collected 24 h and 48 h after the onset of the defatting conditions, clearly defatting was very partial at 24 h. Therefore, we chose to calculate the average fluxes over the entire 48 h time period, and the fluxes reported here reflect a time-averaged value over 48 h.
- (5)
- Prior reports suggest that HepG2 cells have impaired lipid secretion [30,31]; therefore, the secretion of TG into the extracellular medium was neglected compared to the flux of TG released from the intracellular droplet pool. Note that the intracellular TG, which is sequestered in lipid droplets distinct from other metabolically active compartments of the cell, was measured and handled as an extracellular metabolite as described previously [29,32,33,34,35].
- (6)

4.6. Statistics
Acknowledgments
Author Contributions
Conflicts of Interest
References
- Kim, W.R.; Lake, J.R.; Smith, J.M.; Skeans, M.A.; Schladt, D.P.; Edwards, E.B.; Harper, A.M.; Wainright, J.L.; Snyder, J.J.; Israni, A.K.; et al. Optn/srtr 2013 annual data report: Liver. Am. J. Transplant. 2015, 15 (Suppl. 2), 1–28. [Google Scholar] [CrossRef] [PubMed]
- Chu, M.J.; Dare, A.J.; Phillips, A.R.; Bartlett, A.S. Donor hepatic steatosis and outcome after liver transplantation: A systematic review. J. Gastrointest. Surg. 2015, 19, 1713–1724. [Google Scholar] [CrossRef] [PubMed]
- Garcia Urena, M.A.; Colina Ruiz-Delgado, F.; Moreno Gonzalez, E.; Jimenez Romero, C.; Garcia Garcia, I.; Loinzaz Segurola, C.; Gonzalez, P.; Gomez Sanz, R. Hepatic steatosis in liver transplant donors: Common feature of donor population? World J. Surg. 1998, 22, 837–844. [Google Scholar] [PubMed]
- Laurens, M.; Scozzari, G.; Patrono, D.; St-Paul, M.-C.; Gugenheim, J.; Huet, P.-M.; Crenesse, D. Warm ischemia-reperfusion injury is decreased by tacrolimus in steatotic rat liver. Liver Transplant. 2006, 12, 217–225. [Google Scholar] [CrossRef] [PubMed]
- Serafin, A.; Rosello-Catafau, J.; Prats, N.; Xaus, C.; Gelpi, E.; Peralta, C. Ischemic preconditioning increases the tolerance of fatty liver to hepatic ischemia-reperfusion injury in the rat. Am. J. Pathol. 2002, 161, 587–601. [Google Scholar] [CrossRef]
- Aguilar-Melero, P.; Luque, A.; Machuca, M.M.; Perez de Obanos, M.P.; Navarrete, R.; Rodriguez-Garcia, I.C.; Briceno, J.; Iniguez, M.; Ruiz, J.; Prieto, J.; et al. Cardiotrophin-1 reduces ischemia/reperfusion injury during liver transplant. J. Surg. Res. 2013, 181, e83–e91. [Google Scholar] [CrossRef] [PubMed]
- Clavien, P.A.; Yadav, S.; Sindram, D.; Bentley, R.C. Protective effects of ischemic preconditioning for liver resection performed under inflow occlusion in humans. Ann. Surg. 2000, 232, 155–162. [Google Scholar] [CrossRef] [PubMed]
- Yamagami, K.; Enders, G.; Schauer, R.J.; Leiderer, R.; Hutter, J.; Yamamoto, Y.; Yamaoka, Y.; Hammer, C.; Messmer, K. Heat-shock preconditioning protects fatty livers in genetically obese zucker rats from microvascular perfusion failure after ischemia reperfusion. Transpl. Int. 2003, 16, 456–463. [Google Scholar] [CrossRef] [PubMed]
- Vogel, T.; Brockmann, J.G.; Coussios, C.; Friend, P.J. The role of normothermic extracorporeal perfusion in minimizing ischemia reperfusion injury. Transplant. Rev. 2012, 26, 156–162. [Google Scholar] [CrossRef] [PubMed]
- Nativ, N.I.; Yarmush, G.; So, A.; Barminko, J.; Maguire, T.J.; Schloss, R.; Berthiaume, F.; Yarmush, M.L. Elevated sensitivity of macrosteatotic hepatocytes to hypoxia/reoxygenation stress is reversed by a novel defatting protocol. Liver Transplant. 2014, 20, 1000–1011. [Google Scholar] [CrossRef] [PubMed]
- Nativ, N.I.; Yarmush, G.; Chen, A.; Dong, D.; Henry, S.D.; Guarrera, J.V.; Klein, K.M.; Maguire, T.; Schloss, R.; Berthiaume, F.; et al. Rat hepatocyte culture model of macrosteatosis: Effect of macrosteatosis induction and reversal on viability and liver-specific function. J. Hepatol. 2013, 59, 1307–1314. [Google Scholar] [CrossRef] [PubMed]
- Nativ, N.I.; Maguire, T.J.; Yarmush, G.; Brasaemle, D.L.; Henry, S.D.; Guarrera, J.V.; Berthiaume, F.; Yarmush, M.L. Liver defatting: An alternative approach to enable steatotic liver transplantation. Am. J. Transplant. 2012, 12, 3176–3183. [Google Scholar] [CrossRef] [PubMed]
- Guarrera, J.V.; Henry, S.D.; Samstein, B.; Odeh-Ramadan, R.; Kinkhabwala, M.; Goldstein, M.J.; Ratner, L.E.; Renz, J.F.; Lee, H.T.; Brown, R.S., Jr.; et al. Hypothermic machine preservation in human liver transplantation: The first clinical series. Am. J. Transplant. 2010, 10, 372–381. [Google Scholar] [CrossRef] [PubMed]
- Weitzel, M.; Noh, K.; Dalman, T.; Niedenfuhr, S.; Stute, B.; Wiechert, W. 13cflux2--high-performance software suite for (13)c-metabolic flux analysis. Bioinformatics 2013, 29, 143–145. [Google Scholar] [CrossRef] [PubMed]
- Guo, L.; Lobenhofer, E.K.; Wang, C.; Shippy, R.; Harris, S.C.; Zhang, L.; Mei, N.; Chen, T.; Herman, D.; Goodsaid, F.M.; et al. Rat toxicogenomic study reveals analytical consistency across microarray platforms. Nature biotechnology 2006, 24, 1162–1169. [Google Scholar] [CrossRef] [PubMed]
- Javitt, N.B. Hep g2 cells as a resource for metabolic studies: Lipoprotein, cholesterol, and bile acids. FASEB J. 1990, 4, 161–168. [Google Scholar] [PubMed]
- Dashti, N.; Feng, Q.; Franklin, F.A. Long-term effects of cis and trans monounsaturated (18:1) and saturated (16:0) fatty acids on the synthesis and secretion of apolipoprotein a-i- and apolipoprotein b-containing lipoproteins in hepg2 cells. J. Lipid Res. 2000, 41, 1980–1990. [Google Scholar] [PubMed]
- Furth, E.E.; Sprecher, H.; Fisher, E.A.; Fleishman, H.D.; Laposata, M. An in vitro model for essential fatty acid deficiency: Hepg2 cells permanently maintained in lipid-free medium. J. Lipid Res. 1992, 33, 1719–1726. [Google Scholar] [PubMed]
- Kosone, T.; Takagi, H.; Horiguchi, N.; Ariyama, Y.; Otsuka, T.; Sohara, N.; Kakizaki, S.; Sato, K.; Mori, M. Hgf ameliorates a high-fat diet-induced fatty liver. Am. J. Physiol. Gastrointest. Liver Physiol. 2007, 293, G204–G210. [Google Scholar] [CrossRef] [PubMed]
- Strauss, J.G.; Hayn, M.; Zechner, R.; Levak-Frank, S.; Frank, S. Fatty acids liberated from high-density lipoprotein phospholipids by endothelial-derived lipase are incorporated into lipids in hepg2 cells. Biochem. J. 2003, 371, 981–988. [Google Scholar] [CrossRef] [PubMed]
- Nagrath, D.; Xu, H.; Tanimura, Y.; Zuo, R.; Berthiaume, F.; Avila, M.; Yarmush, R.; Yarmush, M.L. Metabolic preconditioning of donor organs: Defatting fatty livers by normothermic perfusion ex vivo. Metab. Eng. 2009, 11, 274–283. [Google Scholar] [CrossRef] [PubMed]
- Berthiaume, F.; Barbe, L.; Mokuno, Y.; MacDonald, A.D.; Jindal, R.; Yarmush, M.L. Steatosis reversibly increases hepatocyte sensitivity to hypoxia-reoxygenation injury. J. Surg. Res. 2009, 152, 54–60. [Google Scholar] [CrossRef] [PubMed]
- Orman, M.A.; Arai, K.; Yarmush, M.L.; Androulakis, I.P.; Berthiaume, F.; Ierapetritou, M.G. Metabolic flux determination in perfused livers by mass balance analysis: Effect of fasting. Biotechnol. Bioeng. 2010, 107, 825–835. [Google Scholar] [CrossRef] [PubMed]
- Tao, H.; Zhang, Y.; Zeng, X.; Shulman, G.I.; Jin, S. Niclosamide ethanolamine-induced mild mitochondrial uncoupling improves diabetic symptoms in mice. Nat. Med. 2014, 20, 1263–1269. [Google Scholar] [CrossRef] [PubMed]
- Janne, J.; Alhonen, L.; Pietila, M.; Keinanen, T.A.; Uimari, A.; Hyvonen, M.T.; Pirinen, E.; Jarvinen, A. Genetic manipulation of polyamine catabolism in rodents. J. Biochem. 2006, 139, 155–160. [Google Scholar] [CrossRef] [PubMed]
- Banta, S.; Vemula, M.; Yokoyama, T.; Jayaraman, A.; Berthiaume, F.; Yarmush, M.L. Contribution of gene expression to metabolic fluxes in hypermetabolic livers induced through burn injury and cecal ligation and puncture in rats. Biotechnol. Bioeng. 2007, 97, 118–137. [Google Scholar] [CrossRef] [PubMed]
- Yamaguchi, Y.; Yu, Y.M.; Zupke, C.; Yarmush, D.M.; Berthiaume, F.; Tompkins, R.G.; Yarmush, M.L. Effect of burn injury on glucose and nitrogen metabolism in the liver: Preliminary studies in a perfused liver system. Surgery 1997, 121, 295–303. [Google Scholar] [CrossRef]
- Srivastava, S.; Chan, C. Application of metabolic flux analysis to identify the mechanisms of free fatty acid toxicity to human hepatoma cell line. Biotechnol. Bioeng. 2008, 99, 399–410. [Google Scholar] [CrossRef] [PubMed]
- Chan, C.; Berthiaume, F.; Lee, K.; Yarmush, M.L. Metabolic flux analysis of hepatocyte function in hormone- and amino acid-supplemented plasma. Metab. Eng. 2003, 5, 1–15. [Google Scholar] [CrossRef]
- Gibbons, G.F. A comparison of in vitro models to study hepatic lipid and lipoprotein metabolism. Curr. Opin. Lipidol. 1994, 5, 191–199. [Google Scholar] [CrossRef] [PubMed]
- Gibbons, G.; Angelin, B. Lipid metabolism. Curr. Opin. Lipidol. 1994, 5, 157–159. [Google Scholar] [CrossRef] [PubMed]
- Washizu, J.; Chan, C.; Berthiaume, F.; Tompkins, R.G.; Toner, M.; Yarmush, M.L. Amino acid supplementation improves cell-specific functions of the rat hepatocytes exposed to human plasma. Tissue Eng. 2000, 6, 497–504. [Google Scholar] [CrossRef] [PubMed]
- Chan, C.; Hwang, D.; Stephanopoulos, G.N.; Yarmush, M.L.; Stephanopoulos, G. Application of multivariate analysis to optimize function of cultured hepatocytes. Biotechnol. Prog. 2003, 19, 580–598. [Google Scholar] [CrossRef] [PubMed]
- Chan, C.; Berthiaume, F.; Washizu, J.; Toner, M.; Yarmush, M.L. Metabolic pre-conditioning of cultured cells in physiological levels of insulin: Generating resistance to the lipid-accumulating effects of plasma in hepatocytes. Biotechnol. Bioeng. 2002, 78, 753–760. [Google Scholar] [CrossRef] [PubMed]
- Chan, C.; Berthiaume, F.; Lee, K.; Yarmush, M.L. Metabolic flux analysis of cultured hepatocytes exposed to plasma. Biotechnol. Bioeng. 2003, 81, 33–49. [Google Scholar] [CrossRef] [PubMed]
- Lelliott, C.J.; Lopez, M.; Curtis, R.K.; Parker, N.; Laudes, M.; Yeo, G.; Jimenez-Linan, M.; Grosse, J.; Saha, A.K.; Wiggins, D.; et al. Transcript and metabolite analysis of the effects of tamoxifen in rat liver reveals inhibition of fatty acid synthesis in the presence of hepatic steatosis. FASEB J. 2005, 19, 1108–1119. [Google Scholar] [CrossRef] [PubMed]
- Muto, Y.; Gibson, D.M. Selective dampening of lipogenic enzymes of liver by exogenous polyunsaturated fatty acids. Biochem. Biophys. Res. Commun. 1970, 38, 9–15. [Google Scholar] [CrossRef]
- Lee, K.; Berthiaume, F.; Stephanopoulos, G.N.; Yarmush, D.M.; Yarmush, M.L. Metabolic flux analysis of postburn hepatic hypermetabolism. Metab. Eng. 2000, 2, 312–327. [Google Scholar] [CrossRef] [PubMed]
© 2016 by the authors; licensee MDPI, Basel, Switzerland. This article is an open access article distributed under the terms and conditions of the Creative Commons by Attribution (CC-BY) license (http://creativecommons.org/licenses/by/4.0/).
Share and Cite
Yarmush, G.; Santos, L.; Yarmush, J.; Koundinyan, S.; Saleem, M.; Nativ, N.I.; Schloss, R.S.; Yarmush, M.L.; Maguire, T.J.; Berthiaume, F. Metabolic Flux Distribution during Defatting of Steatotic Human Hepatoma (HepG2) Cells. Metabolites 2016, 6, 1. https://doi.org/10.3390/metabo6010001
Yarmush G, Santos L, Yarmush J, Koundinyan S, Saleem M, Nativ NI, Schloss RS, Yarmush ML, Maguire TJ, Berthiaume F. Metabolic Flux Distribution during Defatting of Steatotic Human Hepatoma (HepG2) Cells. Metabolites. 2016; 6(1):1. https://doi.org/10.3390/metabo6010001
Chicago/Turabian StyleYarmush, Gabriel, Lucas Santos, Joshua Yarmush, Srivathsan Koundinyan, Mubasher Saleem, Nir I. Nativ, Rene S. Schloss, Martin L. Yarmush, Timothy J. Maguire, and Francois Berthiaume. 2016. "Metabolic Flux Distribution during Defatting of Steatotic Human Hepatoma (HepG2) Cells" Metabolites 6, no. 1: 1. https://doi.org/10.3390/metabo6010001
APA StyleYarmush, G., Santos, L., Yarmush, J., Koundinyan, S., Saleem, M., Nativ, N. I., Schloss, R. S., Yarmush, M. L., Maguire, T. J., & Berthiaume, F. (2016). Metabolic Flux Distribution during Defatting of Steatotic Human Hepatoma (HepG2) Cells. Metabolites, 6(1), 1. https://doi.org/10.3390/metabo6010001