Improving the Sustainability of Farming Practices through the Use of a Symbiotic Approach for Anaerobic Digestion and Digestate Processing

Abstract
:1. Introduction
2. Methods
2.1. The Biogas Simulator
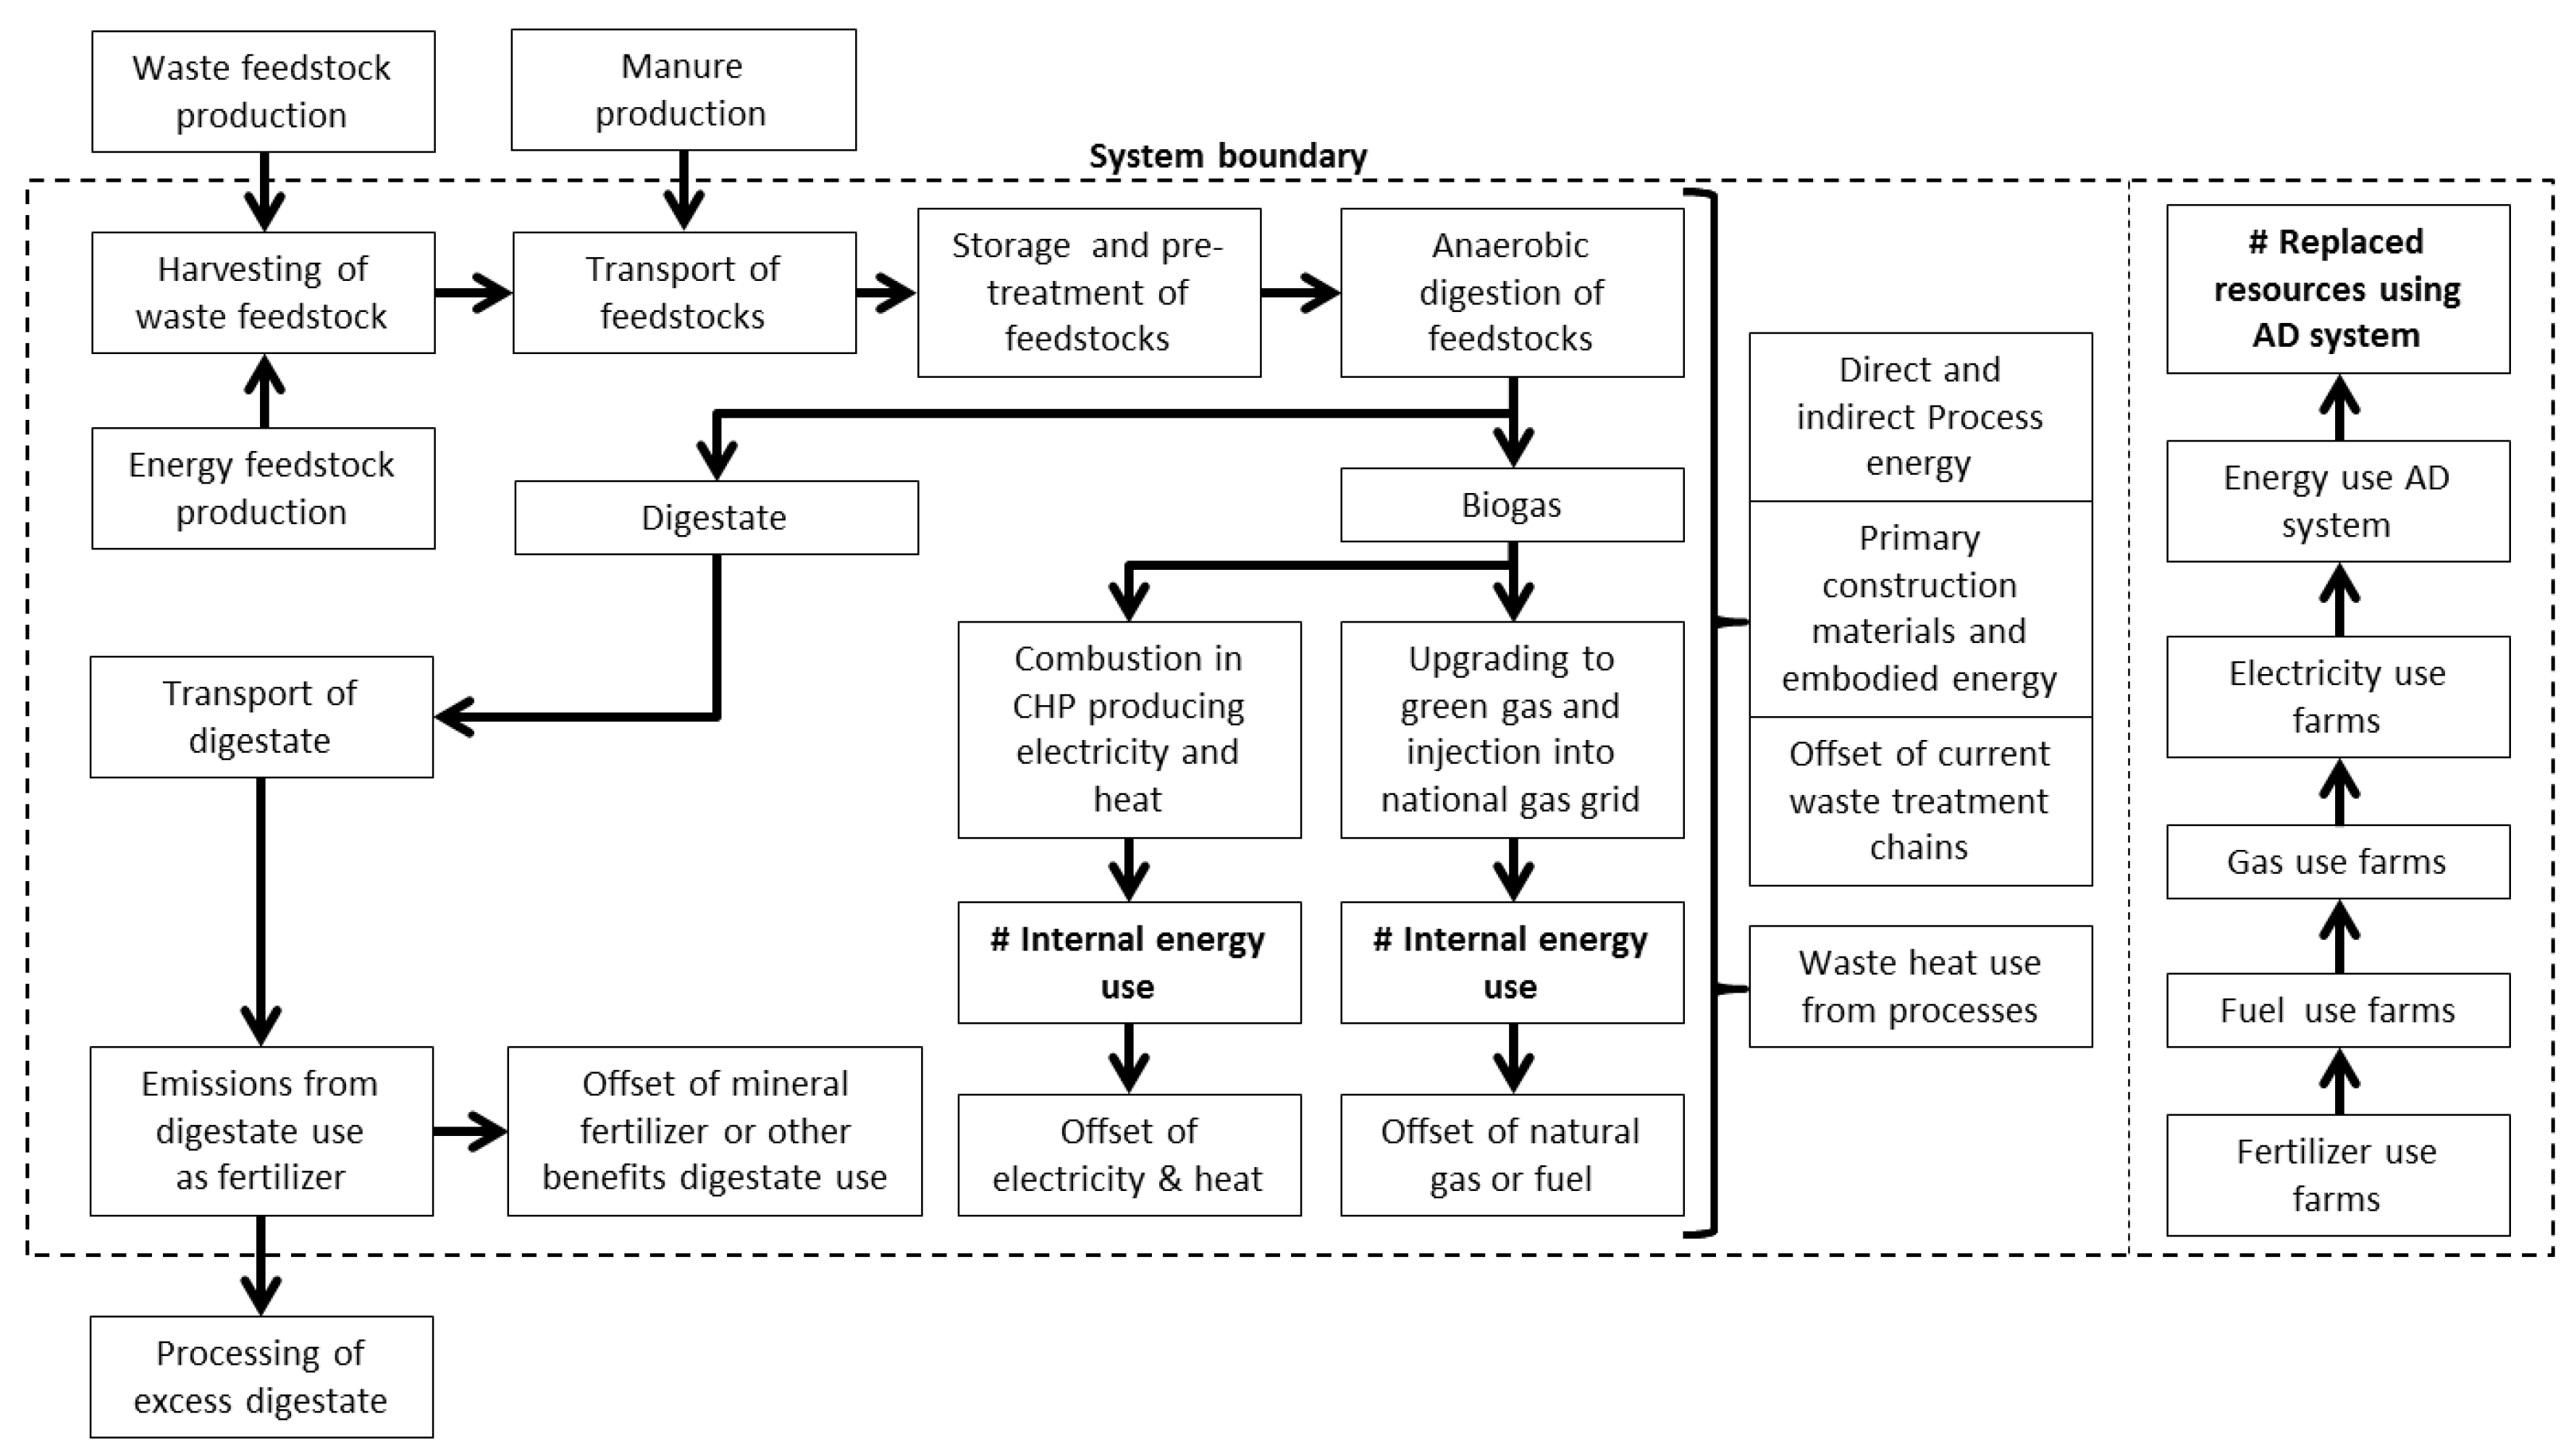
2.2. System Boundary
2.3. Sustainable Impact Indicators (SI Indicators)
3. The Location and Biomass Feedstocks
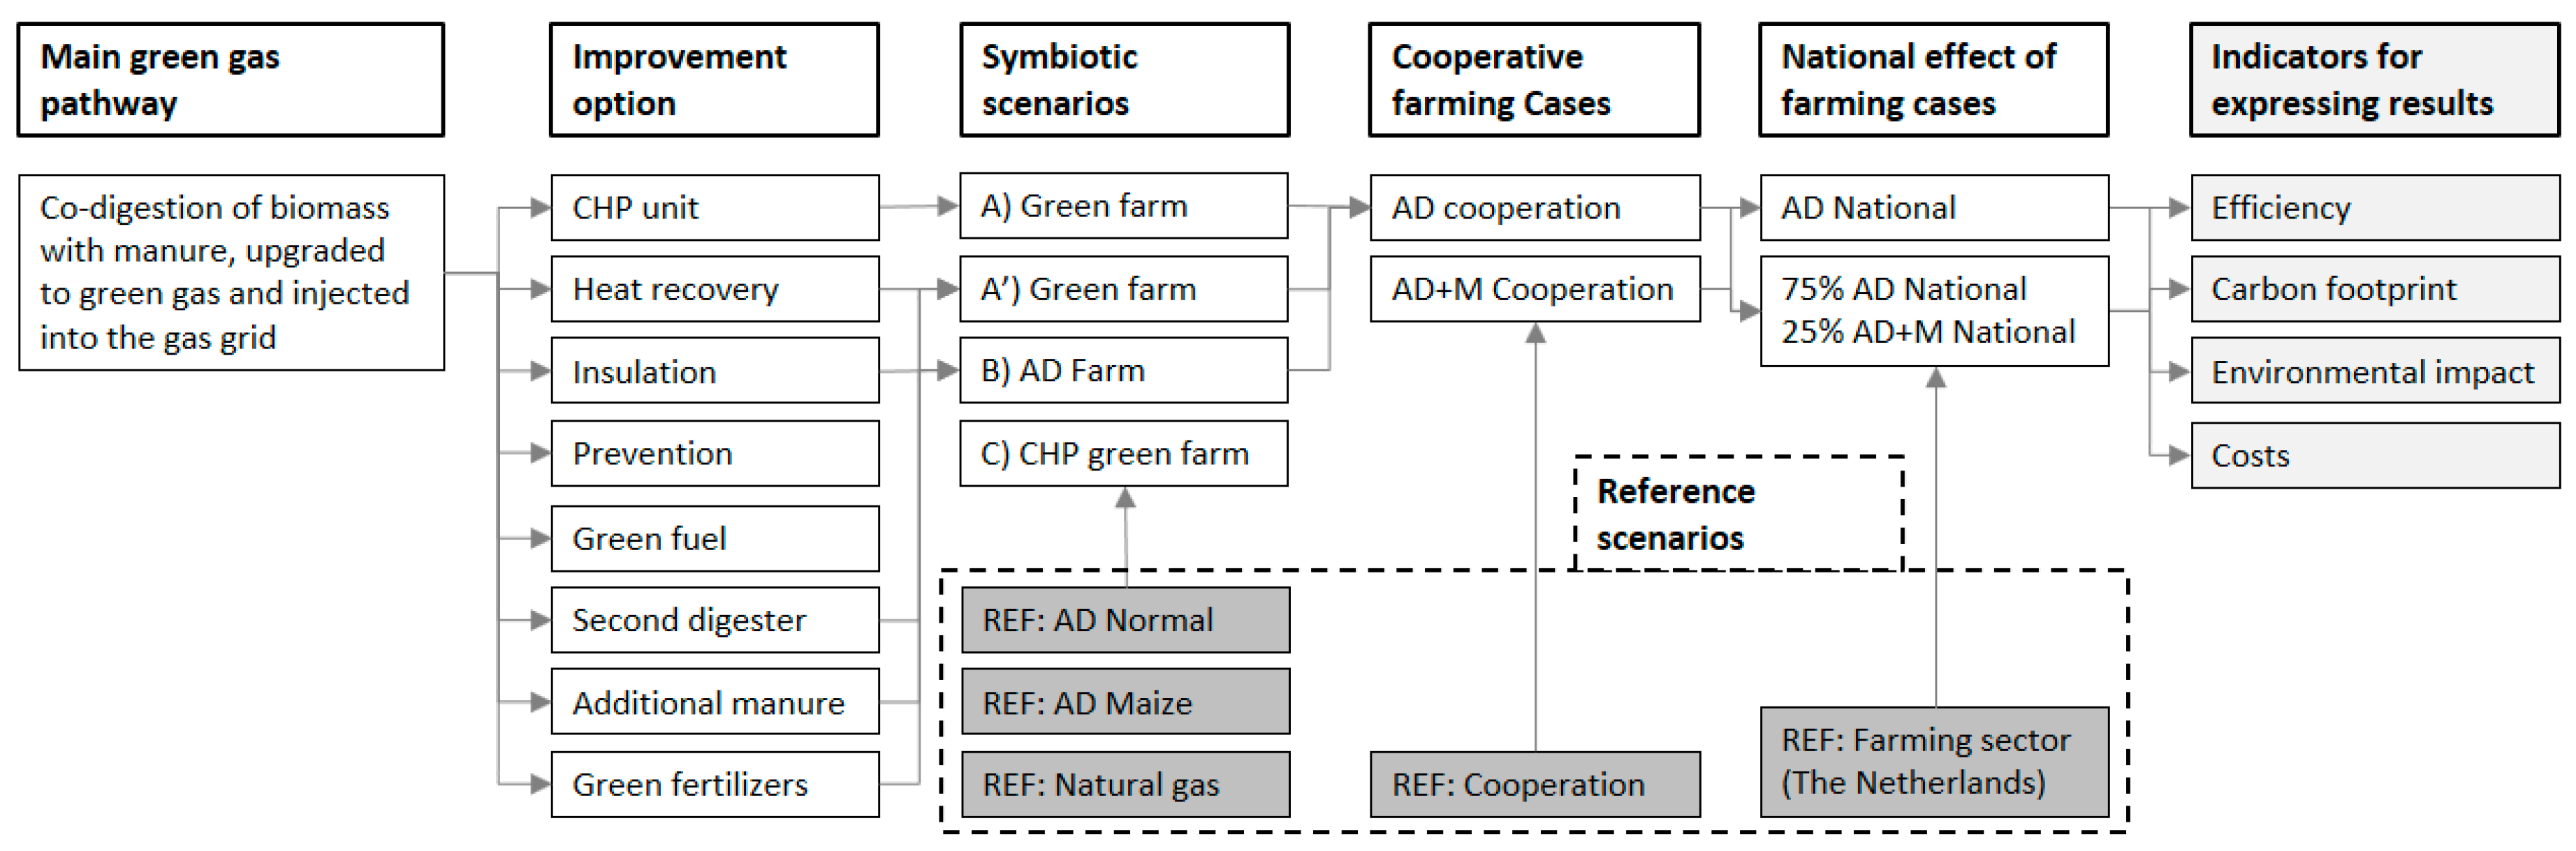
4. Scenarios
4.1. Circular Symbiotic Scenarios
Reference Scenarios
4.2. Cooperative Farming Theoretical Case
4.3. National Implementation Case
5. Results
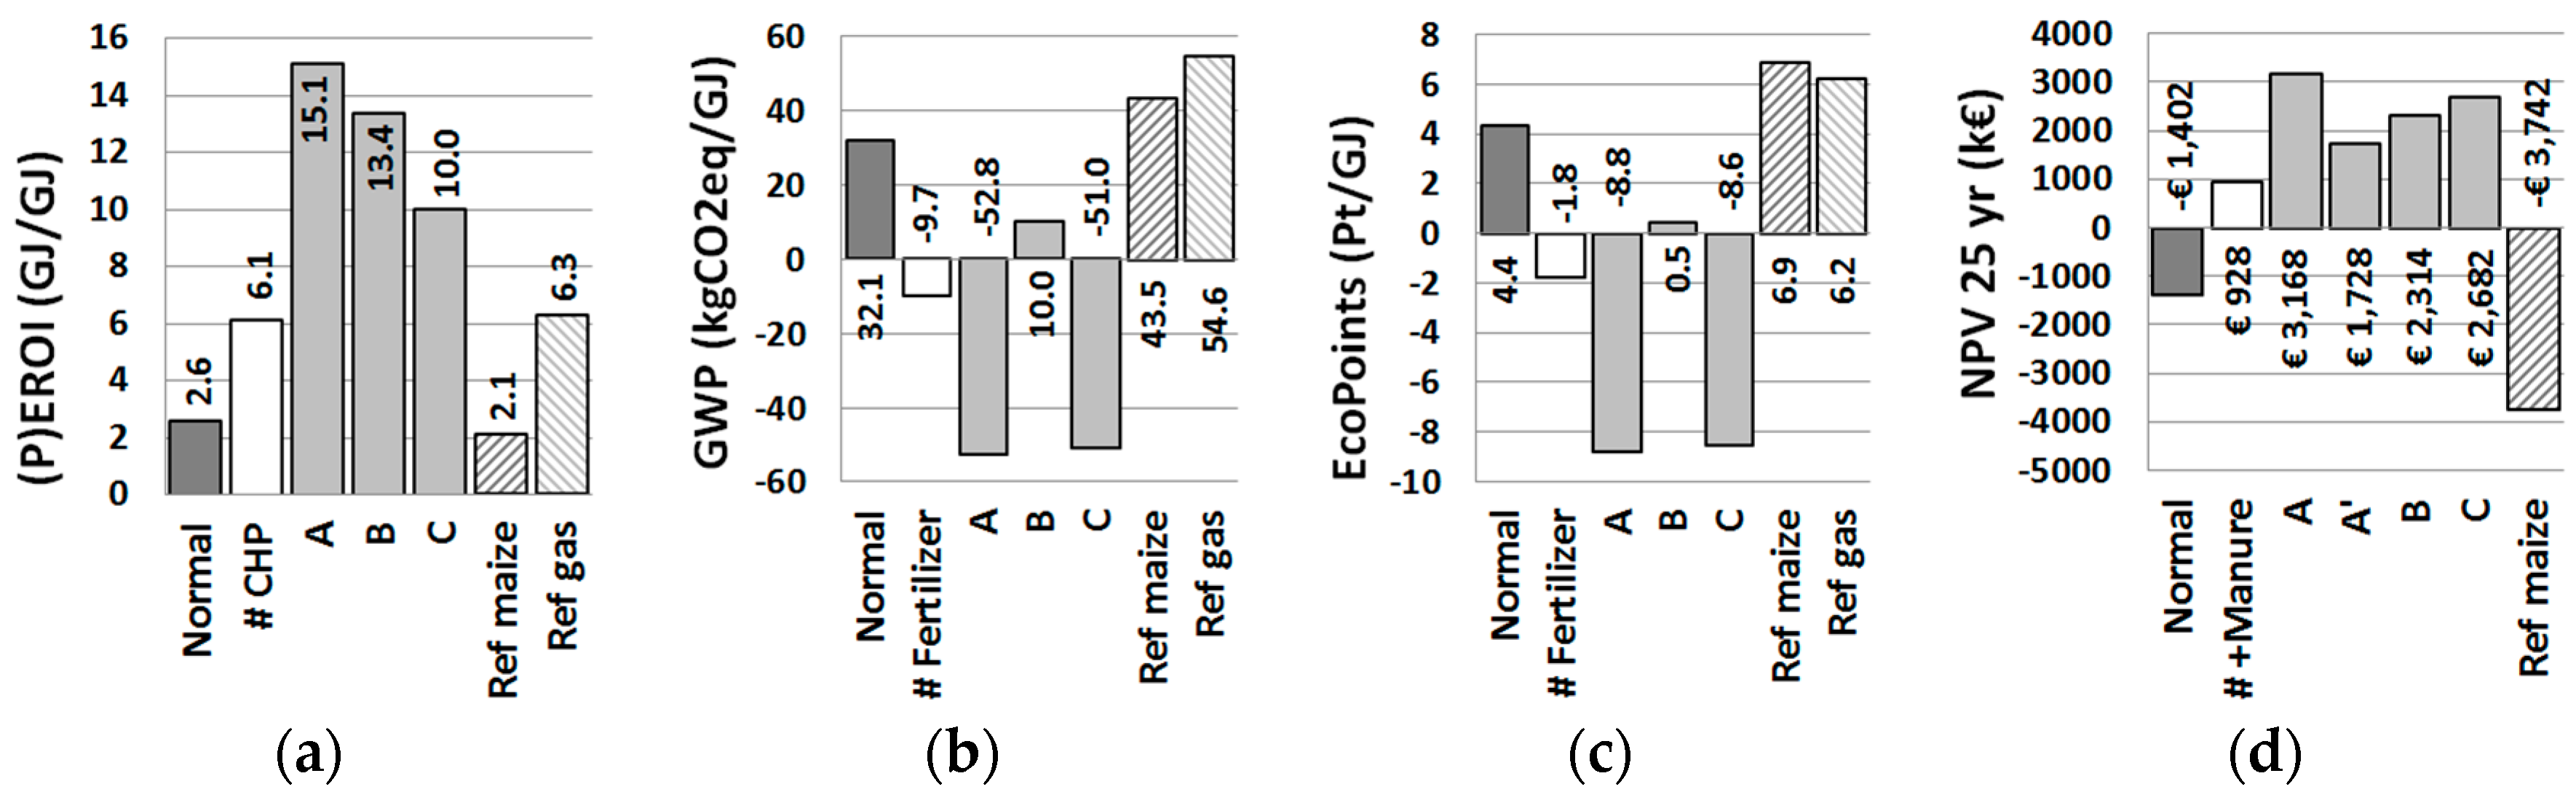
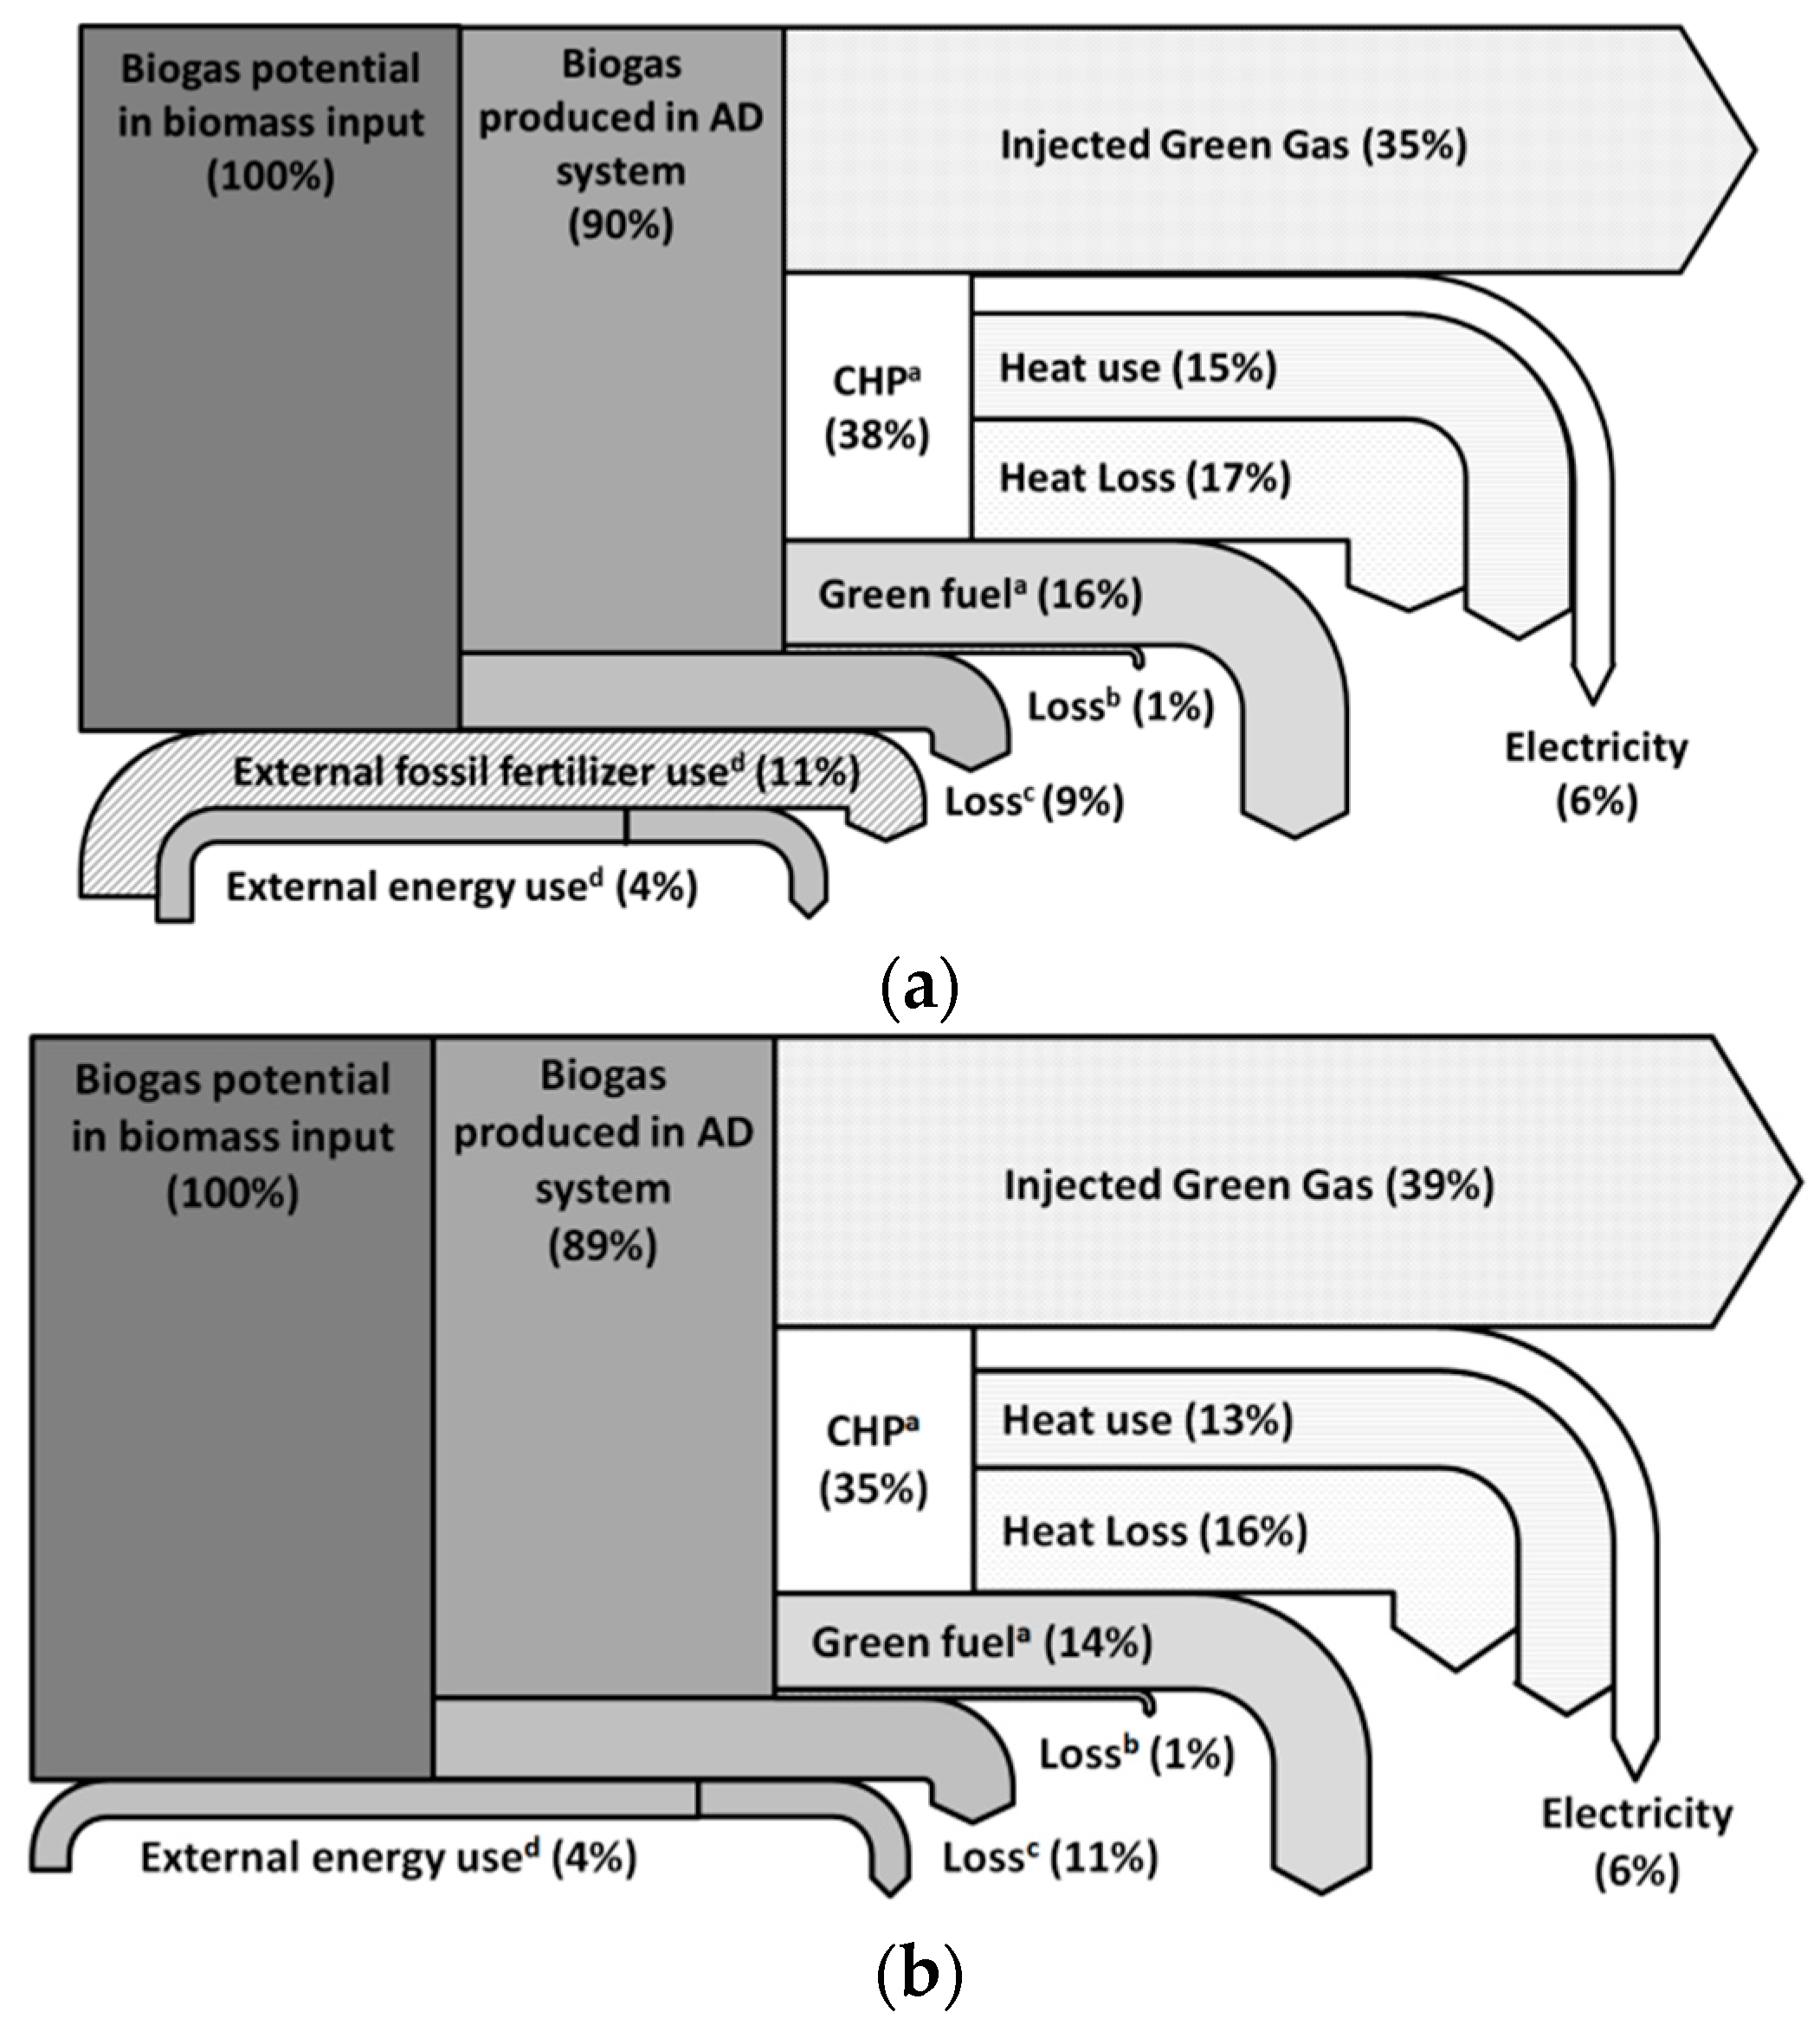
5.1. Symbiotic Circular Systems
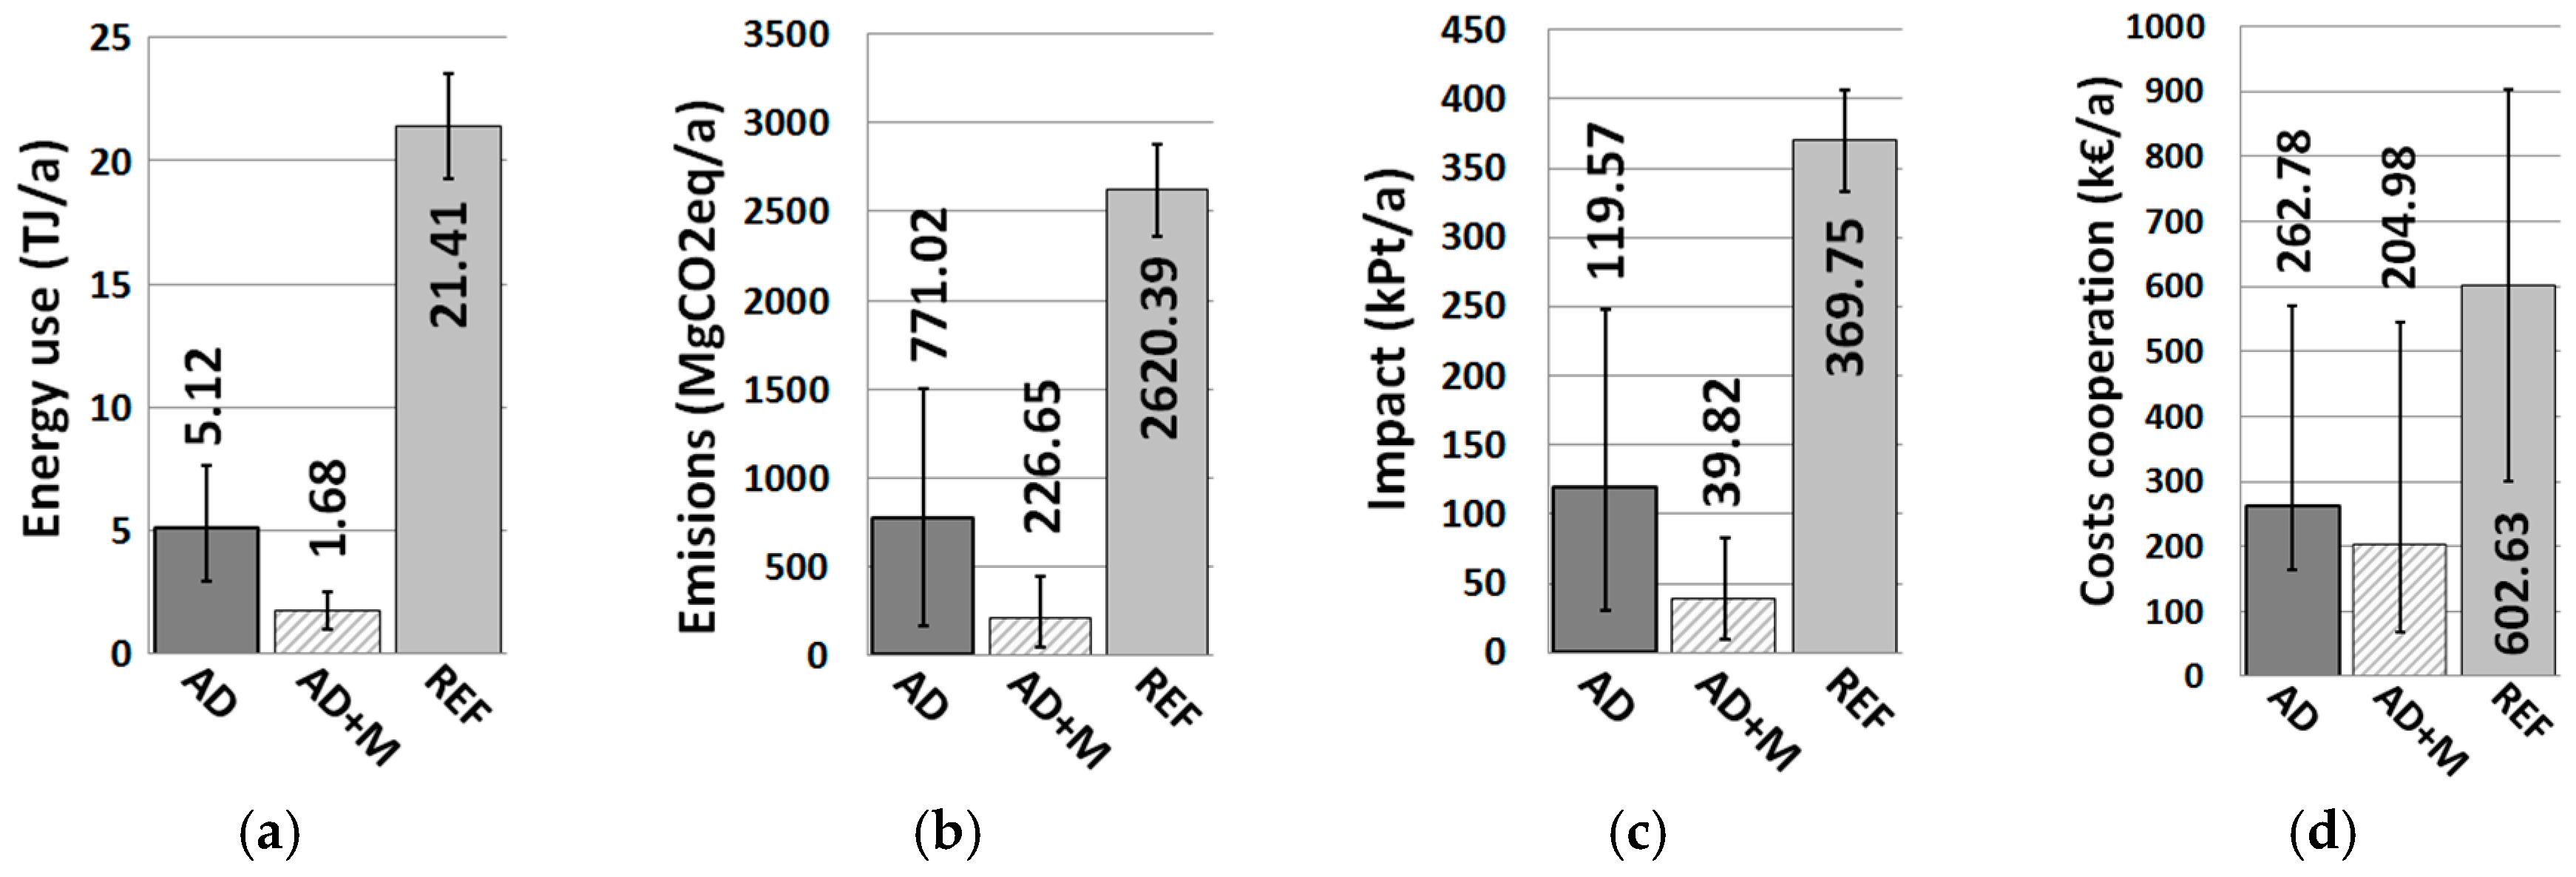
5.2. The Theoretical Cooperative Farming Cases
5.3. National Scope
5.4. Sensitivity Analysis
6. Discussion
Acknowledgments
Author Contribution
Conflicts of Interest
Nomenclature
| AD | Anaerobic Digestion |
| CHP | Combined Heat and Power |
| oDM | Green Dry Matter |
| PJ | Peta Joule (1015 Joule) |
| GJ | Giga Joule (109 Joule) |
| MJ | Mega Joule (106 Joule) |
| Tg | Tera gram (106 Mg) |
| Mg | Mega gram (equivalent to metric ton) |
| SI | Sustainable Indicator |
| GHG | Green House Gasses |
| (P)EROI | Process Energy Returned On Invested |
| GWP100 | Global Warming Potential 100 year scale |
| Pt | Environmental impact in EcoPoint |
| LCA | Life Cycle Analysis |
| aLCA | Attributed Life Cycle Analysis |
| kgCO2eq | Kilograms of Carbon dioxide equivalent |
| Nm3 | Normal cubic meter (Volume at 1bar 0C) |
| NPV | Net Present Value |
Appendix A. Individual Improvement Options

| Nr. | Affiliation | Description of Improvement Option |
|---|---|---|
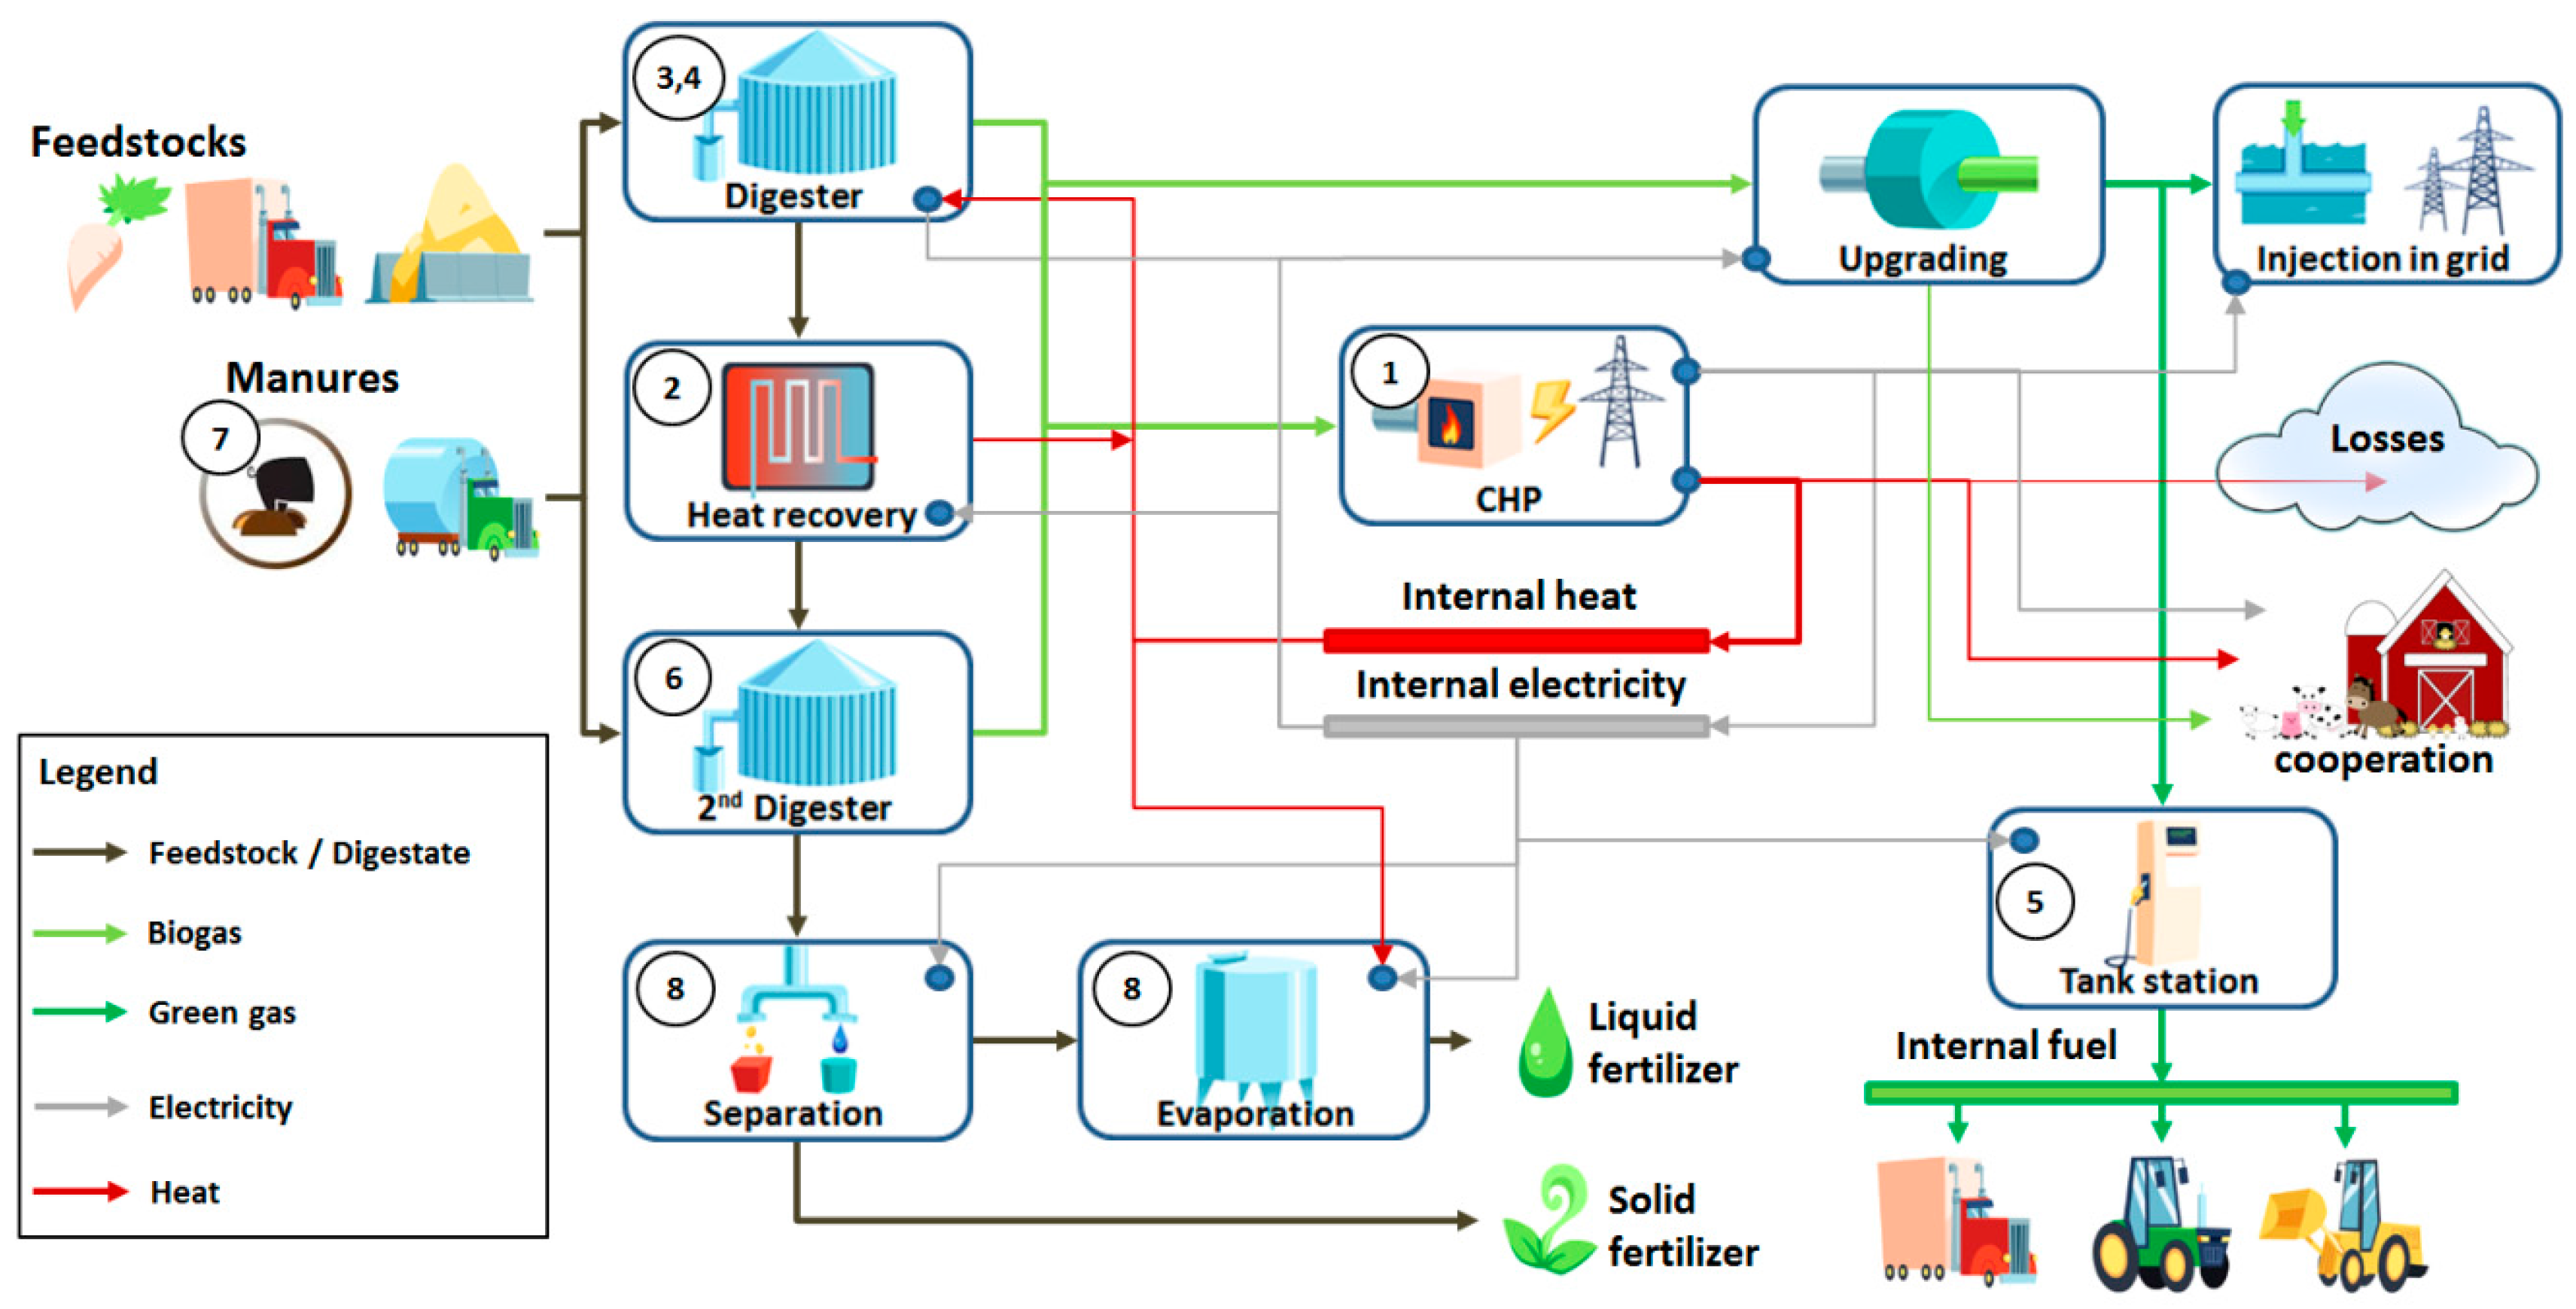
| (1) | CHP | A Combined Heat and Power unit (CHP) is used to produce electricity and heat [17] to fulfill the energy demand of the complete AD system (e.g., digester, green gas production, digestate upgrading). Cables and pipelines are incorporated for transportation to the AD production processes [17]. Additional heat requirement not supplied by the CHP is produced by the biogas boiler. In the case of overproduction electricity is put on the local electricity grid and heat is discarded. |
| (2) | Recovery | The main digester operates at a mesophilic temperature of around 35 to 48 degrees Celsius; outgoing digestate will be at the same temperature. Therefore, heat energy in the outgoing digestate can be utilized through a heat exchanger to heat up the ingoing feedstocks at ambient temperature fed into the digester. Infrastructure and energy use for heat recovery is taken into account (Appendix Table A3). |
| (2) | Heat pump | Additionally, a heat pump can be added to the Heat recovery system aforementioned |
| (3) | Insulation | Insulation of the main digester will lower the heat loss from the main digestion tank, which operates at mesophilic temperatures. Therefore, biogas can be saved resulting in more green gas finally produced. Insulation will bring with it additional capital expenditure and embodied energy but will also reduce the heat demand of the process. Heat requirement of the main digester is lowered with 20% to simulate the effect of insulation on the SI indicators. |
| (4) | Prevention | Gas leakages can be prevented through the use of repair and higher greenhouse gas emissions (e.g., methane) can be reduced using catalytic conversion lowering the carbon footprint. Repair focuses on actual leaks in biogas equipment such as the main and second digester, piping, upgrading installations. Catalytic conversion focuses on outputs from upgrading or combustion, which often contain methane or Nitrogen oxides, which are brought back to CO2 level using catalytic conversion. Within this improvement option, losses and emissions from the main digester and second digester are eliminated and higher greenhouse gas emissions from the green gas utilization pathway and CHP unit are reduced to carbon dioxide level. |
| (5) | Green fuel | Green gas produced by the AD plant is used as fuel for agricultural machinery ranging from tractors, front loaders, and trucks transporting the biomass, replacing the use of fossil fuels (e.g., diesel). To achieve the aforementioned, infrastructure in the shape of a filling station is needed [60] which compresses the green gas and stores it in large enough quantities to fill several tanks (Appendix Table A3). |
| (6) | 2nd digester | Processed digestate still contains some biogas potential [52]. However, it is often not efficient and economical to retain this using the main digester, as it is kept at mesophilic temperature and is stirred continuously. Within this context, a second digester (not heated and often stirred) can be used to store the digestate and collect the residual biogas production. The longer retention time in the second digester (up to 5 to 6 months) gives the AD process additional time to break down the last remaining digestible organic material into biogas. Infrastructure and energy use is taken into account (Appendix Table A4), also including the biogas potential of digestate which is based on an average number, as digestate composition is dependent on the feedstocks use in the digester (Appendix Table A4). |
| (7) | +Manure | Due to overabundance and low quality, the available manure is often not fully utilized. Manure can be directly pumped in the second digester to retain the produced biogas to replacing seasonal manure storage during winter or mix it with the digestate for utilization in fertilizer production. This technology can also produce additional environmental benefits, which can be mitigated. A maximum of 10,000 Mg of additional manure is added directly to the second digester. Infrastructure and energy use is taken into account (Appendix Table A4). For determining the biogas production of the additional manure the biogas potential of manure is used (Table 1). |
| (8) | Organic fertilizers | Within this improvement option, a large share of the digestate (80%) is separated into a thick and a thin fraction using a manure separator [61]. The thin fraction is rich in nitrogen and contains most of the water, whereas the thick fraction contains most of the phosphates, potassium and organic materials. The thin fraction is processed using reversed osmosis to decrease the water fraction [56,62]. The processed and upgraded thin and thick fractions are used as organic fertilizers on the farm replacing fossil fertilizers (Table 5). The remaining 20% of the digestate is used for replacing manure fertilization on the pasture; however, this will not replace fossil fertilizers. The needed infrastructure and energy use of the installations is taken into account. |
| (8) | Selling fertilizers | Organic fertilizers can also be sold on the market when own demand is fulfilled, unfortunately for lower prices. Within this improvement option all the organic fertilizer produced is sold on the market (Appendix Table A3). |
Appendix B. Additional Data Used in Article
| Main Economic Values | Value | Unit | Source |
|---|---|---|---|
| Interest on loan and Required rate of return | 5 | % | [53] |
| Inflation | 1.8 | % | [63] |
| Increase of electricity and gas price per year a | 2 | % | [64] |
| Economic write off period | 15 | Years | |
| CAPEX Main installation | Value | Unit | Source |
| AD system | 53.64 | €/(Mg/a capacity) | [18] |
| Feedstock pre-treatments systems | 3.00 | €/(Mg/a capacity) | [65] |
| Upgrading system | 4024.88 | €/(Nm3/hr capacity) | [18] |
| Green gas injection system | 550.00 | €/(Nm3/hr capacity) | [18] |
| Scrap value installation after 25 years | 5% | %/CAPEX | [66] |
| OPEX | Value | Unit | Source |
| Operation and maintenance | 5 | % Investment/a | [18] |
| Tax on products | 6 | %/costs resource | [67] |
| Income tax | 25 | %/costs resource | [68] |
| Transport by truck | 0.05 | €/ton.km | [18] |
| Electricity from grid | 0.19 | €/kWh | [57] |
| Natural gas from grid c | 0.53 | €/Nm3 | [57] |
| Diesel fuel | 1.40 | €/L | [50] |
| INCOME GREEN GAS b | Value | Unit | Source |
| Green gas market price c | 0.020 | €/kWh | [42] |
| SDE Subsidization (12 years) | 0.076 | €/kWh | [42] |
| SDE extended (additional 12 years) | 0.067 | €/kWh | [42] |
| Correction fee SDE Subsidization (12 years) | 0.022 | €/kWh | [42] |
| Correction fee SDE extended (12 years) | 0.022 | €/kWh | [42] |
| INCOME GREEN ELECTRICITY b | Value | Unit | Source |
| Green electricity market price | 0.025 | €/kWh | [42] |
| SDE Subsidization (12 years) | 0.114 | €/kWh | [42] |
| SDE extended (additional 12 years) | 0.101 | €/kWh | [42] |
| Correction fee SDE Subsidization (12 years) | 0.032 | €/kWh | [42] |
| Correction fee SDE extended(12 years) | 0.033 | €/kWh | [42] |
| CAPEX improvements | Value | Unit | Source |
| Heat recovery digestate | 25 | €/kWth | |
| Heat recovery with heat pump system | 200 | €/kWth | |
| Insulation of the AD system | 4000 | €/% improvement | |
| Second digester/manure storage | 90 | €/m3 (storage capacity) | [50] |
| CHP unit | 946.16 | €/kWe | [69] |
| Digestate separation unit | 1.45 | €/(m3 digestate/a) | [61] |
| Digestate upgrading system (reversed osmosis) | 30 | €/(Mg/a capacity) | [56] |
| Fueling station (approx. 4–8 trucks, tractors per day) | 75,000 | €/(20–40 GGE/day)d | [70] |
| Added Technologies | Value | Unit | Source |
|---|---|---|---|
| Efficiency heat exchanger | 90 | % | |
| COP value heat pump | 5 | [71] | |
| Energy requirement second digester | 5 | MJ/Mg FM | |
| Energy requirement separator a | 4.68 | MJ/Mg FM | [72] |
| Energy use reversed osmosis | 35 | MJ/Mg FM | [56] |
| Energy use filling station b | 4.68 | MJ/Nm3 | [60] |
| Fertilizers Replaced | Nitrogen as N | Phosphate as P2O5 | Potassium as K2O | Units | Source |
|---|---|---|---|---|---|
| Market price fossil fertilizer | 1.10 | 1.05 | 0.65 | €/kg | [50] |
| Market price organic fertilizer | 0.60 | 0.51 | 0.26 | €/kg | [73] |
| Required energy for production | 75.90 | 27.9 | 12.9 | MJ/kg | [58,59] |
| Emission during production | 12.60 | 2.22 | 2.30 | kgCO2eq/kg | [58,59] |
| Environmental impact during production | 1.77 | 0.76 | 0.24 | Pt/kg | [58,59] |
| Variable in Scenario | Worst | Ave | Best | Source |
|---|---|---|---|---|
| Percentage | % | % | % | |
| (P)EROI | 57.18% | 100.00% | 149.02% | [17] |
| Emission | 194.16% | 100.00% | 21.74% | [17] |
| Impact | 207.00% | 100.00% | 25.51% | [17] |
| Total investment | 120.00% | 100.00% | 80.00% | |
| Salvage value | 0.00% | 5.00% | 10.00% | [50,66] |
| Biogas production | 57.18% | 100.00% | 149.02% | [17] |
| Interest | 6.00% | 5.00% | 2.00% | |
| Taxation on internal use | 21% | 6% | 0% | [67] |
| Discarding digestate | 50.00% | 0.00% | 0.00% | |
| Fertilizer price | 150.00% | 100.00% | 50.00% | |
| Maintenances | 7.00% | 5.00% | 3.00% |
| Energy or Material Flow | Dairy Farm | Agricultural Farm | Natural Areas | Unit | Source |
|---|---|---|---|---|---|
| Total land use the Netherlands | 956,000 | 995,756 | ? | ha | |
| Diesel use | 130 | 238 | - | L/ha.a | [50] |
| Electricity use | 940 a | 549 | - | kWh/ha.a | [50] |
| Natural gas use | 32 a | 10 | - | Nm3/ha.a | |
| Water use | 80 a | 10 | - | m3/ha.a | [50] |
| Nitrate cap | 265 | 170 | ? | kg/ha.a | [50] |
| Phosphate cap | 95 | 65 | ? | kg/ha.a | [50] |
| Potassium cap | 225 | 225 | ? | kg/ha.a | [50] |
Appendix C. Main Calculation Output National Case
| Energy or Material Flow | Total NL a | Farming a | AD + M | AD | Unit |
|---|---|---|---|---|---|
| Carbon footprint | 193.7 | 26.7 | 18.1 | 20.1 | Tg |
| Carbon footprint green gas | 23.8 | 24.4 | Tg | ||
| Energy | 2206.0 | 133.9 | 63.4 | 75.7 | PJ |
| Energy green gas | 72.4 | 85.3 | PJ |
| Energy or Material Flow | Total NL a | Farming a | AD + M | AD | Unit |
|---|---|---|---|---|---|
| Carbon footprint | 193.7 | 26.7 | 19.6 | 20.1 | TgCO2eq |
| Mitigation green gas | 23.8 | 24.4 | TgCO2eq | ||
| Energy | 2206.0 | 133.9 | 63.4 | 75.7 | PJ |
| Mitigation green gas | 72.4 | 85.3 | PJ |
| Energy or Material Flow | Nitrogen | Phosphate | Source |
|---|---|---|---|
| Total nutrient production | 497,500 | 180,100 | [57] |
| Possible placement of nutrients a | 377,000 | 134,300 | [57] |
| Nutrient | 120,500 | 45,800 | |
| Percentage deposit | 24.22% | 25.43% |
References
- European Parliament. Directive 2009/28/EC of the European Parliament and of the Council of 23 April 2009 on the Promotion of the Use of Energy from Renewable Sources and Amending and Subsequently Repealing Directives 2001/77/EC and 2003/30/EC 2009; European Parliament: Brussels, Belgium, 2009. [Google Scholar]
- European Commission. Communication from the Commission to the European Parliament, the Council, the European Economic and Social Committee and the Committee of the Regions; Energy Roadmap 2050; Brussels, 15.12.2011. com(2011) 885 Final; European Commission: Brussels, Belgium, 2011. [Google Scholar]
- Pacini, C.; Wossink, A.; Giesen, G.; Vazzana, C.; Huirne, R. Evaluation of sustainability of organic, integrated and conventional farming systems: A farm and field-scale analysis. Agric. Ecosyst. Environ. 2003, 95, 273–288. [Google Scholar] [CrossRef]
- Vatn, A.; Bakken, L.; Bleken, M.A.; Baadshaug, O.H.; Fykse, H.; Haugen, L.E.; Lundekvam, H.; Morken, J.; Romstad, E.; Rørstad, P.K.; et al. A methodology for integrated economic and environmental analysis of pollution from agriculture. Agric. Syst. 2006, 88, 270–293. [Google Scholar] [CrossRef]
- Meyer-Aurich, A. Economic and environmental analysis of sustainable farming practices—A Bavarian case study. Agric. Syst. 2005, 86, 190–206. [Google Scholar] [CrossRef]
- Sociaal-Economiche Raad. Energieakkoord Voor Duurzame Groei 2013; Sociaal-Economiche Raad: Hague, The Netherlands, 2013. (In Dutch) [Google Scholar]
- Planbureau Voor Leefomgeving. Duurzame Landbouw in Nederland; Planbureau Voor Leefomgeving: Hague, The Netherlands, 2015. (In Dutch)
- Gebrezgabher, S.A.; Meuwissen, M.P.M.; Oude Lansink, A.G.J.M. Energy-neutral dairy chain in the Netherlands: An economic feasibility analysis. Biomass Bioenergy 2012, 36, 60–68. [Google Scholar] [CrossRef]
- Li, Y.; Park, S.Y.; Zhu, J. Solid-state anaerobic digestion for methane production from organic waste. Renew. Sustain. Energy Rev. 2011, 15, 821–826. [Google Scholar] [CrossRef]
- Berglund, M.; Börjesson, P. Assessment of energy performance in the life-cycle of biogas production. Biomass Bioenergy 2006, 30, 254–266. [Google Scholar] [CrossRef]
- Börjesson, P.; Berglund, M. Environmental systems analysis of biogas systems—Part II: The environmental impact of replacing various reference systems. Biomass Bioenergy 2007, 31, 326–344. [Google Scholar] [CrossRef]
- Poeschl, M.; Ward, S.; Owende, P. Environmental impacts of biogas deployment—Part II: Life cycle assessment of multiple production and utilization pathways. J. Clean. Prod. 2012, 24, 184–201. [Google Scholar] [CrossRef]
- Jury, C.; Benetto, E.; Koster, D.; Schmitt, B.; Welfring, J. Life Cycle Assessment of biogas production by monofermentation of energy crops and injection into the natural gas grid. Biomass Bioenergy 2010, 34, 54–66. [Google Scholar] [CrossRef]
- Hamelin, L.; Naroznova, I.; Wenzel, H. Environmental consequences of different carbon alternatives for increased manure-based biogas. Appl. Energy 2014, 114, 774–782. [Google Scholar] [CrossRef]
- Hahn, H.; Hartmann, K.; Bühle, L.; Wachendorf, M. Comparative life cycle assessment of biogas plant configurations for a demand oriented biogas supply for flexible power generation. Bioresour. Technol. 2015, 179, 348–358. [Google Scholar] [CrossRef] [PubMed]
- Mezzullo, W.G.; McManus, M.C.; Hammond, G.P. Life cycle assessment of a small-scale anaerobic digestion plant from cattle waste. Appl. Energy 2013, 102, 657–664. [Google Scholar] [CrossRef] [Green Version]
- Pierie, F.; van Someren, C.E.J.; Benders, R.M.J.; Bekkering, J.; van Gemert, W.J.T.; Moll, H.C. Environmental and energy system analysis of bio-methane production pathways: A comparison between feedstocks and process optimizations. Appl. Energy 2015, 160, 456–466. [Google Scholar] [CrossRef]
- Bekkering, J.; Hengeveld, E.J.; van Gemert, W.J.T.; Broekhuis, A.A. Will implementation of green gas into the gas supply be feasible in the future? Appl. Energy 2015, 140, 409–417. [Google Scholar] [CrossRef]
- Bekkering, J.; Hengeveld, E.J.; van Gemert, W.J.T.; Broekhuis, A.A. Designing a green gas supply to meet regional seasonal demand—An operations research case study. Appl. Energy 2015, 143, 348–358. [Google Scholar] [CrossRef]
- Toekomst Biogas: Van Laagwaardige Input naar Hoogwaardige Output. 2013, pp. 1–12. Available online: https://www.rabobank.nl/images/thema_update_biogas_29519499.pdf (accessed on 25 September 2017). (In Dutch).
- Vos, J.; Zwart, K. Mest(co)vergisting en Biogas/Groengas Productie in Overijssel: Ervaringsproblemen, Kansen & Verbeterstrategieën; Biomass Technology Group: Enschede, The Netherlands, 2013. (In Dutch) [Google Scholar]
- Sokka, L.; Pakarinen, S.; Melanen, M. Industrial symbiosis contributing to more sustainable energy use—An example from the forest industry in Kymenlaakso, Finland. J. Clean. Prod. 2011, 19, 285–293. [Google Scholar] [CrossRef]
- Chertow, M.R. Industrial symbioses: Literature and Taxonomy. Ann. Rev. Energy Environ. 2000, 25, 313–337. [Google Scholar] [CrossRef]
- Albino, V.; Fraccascia, L.; Savino, T. Industrial Symbiosis for a Sustainable City: Technical, Economical and Organizational Issues. Procedia Eng. 2015, 118, 950–957. [Google Scholar] [CrossRef]
- Bacenetti, J.; Duca, D.; Negri, M.; Fusi, A.; Fiala, M. Mitigation strategies in the agro-food sector: The anaerobic digestion of tomato purée by-products. An Italian case study. Sci. Total Environ. 2015, 526, 88–97. [Google Scholar] [CrossRef] [PubMed]
- Barrera, E.L.; Rosa, E.; Spanjers, H.; Romero, O.; De Meester, S.; Dewulf, J. A comparative assessment of anaerobic digestion power plants as alternative to lagoons for vinasse treatment: Life cycle assessment and exergy analysis. J. Clean. Prod. 2016, 113, 459–471. [Google Scholar] [CrossRef]
- Jin, Y.; Chen, T.; Chen, X.; Yu, Z. Life-cycle assessment of energy consumption and environmental impact of an integrated food waste-based biogas plant. Appl. Energy 2015, 151, 227–236. [Google Scholar] [CrossRef]
- Evangelisti, S.; Lettieri, P.; Borello, D.; Clift, R. Life cycle assessment of energy from waste via anaerobic digestion: A UK case study. Waste Manag. 2014, 34, 226–237. [Google Scholar] [CrossRef] [PubMed]
- Stinner, W.; Möller, K.; Leithold, G. Effects of biogas digestion of clover/grass-leys, cover crops and crop residues on nitrogen cycle and crop yield in organic stockless farming systems. Eur. J. Agron. 2008, 29, 125–134. [Google Scholar] [CrossRef]
- Holm-Nielsen, J.B.; Al Seadi, T.; Oleskowicz-Popiel, P. The future of anaerobic digestion and biogas utilization. Bioresour. Technol. 2009, 100, 5478–5484. [Google Scholar] [CrossRef] [PubMed]
- Pierie, F.; Benders, R.M.J.; Bekkering, J.; van Gemert, W.J.T.; Moll, H.C. Lessons from spatial and environmental assessment of energy potentials for Anaerobic Digestion production systems applied to the Netherlands. Appl. Energy 2016, 176, 233–244. [Google Scholar] [CrossRef]
- Dinuccio, E.; Balsari, P.; Gioelli, F.; Menardo, S. Evaluation of the biogas productivity potential of some Italian agro-industrial biomasses. Bioresour. Technol. 2010, 101, 3780–3783. [Google Scholar] [CrossRef] [PubMed]
- Kuznetsova, E.; Zio, E.; Farel, R. A methodological framework for Eco-Industrial Park design and optimization. J. Clean. Prod. 2016, 126, 308–324. [Google Scholar] [CrossRef]
- Pierie, F.; van Someren, C.E.J.; Liu, W.; Bekkering, J.; Hengeveld, E.J.; Holstein, J.; Benders, R.M.J.; Laugs, G.A.H.; van Gemert, W.; Moll, H.C. An Integrated Approach for the Validation of Energy and Environmental System Analysis Models: Used in the Validation of the Flexigas Excel BioGas Model; Hanzehogeschool Groningen: Groningen, The Netherlands, 2016. [Google Scholar]
- Pierie, F.; van Someren, C.E.J.; Bekkering, J.; Benders, R.M.J.; van Gemert, W.J.T.; Moll, H.C. The Development, Validation and Initial Results of an Integrated Model for Determining the Environmental Sustainability of Biogas Production Pathways. Eur. Biomass Conf. Exhib. 2016, 1411, 1411–1421. [Google Scholar]
- Haberl, H.; Weisz, H. The Potential use of the Materials and Energy Flow Analysis (MEFA) framework to Evaluate the Environmental Costs of Agricultural Production Systems and Possible Applications to Aquaculture 2007. In Proceedings of the FAO/WFT Expert Workshop (TRUNCATED), Vancouver, BC, Canada, 24–28 April 2006. [Google Scholar]
- Brealey, R.A.; Myers, S.C.; Allen, F. Principles of Corporate Finance—Global Edition with Connect Plus; McGraw-Hill Education: New York City, NY, USA, 2013. [Google Scholar]
- Elkington, J. Cannibals with forks—The Triple Bottom line of the 21st century Business; Capstone Publishing Ltd.: Oxford, UK, 1999. [Google Scholar]
- Mori, K.; Christodoulou, A. Review of sustainability indices and indicators: Towards a new City Sustainability Index (CSI). Environ. Impact Assess. Rev. 2012, 32, 94–106. [Google Scholar] [CrossRef]
- Rehl, T.; Lansche, J.; Müller, J. Life cycle assessment of energy generation from biogas—Attributional vs. consequential approach. Renew. Sustain. Energy Rev. 2012, 16, 3766–3775. [Google Scholar] [CrossRef]
- Minister van Landbouw, Natuur en Voedselkwaliteit. Uitvoeringsregeling Meststoffenwet: Positieve lijst Vergisting 2016: Artikel 1; Minister van Landbouw, Natuur en Voedselkwaliteit: Hague, The Nederlands, 2016. [Google Scholar]
- Rijksdienst voor Ondernemend Nederland (RVO). Biomassa SDE+ 2016; Rijksdienst voor Ondernemend Nederland: Nijkerk, The Netherlands, 2016. (In Dutch)
- Hall, A.S.C.; Balogh, S.; Murphy, J.R.D. What is the Minimum EROI that a Sustainable Society Must Have? Energies 2009, 2, 25–47. [Google Scholar] [CrossRef]
- Intergovernmental Panel on Climate Change. Climate Change 2007, Working Group I: The Physical Science Basis 2007; Intergovernmental Panel on Climate Change: Geneva, Switzerland, 2012. [Google Scholar]
- Goedkoop, M.; de Schryver, A.; Oele, M.; Durksz, S.; de Roest, D. Introduction to LCA with SimaPro 7, version 4.5; PRé Consultants: Amersfoort, The Netherlands, 2010. [Google Scholar]
- PRé Consultants, RIVM, CML, Radboud Universiteit Nijmegen. This Site Presents the ReCiPe Methodology for Life Cycle Impact Assessment (LCIA); PRé Consultants, RIVM, CML, Radboud Universiteit Nijmegen: Amersfoort, The Netherlands, 2014; Available online: https://www.pre-sustainability.com/ (accessed on 25 September 2017).
- Pierie, F.; Bekkering, J.; Benders, R.M.J.; van Gemert, W.J.T.; Moll, H.C. A new approach for measuring the environmental sustainability of renewable energy production systems: Focused on the modelling of green gas production pathways. Appl. Energy 2016, 162, 131–138. [Google Scholar] [CrossRef]
- Amon, T.; Bauer, A.; Ilic, D.; Leonhartsberger, C.; Mair, G. Biogas und Methanpotential von Zwischenfruchten; BOKU: Vienna, Austria, 2010; Available online: http://www.regeneray.com/fileadmin/user_upload/pdf/BOKU-Endbericht-Zwischenfr%C3%BCchte.pdf (accessed on 25 September 2017). (In German)
- Overend, R.P. The average haul distance and transportation work factors for biomass delivered to a central plant. Biomass 1982, 2, 75–79. [Google Scholar] [CrossRef]
- Wageningen UR Livestock Research. Kwantitatieve Informatie Veehouderij 2013–2014 ed.; Wageningen UR Livestock Research: Wageningen, The Netherlands, 2013. (In Dutch) [Google Scholar]
- Brinkmann, A.; Siemer, W. Biogas uit gras een Onderbenut Potentieel; Een Studie naar Kansen Voor Grasvergisting; Pianoo Expertisecentrum Aanbesteden: Hague, The Netherlands, 2014. (In Dutch) [Google Scholar]
- Lems, R.; Langerak, J.; Dirkse, E.H.M. “Next Generation Biogas Upgrading Using Highly Selective Gas Seperation Membranes”: Showcasing the Poundbury Project; DMT Environmental Technology: Joure, The Netherlands, 2008. [Google Scholar]
- Rabobank. Thema-Update: Benchmark (Co-)Vergisting Boekjaar 2010: Rendement Door Markt in Verdrukking! Available online: https://www.rabobank.nl/images/thema_update_vergisting_1_dec_2011_29302275.pdf (accessed on 25 September 2017). (In Dutch).
- Menardo, S.; Gioelli, F.; Balsari, P. The methane yield of digestate: Effect of organic loading rate, hydraulic retention time, and plant feeding. Bioresour. Technol. 2011, 102, 2348–2451. [Google Scholar] [CrossRef] [PubMed]
- Dijksma, S.A.M. Beantwoording vragen over het Gebruik Van Mineralenconcentraat als Kunstmestvervanger Binnen de EU; Wageningen University & Research: Wageningen, The Netherlands, 2015; Available online: https://www.rijksoverheid.nl/documenten/kamerstukken/2015/04/16/beantwoording-kamervragen-over-gebruik-mineralenconcentraat-als-kunstmestvervanger-binnen-de-eu (accessed on 25 September 2017). (In Dutch)
- Klein, B.; Van Stuijvenberg, M.; Visser, S. Potentiële Mogelijkheden tot Mestverwerking op Bedrijfsniveau; Kennis Coalitie Biobased Economy: Almere, The Netherlands, 2014; Available online: https://www.aereshogeschool.nl/-/media/Aeres-Hogeschool/Dronten/Files/Onderzoek/Publicaties-en-artikelen/Duurzame-energie-en-groene-grondstoffen/Archief/Eindrapportage-Mts--Doppenberg-03-04-2014.ashx?la=nl-NL (accessed on 25 September 2017). (In Dutch)
- Bureau of Statistics Netherlands. Statistics Netherlands; Bureau of Statistics Netherlands: Hague, The Nertherlands, 2015. [Google Scholar]
- Pre. The Atributed Life Cycle Analysis Model SimaPro 2013; Pre: Amersfoort, The Netherlands, 2013; Available online: https://www.pre-sustainability.com/ (accessed on 25 September 2017).
- Ecoinvent. Ecoinvent: Database of Consistent, Transparent, and up-to-Date Life Cycle Inventory (LCI) Data; Ecoinvent: Zurich, Switzerland, 2014; Available online: https://www.pre-sustainability.com/ (accessed on 25 September 2017).
- Atlas Copco. Atlas Copco High Pressure CNG Compressors and Refueling Solutions: Intermech BBR/FBR/VIP CNG Compressors 55–450 kW/75–600 HP; Atlas Copco: Nacka, Sweden, 2016. [Google Scholar]
- GEA Farm Equipment, Royal De Boer; Operationele kosten XScrew Mestscheider; Royal De Boer: Leeuwarden, The Netherlands, 2015; Available online: http://www.royaldeboer.nl/ (accessed on 25 September 2017). (In Dutch)
- Masse, L.; Massé, D.I.; Pellerin, Y. The use of membranes for the treatment of manure: A critical literature review. Biosyst. Eng. 2007, 98, 371–380. [Google Scholar] [CrossRef]
- European Central Bank. Inflation Dashboard; European Central Bank: Frankfurt, Germany, 2016. [Google Scholar]
- Magyar, A.; Lorubio, G. Analysis of European Power Price Increase Drivers; EURELECTRIC: Bruxelles, Belgium, 2014. [Google Scholar]
- Reumerman, P. Biogas Uit Natuurgras Eindrapportage; Eindrapportage: Enschede, The Netherlands, 2013; Available online: http://www.btgworld.com/en/ (accessed on 25 September 2017). (In Dutch)
- Kool, A.; Hilhorst, G.J.; van der Vegte, D.Z. Realisatie van Mestvergisting op De Marke; Onderzoek en Demonstratie; CLM-Rapport 608-2005; Wageningen University Research: Wageningen, The Netherlands, 2015; Available online: http://edepot.wur.nl/33208 (accessed on 25 September 2017). (In Dutch)
- Belastingdienst. BTW Bedragen in Nederland; Belastingdienst: Hague, The Netherlands, 2016. (In Dutch)
- Belastingdienst. Verrekenen van Verliezen: Verrekening Door Carry Back/VERREKENING Door Carry Forward; Belastingdienst: Hague, The Netherlands, 2016. (In Dutch)
- Blokhina, Y.N.; Prochnow, A.; Plöchl, M.; Luckhaus, C.; Heiermann, M. Concepts and profitability of biogas production from landscape management grass. Bioresour. Technol. 2011, 102, 2086–2092. [Google Scholar] [CrossRef] [PubMed]
- Smith, M.; Gonzales, J. Costs Associated with Compressed Natural Gas Vehicle Fueling Infrastructure. Factors to Consider in the Implementation of Fueling Stations and Equipment 2014; DOE/GO-102014-4471; US Department of Energy: Washington, DC, USA, 2014.
- Miara, M.; Gunter, D.; Kramer, T.; Oltersdorf, T.; Wapler, J. Heat Pump Efficiency: Analysis and Evaluation of Heat Pump Efficiency in Real Life Conditions; Fraunhofer Institute for Solar Energy Systems ISE, Division Thermal Systems and Buildings: Freiburg, Germany, 2010. [Google Scholar]
- Energie-en Milieu-Informatiesysteem Voor Het Vlaamse Gewest. Mest: Mechanische Scheiding; Energie-en Milieu-Informatiesysteem Voor Het Vlaamse Gewest: Boeretang, Belgium, 2015; Available online: https://emis.vito.be/nl (accessed on 25 September 2017). (In Dutch)
- Drosg, B.; Fuchs, W.; Al Seadi, T.; Madsen, M.; Linke, B. Nutrient Recovery by Biogas Digestate Processing; IEA Bioenergy: Berlin, Germany, 2015. [Google Scholar]
| Feedstock (Mg/a) | Costs (€/Mg) | Tortuosity (Factor) | Transport (km) | Biogas Potential (Nm3/Mg.oDM a) | Methane Potential (Nm3/Mg.oDM a) | |
|---|---|---|---|---|---|---|
| Manure farm/cooperation | 1820 | 0 | 1 | 0.1 d | 350 | 180 |
| Manure source | 8000 | −10 b | 1.5 | 1.5 | 350 | 180 |
| Chicken manure | 475 | 0 | 1.5 | 3 | 416 | 212 |
| Natural/roadside grasses | 6000 | 10 c | 5 | 15 | 560 | 297 |
| Tops from sugar beets | 1100 | 0 | 1.5 | 3 | 550 | 302 |
| Tops from potatoes | 2300 | 0 | 1.5 | 3 | 550 | 302 |
| Straw from grains | 500 | 0 | 1.5 | 3 | 341 | 174 |
| Catch crops | 1100 | 0 | 1.5 | 3 | 640 | 329 |
| Digestate | - | - | - | - | 47 f | 19 f |
| Energy Maize (Reference) | 10,000 | 35 e | 1 | 50 | 606 | 322 |
| Affiliation | Description of Symbiotic Scenario |
|---|---|
| Scenario A | Scenario A, describes the symbiotic system which combines: a Combined Heat and Power unit (CHP) for internal energy production, a 2nd digester with additional manure input, green fuel production from green gas, prevention of leakages and emission, heat recovery, and organic fertilizer production which is used in the surrounding farms to replace fossil fertilizers (Appendix A). Additional insulation of the AD system is not used as the required heat is already produced internally. |
| Scenario A’ | Within this scenario one adaption is made to scenario A, namely: the produced organic fertilizers are sold on the market for lower prices and not used within the surrounding farms to replace fossil fertilizers. This only has an economic effect and, therefore, will only be indicated in the NPV results. |
| Scenario B | Within scenario B, regulations prevent the use of organic fertilizers for replacing fossil fertilizers in the Netherlands by decree of the European Union [55] (although the Dutch government has made some exceptions [56]). Therefore, organic fertilizer production is not included. The scenario combines: a CHP unit for internal energy production, a 2nd digester with additional manure input, green fuel production from green gas, heat recovery from the digestate, prevention of leakages and emissions, and insulation of the digester (20%) for additional heat savings (Appendix A). |
| Scenario C | Currently, many farm scale AD systems within the Netherlands utilize CHP instead of green gas production; therefore, scenario C describes the possibilities of a circular symbiotic AD system combined with CHP. The scenario includes: internal energy production based on CHP, a 2nd digester with additional manure input, prevention of leakages and emission, heat recovery, insulating the digester, and organic fertilizer production which is used in the surrounding farms to replace fossil fertilizers (Appendix A). Within the scenario the full utilization of the waste heat is assumed. |
| Affiliation | Description of the Symbiotic Reference Scenario |
|---|---|
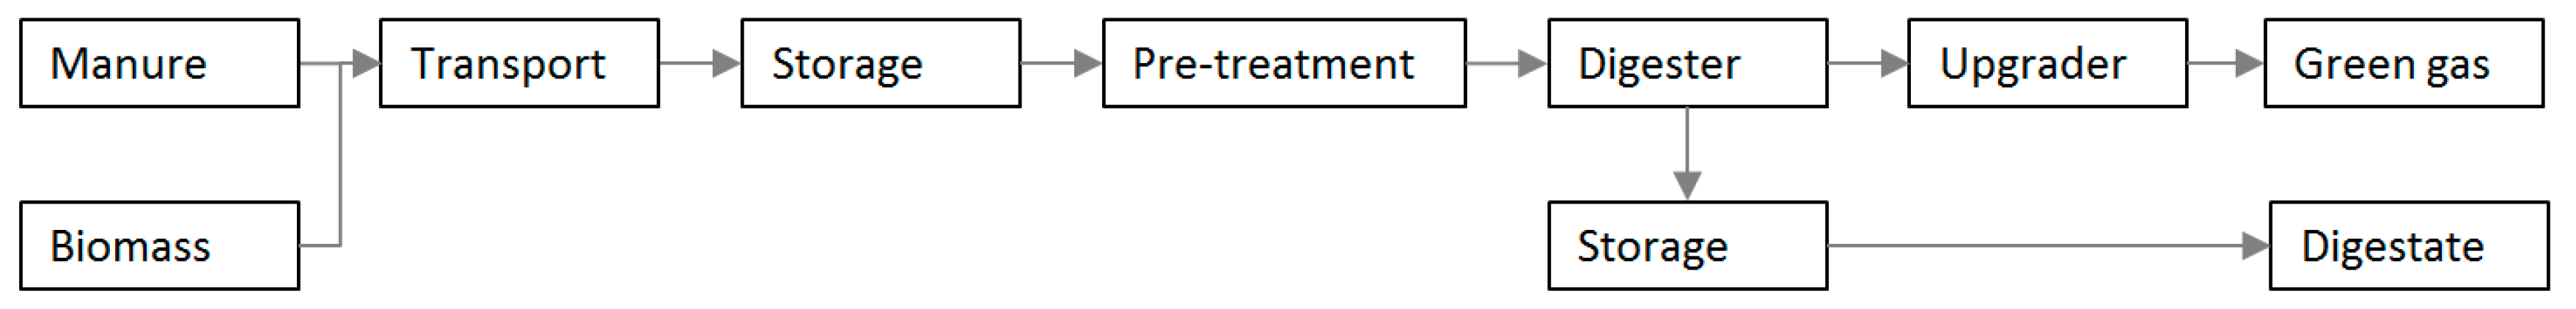
| Normal | The basic AD green gas production pathway without any modifications as described in Section 3. |
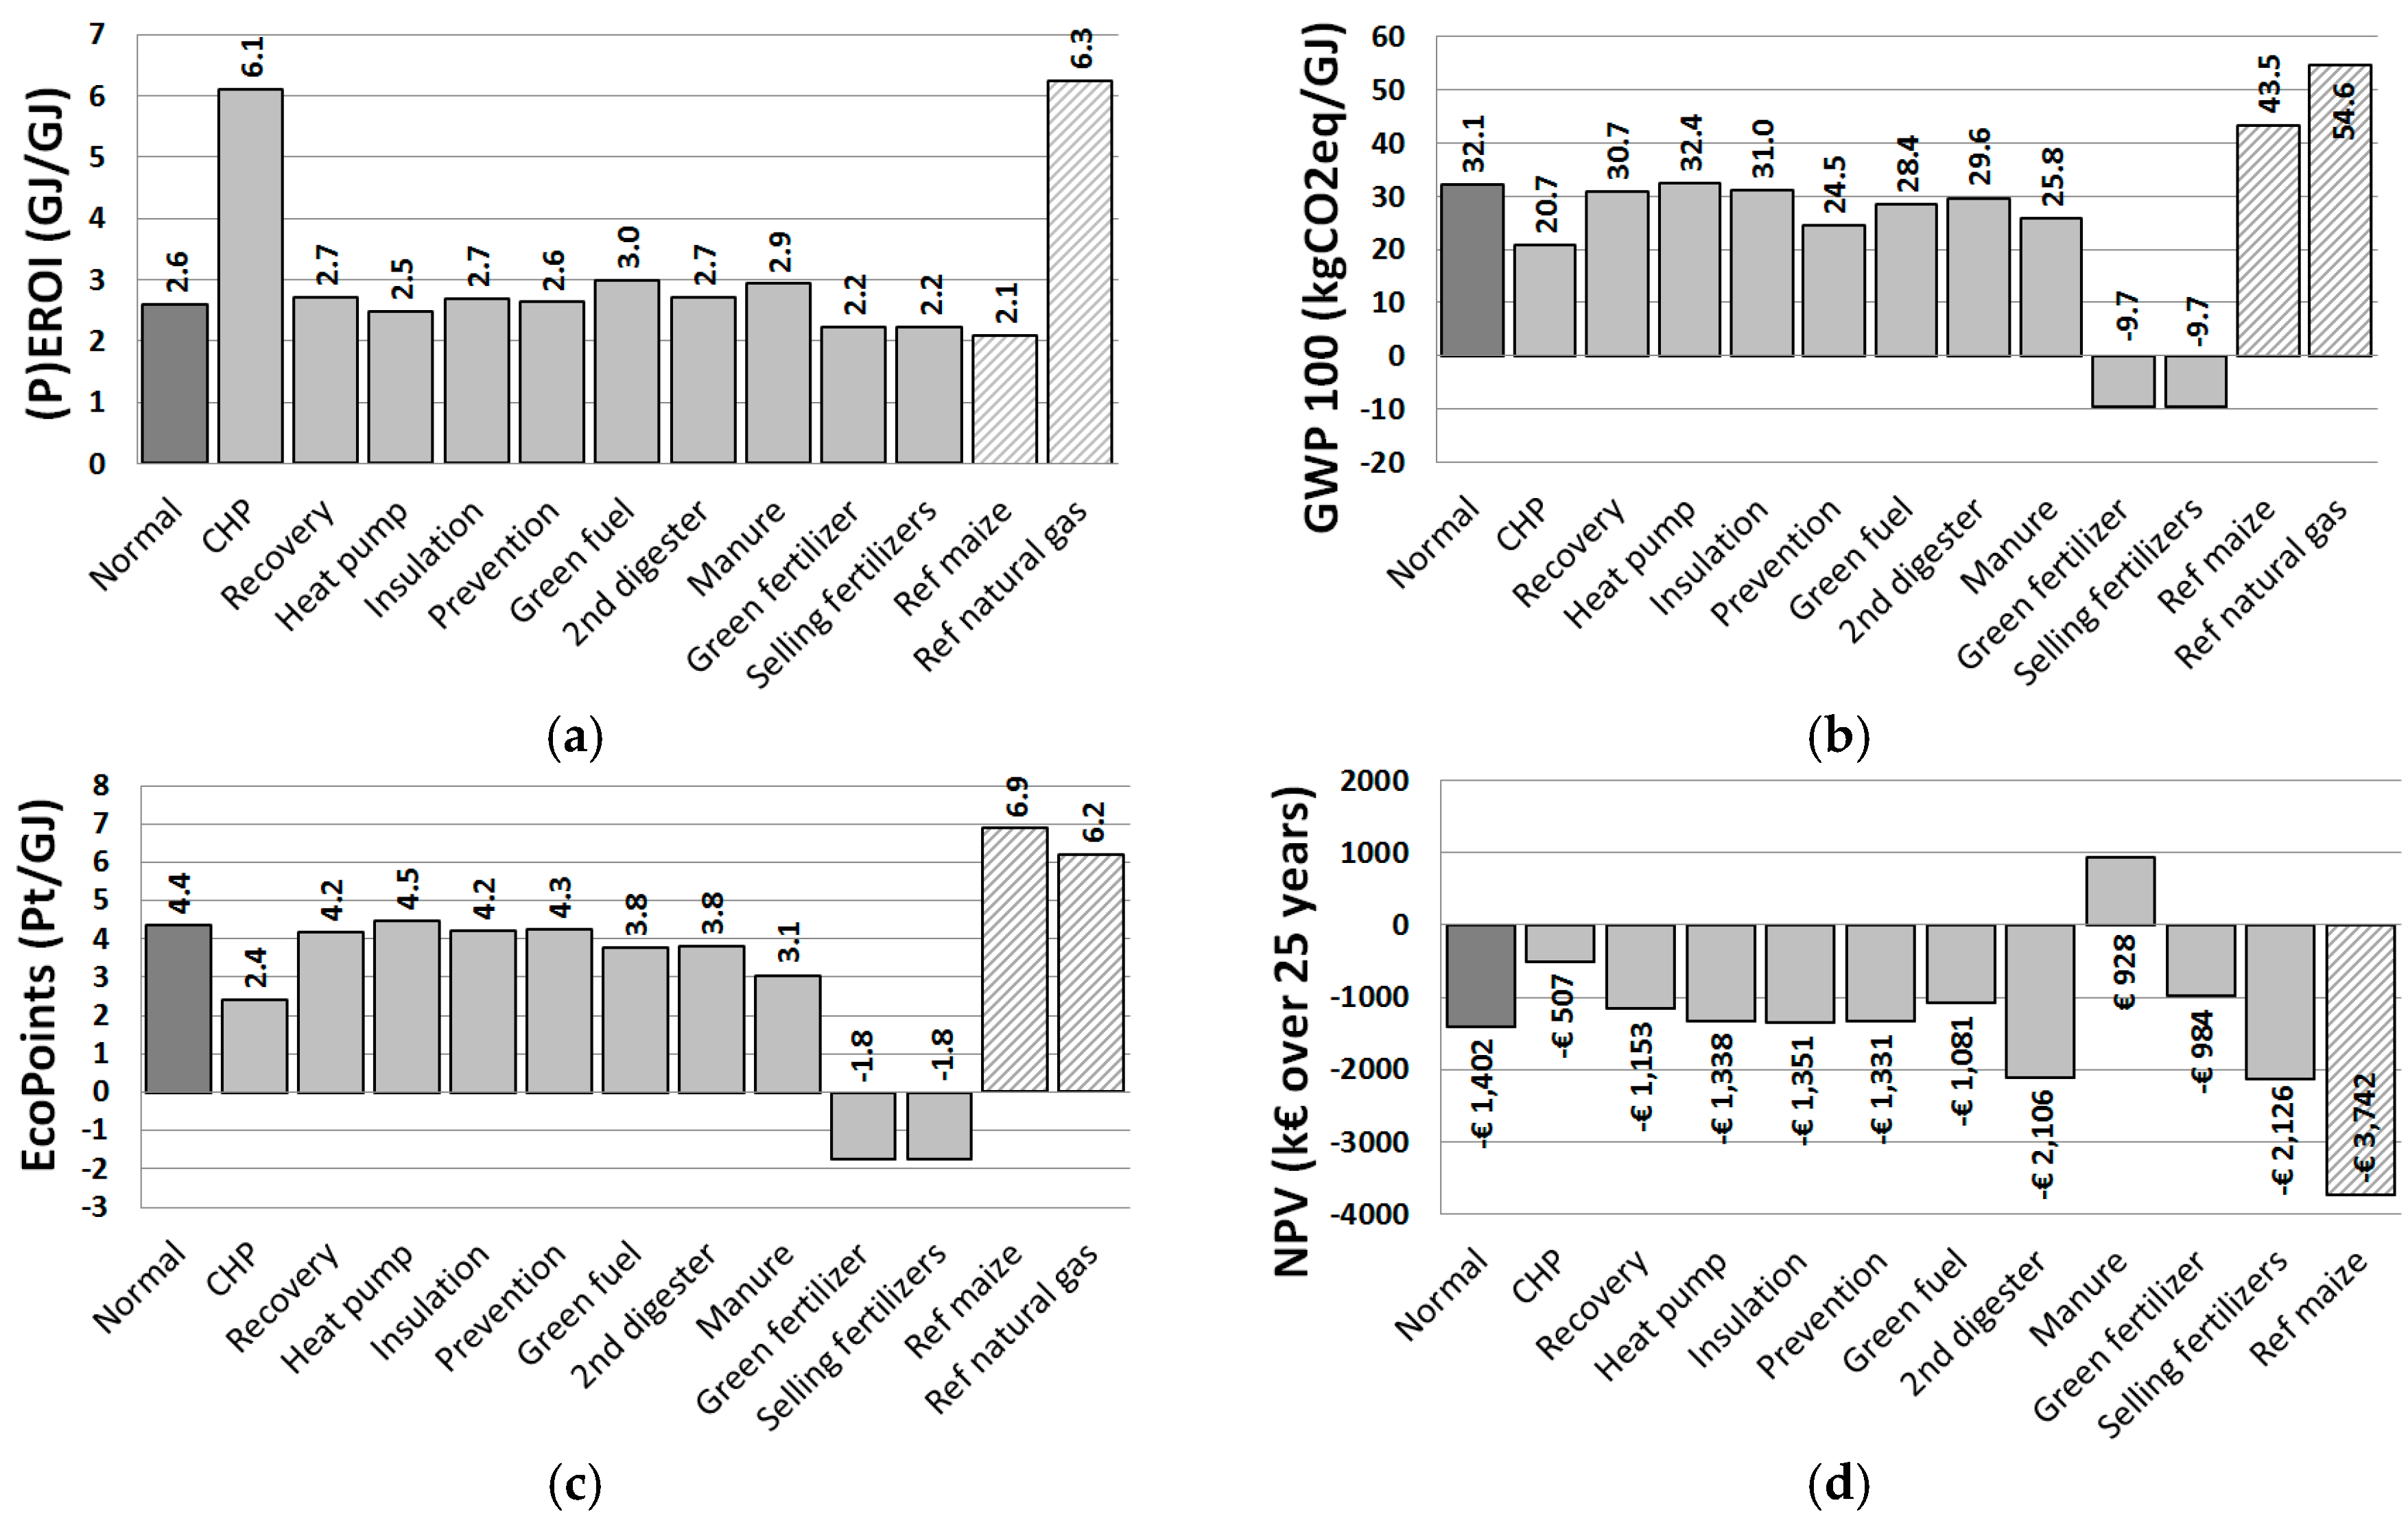
| # CHP # Fertilizer # 2nd Digester | The best individual improvement options per SI-Indicator are indicated as a reference scenario for comparison with the circular symbiotic scenarios. The best options are: for (P)EROI the CHP unit; for carbon footprint and Environmental impact the organic fertilizer production option; and for NPV the 2nd digester with added manure option. Full description of individual improvement scenarios can be found in Appendix A. |
| Ref gas | This fossil reference scenario is based on Groningen natural gas and includes: the production, needed infrastructure for transport and distribution, and combustion of the gas when used [31]. |
| Ref maize | Within the maize reference scenario 50% maize and 50% manure is used as feedstock for green gas production using the same AD system as explained in Section 3, (Table 1). The maize (silage) used as feedstock is specially cultivated for use in the AD system. Therefore, agricultural fieldwork and the use of fossil fertilizers and pesticides during cultivation are incorporated [17]. The maize is transported over a distance of 50 km [10]. Within this scenario, the carbon footprint and environmental impact from normal manure management is also mitigated. |
| Unit | Dairy Farms | Agricultural Farms | Natural Areas | Total | Source | |
|---|---|---|---|---|---|---|
| Average farms needed | farms | 5.4 | 6.9 | 12.3 | ||
| Agricultural land size | ha | 270 a | 276 b | 275 c | 821 | [17,50] |
| Diesel use | L/a | 35,100 | 65,688 | 100,788 | [50] | |
| Electricity use | kWh/a | 253,800 | 151,524 | 405,324 | [50] | |
| Natural gas use | Nm3/a | 8640 | 2898 | 11,538 | [50] | |
| Nitrate cap d | Kg/a | 71,550 | 46,920 | 118,470 | [50] | |
| Phosphate cap d | Kg/a | 25,650 | 17,940 | 43,590 | [50] | |
| Potassium cap d | Kg/a | 60,750 | 62,100 | 122,850 | [50] |
| Affiliation | Description of the Sustainable Farming Cooperation Cases |
|---|---|
| REF (Case) | The reference cooperation (REF): In this case, based on current average farming activities in the Netherlands, the cooperation will import all of their energy and most of their fossil fertilizers. The dairy farms within the cooperation will use their own manure as fertilizer on their fields, whereas agricultural farms will use fossil fertilizer for all their nutrient demands. Additionally, fuel for the machinery, electricity, and natural gas are imported to supply the energy needs of the cooperation (Table 4). The environmental impacts of fertilizer, fuel, electricity, and natural gas production are included. Inflation and increase of prices for energy and fertilizers are taken into account for the upcoming 25 years (Appendix B). |
| AD (Case) | The AD cooperation (AD): Within this case, the cooperation will operate a circular symbiotic AD system, producing renewable energy and fertilizer from local bio-waste. Dairy farmers within the cooperation use the digestate from the AD system as fertilizer on their fields. Excess digestate is processed into organic fertilizers and used by agricultural farms in the cooperation. Additionally, the fuel for the machinery, electricity, and natural gas is supplied by the AD system (Table 4). The remaining energy or fertilizer requirements are imported. The overall cost of the AD system is based on the NPV calculation (Section 3). Within this case 23% of the total digestate output is upgraded into organic fertilizer to replace fossil fertilizer. The income from selling the remaining green gas is incorporated in the NPV; however, mitigation of carbon footprint and environmental impact by replacing green gas with natural gas is not included, as it does not lower the impacts of farming practices itself. |
| AD + M (Case) | The AD cooperation using surplus manure (AD + M): The AD + M case is similar to the AD case except that within this case a surplus of 10,000 Mg of manure from surrounding dairy, pig, or chicken farms is available for the production of additional energy and green fertilizer. In some parts of the Netherlands there is a surplus of manure available, often linked to farms with no agricultural land (e.g., pig, chicken farms). For the additional manure feedstock mixture the properties of cow manure are assumed (Table 1). Within this scenario around 50% of the total digestate output is available for upgrading to organic fertilizer, which can be used to replace fossil fertilizer. Excess fertilizer is sold on the market for market prices (Appendix B). |
| Total Land (ha) | Average Farm (ha) | Amount of Farm | Farms Per Cooperation | Amount of Cooperations | AD Cooperations | AD + M Cooperations | Source | |
|---|---|---|---|---|---|---|---|---|
| Dairy farming | 956,000 | 50 | 19,120 | 5.4 | 3541 | [57] | ||
| Agricultural farming | 995,756 | 40 | 24,894 | 6.9 | 3608 | [57] | ||
| Average | 3574 | 2680 | 894 |
| SI-Indicator | AD | AD + M | Unit | Source |
|---|---|---|---|---|
| Energy a | 13.6 | 17.5 | TJ/a | [58,59] |
| Carbon footprint a | 642 | 826 | MgCO2eq/a | [58,59] |
| Impact a | 73 | 94 | kPt/a | [58,59] |
| Reference Year 2015 a | Reference Year 1990 b | |||
|---|---|---|---|---|
| AD | 25% AD + M c | AD | 25% AD + M c | |
| Total emission savings | 33.4% | 37.5% | 27.1% | 30.4% |
| AD cooperative | 24.8% | 26.6% | 20.1% | 21.6% |
| Sold green gas | 8.6% | 10.9% | 7.0% | 8.8% |
| Total fossil fuel saved | 79.8% | 98.6% | 87.3% | 104.9% |
| AD cooperative | 43.5% | 52.7% | 47.0% | 55.6% |
| Sold green gas | 36.3% | 45.9% | 40.3% | 49.3% |
© 2017 by the authors. Licensee MDPI, Basel, Switzerland. This article is an open access article distributed under the terms and conditions of the Creative Commons Attribution (CC BY) license (http://creativecommons.org/licenses/by/4.0/).
Share and Cite
Pierie, F.; Dsouza, A.; Van Someren, C.E.J.; Benders, R.M.J.; Van Gemert, W.J.T.; Moll, H.C. Improving the Sustainability of Farming Practices through the Use of a Symbiotic Approach for Anaerobic Digestion and Digestate Processing. Resources 2017, 6, 50. https://doi.org/10.3390/resources6040050
Pierie F, Dsouza A, Van Someren CEJ, Benders RMJ, Van Gemert WJT, Moll HC. Improving the Sustainability of Farming Practices through the Use of a Symbiotic Approach for Anaerobic Digestion and Digestate Processing. Resources. 2017; 6(4):50. https://doi.org/10.3390/resources6040050
Chicago/Turabian StylePierie, Frank, Austin Dsouza, Christian E. J. Van Someren, René M. J. Benders, Wim J. Th. Van Gemert, and Henri C. Moll. 2017. "Improving the Sustainability of Farming Practices through the Use of a Symbiotic Approach for Anaerobic Digestion and Digestate Processing" Resources 6, no. 4: 50. https://doi.org/10.3390/resources6040050