Is Sustainable Intensification Pro-Poor? Evidence from Small-Scale Farmers in Rural Tanzania


1
Institute for Environmental Economics and World Trade, Leibniz Universität Hannover, Königsworther Platz 1, 30167 Hannover, Germany
2
Institute of Environmental Policy and Resource Economics, Straubing Centre of Science, Petersgasse 18, 94315 Straubing, Germany
*
Author to whom correspondence should be addressed.
Resources 2017, 6(3), 47; https://doi.org/10.3390/resources6030047
Submission received: 15 July 2017
/
Revised: 16 August 2017
/
Accepted: 11 September 2017
/
Published: 15 September 2017
(This article belongs to the Special Issue Natural Resource Management and Sustainable Development Goals)
Abstract
:The transition of farming systems to higher levels of productivity without overusing natural resources is of rising interest especially in African countries, where population growth has often been larger than past productivity increases. This paper aims to contribute to the debate on whether environmentally friendly agricultural practices are compatible with economic interests. In the context of small-scale farm households in Tanzania, the analysis focuses on Conservation Agriculture (CA) at different levels of agricultural output, as CA is a promising toolbox for sustainable intensification. The results are based on a household survey conducted in 2014 with 900 randomly selected small-scale farmers in rural Tanzania, i.e., in semi-arid Dodoma and in semi-humid Morogoro region. We find that mulching is most frequently applied, followed by crop rotation, fallowing, intercropping and tree planting. Logit regressions show that CA adoption is influenced by socio-economic factors, farm characteristics and the regional context. Quantile regressions explain different levels of agricultural output through variables related to the extent of using CA. They indicate that marginalized farmers have the strongest crop income effect from an increased use of mulching. With increasing levels of agricultural output, the use of mulching remains beneficial for farmers, but the effect appears less pronounced.
1. Introduction
Most rural people in Sub-Saharan Africa (SSA) work in the agricultural sector and feed their families through their own production and additional income via sale of produce. On the one hand, a rising population especially in developing countries demands an increase in agricultural output, but in various African countries, population growth has been larger than past productivity increases [1,2]. The population in Tanzania increased from 21 million in 1984 to 28 million in 1994 and to 53 million in 2015 [3]. With a predicted annual growth rate of 2.6% per year, the population in 2035 is estimated to reach 100 million inhabitants [3]. On the other hand, land use change in favor of agricultural use, grazing lands and settlement areas results in nutrient mining, soil erosion and soil degradation [4]. Another reason for increased soil erosion is related to Tanzania’s Ujamaa “villagization” campaign of 1973–1976, which successfully aimed at the relocation of about five million rural peasants into concentrated settlements. Their former homesteads were widely dispersed, but facilitated long and regular fallow periods to replenish nutrients taken up by crops. With more concentrated settlements, an increasing population and less available new land, the traditional practice of leaving land fallow becomes less feasible [5,6]. Intensifying agricultural production without making suitable amendments to replenish lost nutrients has led to widespread land degradation. Losses between 2001 and 2009 due to land degradation based on the change of land towards agricultural use add up to 13.7% of Gross Domestic Product (GDP) in 2007 in Tanzania [4]. This shows even more the need for sustainable intensification rather than extensification via land use and cover change.
Conservation agriculture (CA) is often described as a key toolbox in the transition of farming systems to higher levels of productivity without overusing natural resources [7,8]. It is an approach within the concept of sustainable intensification, which aims at producing more output from the same area of land while reducing the negative environmental impacts and at the same time increasing contributions to natural capital and the flow of environmental services [2]. CA is based on three pillars that include (a) a minimum to zero soil disturbance, (b) a permanent soil cover via crop residue retention, cover crops or agroforestry tree species, and (c) crop diversification through crop rotations and/or intercropping [7,9].
Various benefits of CA include its potential to enhance soil fertility and counter soil degradation through increasing the share of soil organic matter and improving the soil’s ability to conserve water [7,8,10]. In practicing CA, the farmer can achieve a higher and more stable yield and income from their farm compared to conventional agriculture in the long run [7]. For the case of the Mwangaza CA farmer field school in Arusha, Tanzania, the application of CA over the duration of two years resulted in increased crop yields and by selling surplus crops it led to an increased income for the farm household [11]. It also showed the positive social outcome in terms of reduced labor requirement, which freed up time for family members to engage in other activities, for example self-employment to diversify income. However, the shift towards CA had also negative outcomes or conflict potential, as those casual laborers usually hired for plowing, planting, weeding, etc. were not hired anymore. Another usual practice of farmers participating in the field school includes the farmers’ use of crop residues as animal fodder, either stored for their own livestock or sold to pastoralists who usually wait for the end of the harvesting activities to let their herd graze on the farmers’ land [11]. This leads to a conflicting use, if the farmer intends to apply mulch on their plot. Mulching is usually done by leaving crop residues on the plot after harvest and thus to not leave the soil bare. Most common residues used by farmers in the sample derive from the usual crops grown (maize, millet, sorghum, sesame).
Despite the potential benefits mentioned and efforts to promote CA practices, the pick-up rate remains low especially in Tanzania, where soil fertility depletion and erosion remains a big problem [5,6]. Causes are mostly man-made by common practices of burning crop residues after harvest or selling them to pastoralists or allowing pastoralists to let their livestock graze on their plot after harvest [11]. These practices leave the soil bare and vulnerable towards erosion by wind or water. In combination with low use of fertilizer it builds no basis for a stable outcome in agricultural production [11].
The aim of this paper is to contribute to the debate on whether CA as environmentally friendly agricultural practice can have a positive crop income effect for small-scale farmers in SSA, as the suitability of CA systems for smallholder farmers remains a discussion point of ongoing research. Despite its success stories in other regional contexts such as Latin America, a yield increase or a more stable yield from applying conservation agriculture is not always quantifiable in various studies in SSA countries, for example in Lesotho, Kenya, Tanzania and Zimbabwe [12,13]. Against the background of population pressure and the related higher demand for agricultural output, it is important to analyze the economic viability of CA practices especially for small-scale farmers. Most studies analyzed drivers and discouraging factors for adopting CA. Former studies have also looked at divergent take-up rates for better versus less resourced farmers, but not at the differences of the benefit that farmers might gain from CA in terms of crop income. Kassie et al. [14] stress the importance of considering potential substitute or complimentary effects between different sustainable agricultural practices. This is of special relevance in the case of Tanzania, where the pick-up of the whole CA package is relatively low.
In the context of small-scale farm households in rural Tanzania, the analysis focuses on measures of CA at different levels of intensification. The farmers’ most frequently used CA measures are identified first including their extent of use on their farms, combinations of measures and their distribution in two varying agro-climatic regions and on differing levels of intensification. In a next step, factors associated with the adoption of these environmentally friendly measures are presented. Finally, it is analyzed what are the effects on agricultural income of using these measures for low versus higher intensified farm households in the sample.
2. Data and Methodology
Study Site and Survey Setup
A survey of 900 small-scale farmers was carried out in two regions of Tanzania in 2014. One region, Dodoma, is characterized by a semi-arid climate (350–500 mm of annual precipitation) with flat plains and small hills.
Its food system is dominated by sorghum and millet besides maize (Table 1) in combination with widespread keeping of livestock, especially cattle and goats (Table 2).
The second region, Morogoro, is semi-humid (600–800 mm per year) with flat plains, highlands and dry alluvial valleys. This region is more diverse than Dodoma with a food system based on maize, sorghum, legumes, rice and horticultural products, only partly in combination with livestock (Table 1 and Table 2). Dodoma is one of the most drought-affected and food-insecure regions in Tanzania, whereas Morogoro comprises both food-secure and food-insecure areas.
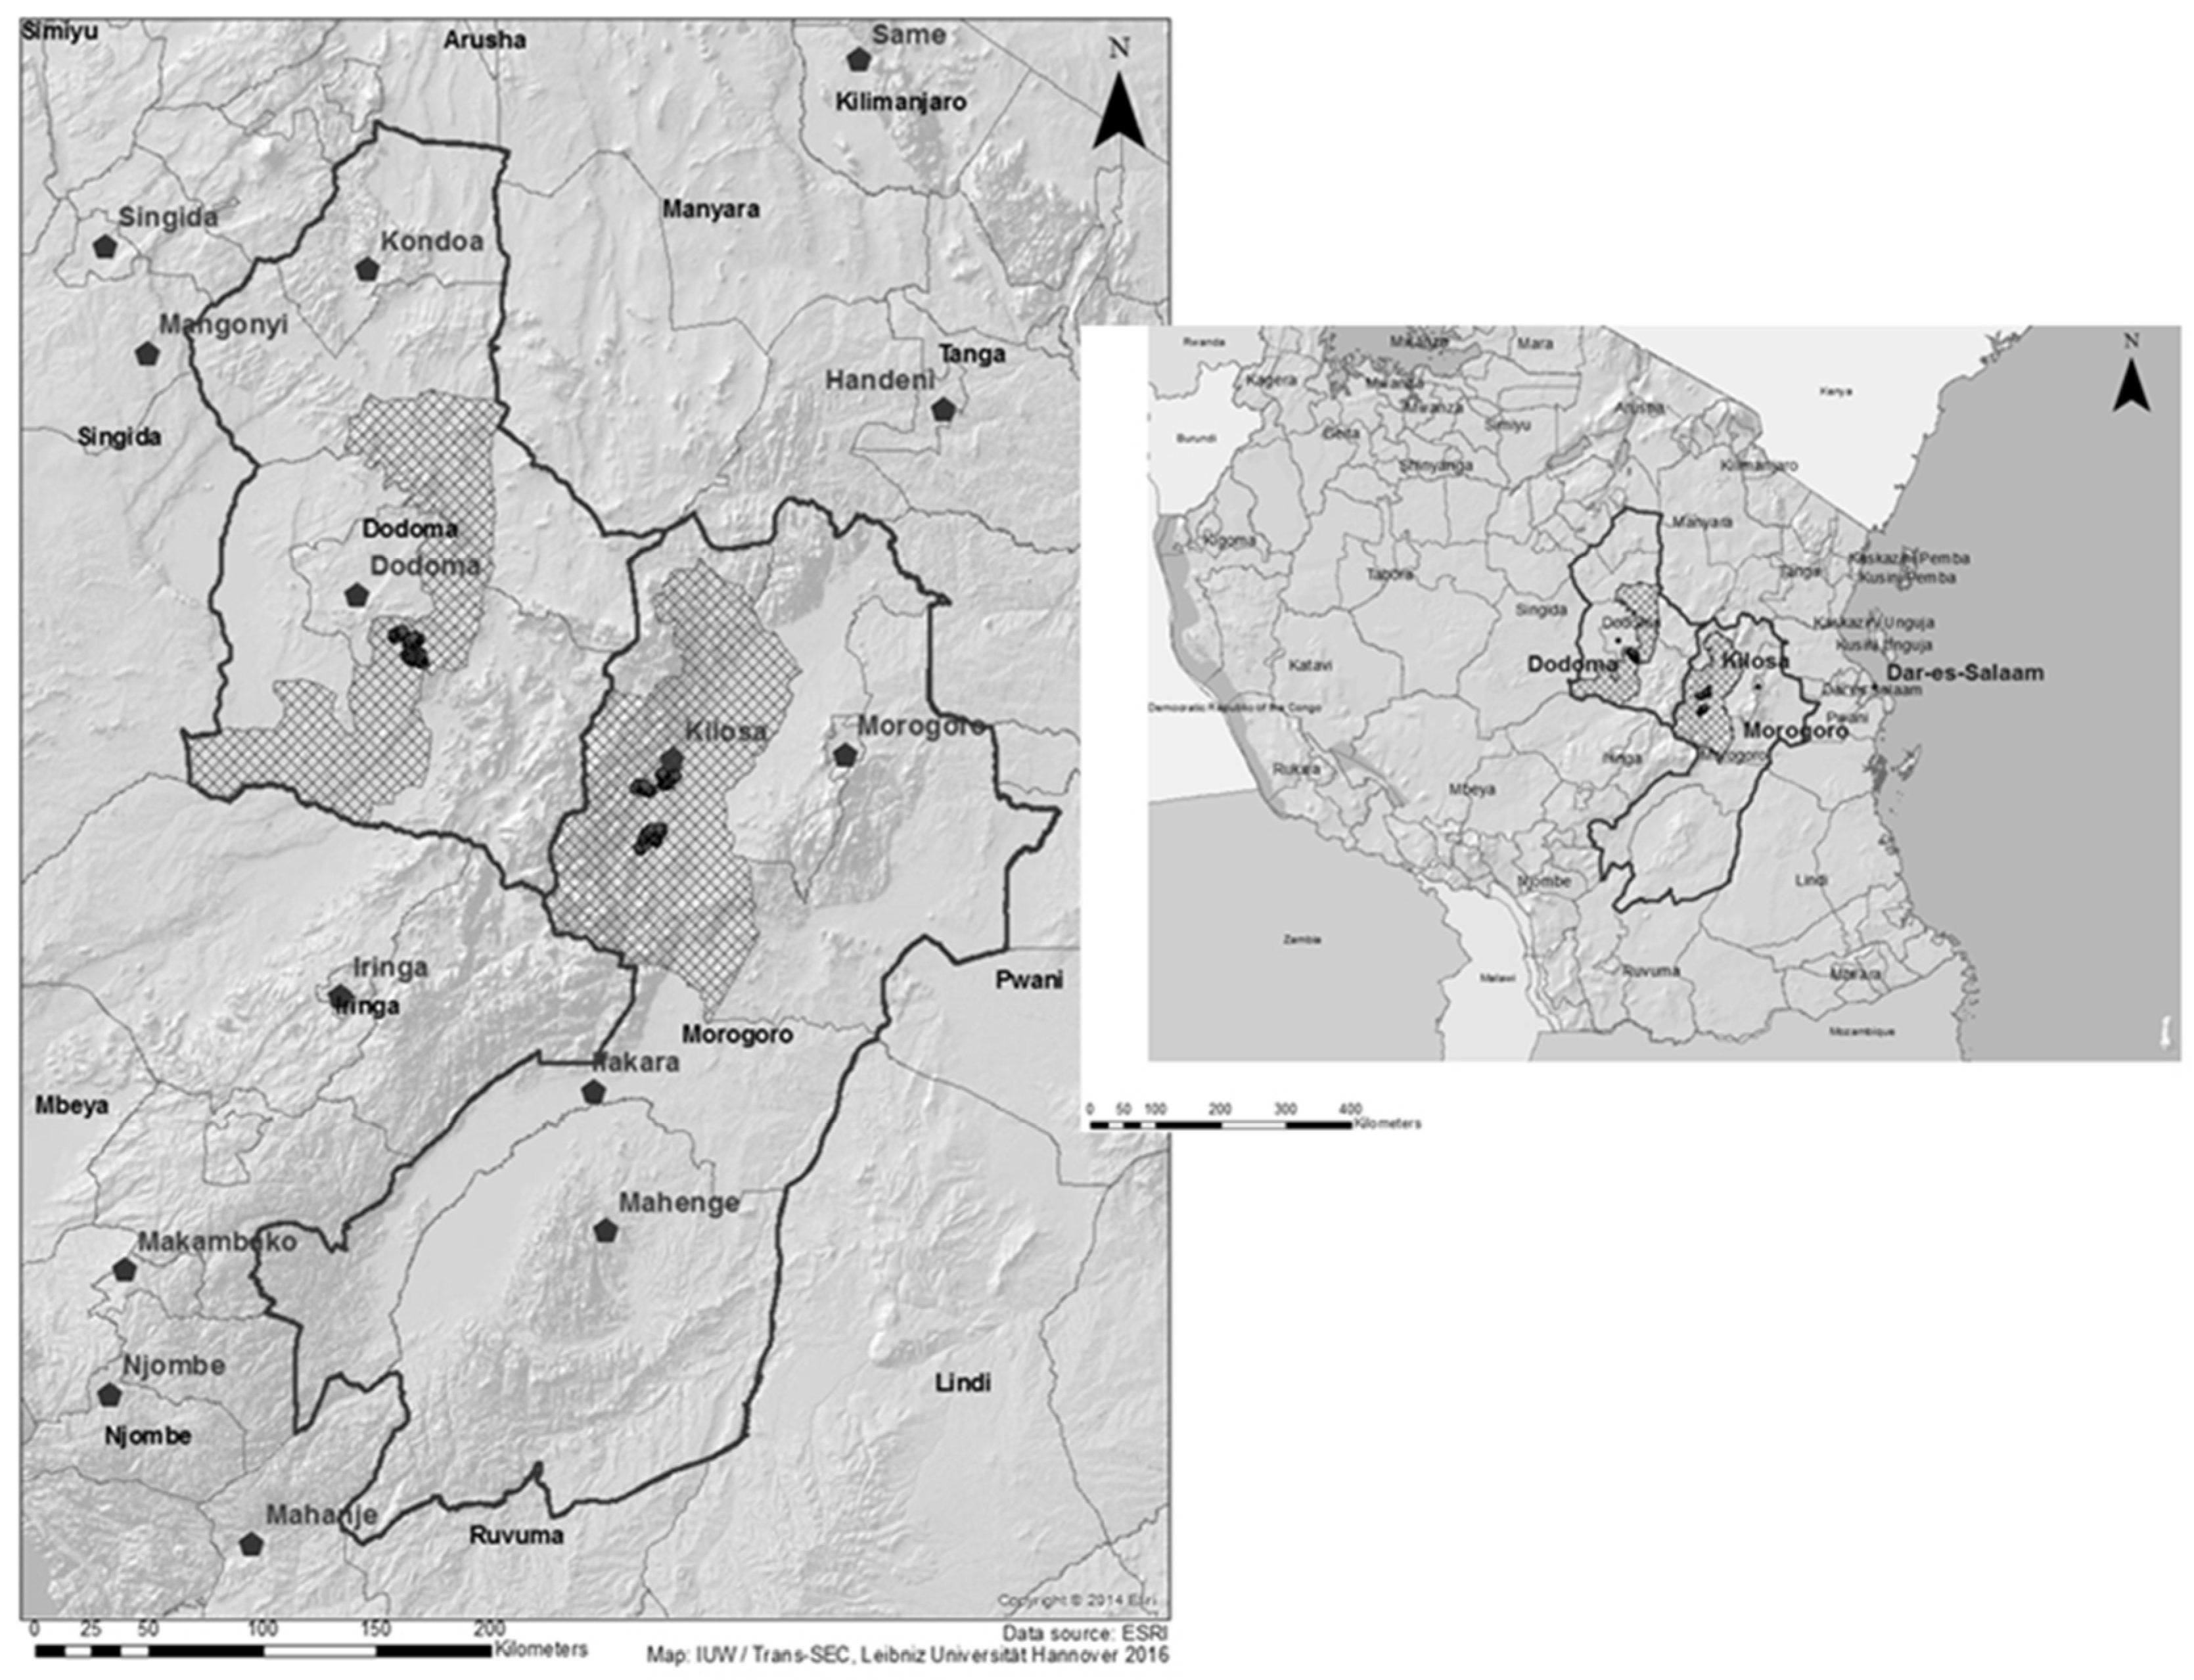
The selection of households for the survey was based on a two-step random sampling procedure. First, study sites were selected within these two regions based on agro-ecological conditions and covering the majority of farming systems in Tanzania; i.e., Kilosa district in Morogoro and Chamwino district in Dodoma (dashed area in Figure 1). Based on criteria related to comparable and differing agro-ecological and socio-economic conditions, three study villages were selected in each study site; Changarawe, Nyali and Ilakala in Kilosa, and Ilolo, Ndebwe and Idifu in Chamwino. Then 150 farming households in each of the six villages were randomly selected from household lists, in proportion to the size of a sub-village.
A questionnaire (the Trans-SEC Household Survey Questionnaire was part of the baseline study in Trans-SEC project) was administered to the 150 farmers in each village. The questionnaire was designed to measure the status of farmers in these villages in terms of their income, consumption and food security indicators for the year 2013 as the reference period. Besides basic socio-demographic information, the questionnaire covered expenditures and income generating activities such as agricultural production, off-farm wage employment, self-employment, natural resource extraction, livestock keeping, etc. The total annual net income per household and its components, including farmer’s total annual net value from crop production, were calculated in Purchasing Power Parity (PPP) USD with the reference year of 2010.
Farmers have also been asked to state if and what kind of soil conservation measure they are applying predominantly on each plot. This included fertilizer (organic and mineral), fallow, crop rotation, intercropping, tree planting, terracing, besides others and an option for any further specification. This information on plot level was transformed into CA dummies for information on household level. To provide additional information on the extent of application, shares of CA application on household level were generated using the plot size (in hectare), where a particular CA measure is applied, in relation to the overall land size (in hectare) under cultivation per household.
Risk attitude was measured on an 11-point Likert scale ranging from “0 = unwilling to take risks” to “10 = fully prepared to take risks” [16]. The rate of time preference is defined as the intertemporal marginal rate of substitution and aims at revealing whether a household or an individual gives more value to consumption now relative to consumption in the future [17].
The assets including household items, agricultural tools and transport means were asked for each household and used to calculate an asset score. The asset score per household was derived by assigning to each item in the list of assets named by the households a weight equal to the reciprocal of the proportion of the study households, who owned one or more of that item, then multiplying that weight by the number of units of assets owned by the household and summing the product over all possible assets [18].
3. Methodology
Descriptive analysis is used to identify the frequency and combinations of sustainable agricultural measures in the context of CA.
Logistic regressions are applied to identify drivers and hindering factors for the adoption of each CA measure used by the farmers, i.e., what are factors associated with applying mulch on their farm. These binary regressions are applied given the dichotomous nature of the dependent variables [14,19]. They describe with the probability p, if adoption has taken place (y = 1), or the alternative to not adopt (y = 0) with the probability of 1-p [20]. Therefore motivating and discouraging factors for using sustainable agricultural practices are included in the analysis based on a literature review (see Table 3). The use of other CA measures is also included in the set of covariates to control for the substitutive or complementary use of CA measures, as most farmers only apply one or two CA measures, if any.
Socio-economic characteristics comprise age, education, gender, risk attitude and time preference of the household head. Farm and plot specific characteristics include land size in hectare of the whole farm, the number of plots for cultivation, livestock ownership, a control for slopy plots and the distance to the village center. Manure as a farm-available soil amendment is included. A district dummy accounts for agro-ecological differences between the two study areas. Land tenure is accounted for as a dummy that is one, if the household owns the land individually, and zero, if the household owns the land only within the clan’s approval or does not own it at all. Diversification of income and access to financial capital is represented by dummies for off-farm wage employment or self-employment respectively and by a dummy if a member of the household is member in a micro-credit institution. Differences in the wealth status of the household are controlled for by the asset score.
In order to evaluate the effect of sustainable measures at different levels of agricultural output and control for socio-economic and farm characteristics, a quantile regression is employed. The value from crop production per hectare (log of gross agricultural income) is used as an indicator for agricultural output.
Standard linear regression techniques based on Ordinary Least Squares (OLS) summarize the average relationship between a set of independent variables and the dependent variable based on the conditional mean function [20]:
This approach can give only a partial insight on the relationship. Within this analysis, the aim is to describe the relationship at different points in the conditional distribution of y using the quantile regression approach. Similar to the conditional mean function of linear regression, the relationship between the independent variables and the dependent variable can be described based on the conditional median function
with the median as the 50th percentile, or quantile q, of the empirical distribution [20]. The quantile q divides the data into proportions q below and 1−q above. Quantile regression can be more robust compared to OLS if errors are not normally distributed or in the presence of outliers. It also provides a richer characterization of the distribution of y instead of only describing the impact on the conditional mean. Qreg2 is a Stata module by Machado, Parente and Silva [29] to perform quantile regression based on robust and clustered standard errors when heteroscedasticity is present. Variables are excluded in case of high correlation or variance inflation factors above 2 to control for multicollinearity.
4. Results
Farming practices in Tanzania are based on the concept that land should be prevented from degenerating while using it for agricultural purposes. Fallowing and using organic matter are traditional practices to maintain or recuperate soil fertility [6]. Descriptives discover which soil fertility or agro-ecological diversity enhancing measures are being used by the farmers in the two study regions (Table 4).
Mulching, i.e., leaving crop residues on the field after harvest, is the most frequently applied measure (n = 202), with a larger share of farmers in Kilosa (31.89%) than in Dodoma (14.49%). Other frequent practices applied are crop rotation (n = 163), fallowing (n = 137), intercropping (n = 147) and tree planting (n = 129) (Very few reported to apply contouring (n = 20), terracing (n = 15) and grass stripes (n = 13) which were therefore disregarded in the analysis, although they are considered as soil-conserving measures.).
In the Morogoro region mulching and leaving land fallow is more prominently applied, whereas intercropping and tree planting is more common in Dodoma region. About two thirds of farmers reported to only apply one (45.6%) or two (18.1%) of the CA measures on their farm plot(s), whereas about one third of farmers (32%) reported to apply none of them (Table 5).
Based on the whole farm perspective, mulching is frequently considered for use as a soil-conserving practice on farms that also apply fallowing (n = 40), intercropping (n = 18), crop rotation (n = 30) or tree planting (n = 34) on one of their plots (Table 6). If fallow is the chosen practice to increase soil fertility on one of the farmer’s plots, then it is most frequently combined with intercropping, crop rotation or tree planting on one of the other plots of the farm. However, most farmers do not apply more than one CA practice on their farm, so the frequencies of combinations are rather low.
The use of crop residues as animal fodder is a common practice in Tanzania, but looking at the distribution per quantile of agricultural income per hectare indicates a decreasing trend for this practice with increasing levels of agricultural intensification (Table 7). This goes along with the positive trend of using mulch on their plots with increasing levels of intensification. Crop residues are mainly based on straw of maize (30%), sesame (20%), millet and sorghum (14%). Other residues less frequently used are from groundnuts, rice, bambara nuts and cowpeas or pigeonpeas. Tree planting becomes less frequent with increasing levels of intensification.
The use of chemical inputs is rather low, especially for fungicides and herbicides with less than 10% for the most agriculturally intensified farmers (Q4). Pesticides are more frequently used by more intensified farmers (Q4) with almost 40%, whereas only about 3% of the least intensified farmers (Q1) applied pesticides. Manure appears to be an important input for the less intensified farmers (Q1 = 17.5%) with a decreasing use for more intensified ones (Q4 = 5.6%). Mineral fertilizer, however, does not play a significant role in all quantiles with the maximum use by only eight farmers in Q4.
With increasing levels of intensification, the use of hired labor increases for agricultural activities such as land preparation, planting, hand weeding or harvesting (Table 8). In the higher quantiles, there are more households hiring labor with an increased average spending per household compared to the lower quantiles. Spending per household is on average higher for land preparation and hand weeding activities.
The results from logistic regressions indicate that with increasing age, farmers become less likely to apply mulch on their plot(s) (Table 9). If the farm is located in the semi-arid Dodoma region, then the farmer appears strongly less likely to apply mulch. An increasing number of plots per household is positively correlated to mulching. If the farmer or a household member is involved in any form of self-employment, then the household is less likely to apply mulching. An increasing rate of time preference is positively associated with mulching, as well as an increasing distance to the village center. If the farmer is using crop residues partly for animal feed, then the likelihood of the same farmer to apply mulch on one of his or her plots decreases. Increasing the share of the farmer’s land for crop rotation or intercropping appears to negatively influence the likelihood to apply mulch, representing rather substitute practices.
The likelihood of the farmer to plant trees as a soil-conserving practice increases, if one of the farm’s plots is located on a slope. Self-employment is another positively related factor. Planting trees appears to be more attractive by smaller and more risk-averse households. Land ownership and being closer to the village center also increases the likelihood to plant trees as a soil-conserving practice. Applying mulch on a larger share of land per household increases the likelihood to plant trees, whereas increasing the share of intercropping decreases it.
Leaving land fallow is more likely with an increasing number of plots. If the farm is located in the semi-arid region Dodoma, the farmer is slightly less likely to leave land fallow. Using manure or increasing the share of land under crop rotation is also negatively related to the farmer’s choice for fallow land. A negative factor is also an increased rate of time preference. The household being in a microcredit group appears to ease the choice for fallow land.
Applying intercropping appears more likely, if the household head is younger and the farm is located closer to the village center. Farmers located in Dodoma appear more likely to apply intercropping as a conservation measure. The farm household being engaged in self-employment is less likely to adopt this measure. Increasing the application of any other CA measure appears to decrease the use of intercropping.
Crop rotation appears more likely with an increasing number of plots per farm. A higher risk-taking attitude of the farmer appears also conducive for it. The likelihood decreases, if the household applies manure on their plots. Increasing the application of any other CA measure appears to decrease the use of crop rotation.
In the presence of heteroscedasticity, regression results from OLS with robust standard errors are preferred over standard OLS for interpretation (Table 10). To give a differentiated picture on the outcome at different levels of agricultural output, not just the mean, quantile regressions are presented with heteroscedastic robust standard errors (Table 10). The results show that an increase in the share of land under mulching is positively correlated with income from crop production. Being a female household head is strongly associated with a lower income from crop production. A negative factor is the location of the farm in the semi-arid region Dodoma or if at least part of the farm is located on a slope. An increasing land size per farm is also negatively affecting crop income per hectare. The farm household’s involvement in off-farm wage employment appears to be counterproductive for a higher income as well. Conducive to crop income are households with a higher willingness to take risks and households with an increased number of plots per farm and land ownership.
Results from the quantile regression show a more differentiated picture of the coefficients than the OLS (Table 10). The income from crop production per ha is still positively affected through applying mulch. The other measures mentioned by the farmers to be applied for soil conservation do not reveal a significant effect on income from crop production. The positive effect from mulching on agricultural income appears to be stronger for lower quantiles of the sample. The income gap for female farmers compared to male farmers becomes smaller for more intensified farm households. The Dodoma effect is very strong for all levels of crop income. A higher risk attitude appears to have a positive effect especially for higher levels of intensification (75th quantile). The application of manure on the plots is positively associated with crop income only for the more intensified farms and is not influencing crop income in the 25th quantile, although descriptive results showed a more frequent use by less intensified farmers. With an increasing level of agricultural intensification, the effect of an increased land size remains significant and negative. Income from crop production is negatively associated with off-farm wage employment. For the agriculturally more intensified farms results indicate a negative relationship towards membership of a household member in a micro-credit institution. Land ownership plays an important role for farmers in general, but the least intensified farms (25th quantile) appear to benefit the most in terms of crop income.
5. Discussion
Descriptive results confirm that the uptake of already known or promoted soil and water conserving practices is relatively low within our study regions Dodoma and Morogoro; minimal tillage does not play a role. Mulching is the most frequently mentioned farm practice and helps to maintain a year round organic cover and thus can conserve the soil’s water content [7].
The likelihood of applying each conservation measure is decreasing, if the farmer increases the use of another measure, which underlines the farmers’ substitutive manner of using these measures or the low uptake in general. Age plays a role for mulching and intercropping especially; indicating on the one hand that older farmers might be more risk-averse or less progressive in the uptake of innovative farming practices [14]. On the other hand it can be a proxy for the years the farm already settled on the same land, i.e., inducing an increased time of nutrient mining and thus increased requirement for investments into soil conservation [21]. A higher rate of time preference is positively related to mulching and indicates that the farmer is generally giving consumption now a higher value than future consumption [17]. This is in contrast with leaving land fallow, which is more likely done by farmers, if they give future consumption a higher meaning. This might relate to fallow as an investment in future soil improvement, whereas mulching can lead to already to short-term improvements in yield [23].
The likelihood of planting trees as a soil-conserving practice is negatively correlated with a higher risk tolerance, indicating that risk-averse farmers are more likely to plant trees given their various purposes [24]. Besides maintaining or increasing soil fertility and retaining moisture, they can be planted within the field (in intercropping) or around the field as a protection from wind and sun, and serve as sources of fuel, timber or fiber and food [28,30,31]. Smaller households are more inclined to plant trees as maintaining trees on the plot does not demand for much labor compared to other CA measures that require some action every season or every year. A smaller distance to the village center is related to the better provision of information by extension service and village head office and appears to positively influence tree planting and intercropping [25]. Mulching is much less likely, if farm households are located in Dodoma region, where “free cattle grazing” on plots after harvest is a common practice [11,32]. The land size, owning livestock or the asset score as representatives of physical capital did not have a significant effect on the likelihood of mulching [5,14,18].
The value of agricultural output per hectare is significantly increasing, if the farmer applies mulching on at least one plot of his or her land. The opportunity cost of crop residues for feed rather than for mulch could discourage especially the poorer households to apply mulch on their plots [23]. However, the results from logistic regression showed no significant influence from having more physical capital. Even plots of poorer farmers that have few or no livestock could end up being grazed or prefer to sell their residues to livestock keepers, relating rather to local institutions on how to deal with crop residues [33]. It appears that with increasing levels of agricultural intensification the positive effect from mulching remains significant, but the benefit from it decreases slightly. On the one hand, this could be due to the positive effect of an increased use of other agricultural inputs such as hired labor and mineral fertilizer, pesticides or improved seeds [33]. On the other hand, Erenstein et al. [34] concluded in their analysis that farmers living in rather marginal conditions can benefit more from CA in the form of higher yields. Pannell et al. [23] conclude that mulching can have a direct benefit for farmers in the short run, especially in dry years, apart from their positive long-term effect on yields if applied with minimal or zero tillage. Buerkert et al. [35] find that particularly on degraded soils mulched crops can increase yields. The effect of mulching in humid to sub-humid regions can be less beneficial due to a possible waterlogging effect or if poor drainage of rainwater is present [36]. Mulching can however be detrimental to the farm output, since it can be the way of transporting a present crop disease to the next crop-planting season. According to Erenstein [36], this can be avoided with the simultaneous application of control practices, such as crop rotation or intercropping.
The gender gap remains significant also for higher intensified farms, since female farmers in general do not always have the same level of access as male farmers to resources such as land, labor or financial capital [14].
Farmers located in semi-arid Dodoma in general suffer from a lower yield perspective in comparison to farmers in semi-humid Morogoro. There is more cattle grazing in combination with a dry climate [32].
A higher risk attitude appears to play a role only for higher intensified and thus better endowed farmers. They are better prepared and more willing to take a risk [21]. Smallholder farmers with few resources are likely to be highly risk-averse due to uncertainty [23].
Applying manure on the farm plot(s) is more frequently done by less intensified farmers, however only the more intensified farmers appear to benefit from its application by an increased crop income value per hectare. The higher intensified might have a different practice or putting more manure per hectare and the less intensified possibly just leave cattle graze on their plot and have only little manure coming from that grazing activity [11].
With increasing land size, crop output per hectare decreases on the one hand due to limited labor supply (family labor and hired labor). On the other hand, larger farms can be less productive than smaller ones because of prevailing lower soil quality [37]. Instead of investing into soil conservation of their usual plots, many farmers in the African context choose to rather extend their land into virgin lands or even abandon their land and move with the whole homestead towards uncultivated, more fertile lands [38]. Especially poorer farmers with insecure land tenure arrangements prefer this extensive land use over conservation, since they have to provide for their families and can hardly accept income sacrifices that come along with investments for the improvement of soil fertility on their plots in the long run [14,23,38]. Land ownership is therefore important for all farmers, but especially for the least intensified, who could benefit in terms of a higher crop income, if they own the land individually. Insecure land tenure conditions however appear to discourage CA adoption.
Having a portfolio of plots rather than only one appears to be beneficial at the 50th quantile and at the mean, indicating a positive effect rather for the average farmer than for low or highly intensified ones. An increased portfolio of plots increases crop diversity and the fertility and thus productivity of the soil through a higher likelihood to leave a plot fallow from time to time or to apply mulch or crop rotation [21]. A slope is not the preferred location for farmers to do agricultural activities, but the less endowed farmers might depend on it or do not have so many options of getting better quality land parcels. Thus, only the less intensified significantly suffer from slopy land in the form of a lower crop income.
The farm household being involved in off-farm wage or self-employment implies fewer available labor resources for agricultural activities on their own farm. This is especially important for less intensified farmers and becomes less important with increasing levels of intensification. However, for all farmers it means a diversification of income, thus not only depending on crop income [21].
Increasing agricultural expenditures per hectare can increase the value of crop income in general, since an increase in agricultural inputs can help replenish nutrients in the soil and can counter soil degradation [39]. Descriptive results showed that agricultural inputs are used by farm households on a relatively low basis compared to other African countries and especially in comparison to Asian countries [7]. Nutrient mining is therefore one of the major causes for depleting soil fertility and lower yields [39].
6. Conclusions
The analysis looks at the question of whether small-scale farmers can have an increased output from their land when using conservation agriculture. Results show that mulching, i.e., leaving crop residues on the plot for soil improvement, can increase the value of income from crop production in general, but farmers in marginal conditions can have a stronger income effect. Descriptive results reveal that farmers apply generally only one or two soil-conserving measures with mulching being the most frequent one. Farmers with a low agricultural income per hectare however apply mulching less frequently; although results from quantile regression indicate they would benefit the most from its application on their plots in form of a higher crop income per hectare. Results further show that crop residues are rather used as animal feed than for mulching by poorer farmers. The results imply that CA practices are chosen according to socio-economic and site-specific characteristics. Farmers are more likely to plant trees on sloped plots to improve soil fertility. If the farm is located in Dodoma, then intercropping appears more likely, but if located in Kilosa, then leaving land fallow and applying mulch is rather likely.
The results however indicate that farmers do not significantly have an income effect from an increased use of conservation measures apart from mulching. Given the cross-sectional nature of the data, there were some limitations to the analysis. Future research based on panel data could analyze more rigorously the opportunity costs of using the crop residues on the soil as mulch or as fodder, especially with the focus on food security as an outcome. The low numbers of combined CA measures could be a starting point for extension services to increase their efforts on sustainable agricultural practices.
The importance of secure land rights became evident in the analysis, as especially poorer, more risk-averse farmers have no incentive in investing into conservation agricultural measures that can improve soil fertility in the long run. Here, political decision makers can help to ensure property rights and hence positively influence sustainable conservation measures. This refers especially to women and their role in agriculture and land ownership. Reducing the gender gap is of importance for poverty reduction. Any approach for sustainable intensification should be designed to integrate female farmers. As mulching can have a positive effect on crop income already short-term especially in dry years, it appears to be a useful measure for marginalized farmers, who usually prefer present over future consumption.
A motivation of especially poorer farmers to use crop residues more effectively for mulching can be achieved only in cooperation with the village government, which can establish village-level by-laws that inhibits free grazing on the farmers’ plots.
Acknowledgments
This publication is a product of the Trans-SEC project (www.trans-sec.org), funded by the German Federal Ministry of Education and Research (BMBF) and the German Federal Ministry for Economic Cooperation and Development (BMZ). The views expressed belong to the authors and may not under any circumstances be regarded as stating an official position of the BMBF and BMZ.
Author Contributions
Anja Faße and Ulrike Grote together with Trans-SEC consortium conceived and designed the general analytical and scientific framework; Kathleen Brüssow, Luitfred Kissoly and Anja Faße collected the data in cooperation with Sokoine University of Agriculture. Kathleen Brüssow analyzed the data and wrote the paper; Anja Faße and Ulrike Grote contributed to the content of the final paper through critical revision.
Conflicts of Interest
The authors declare no conflict of interest.
References
- New Partnership for Africa’s Development. African Agriculture, Transformation and Outlook; New Partnership for Africa’s Development Johannesburg: Midrand, South Africa, 2013. [Google Scholar]
- Pretty, J.; Toulmin, C.; Williams, S. Sustainable intensification in African agriculture. Int. J. Agric. Sustain. 2011, 9, 5–24. [Google Scholar] [CrossRef]
- The Worldbank. World Development Indicators (WDI). Available online: http://databank.worldbank.org/data/reports.aspx?source=2&country=TZA# (accessed on 13 January 2017).
- Nkonya, E.; Mirzabaev, A.; Von Braun, J. Economics of Land Degradation and Improvement: A Global Assessment for Sustainable Development; Springer: New York, NY, USA, 2015. [Google Scholar]
- Kassie, M.; Jaleta, M.; Shiferaw, B.; Mmbando, F.; Mekuria, M. Adoption of interrelated sustainable agricultural practices in smallholder systems: Evidence from rural Tanzania. Technol. Forecast. Soc. Chang. 2013, 80, 525–540. [Google Scholar] [CrossRef]
- Shetto, R.; Owenya, M. (Eds.) Conservation Agriculture as Practised in Tanzania: Three Case Studies; African Conservation Tillage Network: Rome, Italy, 2007. [Google Scholar]
- Kassam, A.; Friedrich, T.; Shaxson, F.; Pretty, J. The spread of conservation agriculture: Justification, sustainability and uptake. Int. J. Agric. Sustain. 2009, 7, 292–320. [Google Scholar] [CrossRef]
- Silici, L. Conservation Agriculture and Sustainable Crop Intensification in Lesotho; Food and Agriculture Organization of the United Nations: Rome, Italy, 2010. [Google Scholar]
- Mutua, J.; Muriuki, J.; Gachie, P.; Bourne, M.; Capis, J. Conservation Agriculture with Tress: Principles and Practice; A simplified guide for extension staff and farmers; World Agroforestry Centre (ICRAF): Nairobi, Kenya, 2014. [Google Scholar]
- Giller, K.E.; Witter, E.; Corbeels, M.; Tittonell, P. Conservation agriculture and smallholder farming in Africa: The heretics’ view. Field Crops Res. 2009, 114, 23–34. [Google Scholar] [CrossRef]
- Owenya, M.Z.; Mariki, W.L.; Kienzle, J.; Friedrich, T.; Kassam, A. Conservation agriculture (CA) in Tanzania: The case of the Mwangaza B CA farmer field school (FFS), Rhotia Village, Karatu District, Arusha. Int. J. Agric. Sustain. 2011, 9, 145–152. [Google Scholar] [CrossRef]
- Thierfelder, C.; Chivenge, P.; Mupangwa, W.; Rosenstock, T.S.; Lamanna, C.; Eyre, J.X. How climate-smart is conservation agriculture (CA)?—Its potential to deliver on adaptation, mitigation and productivity on smallholder farms in Southern Africa. Food Sec. 2017, 9, 537–560. [Google Scholar] [CrossRef]
- Marongwe, L.S.; Kwazira, K.; Jenrich, M.; Thierfelder, C.; Kassam, A.; Friedrich, T. An African success: The case of conservation agriculture in Zimbabwe. Int. J. Agric. Sustain. 2011, 9, 153–161. [Google Scholar] [CrossRef]
- Kassie, M.; Jaleta, M.; Shiferaw, B.; Mmbando, F.; Muricho, G. Plot and Household-Level Determinants of Sustainable Agricultural Practices in Rural Tanzania; Springer: New York, NY, USA, 2012; No. dp-12-02-efd. [Google Scholar]
- NBS (National Bureau of Statistics). Annual Agricultural Sample Survey (Crops and Livestock Report) 2014/15. 2016. Available online: http://www.nbs.go.tz/nbs/takwimu/Agriculture/2014_15_AASS_%20report_with_Livestock_module.pdf (accessed on 15 August 2017).
- Teklewold, H.; Köhlin, G. Risk preferences as determinants of soil conservation decisions in Ethiopia. J. Soil Water Conserv. 2011, 66, 87–96. [Google Scholar] [CrossRef]
- Holden, S.; Shiferaw, B.; Wik, M. Poverty, market imperfections and time preferences: Of relevance for environmental policy? Environ. Dev. Econ. 1998, 3, 105–130. [Google Scholar] [CrossRef]
- Morris, S.; Carletto, C.; Hoddinott, J.; Christiaensen, L. Validity of Rapid Estimates of Household Wealth and Income for Health Surveys in Rural Africa. J. Epidemiol. Commun. Health 2000, 54, 381–387. [Google Scholar] [CrossRef]
- D’Souza, G.E.; Cyphers, D.; Phipps, T.T. Factors Affecting the Adoption of Sustainable Agricultural Practices. Agric. Resour. Econ. Rev. 1993, 22, 159–165. [Google Scholar] [CrossRef]
- Cameron, A.C.; Trivedi, P.K. Microeconometrics Using Stata: Revised Edition; Stata Press: College Station, TX, USA, 2009. [Google Scholar]
- Bullock, R.; Mithöfer, D.; Vihemäki, H. Sustainable agricultural intensification: The role of cardamom agroforestry in the East Usambaras, Tanzania. Int. J. Agric. Sustain. 2014, 12, 109–129. [Google Scholar] [CrossRef]
- Lahmar, R.; Bationo, B.A.; Dan Lamso, N.; Guéro, Y.; Tittonell, P. Tailoring conservation agriculture technologies to West Africa semi-arid zones: Building on traditional local practices for soil restoration. Field Crops Res. 2012, 132, 158–167. [Google Scholar] [CrossRef]
- Pannell, D.J.; Llewellyn, R.S.; Corbeels, M. The farm-level economics of conservation agriculture for resource-poor farmers. Agric. Ecosyst. Environ. 2014, 187, 52–64. [Google Scholar] [CrossRef]
- Larsson, D.; Plessmann, F. Do farmers choose to be inefficient? Evidence from Bicol, Philippines. J. Dev. Econ. 2009, 90, 24–32. [Google Scholar] [CrossRef]
- Mwangi, M.; Kariuki, S. Factors Determining Adoption of New Agricultural Technology by Smallholder Farmers in Developing Countries. J. Econ. Sustain. Dev. 2015, 6, 208–216. [Google Scholar]
- Synnevåg, G.; Kabote, S.; Nombo, C.; Mamiro, D.; Mattee, A. Smallholder Adaptation to Climate Change in Semi-Arid Areas of Tanzania: Experiences from Iramba and Meatu Districts. In Sustainable Intensification to Advance Food Security and Enhance Climate Resilience in Africa; Lal, R., Singh, B., Mwaseba, D., Kraybill, D., Hansen, D., Eik, L., Eds.; Springer International Publishing: Cham, Switzerland, 2015; pp. 467–485. [Google Scholar]
- Kassie, M.; Teklewold, H.; Jaleta, M.; Marenya, P.; Erenstein, O. Understanding the adoption of a portfolio of sustainable intensification practices in eastern and southern Africa. Land Use Policy 2015, 42, 400–411. [Google Scholar] [CrossRef]
- Ariga, E.S. Availability and role of multipurpose trees and shrubs in sustainable agriculture in Kenya. J. Sustain. Agric. 1997, 10, 25–35. [Google Scholar] [CrossRef]
- Machado, J.A.; Parente, P.; Silva, J.S. QREG2: Stata Module to perForm Quantile Regression with Robust and Clustered Standard Errors; Statistical Software Components, Boston College Department of Economics: Chestnut Hill, MA, USA, 2015. [Google Scholar]
- FAO. “Climate-smart” Agriculture: Policies, Practices and Financing for Food Security, Adaptation and Mitigation; Food and Agriculture Organization of the United Nations: Rome, Italy, 2010. [Google Scholar]
- Branca, G.; McCarthy, N.; Lipper, L.; Jolejole, M.C. Climate Smart Agriculture: A Synthesis of Empirical Evidence of Food Security and Mitigation Benefits from Improved Cropland Management; WP in MICCA Programme; FAO: Rome, Italy, 2011. [Google Scholar]
- Graef, F.; Sieber, S.; Mutabazi, K.; Asch, F.; Biesalski, H.K. Framework for participatory food security research in rural food value chains. Glob. Food Secur. 2014, 3, 8–15. [Google Scholar] [CrossRef]
- Guto, S.N. Chakula Bila Kulima? Trade-Offs Concerning Soil and Water Conservation in Heterogenous Smallholder Farms of Central Kenya; Wageningen University: Wageningen, The Netherlands, 2011. [Google Scholar]
- Erenstein, O.; Sayre, K.; Wall, P.; Hellin, J.; Dixon, J. Conservation agriculture in maize and wheat based systems in the (sub) tropics: Lessons from adaptation initiatives in South Asia, Mexico and Southern Africa. J. Sustain. Agric. 2012, 36, 180–206. [Google Scholar] [CrossRef]
- Buerkert, A.; Bationo, A.; Dossa, K. Mechanisms of Residue Mulch-Induced Cereal Growth Increases in West Africa. Deidicated to Horst Maschner and his commitment to process-oriented soil fertility research in West Africa. Soil Sci. Soc. Am. J. 2000, 64, 346–358. [Google Scholar] [CrossRef]
- Erenstein, O. Smallholder conservation farming in the tropics and sub-tropics: A guide to the development and dissemination of mulching with crop residues and cover crops. Agric. Ecosyst. Environ. 2003, 100, 17–37. [Google Scholar] [CrossRef]
- Barrett, C.B.; Bellemare, M.F.; Hou, J.Y. Reconsidering conventional explanations of the inverse productivity–size relationship. World Dev. 2010, 38, 88–97. [Google Scholar] [CrossRef]
- Barbier, E.B. The economic linkages between rural poverty and land degradation: Some evidence from Africa. Agric. Ecosyst. Environ. 2000, 82, 355–370. [Google Scholar] [CrossRef]
- Tittonell, P.; Giller, K.E. When yield gaps are poverty traps: The paradigm of ecological intensification in African smallholder agriculture. Field Crops Res. 2013, 143, 76–90. [Google Scholar] [CrossRef]
Figure 1.
Study sites in Tanzania. Source: Own production using ArcGIS.

Table 1.
Production overview by region during 2014/15 Agricultural year.
| Crop by Region | Planted Area (ha) | Share of Total Land Area of Region (%) | Quantity Harvested (tons) | Yield (tons/ ha) |
|---|---|---|---|---|
| Dodoma | ||||
| Maize | 438,149 | 10.6 | 164,803 | 0.5 |
| Sorghum | 175,019 | 4.2 | 81,573 | 0.7 |
| Millet * | 88,890 | 2.2 | 22,098 | 0.4 |
| Morogoro | ||||
| Maize | 150,657 | 2.1 | 159,225 | 1.1 |
| Sorghum | 7612 | 0.1 | 3030 | 0.4 |
| Millet * | 1020 | 0.01 | 227 | 0.2 |
Source: Own compilation based on Annual Agricultural Sample Survey Report 2014/2015 with Livestock module (long rainy season) [15]. * Millet includes Bulrush millet and finger millet.
Table 2.
Total number of livestock per region.
| Region | Cattle | Goats | Sheep | Pigs | Chicken |
|---|---|---|---|---|---|
| Dodoma | 1,513,707 | 1,274,148 | 258,151 | 173,827 | 1,661,684 |
| Morogoro | 606,288 | 515,620 | 191,871 | 130,519 | 2,085,468 |
Source: Own compilation based on Annual Agricultural Sample Survey Report with Livestock module 2014/2015 [15].
Table 3.
Direction of the relationship between covariates and use of conservation agriculture.
| Variable Name | Description of Variable | Expected Sign | Source |
|---|---|---|---|
| Dependent variable | |||
| CA dummy | 1 if household applies CA measure; 0 if otherwise | [7,8] | |
| Independent variables | |||
| If Head female | 1 if household head is female; 0 if otherwise | +/− | [14,21] |
| Age | Age of household head in years | +/− | [14,21] |
| Household size | Number of people living in the household (nucleus definition) | +/− | [14,21,22] |
| If in Dodoma | 1 if farm is located in semi-arid region Dodoma; 0 if in semi-humid Morogoro | − | [14] |
| Education (years) | Years of education of household head | + | [14] |
| Rate of time pref. | Rate of time preference | − | [23] |
| Risk attitude | Household’s risk attitude: On a 11-point scale from 0 (=unwilling to take risk) to 10 (fully prepared to take risk) | + | [16,24] |
| If using manure | 1 if household is using manure as fertilizer; 0 otherwise | + | [11,14] |
| Land size | Total land size under cultivation per household (in hectare) | +/− | [14,23] |
| If slopy | 1 if perceived soil fertility reduced due to very slopy plot; 0 otherwise | + | [14] |
| Distance VHO | Distance from homestead to village center (in km) | − | [5,25] |
| Livestock (TLU) | Number of livestock owned in tropical livestock unit (TLU) | + | [5] |
| If offempl | 1 if household member has wage employment; 0 otherwise | +/− | [14,21,26] |
| If selfempl | 1 if household member is self-employed; 0 otherwise | − | [26] |
| If mem. microcredit | 1 if at least 1 household member is member in microcredit organization | + | [21,23] |
| If land indiv. owned | 1 if land is individually owned by household; 0 if rented or clan-owned | +/− | [14,21,27] |
| No. plots | Number of plots per household under cultivation | + | [21] |
| If crop residues = fodder | 1 if crop residues are used as fodder for livestock | − | [11,23] |
| Asset score | Asset score per household | +/− | [14,18] |
| Fallow_share | Share of land per household under fallow practice (0–1) | +/− | [7,9] |
| Croprot_share | Share of land per household under crop rotation (0–1) | +/− | [7,23] |
| Intercrop_share | Share of land per household under intercropping (0–1) | +/− | [7,23] |
| Tree_share | Share of land per household with trees planted for soil fertility improvement (0–1) | +/− | [9,28] |
| Mulch_share | Share of land per household under mulching (0–1) | +/− | [7,23] |
Source: Own elaboration based on literature review.
Table 4.
Practices of conservation agriculture and extent of use by region.
| CA Practice Per HH | Total No. of HH | SEMI-Humid Morogoro | Semi-Arid Dodoma | |||
|---|---|---|---|---|---|---|
| Number of obs. | N = 867 | N = 439 | N = 428 | |||
| Average farm size per HH | 2.25 ha | 1.63 ha | 2.89 ha | |||
| Mulch | N = 202 | 100% | N = 140 | 69.31% | N = 62 | 30.69% |
| Avg. land area mulched/HH | 1.69 ha | 38.9% | 1.75 ha | 41.4% | 1.56 ha | 33.1% |
| Fallow | N = 137 | 100% | N = 86 | 62.77% | N = 51 | 37.23% |
| Average land area under fallow/HH | 1.36 ha | 60.2% | 1.52 ha | 66.1% | 1.09 ha | 50.1% |
| Crop rotation | N = 163 | 100% | N = 86 | 52.76% | N = 77 | 47.24% |
| Avg. area of land under crop rotation | 1.78 ha | 76.3% | 1.67 ha | 77.8% | 1.91 ha | 74.6% |
| Intercropping | N = 147 | 100% | N = 63 | 42.86% | N = 84 | 57.14% |
| 1.58 ha | 75.6% | 1.15 ha | 69.5% | 1.91 ha | 80.3% | |
| Tree planting | N = 129 | 100% | N = 55 | 42.64% | N = 74 | 57.36% |
| 1.06 ha | 43.8% | 1.0 ha | 37.1% | 1.1 ha | 48.7% | |
Source: Trans-SEC Household Survey Wave 1.
Table 5.
Number of CA measures applied & not applied per farm household.
| No. CA per HH | Frequency | % |
|---|---|---|
| 0 | 277 | 31.95 |
| 1 | 395 | 45.56 |
| 2 | 157 | 18.11 |
| 3 | 35 | 4.04 |
| 4 | 3 | 0.35 |
| Total | 867 | 100 |
Source: Trans-SEC Household Survey Wave 1.
Table 6.
Frequent combinations of CA practices.
| CA on Farm | Applied with | Freq. |
|---|---|---|
| Mulch | Fallow | 40 |
| Intercropping | 18 | |
| Crop Rotation | 30 | |
| Tree planting | 34 | |
| Fallow | Intercropping | 26 |
| Crop Rotation | 25 | |
| Tree planting | 16 | |
| Intercropping | Crop rotation | 18 |
| Tree planting | 12 | |
| Tree Planting | Crop rotation | 21 |
Source: Trans-SEC Household Survey Wave 1. Frequency (Freq.).
Table 7.
Distribution of CA practices, inputs and use of crop residues as animal feed along quantiles of agricultural income (per hectare).
Table 7.
Distribution of CA practices, inputs and use of crop residues as animal feed along quantiles of agricultural income (per hectare).
| CA Practices | Q1 (n = 217) | Q2 (n = 217) | Q3 (n = 217) | Q4 (n = 216) | ||||
|---|---|---|---|---|---|---|---|---|
| Freq. | % | Freq. | % | Freq. | % | Freq. | % | |
| Mulching | 27 | 14.75 | 43 | 22.12 | 54 | 20.74 | 78 | 35.65 |
| Fallow | 26 | 12.9 | 35 | 17.05 | 34 | 15.67 | 42 | 17.59 |
| Crop rotation | 37 | 17.89 | 42 | 20.74 | 43 | 17.97 | 41 | 18.52 |
| Intercropping | 36 | 14.75 | 40 | 16.59 | 38 | 16.59 | 33 | 19.91 |
| Tree planting | 38 | 18.43 | 34 | 16.13 | 32 | 13.36 | 25 | 11.57 |
| Use of crop residues as fodder | 76 | 35.02 | 83 | 38.25 | 61 | 28.11 | 29 | 13.43 |
| Pesticides and fungicides | 8 | 3.69 | 20 | 9.22 | 46 | 21.20 | 110 | 50.93 |
| Herbicides | 1 | 0.46 | 1 | 0.46 | 9 | 4.15 | 15 | 6.94 |
| Pesticides | 6 | 2.76 | 17 | 7.83 | 30 | 13.82 | 86 | 39.81 |
| Fungicides | 1 | 0.46 | 2 | 0.92 | 7 | 3.23 | 9 | 4.17 |
| Improved seeds | 12 | 5.53 | 21 | 9.68 | 24 | 11.06 | 32 | 14.81 |
| Mineral fertilizer | 0 | 0 | 0 | 0 | 3 | 1.38 | 8 | 3.7 |
| Manure | 38 | 17.51 | 24 | 11.06 | 28 | 12.9 | 12 | 5.56 |
Source: Trans-SEC Household Survey Wave 1.
Table 8.
Frequency and average spending per household for hired labor along quantiles of agricultural income (per hectare).
Table 8.
Frequency and average spending per household for hired labor along quantiles of agricultural income (per hectare).
| If Hired Labor for | Q1 (n = 217) | Q2 (n = 217) | Q3 (n = 217) | Q4 (n = 216) | ||||
|---|---|---|---|---|---|---|---|---|
| Freq. | Mean $ | Freq. | Mean $ | Freq. | Mean $ | Freq. | Mean $ | |
| Land preparation | 18 | 26.33 | 11 | 40.75 | 23 | 47.38 | 44 | 97.73 |
| Seedlings and planting | 14 | 17.25 | 8 | 15.73 | 35 | 27.90 | 49 | 58.78 |
| Hand weeding | 25 | 35.79 | 22 | 43.27 | 50 | 55.19 | 75 | 89.40 |
| Harvesting | 12 | 14.84 | 19 | 24.14 | 43 | 36.93 | 70 | 45.75 |
Source: Trans-SEC Household Survey Wave 1. 1 $ = 1 PPP USD.
Table 9.
Logit regression results.
| Mulch | Tree | Fallow | Intercrop | Rotation | ||||||
|---|---|---|---|---|---|---|---|---|---|---|
| Coef. | (s.e.) | Coef. | (s.e.) | Coef. | (s.e.) | Coef. | (s.e.) | Coef. | (s.e.) | |
| If Head female | −0.20 | −0.25 | −0.15 | −0.27 | −0.22 | −0.27 | 0.00 | −0.24 | −0.27 | −0.25 |
| Age | −0.012 ** | −0.01 | 0.00 | −0.01 | 0.00 | −0.01 | −0.0107 * | −0.01 | 0.00 | −0.01 |
| HH size | 0.07 | −0.04 | −0.089 * | −0.05 | −0.01 | −0.05 | −0.04 | −0.05 | 0.01 | −0.04 |
| If in Dodoma | −1.260 *** | −0.26 | 0.28 | −0.29 | −0.600 ** | −0.28 | 0.443 * | −0.26 | −0.15 | −0.26 |
| Education (years ) | −0.03 | −0.03 | 0.04 | −0.03 | 0.03 | −0.03 | 0.00 | −0.03 | 0.00 | −0.03 |
| Rate of time pref. | 0.172 ** | −0.08 | 0.03 | −0.10 | −0.225 ** | −0.09 | −0.03 | −0.09 | −0.10 | −0.09 |
| Risk attitude (1–10) | 0.04 | −0.04 | −0.083 ** | −0.04 | −0.05 | −0.04 | 0.01 | −0.04 | 0.062 * | −0.04 |
| If using manure | 0.09 | −0.35 | −0.04 | −0.33 | −0.714 * | −0.43 | −0.30 | −0.34 | −0.589 * | −0.34 |
| Land size | 0.04 | −0.05 | −0.01 | −0.05 | −0.04 | −0.06 | 0.02 | −0.05 | −0.05 | −0.05 |
| No. Plots | 0.329 *** | −0.10 | 0.03 | −0.11 | 0.399 *** | −0.11 | −0.02 | −0.10 | 0.306 *** | −0.10 |
| If slopy | −0.14 | −0.35 | 1.107 *** | −0.31 | −0.15 | −0.40 | −0.51 | −0.45 | 0.23 | −0.34 |
| Distance VHO (in km) | 0.111 * | −0.06 | −0.181 ** | −0.09 | 0.00 | −0.07 | −0.232 *** | −0.08 | −0.02 | −0.07 |
| Livestock (TLU) | 0.05 | −0.04 | 0.02 | −0.05 | −0.08 | −0.07 | −0.05 | −0.05 | −0.07 | −0.05 |
| If offempl | −0.20 | −0.20 | 0.01 | −0.24 | 0.36 | −0.22 | −0.28 | −0.22 | −0.35 | −0.22 |
| If selfempl | −0.718 *** | −0.24 | 0.391 * | −0.23 | −0.26 | −0.25 | −0.863 *** | −0.26 | −0.21 | −0.23 |
| If mem. Microcredit | 0.06 | −0.37 | −0.03 | −0.45 | 0.857 ** | −0.35 | 0.29 | −0.39 | −0.01 | −0.40 |
| If land indiv. owned | 0.395 * | −0.24 | 0.931 *** | −0.24 | 0.26 | −0.27 | 0.02 | −0.27 | 0.27 | −0.25 |
| Asset score | 0.00 | 0.00 | 0.00 | 0.00 | 0.001 * | 0.00 | 0.001 ** | 0.00 | 0.00 | 0.00 |
| If crop residues = fodder | −0.640 *** | −0.25 | 0.27 | −0.24 | −0.02 | −0.26 | 0.03 | −0.24 | 0.18 | −0.23 |
| Fallow_share | 0.49 | −0.31 | −0.45 | −0.44 | −0.860* | −0.44 | −1.414 *** | −0.48 | ||
| Croprot_share | −0.684 ** | −0.30 | −0.41 | −0.34 | −0.807 ** | −0.36 | −1.404 *** | −0.39 | ||
| Intercrop_share | −1.554 *** | −0.43 | −1.108 ** | −0.44 | −0.41 | −0.35 | −2.209 *** | −0.51 | ||
| Tree_share | 0.23 | −0.41 | −0.90 | −0.63 | −2.629 *** | −0.96 | −1.788 ** | −0.72 | ||
| Mulch_share | 0.914 * | −0.50 | 0.31 | −0.50 | −2.103 *** | −0.74 | −1.548 ** | −0.61 | ||
| _cons | −1.311 ** | −0.64 | −1.190 * | −0.72 | −1.561 ** | −0.70 | −0.07 | −0.67 | −1.242* | −0.64 |
| No. of Obs. | 867 | 867 | 867 | 867 | 867 | |||||
| Pseudo R-squ | 0.131 | 0.096 | 0.077 | 0.099 | 0.098 | |||||
| Chi-Squared | 123.10 | 70.17 | 58.44 | 78.20 | 81.77 | |||||
| Prob > chi2 | 0.0000 | 0.0000 | 0.0001 | 0.0000 | 0.0000 | |||||
Source: Trans-SEC Household Survey Wave 1. Standard errors in parentheses (* p < 0.10, ** p < 0.05, *** p < 0.01).
Table 10.
The influence of CA on agricultural income at different quantiles.
| OLS | OLS (robust) | Q25 | Q50 | Q75 | ||||||
|---|---|---|---|---|---|---|---|---|---|---|
| Coef. | (s.e.) | Coef. | (s.e.) | Coef. | (s.e.)* | Coef. | (s.e.)* | Coef. | (s.e.)* | |
| If Head female | −0.348 *** | −0.099 | −0.348 *** | −0.107 | −0.501 *** | −0.188 | −0.300 ** | −0.127 | −0.237 ** | −0.104 |
| Age | −0.00212 | −0.00248 | −0.00212 | −0.00257 | −0.00658 | −0.00469 | −0.00252 | −0.00296 | −0.00176 | −0.00219 |
| HH size | 0.0262 | −0.0183 | 0.0262 | −0.0178 | 0.043 | −0.0274 | 0.0214 | −0.0196 | 0.00278 | −0.0189 |
| If in Dodoma | −1.479 *** | −0.104 | −1.479 *** | −0.108 | −1.466 *** | −0.224 | −1.440 *** | −0.12 | −1.289 *** | −0.103 |
| Education (years) | −0.00513 | −0.0124 | −0.00513 | −0.0131 | −0.00194 | −0.0205 | −0.0131 | −0.0145 | 0.00112 | −0.0138 |
| Rate of time pref. | −0.017 | −0.0349 | −0.017 | −0.0341 | −0.0518 | −0.0568 | −0.0194 | −0.0397 | −0.00605 | −0.0303 |
| Risk attitude (1–10) | 0.0361 ** | −0.0148 | 0.0361 ** | −0.0161 | 0.0289 | −0.0329 | 0.0195 | −0.0154 | 0.0435 *** | −0.0155 |
| If using manure | 0.208 | −0.13 | 0.208 | −0.151 | 0.151 | −0.301 | 0.376 ** | −0.17 | 0.492 *** | −0.15 |
| Land size | −0.168 *** | −0.0192 | −0.168 *** | −0.0281 | −0.235 *** | −0.0748 | −0.172 *** | −0.0393 | −0.124 *** | −0.0269 |
| No. Plots | 0.0790 * | −0.0404 | 0.0790 ** | −0.0384 | 0.109 | −0.0862 | 0.102 ** | −0.0461 | 0.00964 | −0.0373 |
| If slopy | −0.396 *** | −0.147 | −0.396 ** | −0.167 | −0.405 * | −0.221 | −0.28 | −0.209 | −0.184 | −0.125 |
| Distance VHO (in km) | 0.00101 | −0.0269 | 0.00101 | −0.0242 | 0.024 | −0.0333 | −0.0349 | −0.0375 | −0.00642 | −0.0223 |
| Livestock (TLU) | 0.0155 | −0.0188 | 0.0155 | −0.018 | 0.00253 | −0.0477 | −0.00051 | −0.0203 | −0.0245 | −0.0176 |
| If offempl | −0.481 *** | −0.085 | −0.481 *** | −0.0864 | −0.408 *** | −0.142 | −0.502 *** | −0.0966 | −0.395 *** | −0.0825 |
| If selfempl | 0.0199 | −0.092 | 0.0199 | −0.0905 | −0.0535 | −0.173 | 0.0122 | −0.106 | 0.0124 | −0.0895 |
| If mem. Microcredit | −0.237 | −0.161 | −0.237 | −0.153 | −0.331 | −0.224 | −0.195 | −0.208 | −0.298 * | −0.17 |
| If land indiv. owned | 0.255 ** | −0.105 | 0.255 *** | −0.095 | 0.525 *** | −0.144 | 0.276 ** | −0.114 | 0.152 * | −0.0853 |
| Asset score | 0.000 | −0.0002 | 0.000 | −0.00027 | 0.000 | −0.0006 | 0.000 | −0.0002 | 0.000 | −0.00024 |
| Mulch_share | 0.324 *** | −0.11 | 0.324 *** | −0.104 | 0.416 ** | −0.163 | 0.357 *** | −0.134 | 0.278 *** | −0.0913 |
| Fallow_share | −0.16 | −0.149 | −0.16 | −0.136 | −0.282 | −0.24 | −0.107 | −0.198 | −0.123 | −0.111 |
| Croprot_share | −0.0653 | −0.121 | −0.0653 | −0.11 | −0.0841 | −0.182 | −0.089 | −0.14 | −0.0777 | −0.111 |
| Intercrop_share | 0.0988 | −0.127 | 0.0988 | −0.142 | 0.143 | −0.273 | 0.0456 | −0.151 | 0.109 | −0.14 |
| Tree_share | −0.257 | −0.178 | −0.257 | −0.197 | −0.0266 | −0.4 | −0.351 | −0.217 | −0.256 | −0.179 |
| _cons | 6.474 *** | −0.27 | 6.474 *** | −0.272 | 6.253 *** | −0.565 | 6.715 *** | −0.307 | 7.014 *** | −0.269 |
| No. of Obs. | 867 | 867 | 867 | 867 | 867 | |||||
| F stat. (Prob > F = 0.000) | 2958 | 2934 | ||||||||
| R-Squared | 0.447 | 0.447 | 0.429 | 0.44 | 0.43 | |||||
| Chi2 BP/ MSS Test (Prob > Chi2 = 0.000) | 45.551 | 36.395 | 29.183 | |||||||
Source: Trans-SEC Household Survey Wave 1. Standard errors (s.e.): * p < 0.10, ** p < 0.05, *** p < 0.01. (s.e.)* heteroscedacticity robust standard errors reported. BP (OLS): Breusch-Pagan/Cook-Weisberg test for heteroscedasticity. MSS (Quantiles): Machado-Santos Silva test for heteroscedasticity.
© 2017 by the authors. Licensee MDPI, Basel, Switzerland. This article is an open access article distributed under the terms and conditions of the Creative Commons Attribution (CC BY) license (http://creativecommons.org/licenses/by/4.0/).
Share and Cite
MDPI and ACS Style
Brüssow, K.; Faße, A.; Grote, U. Is Sustainable Intensification Pro-Poor? Evidence from Small-Scale Farmers in Rural Tanzania. Resources 2017, 6, 47. https://doi.org/10.3390/resources6030047
AMA Style
Brüssow K, Faße A, Grote U. Is Sustainable Intensification Pro-Poor? Evidence from Small-Scale Farmers in Rural Tanzania. Resources. 2017; 6(3):47. https://doi.org/10.3390/resources6030047
Chicago/Turabian StyleBrüssow, Kathleen, Anja Faße, and Ulrike Grote. 2017. "Is Sustainable Intensification Pro-Poor? Evidence from Small-Scale Farmers in Rural Tanzania" Resources 6, no. 3: 47. https://doi.org/10.3390/resources6030047
Note that from the first issue of 2016, this journal uses article numbers instead of page numbers. See further details here.