1. Introduction
The feasibility of producing geothermal heat is strongly dependent on the thermal and geological conditions of the subsurface. Having a market, i.e., the resource being near the end user, is also really important. Therefore, we focus our study on the areas with major population centers in Quebec.
Naturally, sufficient temperature is a primary constraint [
1]. However, in deep aquifers, permeability is usually low in deep sediments or close to zero in the crystalline basement. Therefore, an EGS (engineered geothermal systems) where a reservoir is created by fracture stimulation is usually necessary [
2]. This is to produce energy from geothermal resources, like the ones in Eastern Canada, Quebec [
3], that are otherwise not economical due to a lack of sufficient permeability to allow fluid flow at sufficiently high rates (usually >10 kg/s). A review of other EGS experiments [
2] shows that EGS-created permeabilities facilitate 10–50 kg/s flow rates at reasonable pressures. EGS technology has the potential to access vast resources of heat located at a depth with low to modest permeability, such as the deep sediments in the basins of Quebec. There, some sedimentary systems have natural permeability, and EGS is not required [
4]. Another obstacle to success is the cost of geothermal drilling [
2]. This increases exponentially with increasing depth [
2] and also depends on the through which type of rocks are to be drilled. These are the considerations in this review of geothermal resources in Quebec, Canada.
A new analysis of the feasible future drilling targets available for deep geothermal energy prospects in most populated centers in Québec is presented. In order to assess these prospects, we will discuss four major constrains; the temperature available at a depth and spatially, the 3D geological structure with special emphasis on porous formations in the sedimentary basin versus a low porosity crystalline basement below, the drilling depth needed to reach heat and the depth-related exponentially-increasing drilling cost. The uncertainties of these are discussed. The economics of the geothermal energy is an important factor and is tested for an example based on the available range of feasible parameters.
1.1. Previous Study
Studies of deep geothermal heat in the Eastern Canada basins in Québec started some years ago with the initiative of Hydro-Québec [
1]. Later, a Québec heat flow and bottom-hole temperature (BHT) study was published [
3]. These first studies on the geothermal potential of deep aquifers in Québec (Eastern Canada) concluded that Cambrian Potsdam group rocks have good geothermal potential within the platform. This was based on our analysis of the 2002 seismic cross-section [
3] and was paralleled by additional study [
4] describing more in detail the Cambrian geothermal plays. More detailed analysis in the area of the seismic profile around and southeast of Trois-Rivières [
3,
4] confirmed that useful porosity, permeability and temperature geothermal conditions exist south of Trois-Rivières into the deep basin.
Further, a more recent and detailed study has focused on the area of the peninsula north of Quebec City (
Figure 1) towards the Atlantic [
5]. There, population centers are not as large as in southeastern Quebec, where the 10 most populated cities are located. Previously [
5], we found that wells there rarely show anomalies above the general trend of a 27 ± 6 °C/km rate of increase of temperature with depth. There, single well-based anomalies indicate a 2-km depth to reach 110 °C, indicating a geothermal gradient of >50 °C per kilometer. These, however, are odd occurrences, and temperature measurements pointing to very high geothermal gradients are not generally confirmed by an overall trend of 27 ± 6 °C per kilometer. Drilling wells for the confirmation of these single anomalies was suggested [
5]. The analysis of geology/litho-stratigraphy points to the probable source of these anomalies being deep conduits of enhanced permeability through active faults [
5]. There, saline brines can migrate upward, bringing heat closer to the surface.
It was reported that the heat flow in the eastern Canadian basins generally ranges from 30 to 80 mW/m
2 [
3,
6], being 60.4 mW/m
2 (±13 mW/m
2) the average. The highest heat flow in the Canadian province of Québec was [
2,
3,
4] found in the platform area in the St. Lawrence River area. There, the geothermal gradient ranges from 20 to 40 °C/km [
3], with an average value of some 25 ± 5 °C/km. The distribution of the thermal gradient follows the same trend as heat flow with increasing values towards the south.
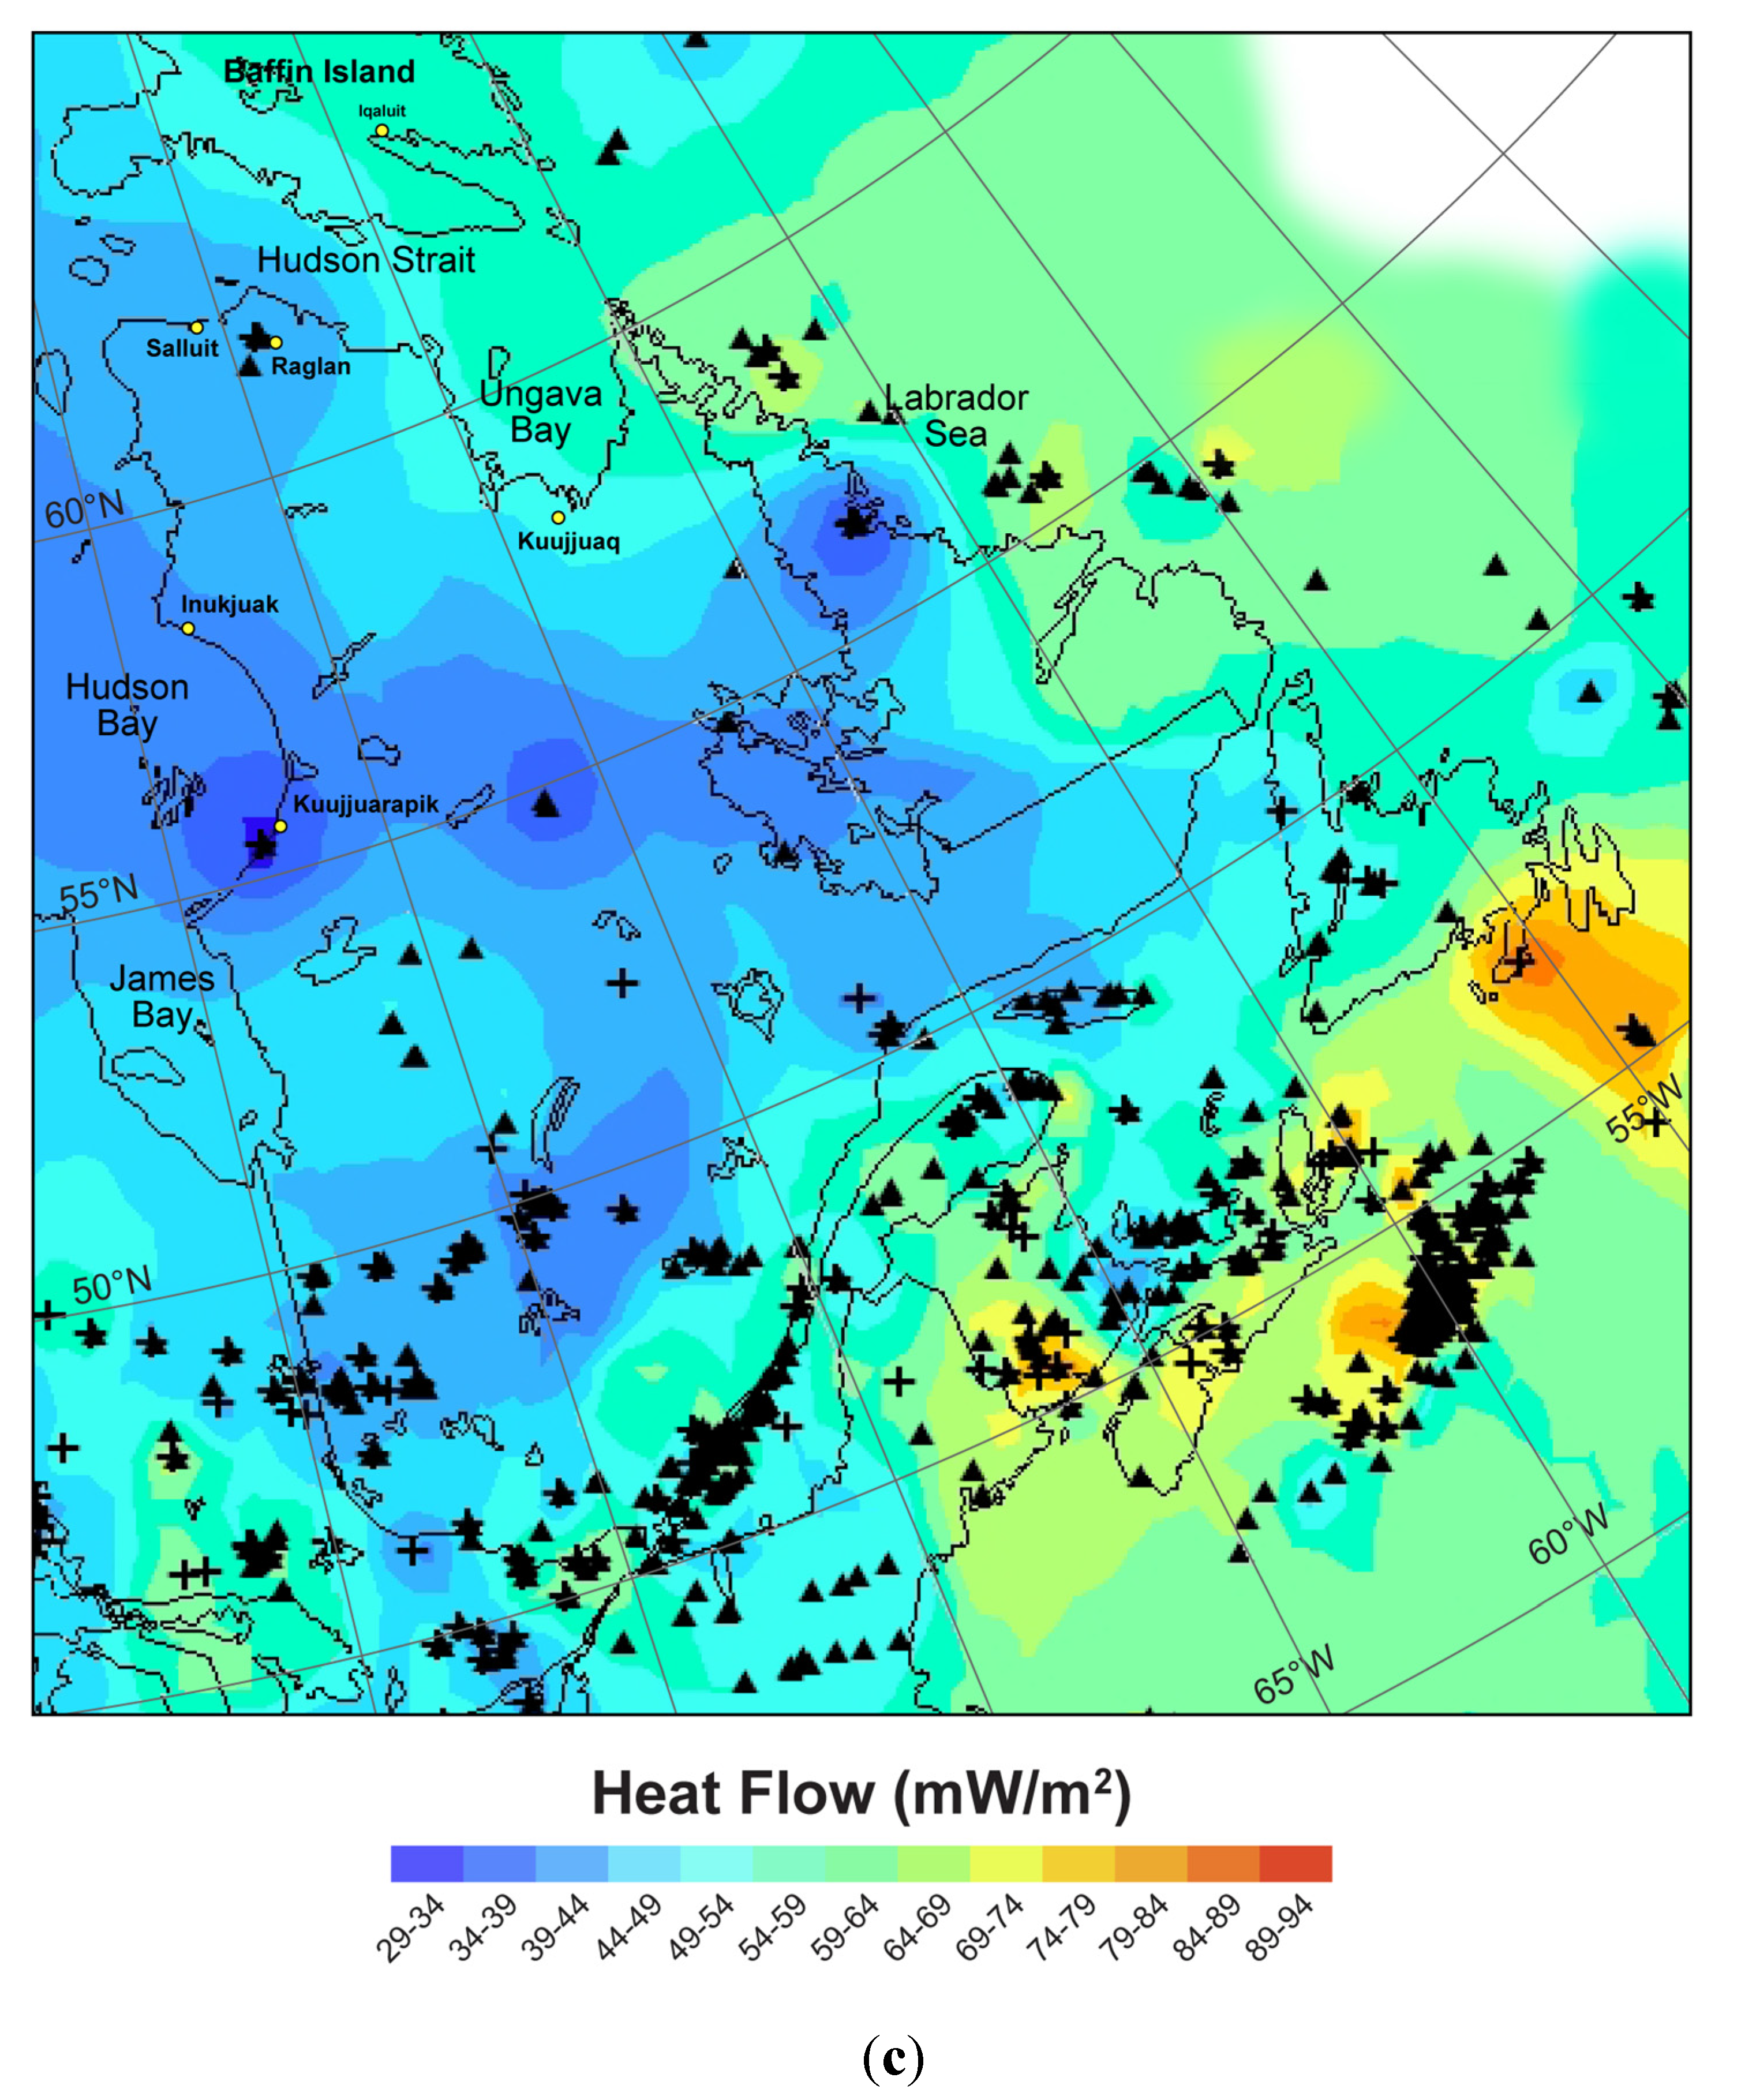
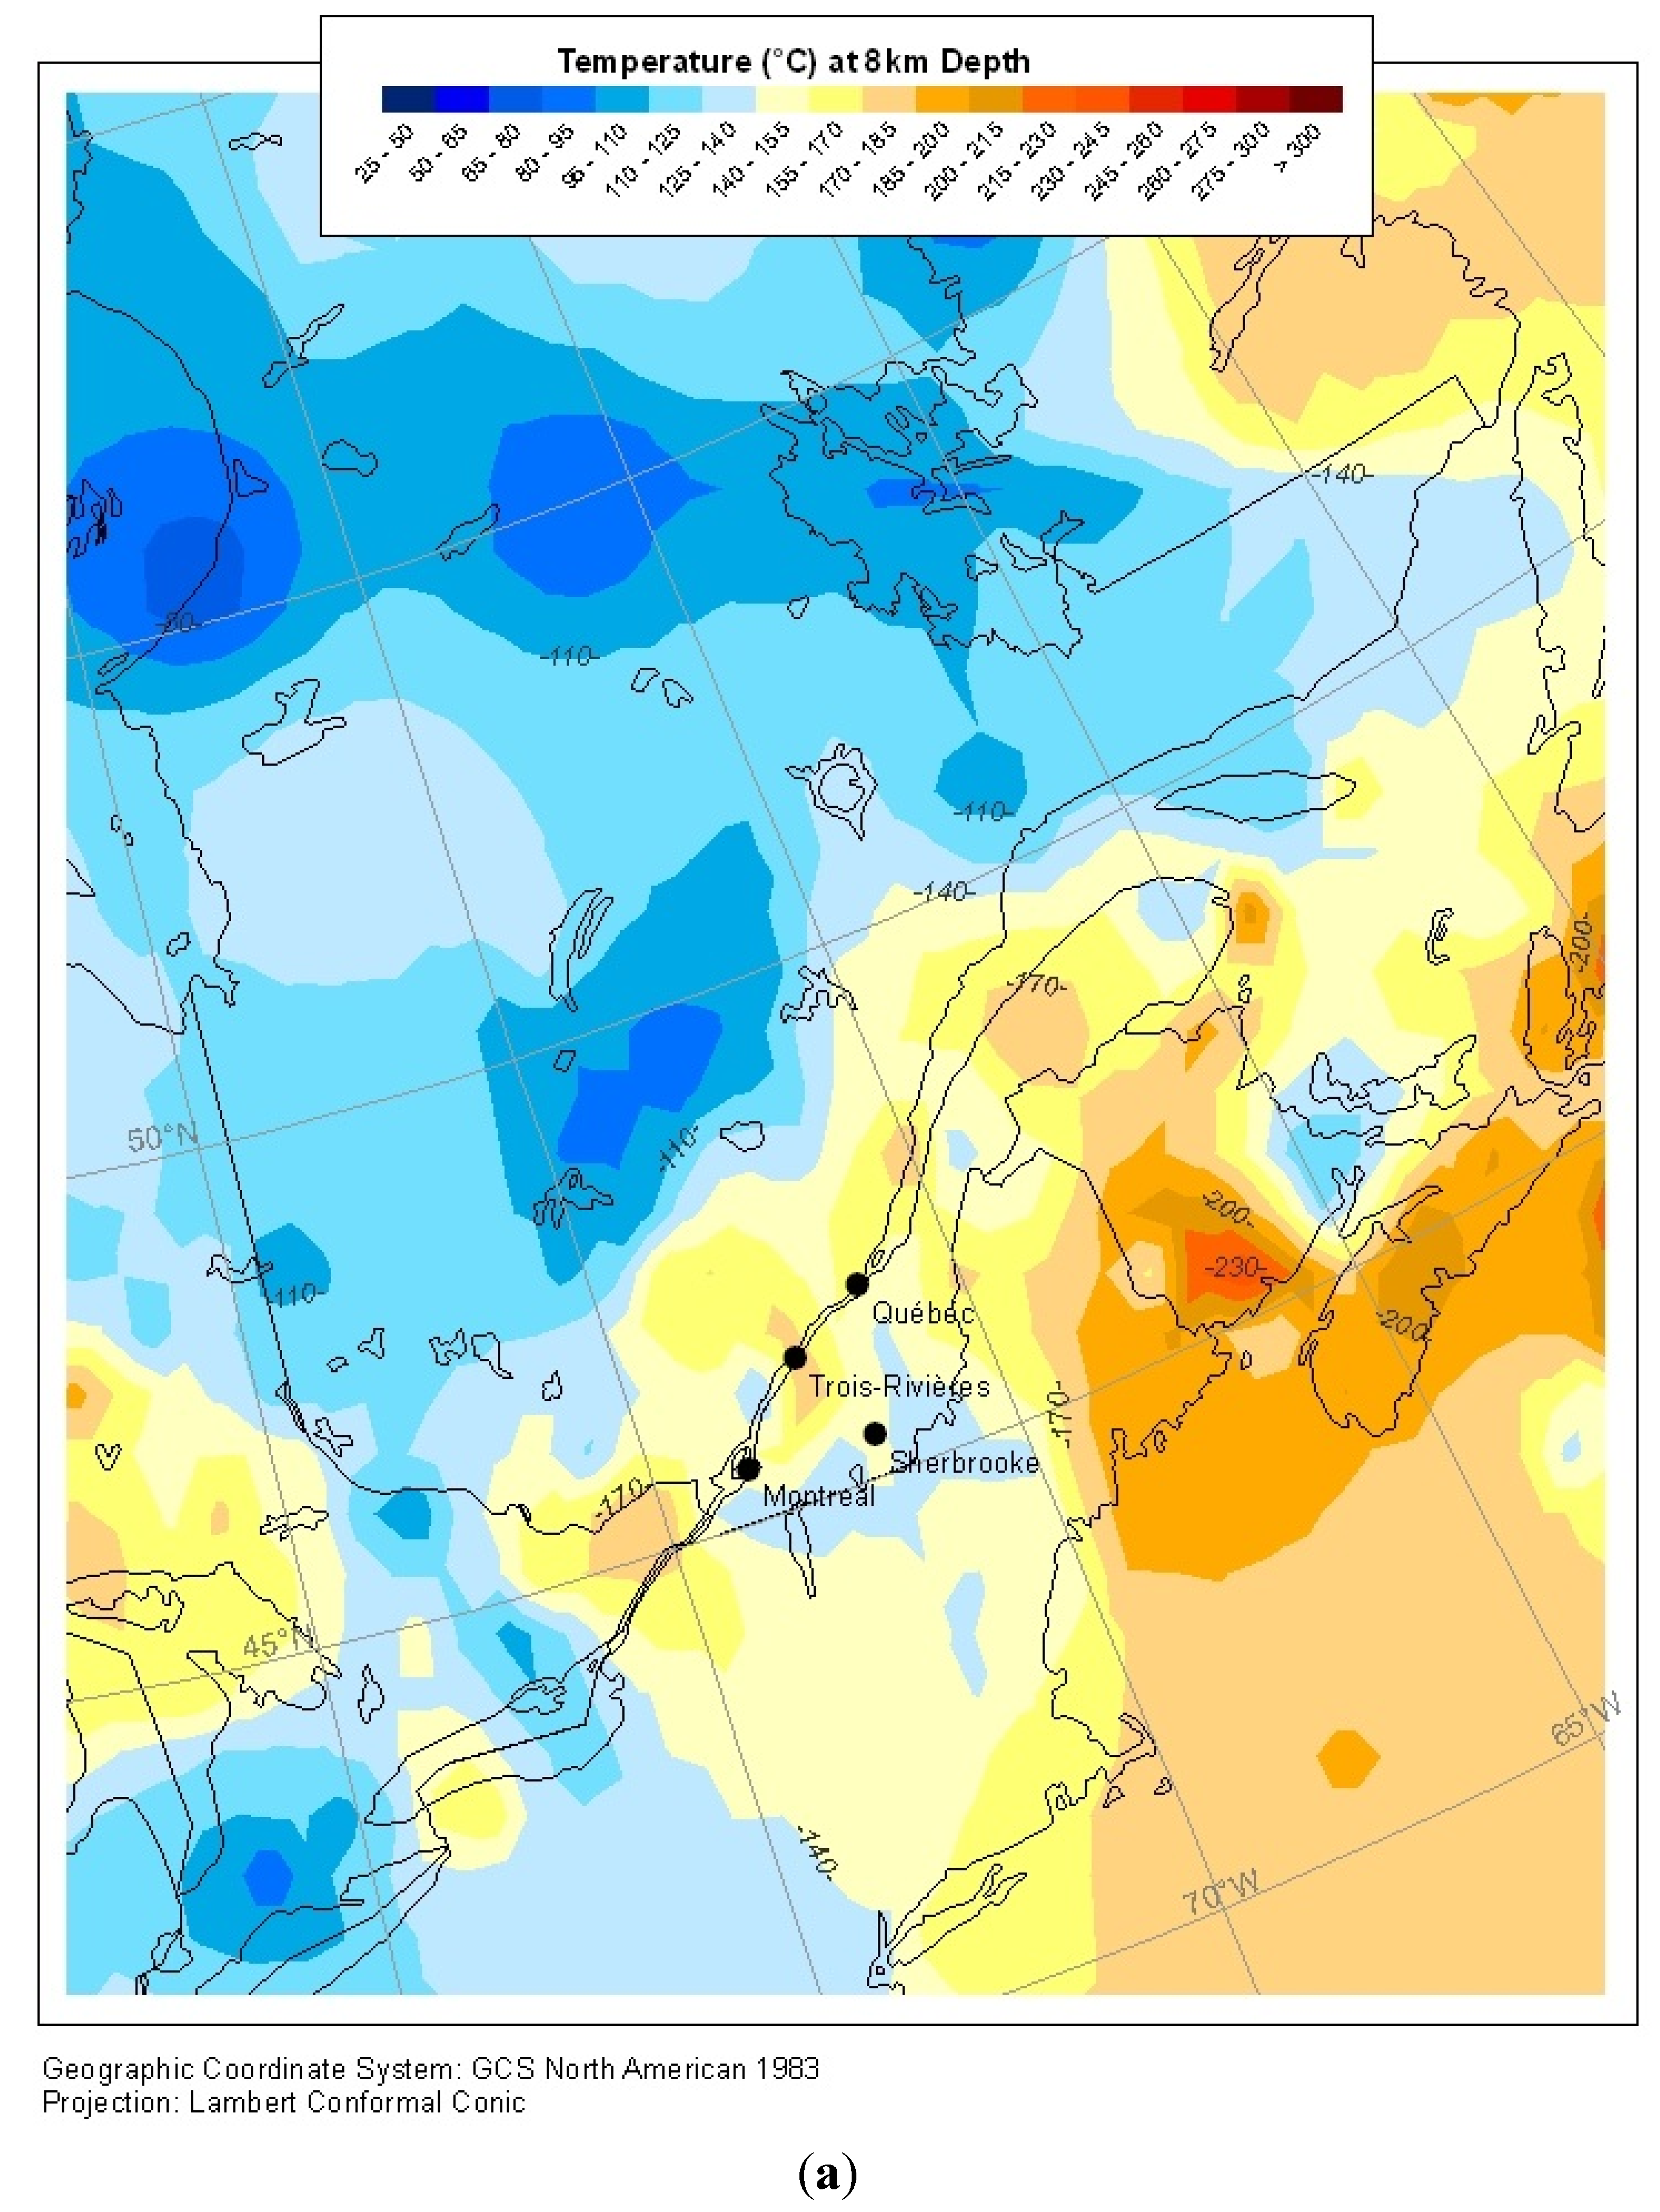
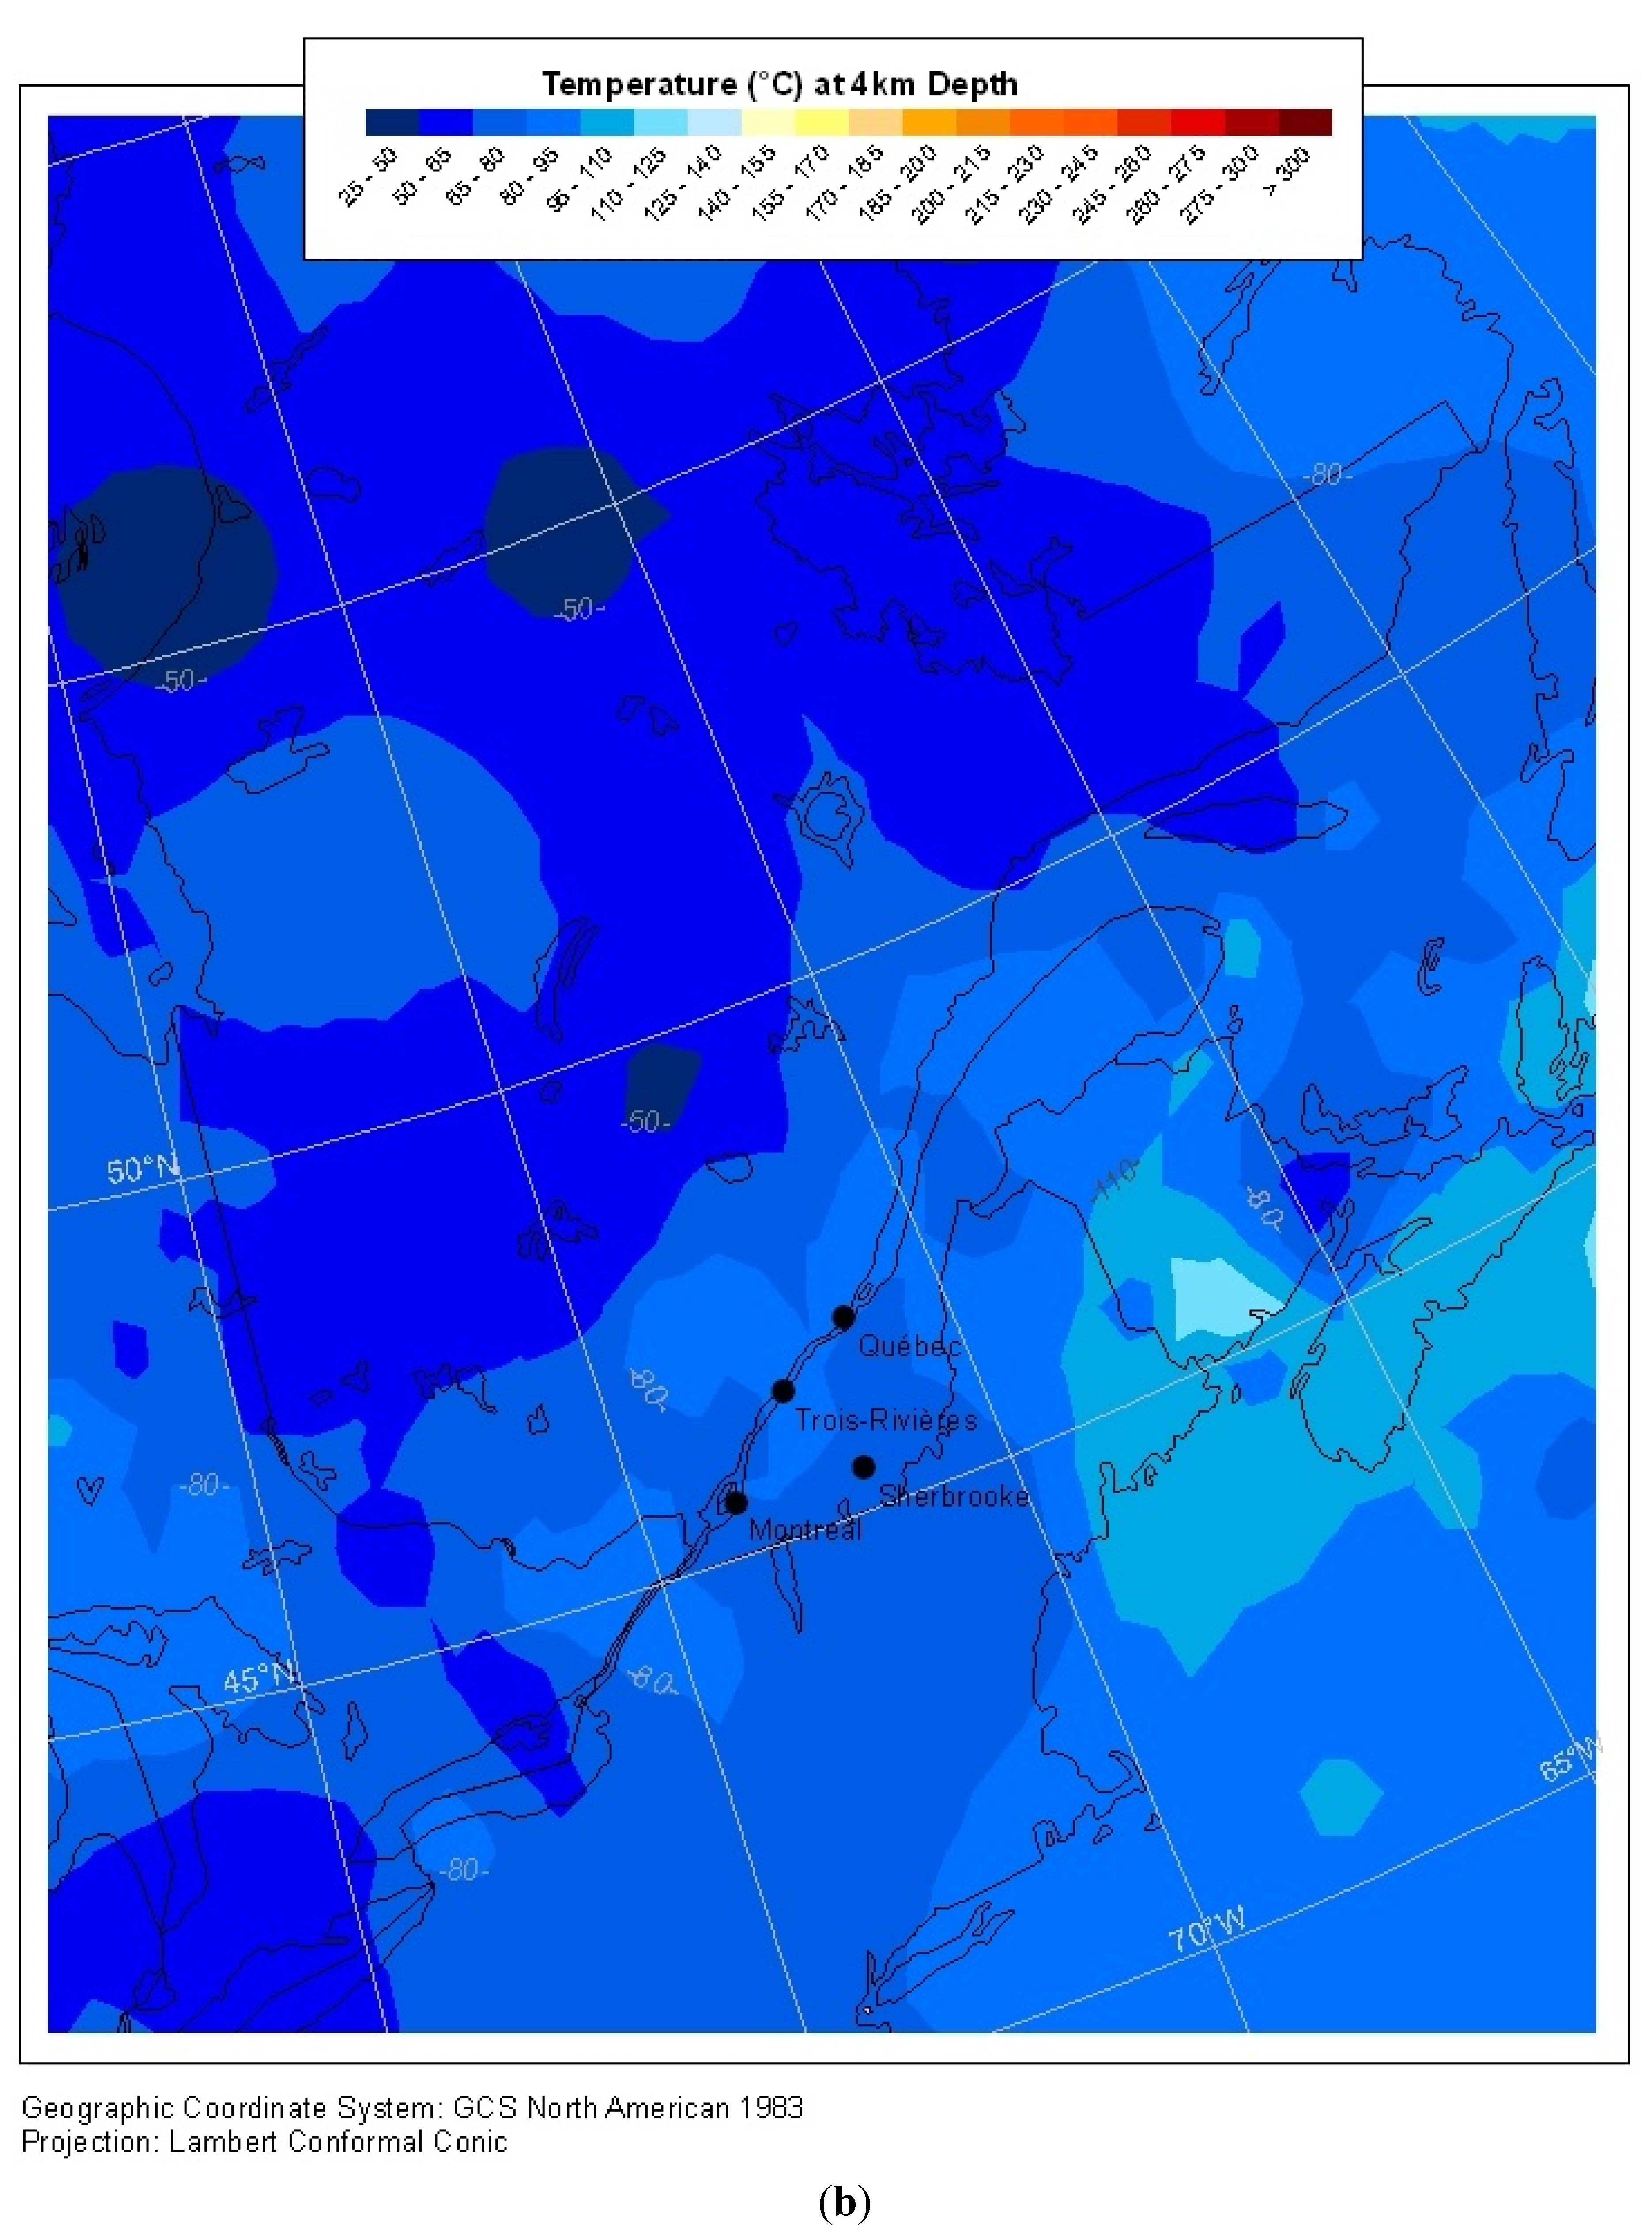
Figure 1.
(
a) Preliminary projection to temperatures at 8 km and 4 km (
b) from the Eastern Canada heat flow pattern (
c) based on high precision heat flow (crosses) from temperature logs [
6] and heat flow estimates (triangles) from bottom-hole temperatures (BHT) [
3] for the average thermal conductivity of 2.5W/m K.
1.2. In the Perspective
For comparison, geothermal gradients of some 40–50 °C/km are found in the areas of the EGS power generation projects in Soultz-sous-Forêts (France) and Landau (Germany) [
7]. To reach temperatures drilled in Landau at some 3 km (160 °C) would require drilling to a depth of 8 km in most of the southern Quebec St. Lawrence corridor (see
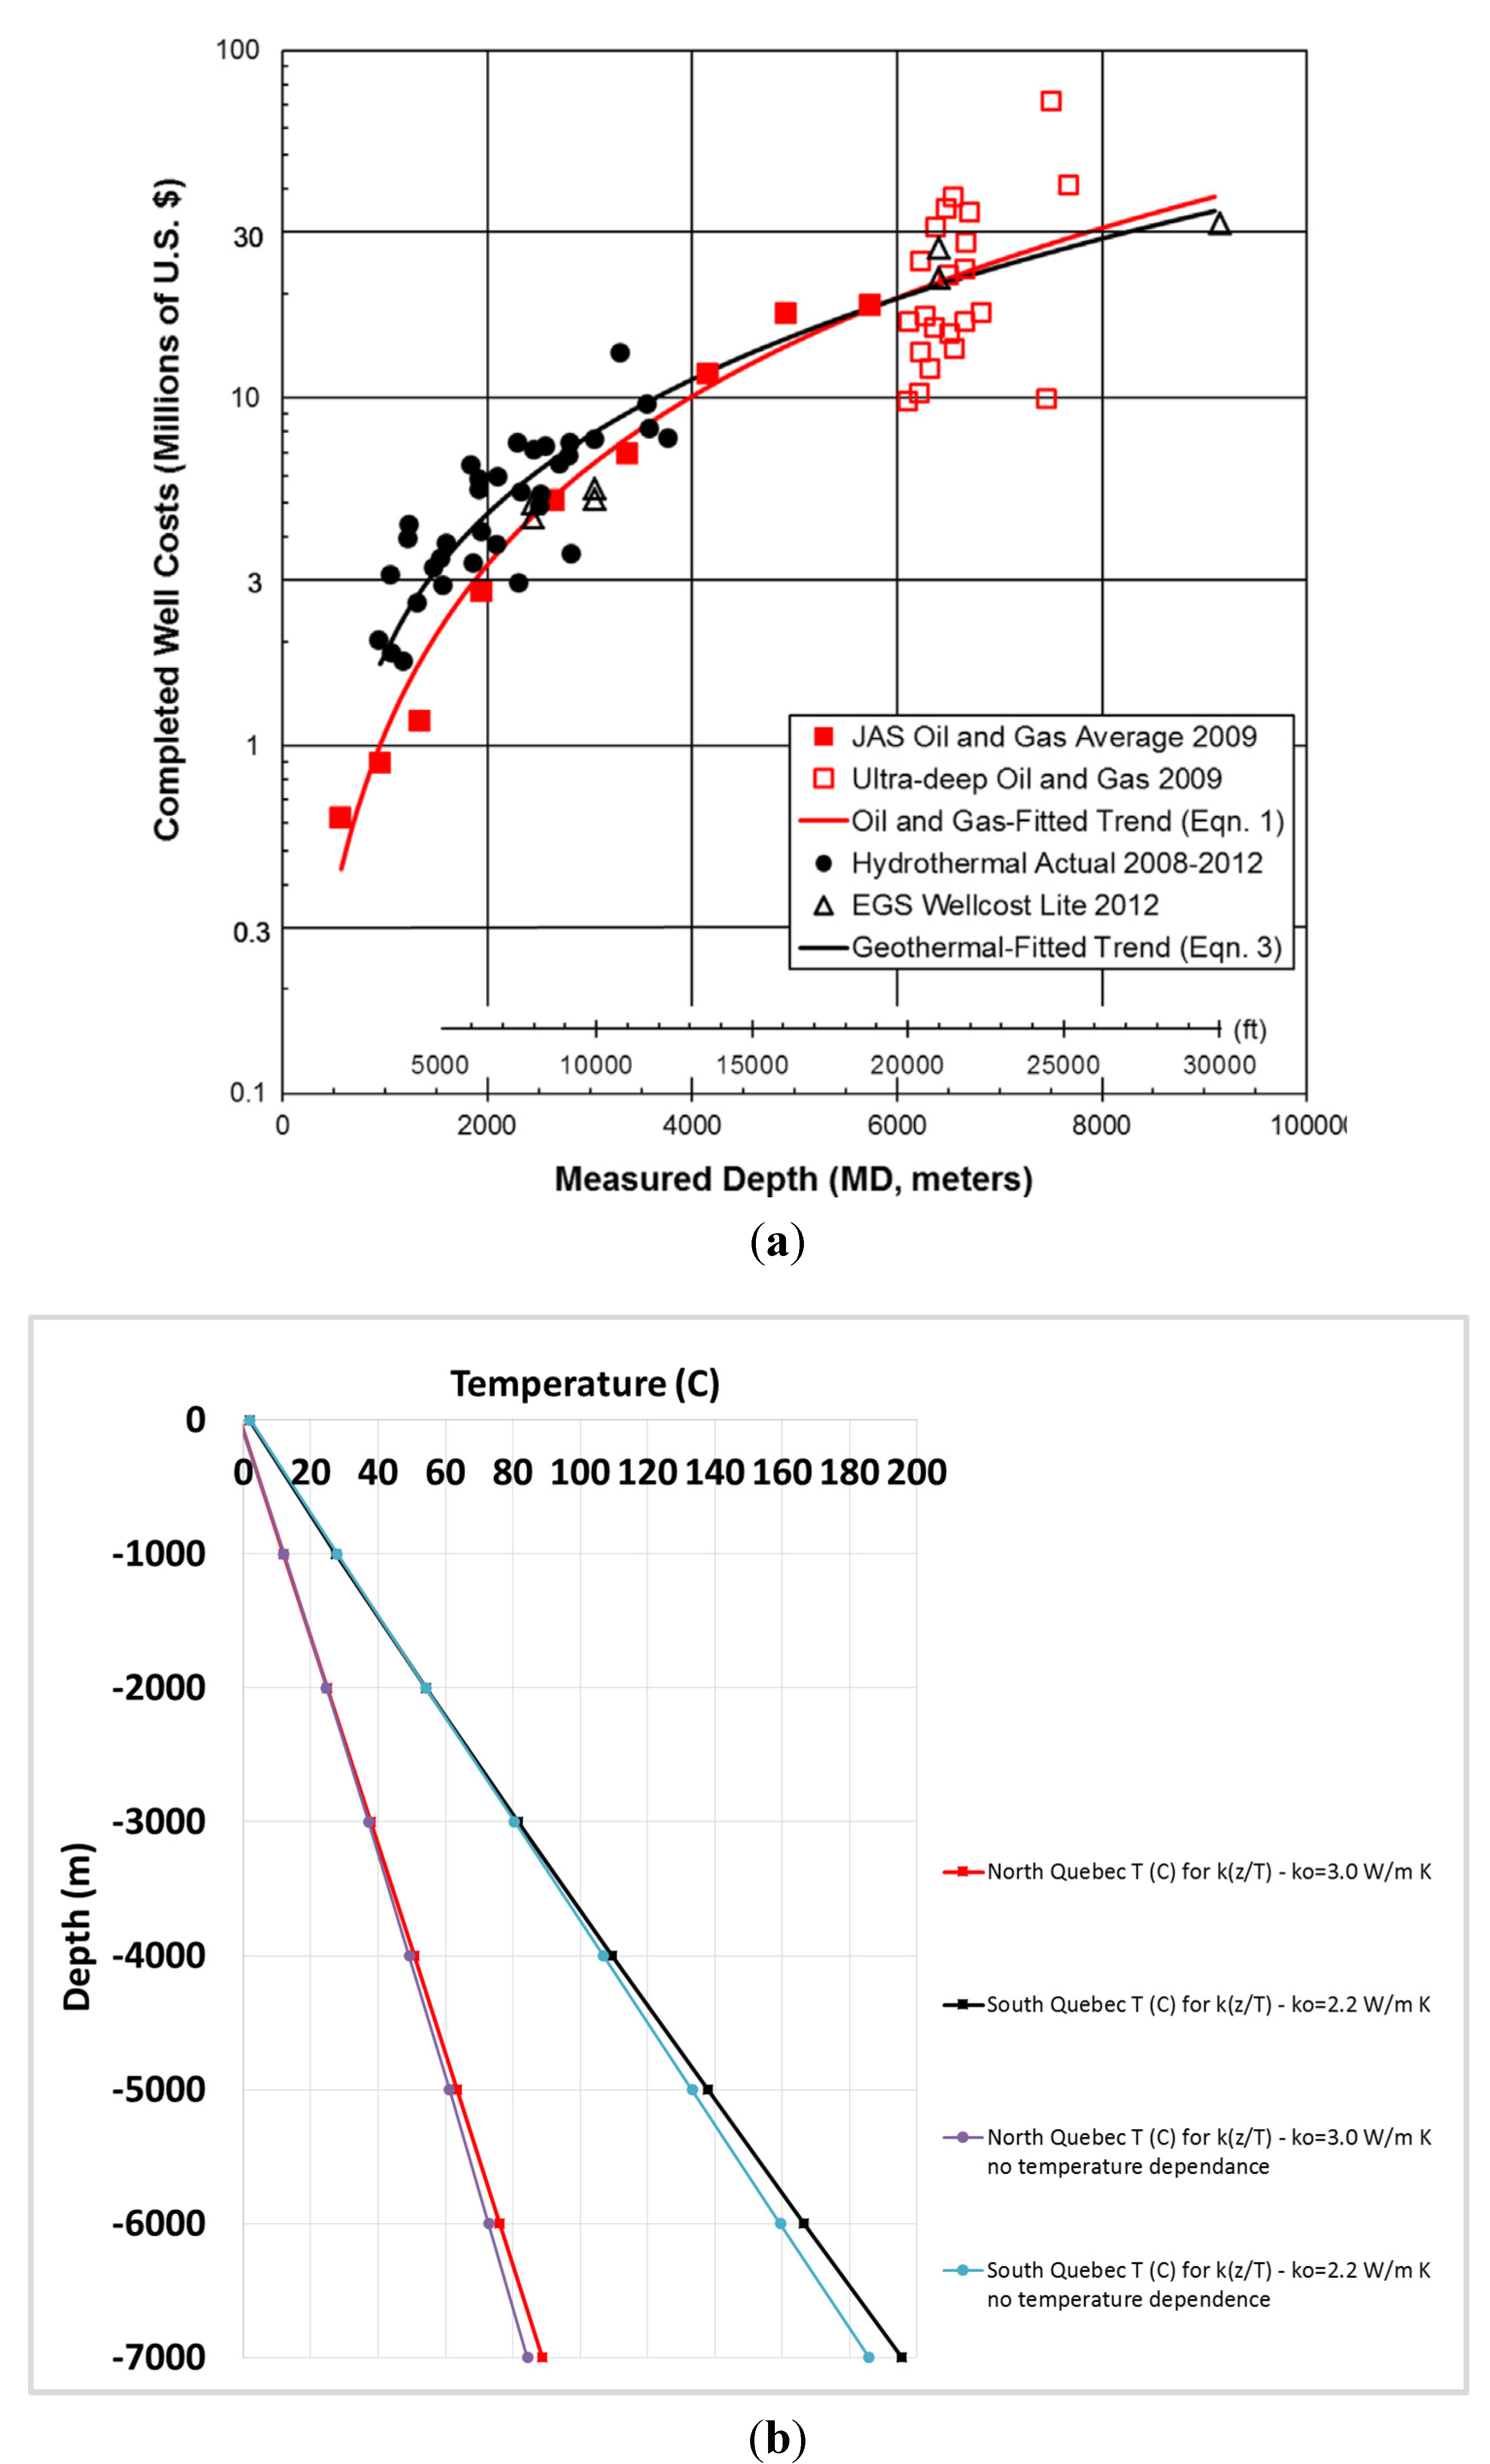
Figure 1a). In this perspective, Québec’s temperatures are by far lower than in the above-referenced high heat flow areas, and prospects for EGS power production are limited to very deep permeable horizons. These are unlikely to be used economically in the near future, due to the high drilling cost [
2,
8] (see
Figure 2a).
Figure 2.
(
a) Cost analysis of geothermal drilling
vs. oil and gas drilling according to [
2] and (
b) the cost assigned to temperature-depth prediction.
Figure 2.
(
a) Cost analysis of geothermal drilling
vs. oil and gas drilling according to [
2] and (
b) the cost assigned to temperature-depth prediction.
The geothermal resources of the shallower parts (some 1–2 km) could be used for warm water provision (>30 °C) or district heating (>60 °C) in urban areas. For comparison, such temperatures are found at less than 2 km in the Paris basin, where geothermal heating has been in operation for the last 30–40 years [
9]. In southern Quebec, such a temperature can be reached at just above 2 km (2.2 ± 0.3 km) in sedimentary aquifers [
3,
4]. Heat from this resource can be potentially used for the CO
2 reduced future energy scenarios. The southern Quebec area may be a good example of world-common, low enthalpy geothermal resource in the shallow to deep basinal environment with feasible energy to be used for heating in the future in cold environments.
3. Geological Constrains to Future EGS Projects in Québec
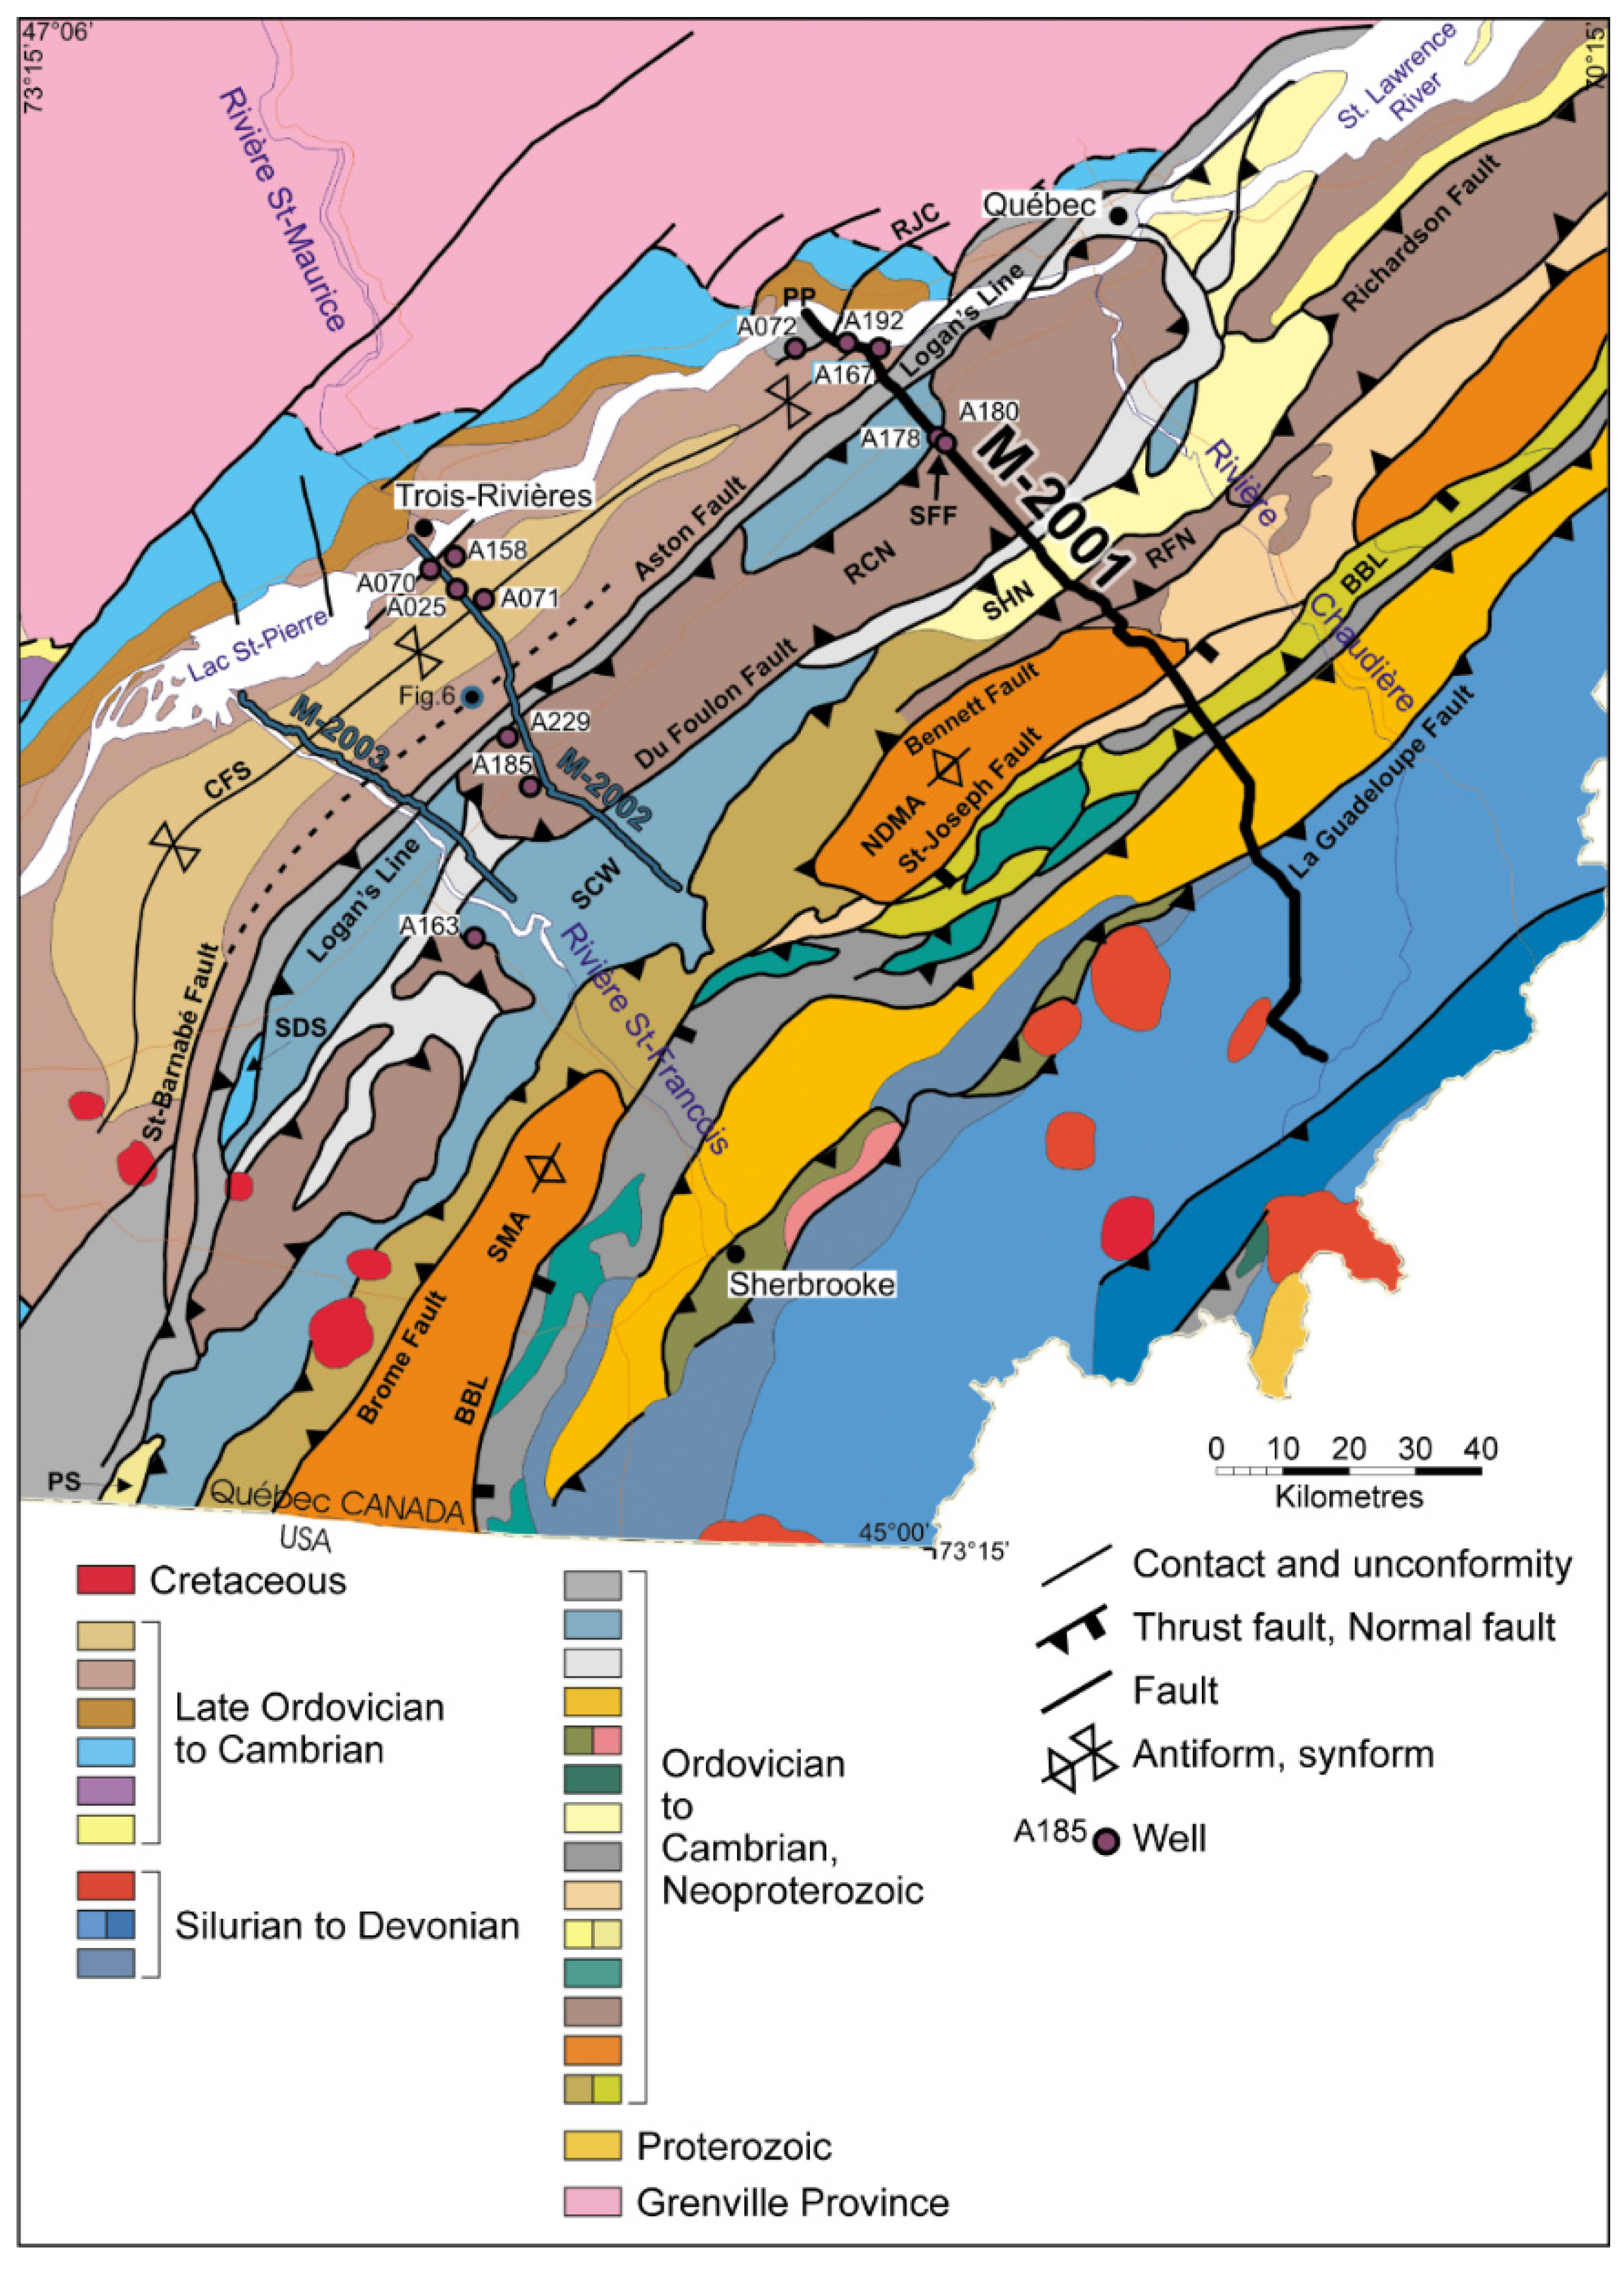
The three seismic profiles across the basin,
i.e., Ministère des Ressources naturelles du Québec M-2001, M-2002 & M-2003, are shown in
Figure 3. These 280 km of reflection seismic data provide images of the St. Lawrence Platform and the Appalachian foreland thrust belt of southern Québec. Profile M-2001, the longest profile, extends across the full width of the southern Québec Appalachians. The St. Lawrence Platform is bounded to the northwest by the Grenville basement and to the southeast by Appalachian thrust faults (
Figure 3). Resting non-conformably, the basement rocks are Cambrian siliciclastic rocks of the Potsdam Group (
Figure 4). Sedimentary rocks of the St. Lawrence Platform thin towards the shield with exposed intrusive rocks in the north-northwest [
10] and deepening towards the south-southeast.
According to previous studies [
10,
11], the geology broadly comprises:
A shallow basin (<750 m of sediments on top of crystalline basement), which exists in the area northwest of the lineament called Faille de Yamaska;
An intermediate depth basin (1250–2500 m), which exists between the Yamaska Faille and major lineament to the southeast, called Ligne de Logan (Logan lineament);
A deep basin, which exists in the area southeast of the Logan lineament, where sediments are >2500 m thick.
Figure 3.
Simplified geological map of the St. Lawrence Lowlands and southern Quebec Appalachians with the location of seismic profiles and wells adopted from [
10,
11].
Figure 3.
Simplified geological map of the St. Lawrence Lowlands and southern Quebec Appalachians with the location of seismic profiles and wells adopted from [
10,
11].
Post-stack seismic data processing has improved the quality of the original seismic sections by enhancing coherent reflection events and attenuating reflection noise. The seismic interpretations [
10,
11] provide new information on subsurface geology, including the recognition of complex structural patterns in platform and foreland units, the presence of a triangle zone at the structural front and the geometry of thrust slices of platform units and Appalachian thrust nappes. The M-2001 line also provides images of the internal Humber Zone, including back-thrust faults on the flanks of the Notre Dame Mountains Anticlinorium and mega thrust wedges, possibly involving the Grenville basement, within the core of the anticlinorium. In southern Québec, conventional aquifers are recognized in the St. Lawrence Platform and Appalachian foreland. The reprocessing and reinterpretation of the seismic reflection profiles [
10,
11] has provided new insights into the structure, geological evolution and petroleum potential of the St. Lawrence Platform and the Appalachian foreland thrust belt of southern Québec.
The detailed geology shown in
Figure 3 consists of several Late Ordovician–Cambrian, Silurian–Devonian, Ordovician–Cambrian and Neoproterozoic units consisting of several sedimentary sub-groups. These are as follows: BBL, Baie Verte-Brompton Line; CFS, Chambly-Fortierville Syncline; NDMA, Notre Dame Mountains Anticlinorium; PP, Pointe Platon; PS, Phillipsburg Slice; RCN, Rivière Chaudière Nappe; RFN, Rivière Filkars Nappe; RJC, Rivière Jacques-Cartier fault; SCW, Saint-Cyrille Window; SDS, Saint-Dominique Slice; SFF, Saint-Flavien field/structure; SHN, Ste-Hénédine Nappe; SMA, Sutton Mountains Anticlinorium.
In
Figure 4, the geological cross-section is based on seismic data and its geological interpretation [
10,
11]. This was modified by adding depth lines and pin pointing the best prospects for deep EGS at the deepest sedimentary Cambrian aquifers).
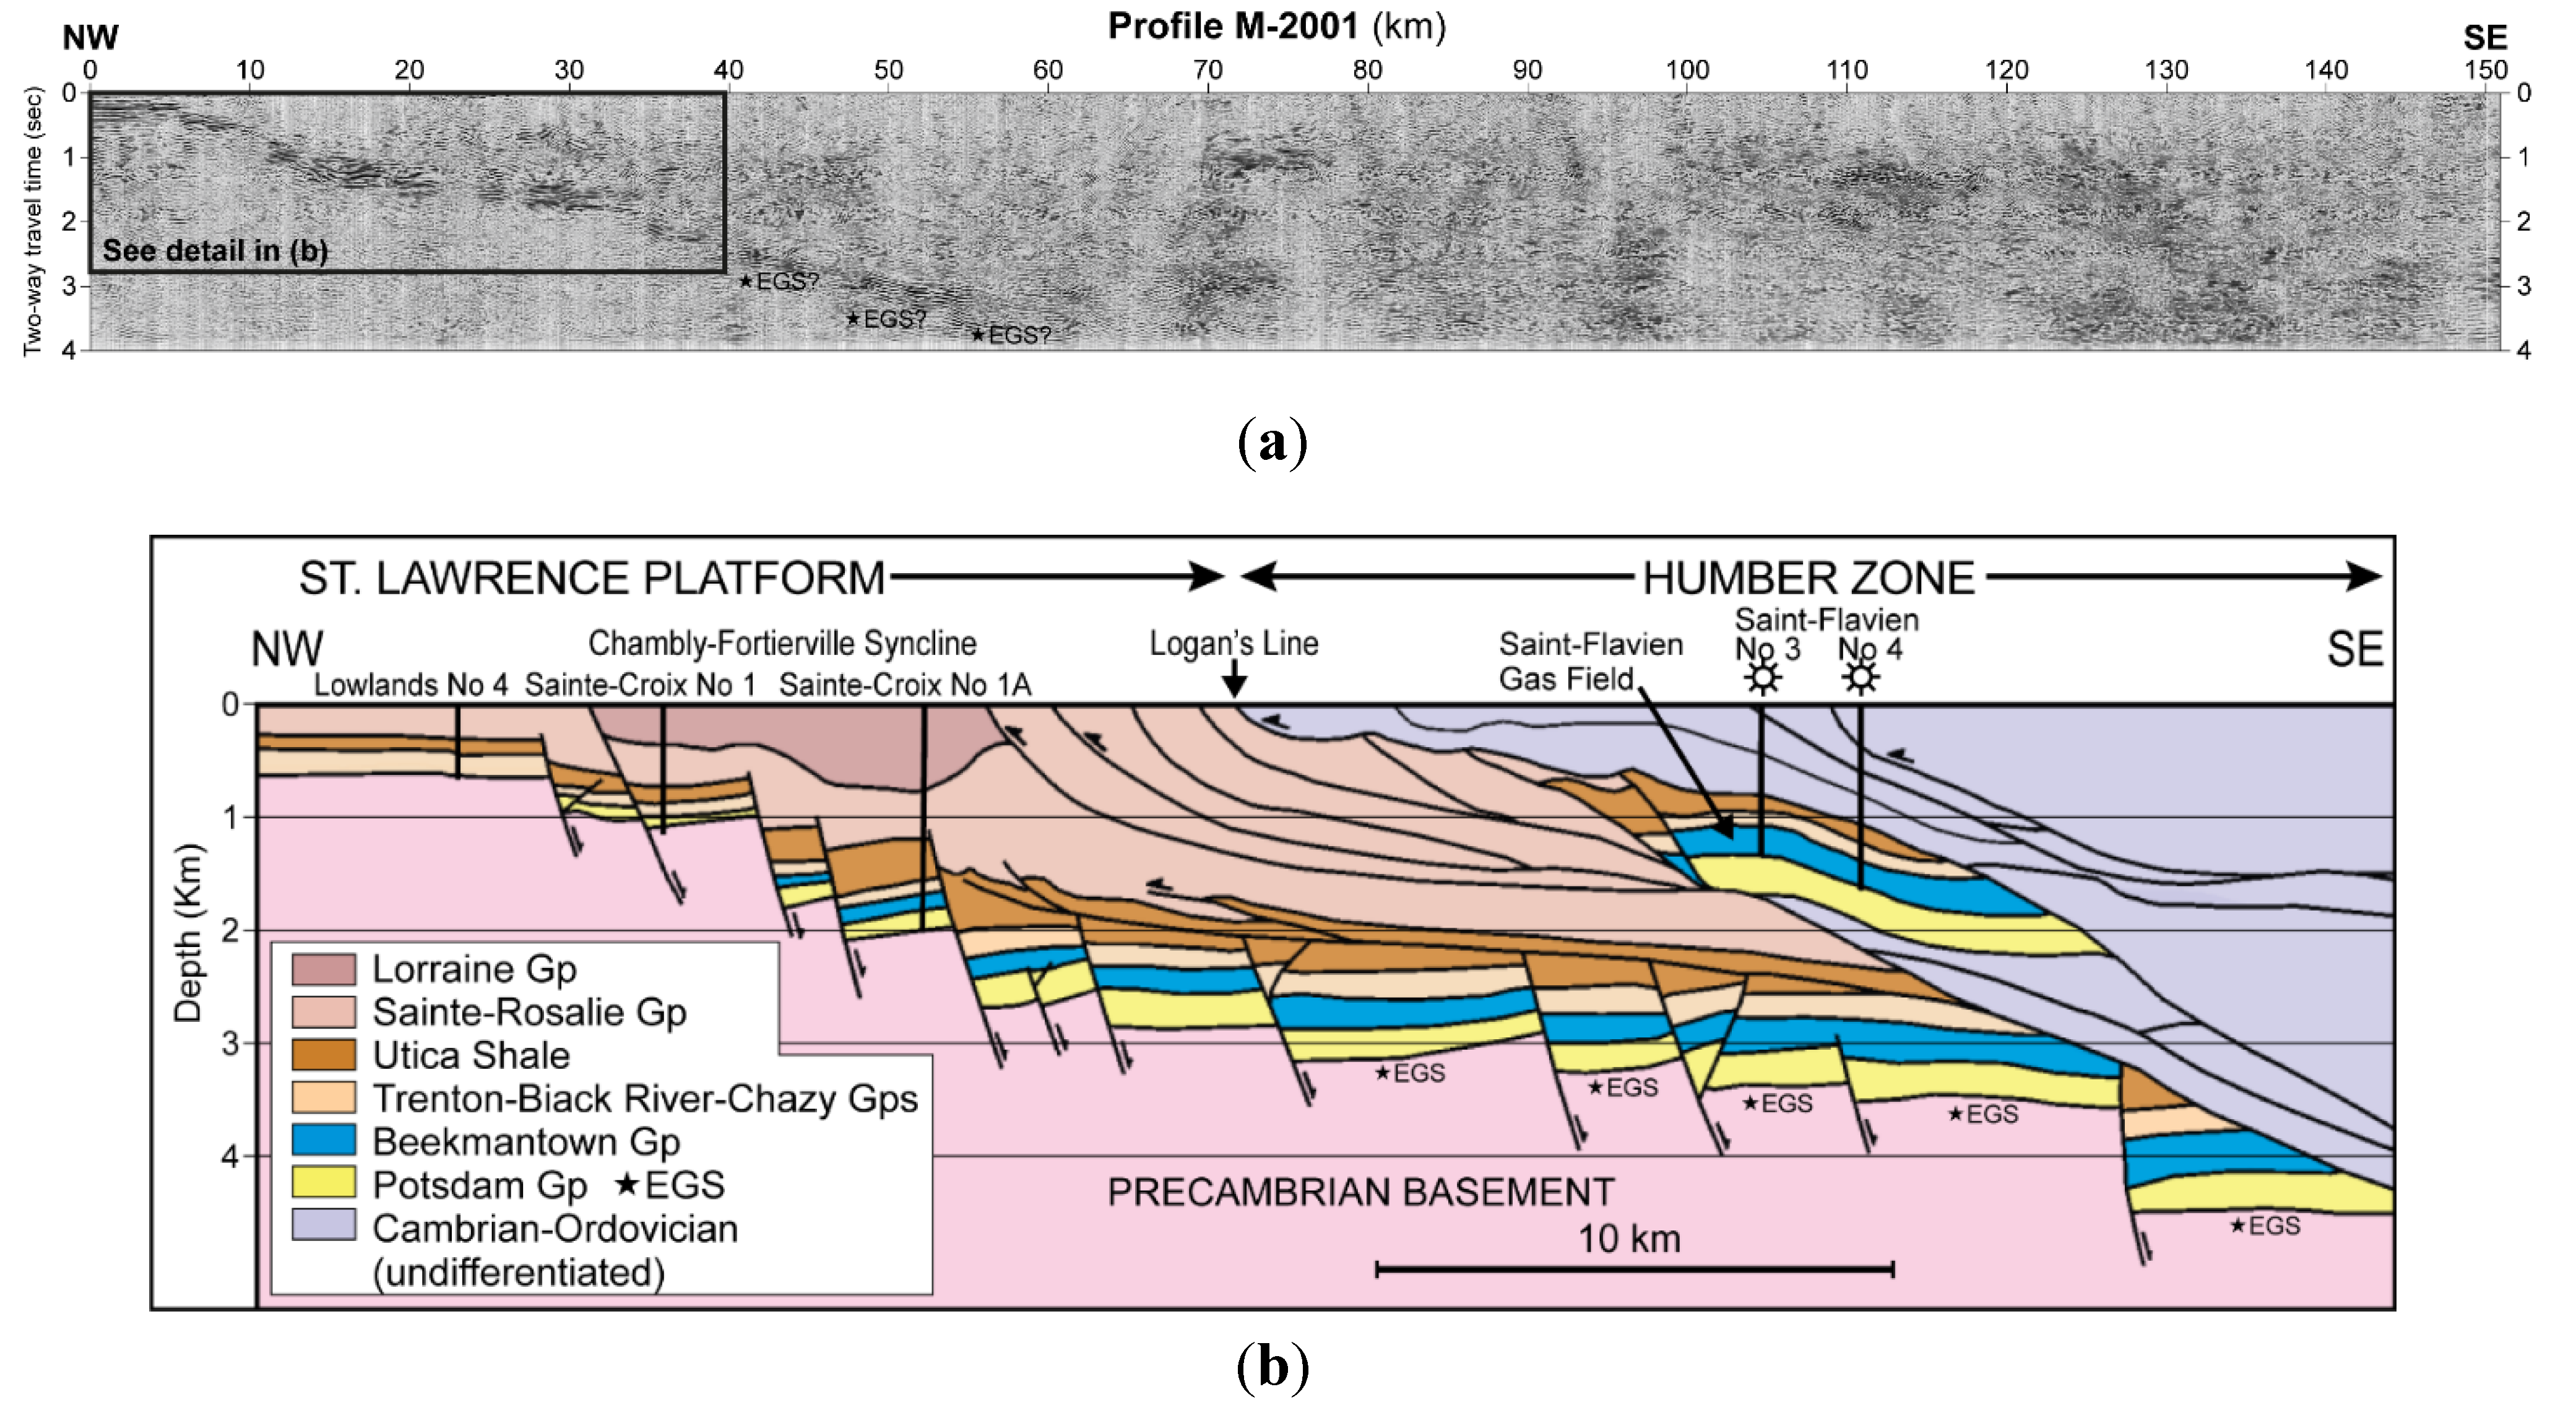
Figure 4.
(
a) Seismic profile Ministère des Ressources naturelles du Québec M-2001 according to [
11] (see
Figure 3 for the location). Upper panel, seismic profile 2001; (
b) Geological cross-section modified from [
10].
Figure 4.
(
a) Seismic profile Ministère des Ressources naturelles du Québec M-2001 according to [
11] (see
Figure 3 for the location). Upper panel, seismic profile 2001; (
b) Geological cross-section modified from [
10].
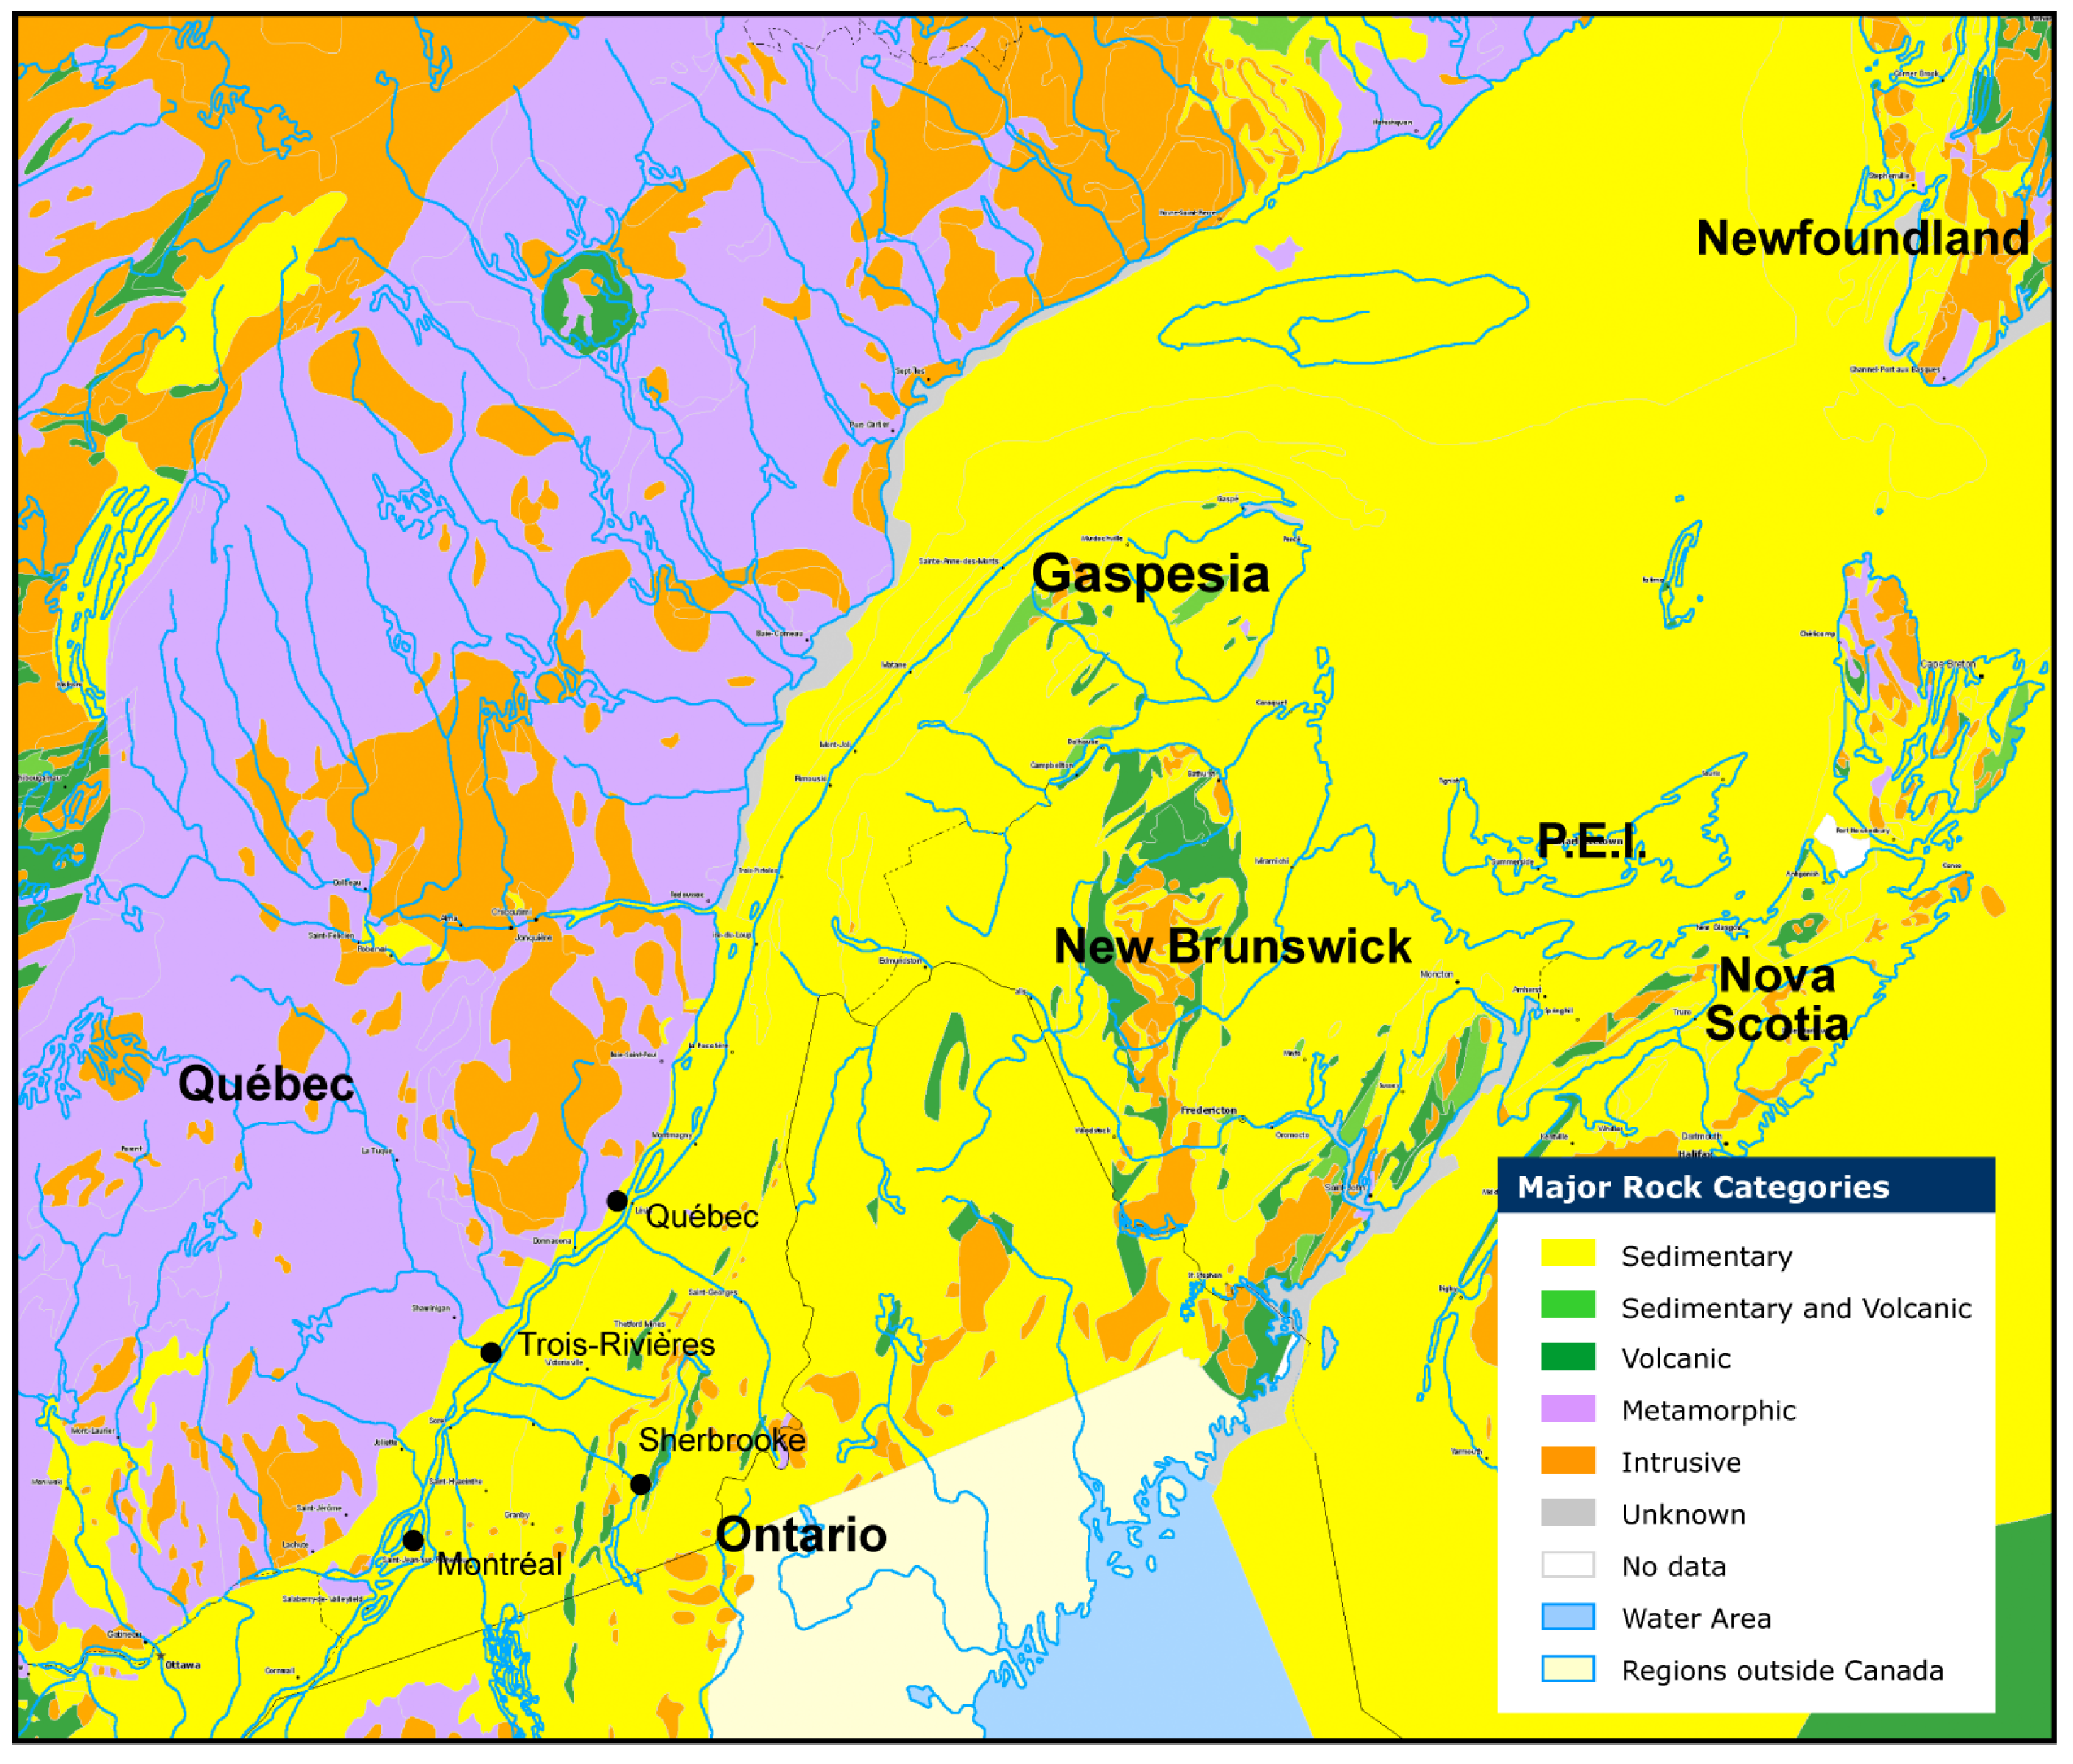
The rocks that are easiest to drill for the geothermal projects are sedimentary rocks of the platform, which are of rather modest thickness near the shield, built of crystalline metamorphic and volcanic rocks (
Figure 5).
The platform to the south is the area marked in yellow in
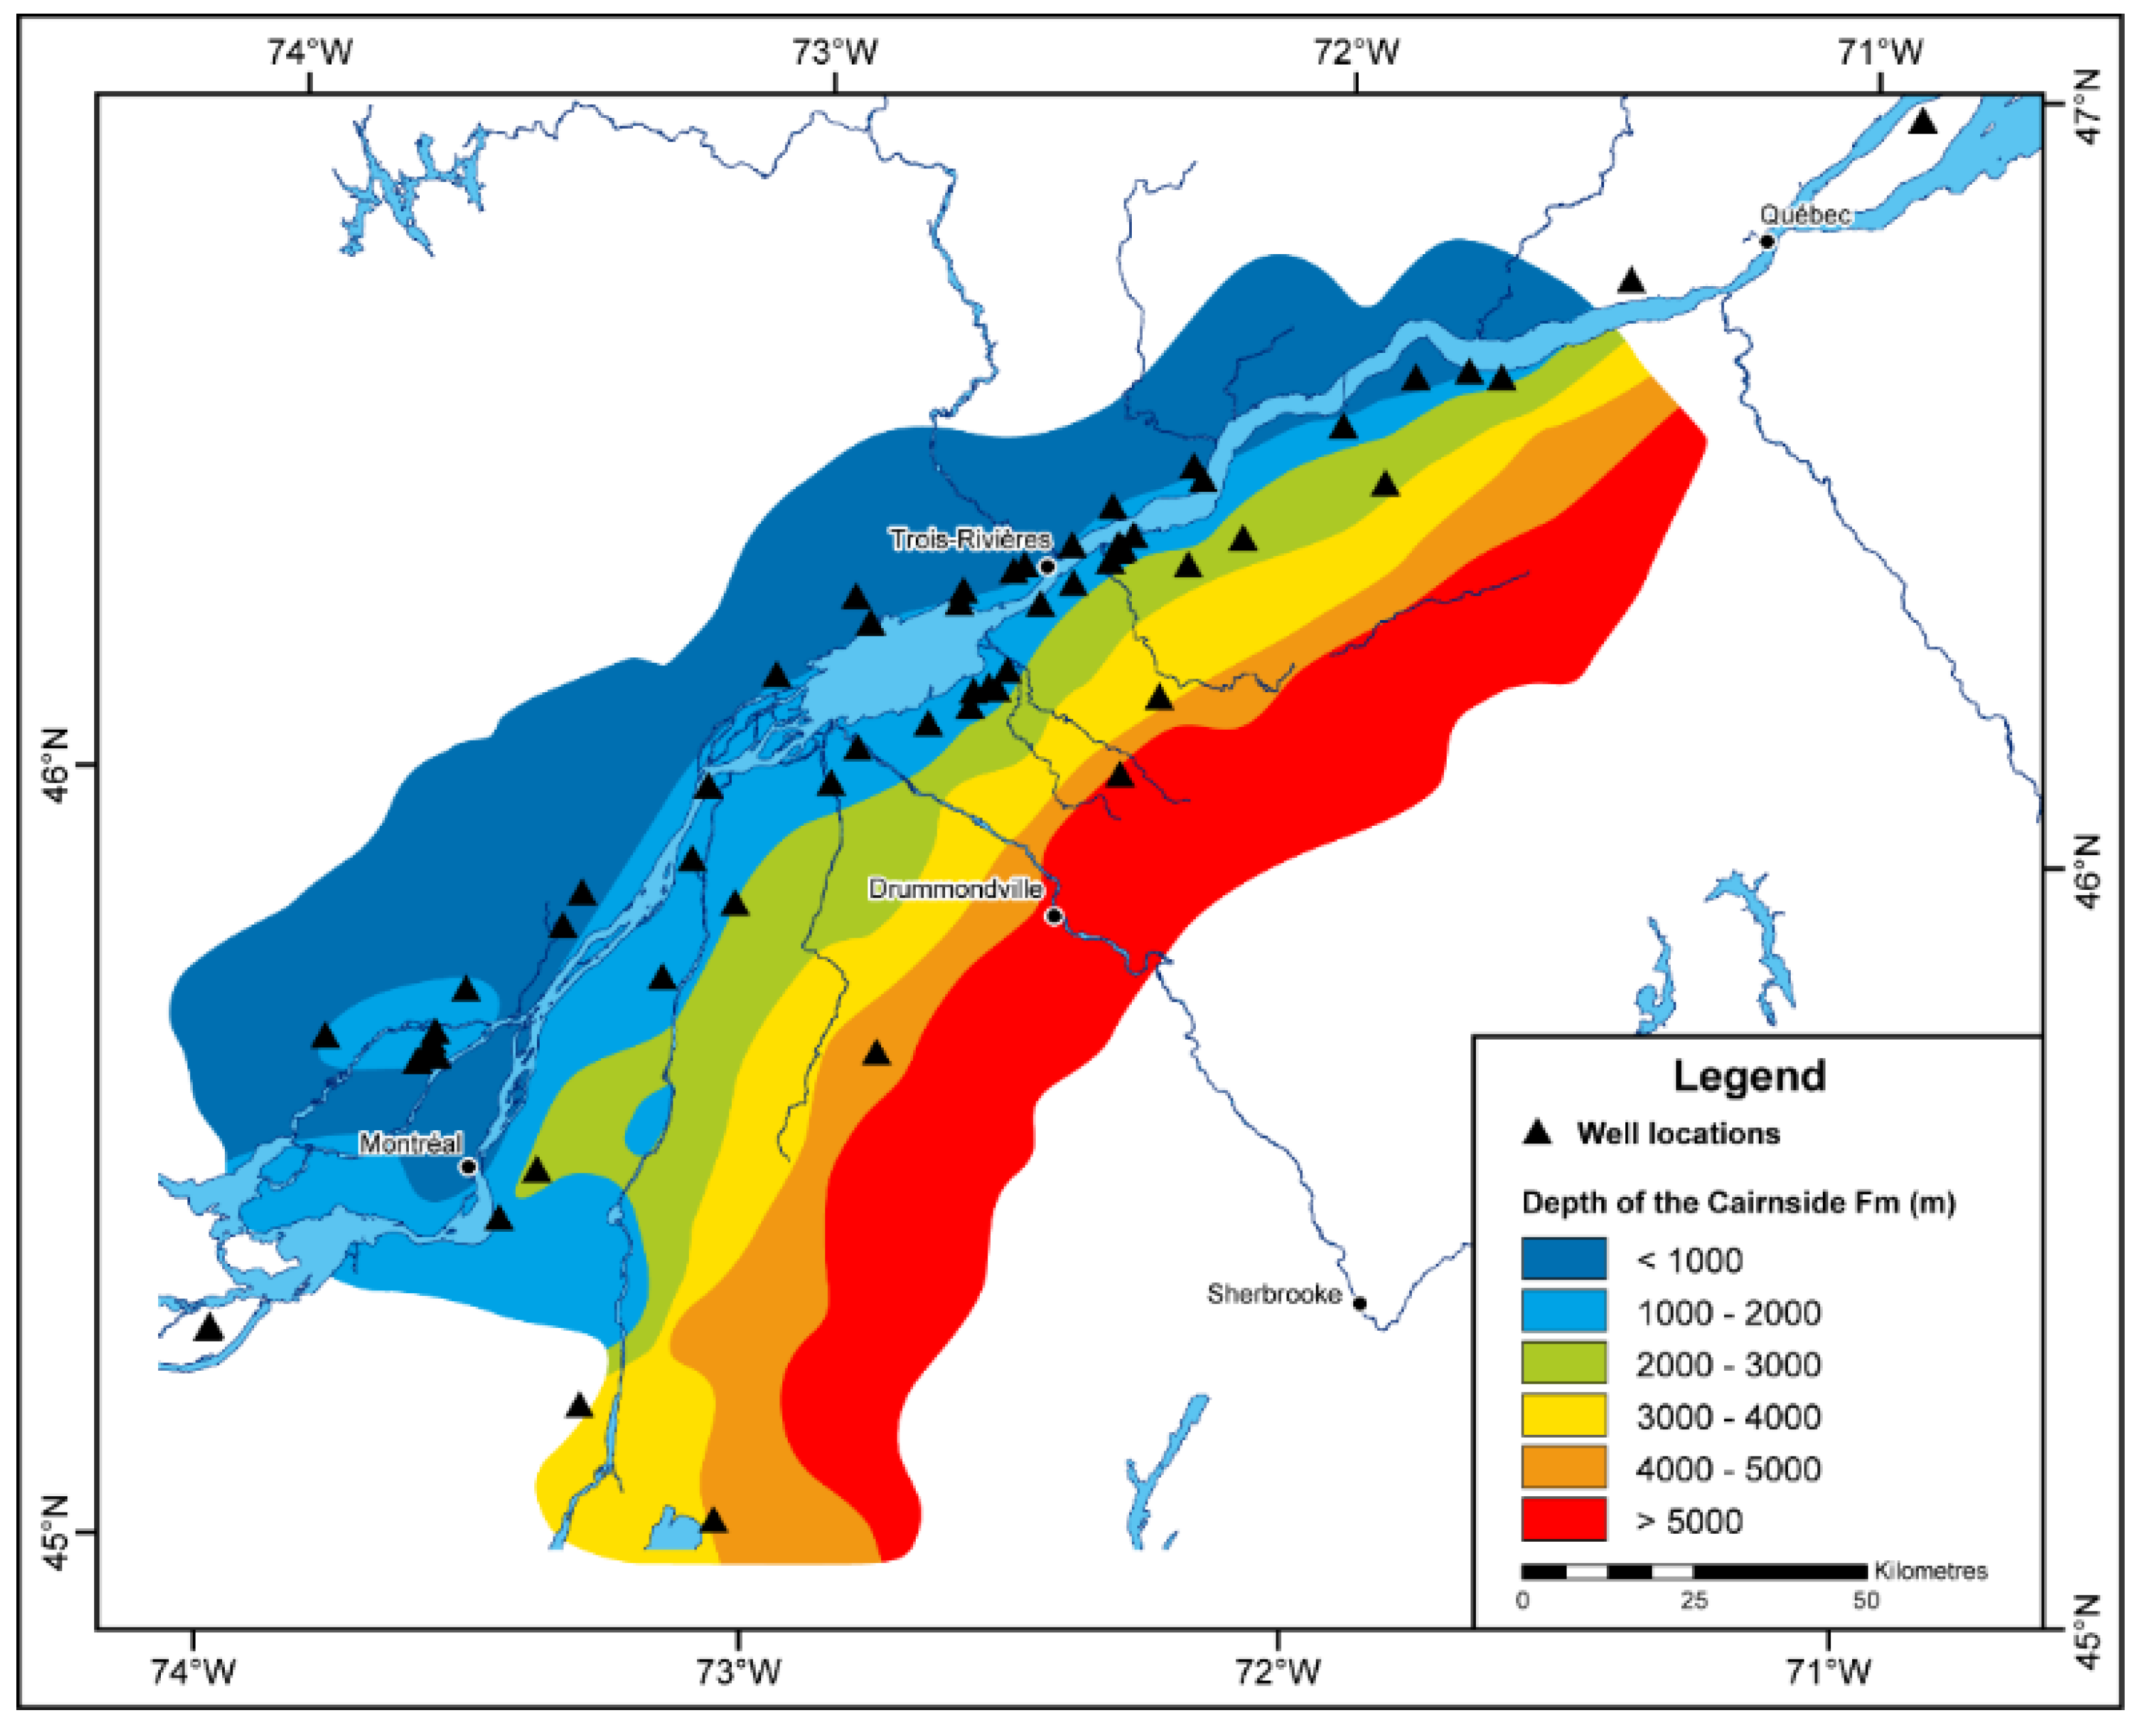
Figure 5. There, the sediments overly a crystalline basement. Some of the sediments are aquifers with porosity and permeability like the deepest Cambrian Potsdam Group aquifers. These will have variable depth from the surface. It will be just meters in the northwestern part of the platform near the boundary with outcropping metamorphic rocks of the Grenville province of the Canadian Shield and several kilometers in southeastern Québec towards the Appalachians [
4] (see
Figure 6).
Figure 5.
Distinction of different rock types (Geological Survey of Canada) in the geology of Quebec and the surrounding area.
Figure 5.
Distinction of different rock types (Geological Survey of Canada) in the geology of Quebec and the surrounding area.
Figure 6.
Depth to Cambrian aquifer above the Grenville-Precambrian crystalline basement below the overlaying sedimentary cap modified from a 3D geological model of the St. Lawrence Lowlands (SLL) basin [
4].
Figure 6.
Depth to Cambrian aquifer above the Grenville-Precambrian crystalline basement below the overlaying sedimentary cap modified from a 3D geological model of the St. Lawrence Lowlands (SLL) basin [
4].
4. Uncertainty in Single Temperatures Measured in Wells (BHTs)
Unless continuous logs are done in wells that have reached thermal equilibrium (±1 °C), the determination of deep temperatures and heat content for geothermal energy prospects are just approximations.
There were many attempts to correct and compare different temperature measurements in the United States and Canadian basins, including that of Harrison [
12] and the SMU (Southern Methodist University) correction [
13]. The Harrison AAPG (American Association of Petroleum Geologists) correction, for example, is based on calibration of measured BHTs (bottom-hole temperatures) in Oklahoma, using mostly drill stem temperature (DST) data. This correction has been proven to be close to equilibrium logs or an underestimate [
14].
The following exact BHT correction equation is used [
12]:
where ΔT
c is temperature correction subtracted or added to the original BHT values and
z the depth (m).
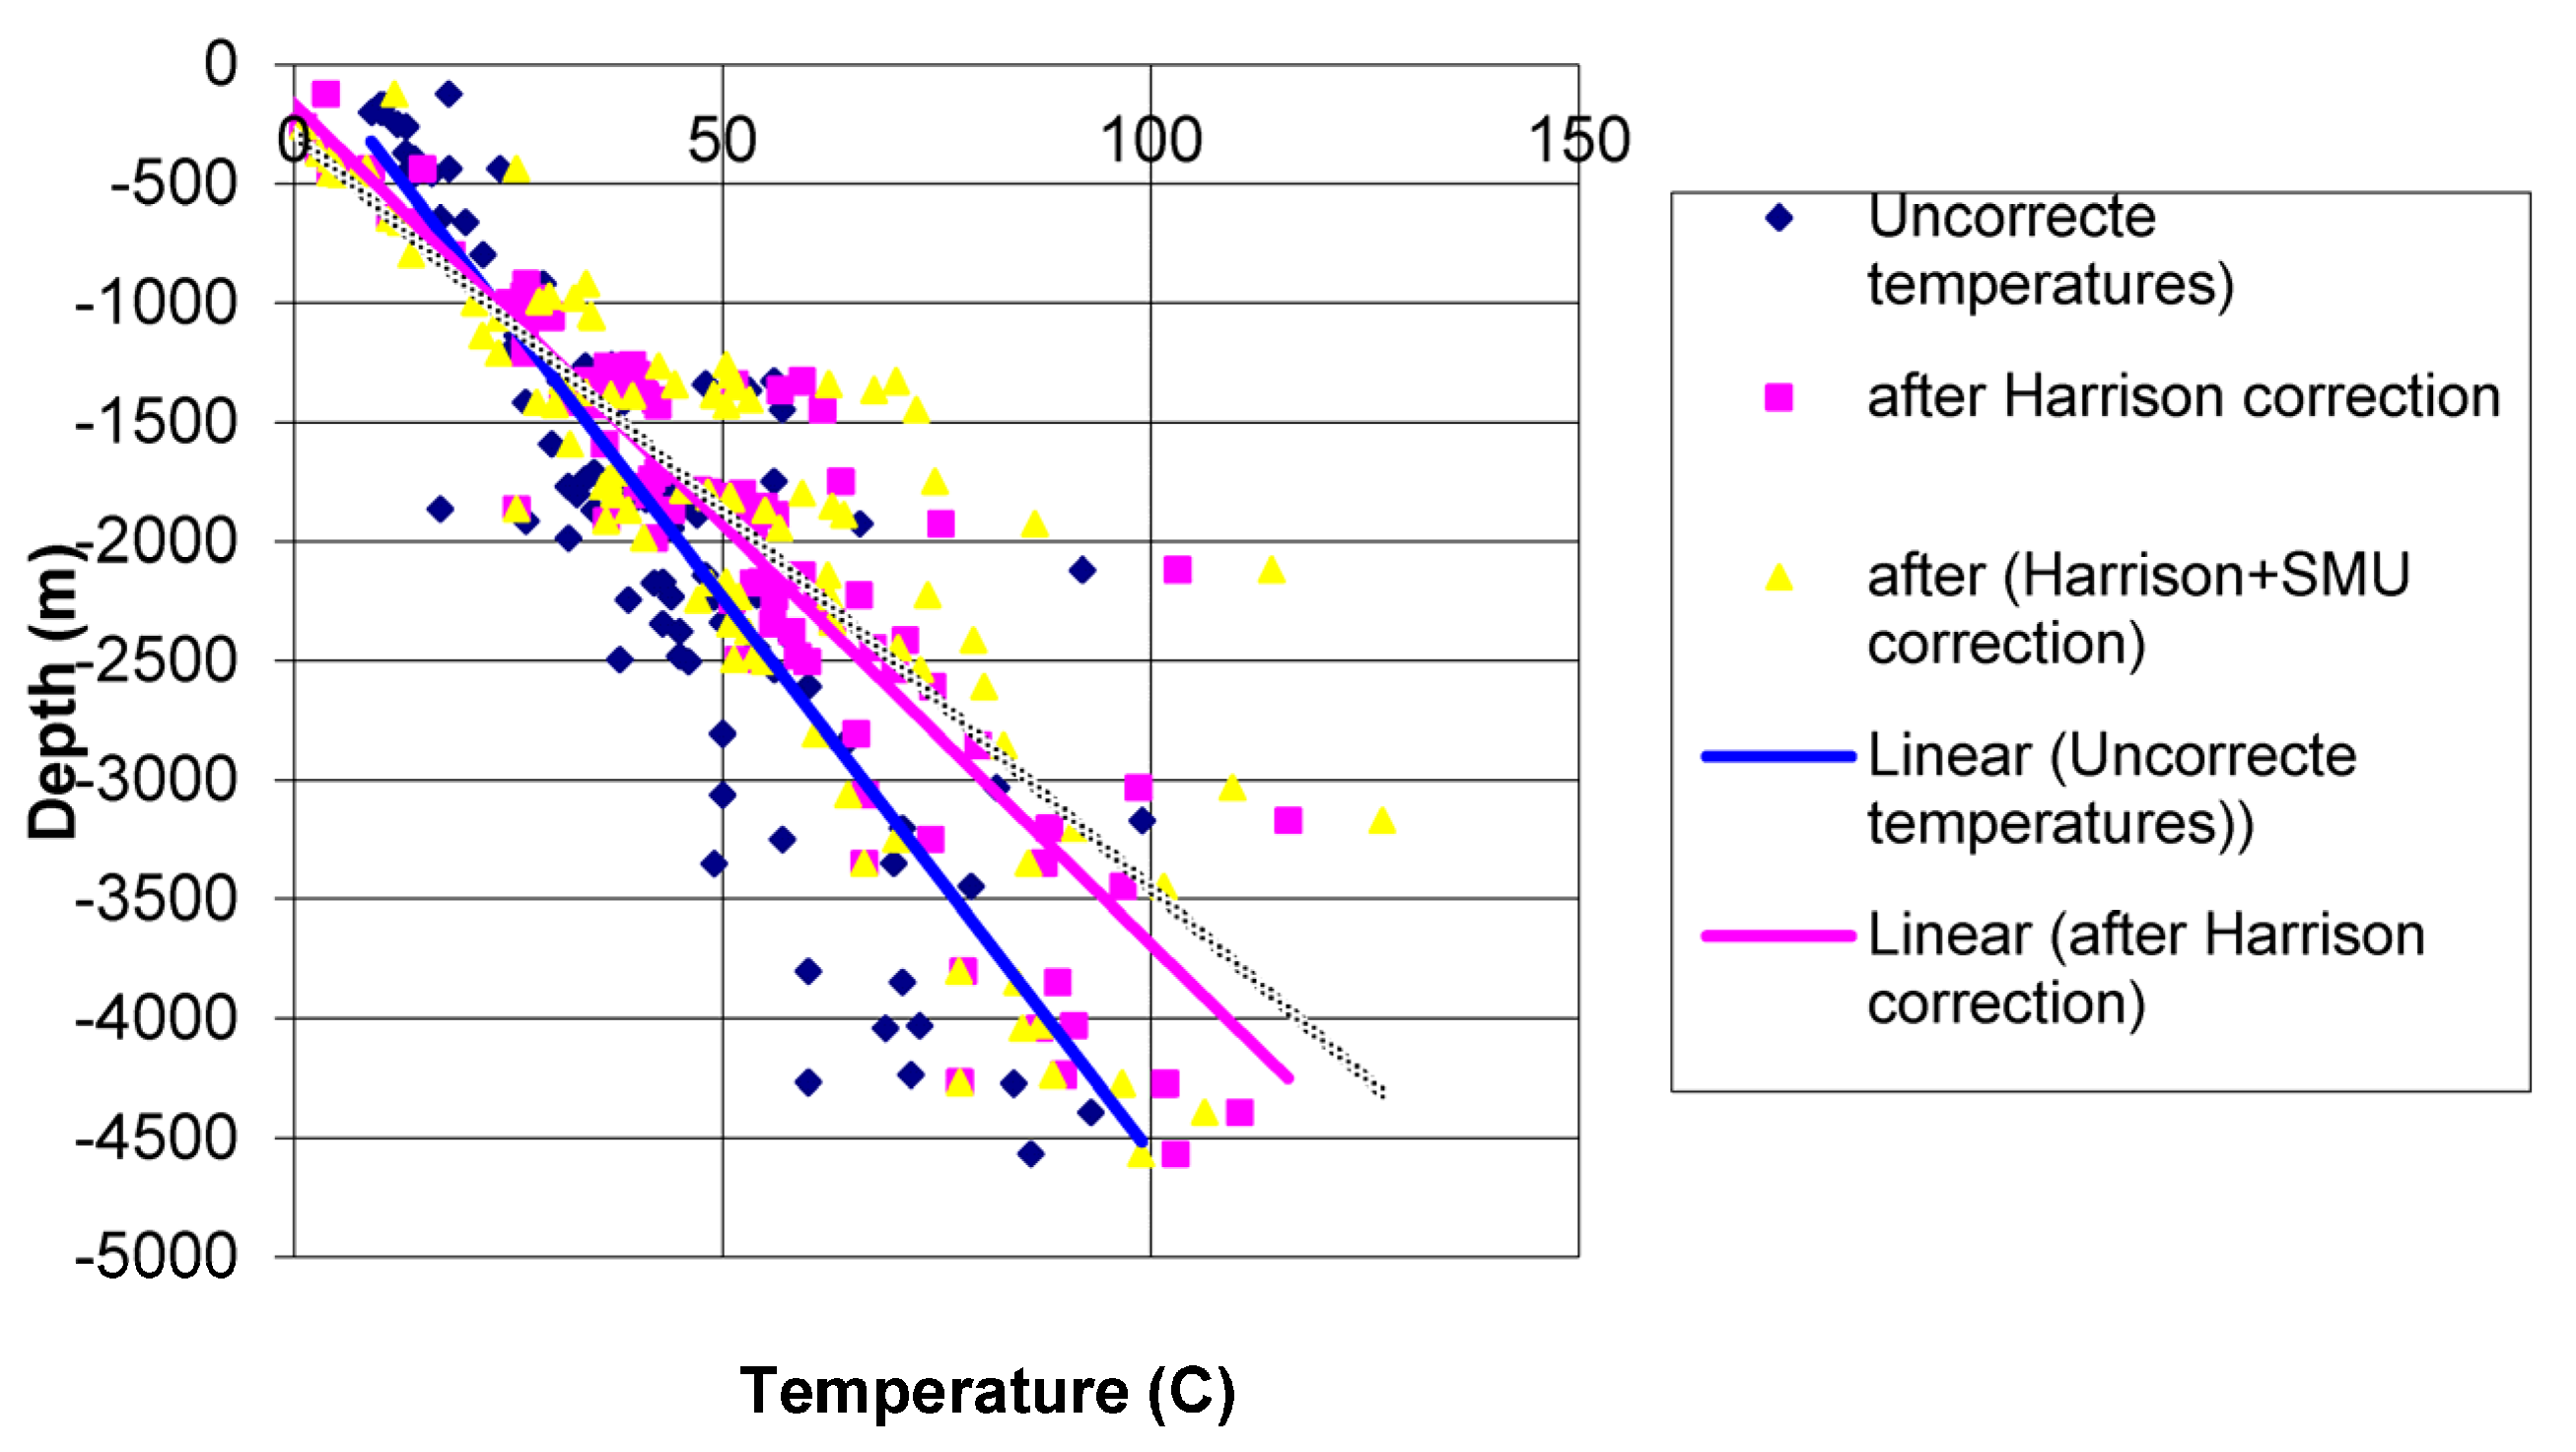
The geothermal gradient, based on the Harrison-corrected temperatures, is higher than for the uncorrected data (24.1 °C/km
vs. 16.2 °C/km). Corrected values imply the average temperature to reach 120 °C under
circa 5 km for MRNFQ (Ministère de l’Énergie et des Ressources naturelles Quebec) database reported wells. After application of the Harrison [
12] correction, we have applied SMU [
13] correction. According to [
13], the Harrison correction was still a bias related to the depth/gradient/temperature difference, so a secondary correction (SMU) [
13] that was a function of the BHT well gradient was applied in addition. In general, the higher the gradient, the more negative the difference between the corrected BHT and the measured temperature.
Figure 7 shows the initial comparison of corrected and uncorrected data points from Hydro-Québec’s database. It can be seen that the correction increases temperature above a 1-km depth and decreases for shallower than 1 km; however, the correction is much smaller than the data uncertainty. After much discussion of the effectiveness of the SMU correction within SMU [
13,
14,
15], it was determined that the SMU correction does not do its job properly. Therefore, we do not use it anymore (see
Figure 8a,b).
Figure 7.
Comparison of Hydro-Québec and Ministère de l’Énergie et des Ressources naturelles Quebec (MRNFQ) temperature data corrected according to Harrison and Southern Methodist University (SMU)-Harrison methods, respectively.
Figure 7.
Comparison of Hydro-Québec and Ministère de l’Énergie et des Ressources naturelles Quebec (MRNFQ) temperature data corrected according to Harrison and Southern Methodist University (SMU)-Harrison methods, respectively.
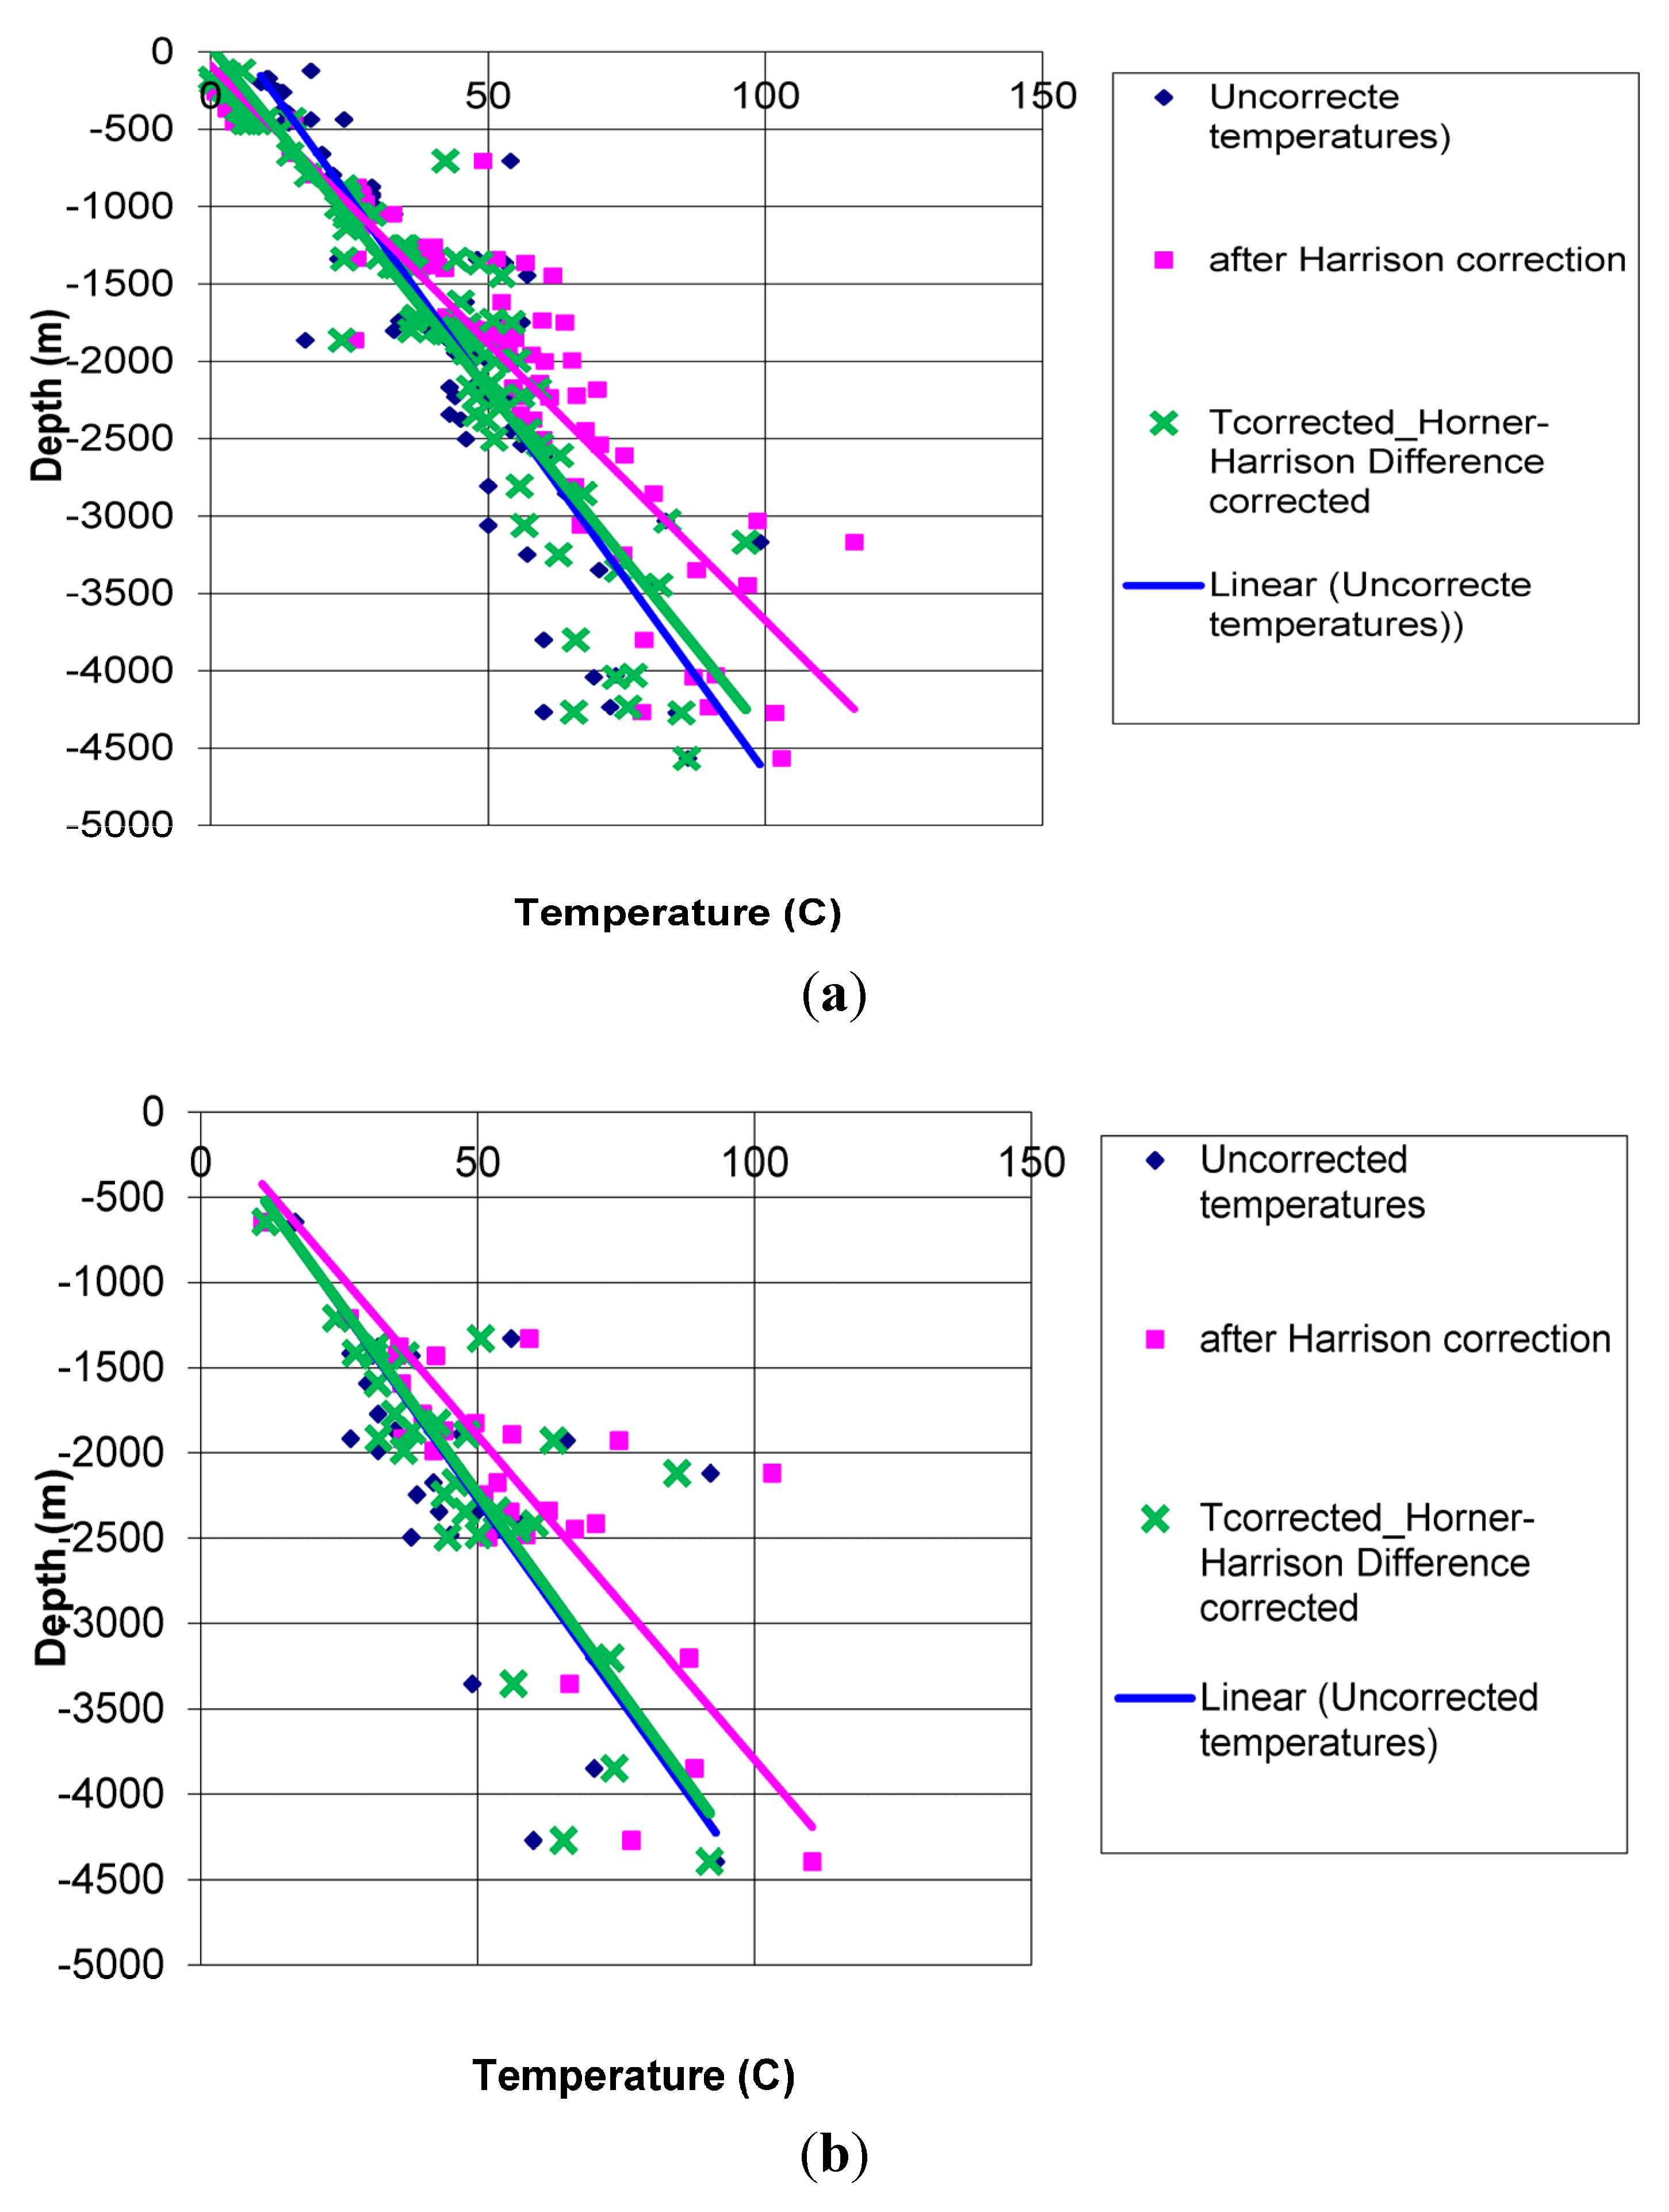
Figure 8.
Comparison of uncorrected with corrected BHTs using Bedard (2014a, b) [
16] correction based on application of the Horner method and Harrison correction applied by Majorowicz and Minea [
3]). (
a) Southeastern Québec; (
b) northeastern Québec, Gaspésie Peninsula and Anticosti Island.
Figure 8.
Comparison of uncorrected with corrected BHTs using Bedard (2014a, b) [
16] correction based on application of the Horner method and Harrison correction applied by Majorowicz and Minea [
3]). (
a) Southeastern Québec; (
b) northeastern Québec, Gaspésie Peninsula and Anticosti Island.
The application of the above procedure to correct the “industrial” well temperature data provided by Hydro-Québec based on the MRNFQ (Ministère de l'Énergie et des Ressources naturelles Quebec) database (
Figure 7) shows that the corrections increase both temperature values and temperature gradients. To compare, temperature corrections for return to equilibrium, reviewed by Crowell
et al. [
14] in United States basins, show that the Harrison correction is conservative comparing to other known corrections and in agreement with Kehle correction described there [
14]. Furthermore, recent Alberta basin comparisons between different temperature record BHTs, BHTs Horner corrected, DSTs (drill stem test) temperatures and well pressure survey WPS (Well Pressure Survey) temperature data [
15] are proving that Horner-corrected BHTs are an underestimate compared to higher thermal equilibrium state measurement, like DST, and annual pressure test temperature logs in “shut in” observational wells in the Alberta basin, where over 300,000 wells were drilled and logged.
The uncorrected temperature increases with depth 1 °C per 46.5 m with a modest geothermal gradient of only 22 °C/km. Correcting BHTs for return to equilibrium brings it up to near 29 °C/km (
Figure 7). Well location with temperatures for Quebec are shown in
Figure 1c.
The Horner correction is one of the more frequently-used temperature correction methods for BHTs attempting to correct the recorded temperatures to equilibrium conditions in a well (
i.e., to conditions prior to the disturbance of the temperature field by drilling activities). It has its limitations, as even corrected temperature values are less than equilibrium temperature from other types of measurements [
17]. In order to calculate a Horner correction, there must be at least two measurements made in the same well and at the same depth, and both the shut in time (t
elapsed) and circulation time (t
circulation) prior to these measurements are to be recorded [
18].
Assumption of the line heat source is a result of circulation in the well, which is assumed to be constant through the well. Warm fluid used in the drilling process is kept circulating during the drilling process. This fluid will have the average temperature for the well bore during the process. After drilling, the circulating fluid will attain
in situ rock temperature around the well bore with time t
c. In order to obtain accurate estimates of the equilibrium temperature, it is best to have shut in times two or three times longer than circulation times and circulation times of several hours or more [
19]. Drury (1984) [
19] explains it this way: “When the simplification is valid,
i.e., when t
e >> r
2/4s
, a plot of T against ln (1 + t
c/t
e) is linear, with the intercept being the equilibrium temperature”.
Inappropriate use of this approximation can lead to serious errors in the extraction of equilibrium temperatures from a series of BHT readings [
19]. It is found [
19] that the magnitude of the potential error in the estimation of formation equilibrium temperature is dependent on some simplifying assumptions made by use of the equation (see Equation (1)) and use of the so-called Horner plot. Accordingly [
20], Equation (1) should only be used for calculating a limit to the magnitude of the disturbance. The general recommendation has been made that circulation times of several hours should be followed by BHT measurements that are obtained after an elapsed time (t
elapsed) of at least two or three times the period of circulation [
19].
In Canada, BHTs corrected with the Horner method were completed for the cases time of fluid circulation and times since circulation ceased to the known BHT measurement. It has also been recently done for selected wells with such information on well records by Bedard
et al. [
16,
21]. According to Bedard, t
circulation times are highly variable: 1 h–42 h with a high mean value of six hours. The circulation times are, on average, 6.14 h; median: 2.63 h; min: 0.75 h; max: 42.25 h. However, Drury’s (1984) [
19] recommendations have not been taken into account. Therefore, small temperature corrections (in many cases, just a few degrees Celsius) underestimate the true temperatures. In the case of measurements of BHTs done at times less than the minimum two- and three-times t
circulation, the Horner plot will have a small slope and will underestimate the true equilibrium temperature.
Horner-corrected BHTs [
16,
21] and Harrison-corrected BHTs [
3] from Quebec have been compared by Bedard
et al. [
16]. The result is illustrated by the following statistical relationship:
Applying the above statistical Equation (2) to all Harrison-corrected BHTs for the Québec St. Lawrence Platform (
Figure 7) wells divided into two geographical sub-regions (
Figure 8 and
Figure 9) results in quite a small difference between uncorrected measurements and predicted “corrected” ones with this method. Otherwise, very large differences compared to temperatures with the Harrison correction are observed.
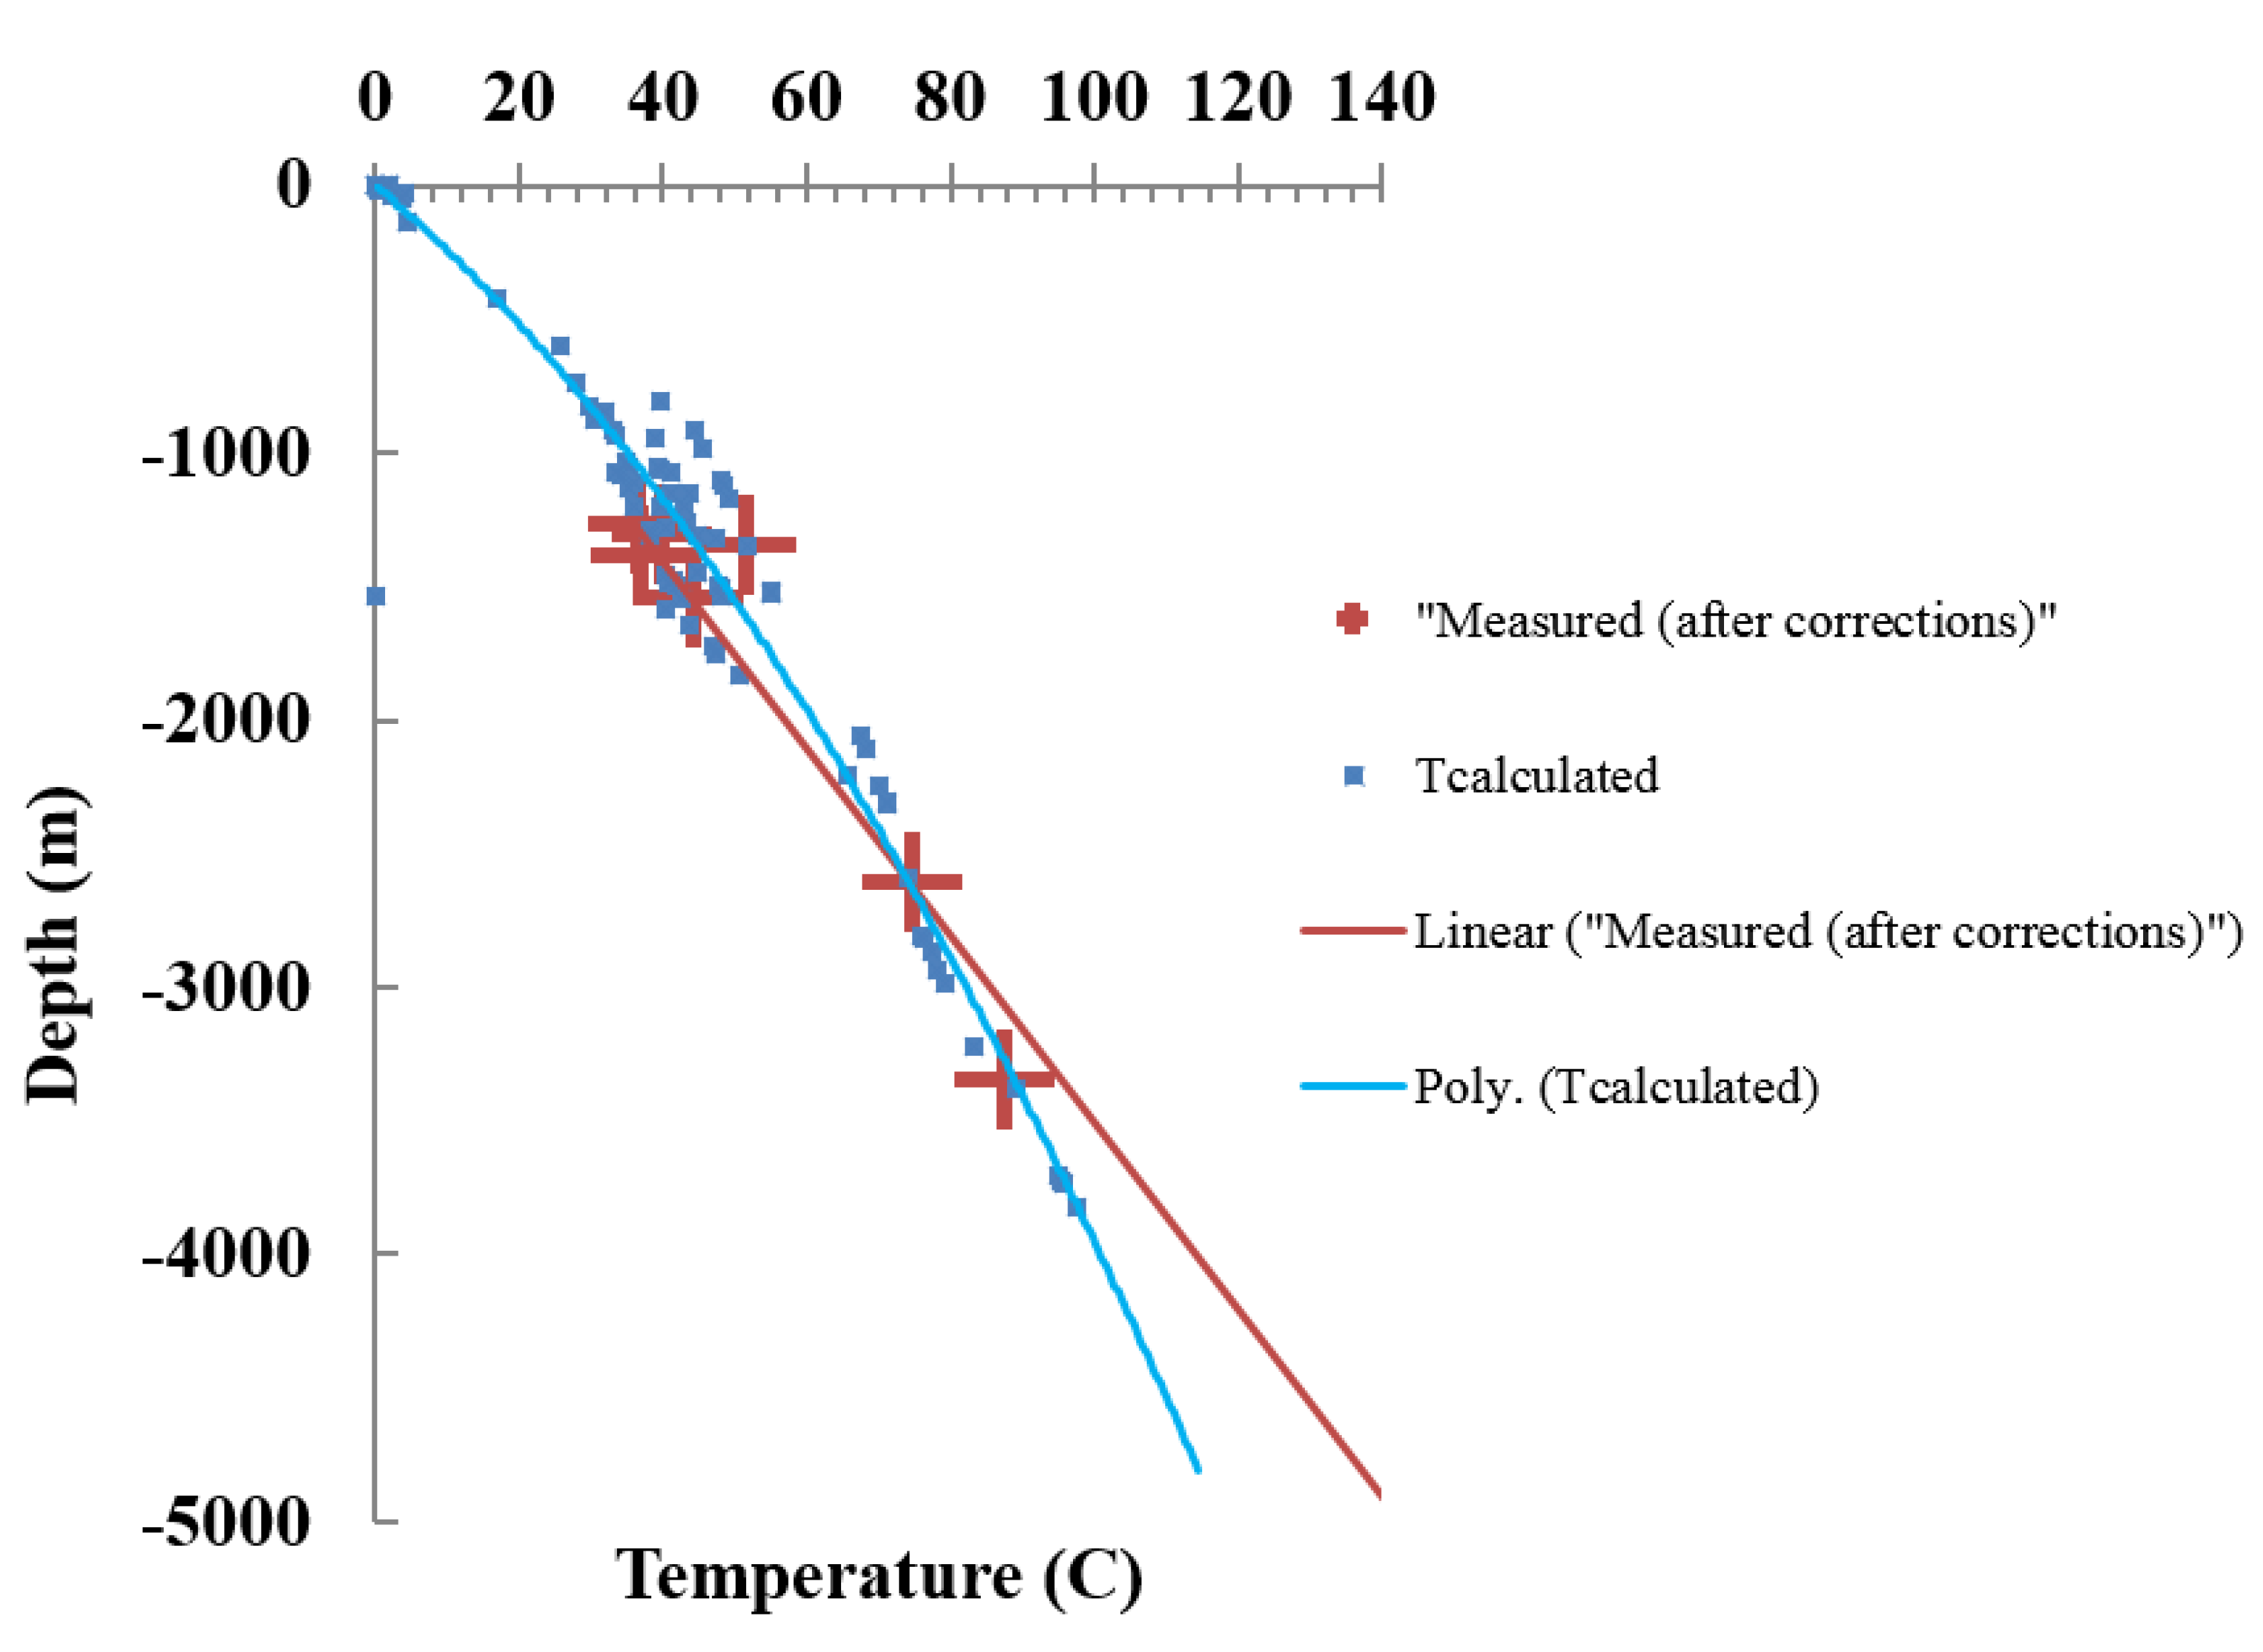
Figure 9.
Comparison of corrected BHT measurements vs. predicted temperatures at the tops of formations.
Figure 9.
Comparison of corrected BHT measurements vs. predicted temperatures at the tops of formations.
We note the large underestimate of Horner-corrected data in comparison with Harrison-corrected data. In southeastern Québec (
Figure 8a), it is 23 °C/km
vs. 28 °C km, respectively. In northeast Québec, the Gaspésie Peninsula and Anticosti Island, it is 22 °C/km
vs. 26 °/km, respectively. In both cases, the corrected data are higher than the data with no correction. This show gradients 20 °C/km
vs. 21 °C/km for
Figure 8a,b, respectively.
5. Uncertainty in Temperature-Depth Predictions from Measured Single Records
Thermal conductivity k and regional heat flux density Q control geothermal gradient grad (T), where T is temperature):
where k is the thermal conductivity of rocks (W/m K) (for the crust under Canada, it is generally in the range of 1–5 W/m K [
6,
22,
23,
24]). The heat flow (Q) for Québec varies between 35 and 80 mW/m
2 (see
Figure 1b).
The analysis of the formations and calculation of the lithology-related conductivities (
Table 1) allowed the calculation of the geometric mean thermal conductivity for the series model equation [
23].
In Québec’s St. Lawrence Platform, sediments are of varying thermal conductivity, as estimated from lithology net rock content and average rock thermal conductivities (
Table 1).
Table 1.
Summary of predicted thermal conductivity for the formation groups of the St. Lawrence Platform of southern Québec.
Table 1.
Summary of predicted thermal conductivity for the formation groups of the St. Lawrence Platform of southern Québec.
| Formation Group | Average | Error | Reservoir Ranking |
|---|
| (W/m K) | (W/m K) |
|---|
| Qeenston | 1.5 | 0.22 | poor |
| Loraine | 2.2 | 0.33 | fair |
| Utica | 2.1 | 0.32 | fair |
| Trenton | 3.2 | 0.48 | good |
| Black River | 3.3 | 0.49 | good |
| Chazy | 3.4 | 0.51 | poor |
| Carillon | 4.8 | 0.72 | poor |
| Beuchamois | 4.6 | 0.69 | good |
| Theresa | 4.2 | 0.63 | fair |
| Cairnside | 3.6 | 0.54 | fair |
| Covy Hill | 3.7 | 0.56 | fair/poor |
| Grenville | 3.4 | 0.51 | poor |
The sediments in the deep part of the basin consist of mainly Cambrian Cairnside-Covy Hill sedimentary rocks (see
Table 1) overlying the intrusive or metamorphic Precambrian Grenville crystalline rocks below. Some good aquifers are in the Ordovician Trenton Group, Black River Formation (Fm), Beauchamonis Fm and fair aquifers, like Ordovician Theresa Fm and Cambrian Cairnside Fm [
10]. It was found [
21,
25,
26] that the deepest sedimentary formations with existing porosity (average 5% ) are these of the Potsdam Group sandstones, mainly Covy (see
Table 1), and sandstone, conglomerate, quartz, feldspars,
etc., Cairnside formation. The lower portion of sedimentary basin, consisting of quartzite-rich and carbonate-rich rocks, will be characterized by a lower Grad T. It will also be characteristic of the lower laying crystalline rocks with k (thermal conductivity) 3.5 W/m K, [
27].
Since sedimentary strata are not uniform, the formations will vary in the way the conduction of heat occurs. In the case of BHTs or DSTs, temperature measurements are taken at the depth point, unlike continuous logs, which are rare. Examples of predictions of temperature
vs. depth based on heat flow and the variability of thermal conductance of sediments for wells are shown in
Figure 9. It is noticed that taking into account thermal conductivity variability, temperature-depth prediction is more precise than those just based on linear extrapolation from measured BHTs. Predictions based on point BHTs underestimate temperature in the upper parts of the profiles and underestimate deep temperatures in the lower part (
Figure 9). Therefore, combined plots of corrected BHTs
vs. depth, such as those shown previously in
Figure 7 and
Figure 8, will not necessarily be precise representative temperatures at depth at each depth point, as we do not have measured continuous temperature-depth (
Figure 9). Temperatures at depth point measurements for the same theoretical depth and theoretically same heat flow will differ, as the same type of formations can occur at different depths (see Points 1–3 describing geology of the platform basin) from shallow–deep through the basin, depending on geographical location of the wells.
7. High Temperature vs. Low Temperature Pattern: Spatial Distribution
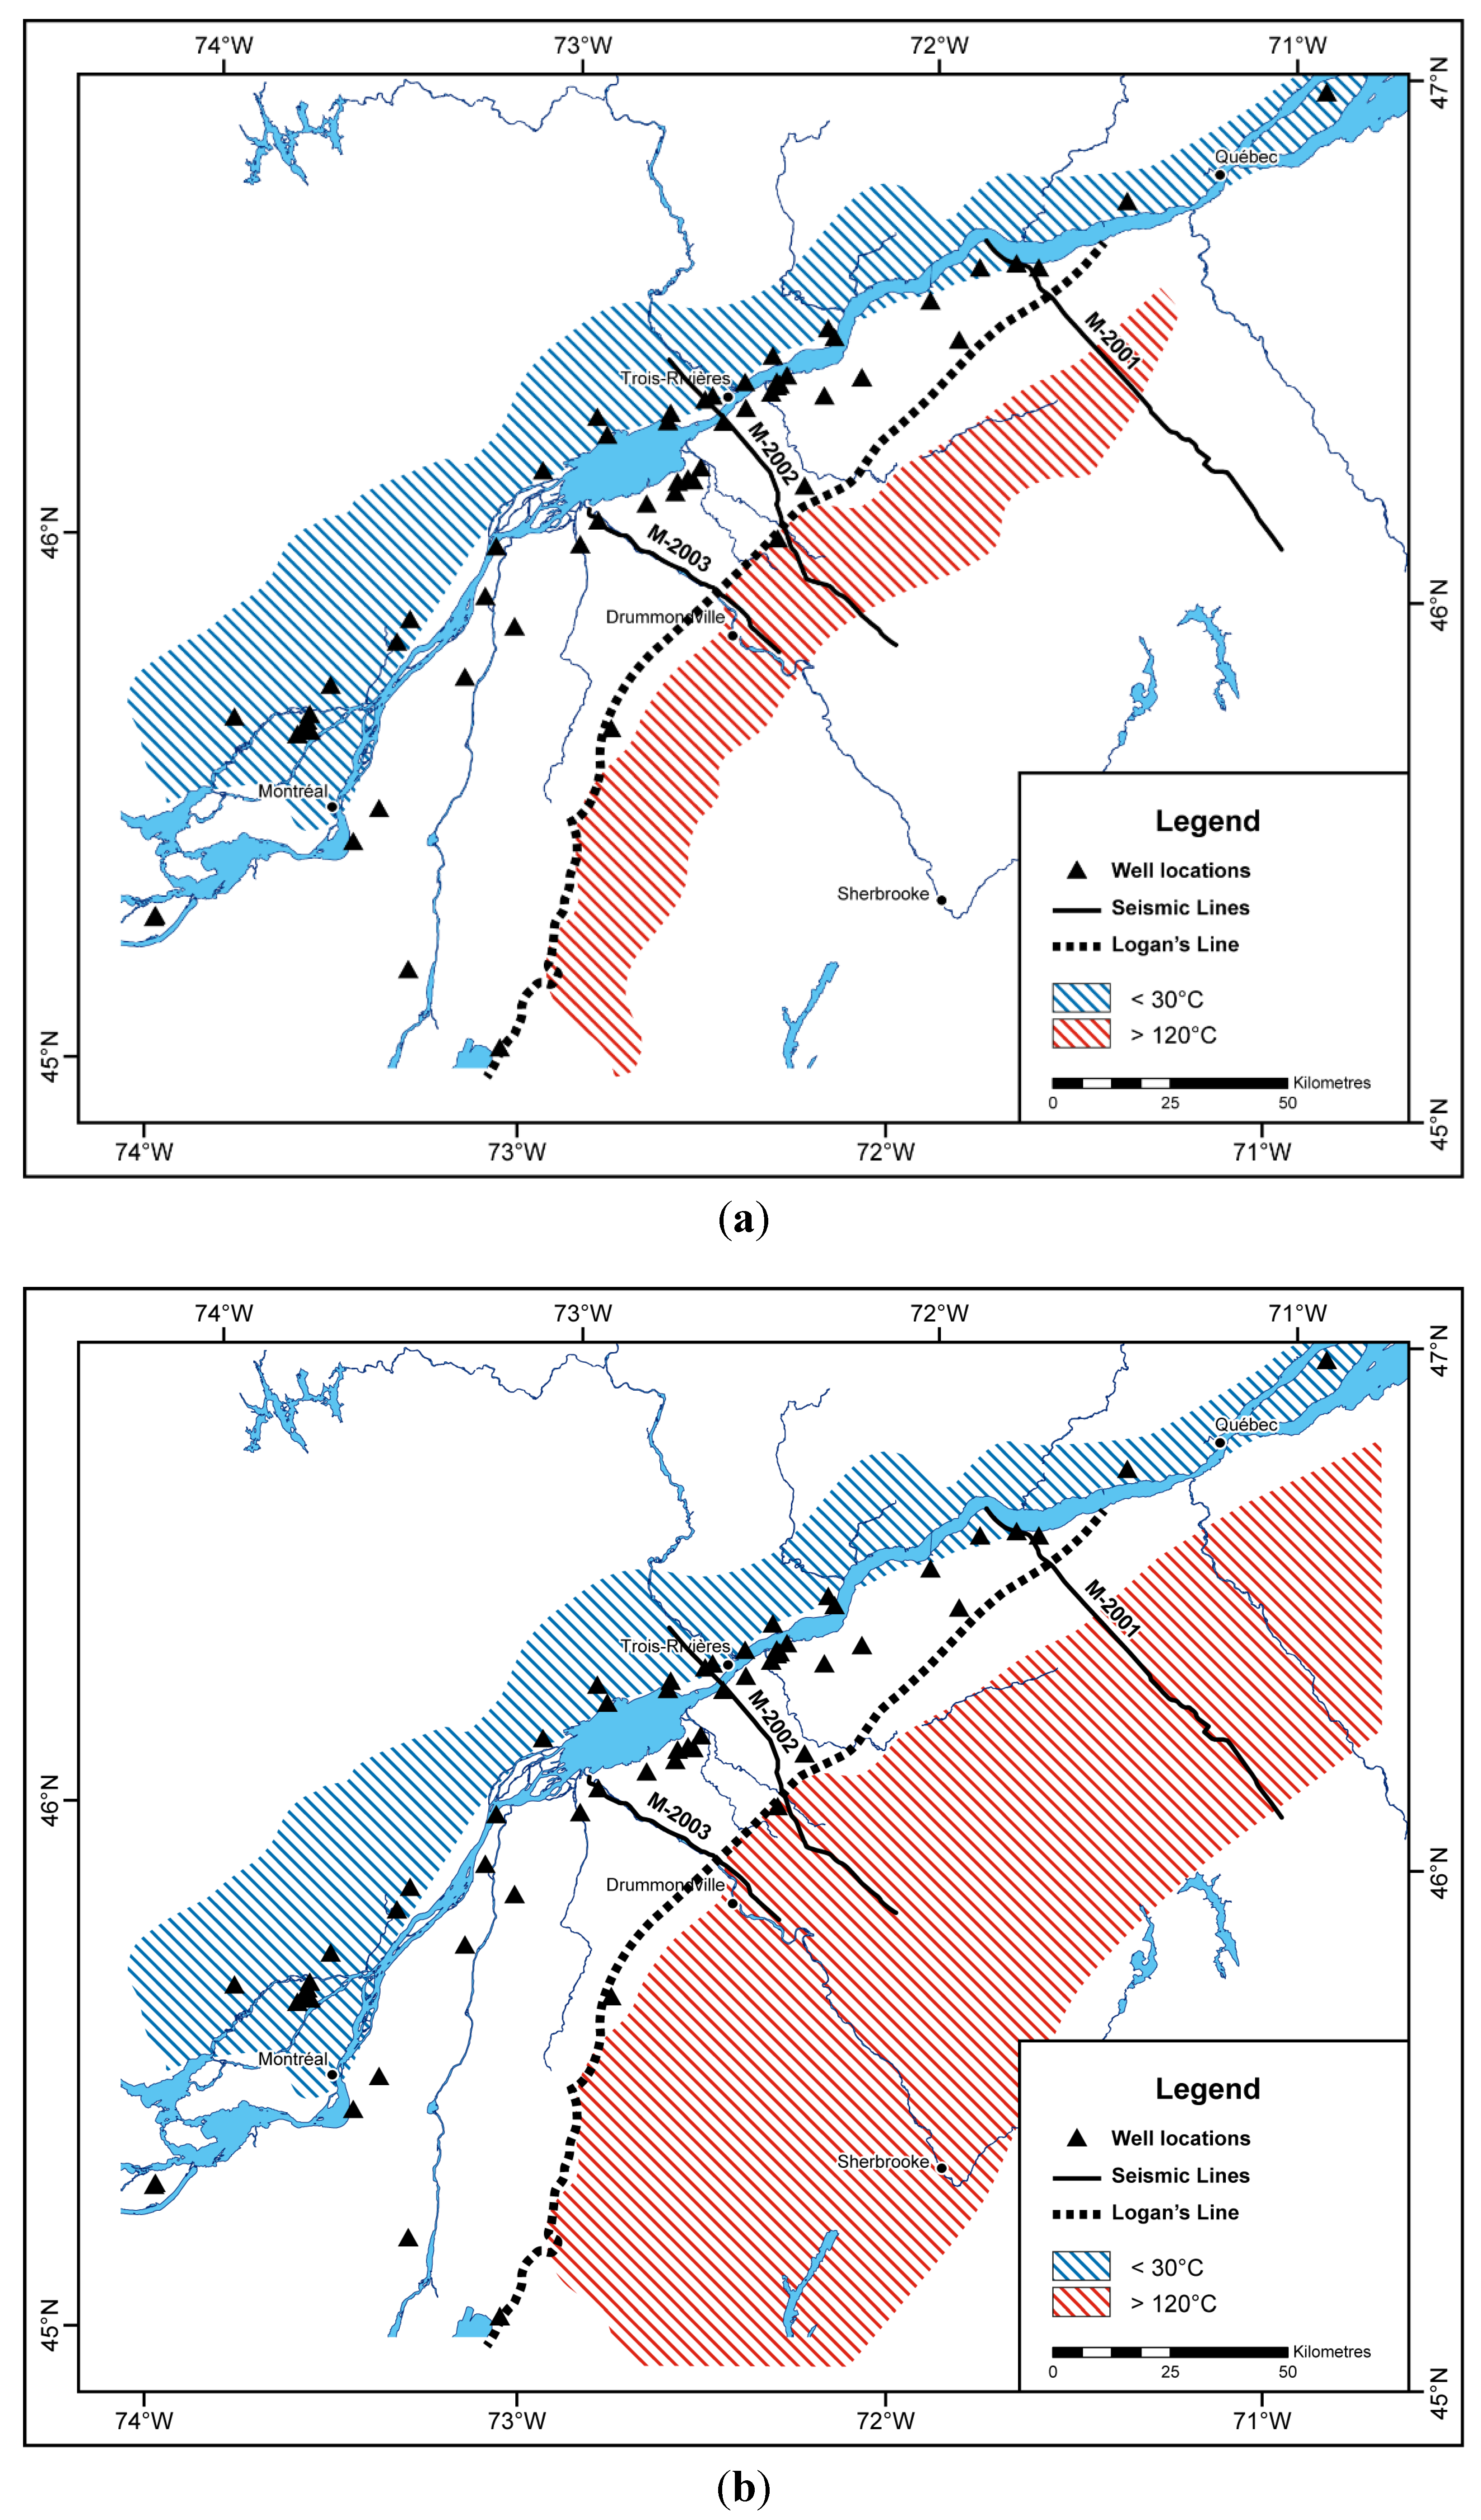
Both the above geological and geophysical considerations allowed making predictions of high >120 °C and low <30 °C temperature patterns at the deepest Cambrian Potsdam units overlying the Grenville basement (
Figure 10).
It is observed (
Figure 10a,b) that the majority of most populated Québec urban centers are in the areas where Grenville is exposed as a shield of hard crystalline rock or at shallow depths (see
Figure 5 and
Figure 6) with sedimentary cover temperatures at 30 °C or less.
The city of Drumonville will be the exception, as the basement deepens sharply southwest, and higher temperatures reaching >120 °C are expected in deep Cambrian sedimentary aquifers near a 4–5 km depth. These more favorable conditions occur within a distance of approximately 50 km from other high population urban centers, like Montréal, Trois-Rivières, Québec city, etc., in most cases.
There is a chance that such conditions may exist deep under the Sherbrooke area, where such sediments could be occurring under Appalachian nappes 6–7 km below [
10,
11,
25,
26] at temperatures way over 120 °C and likely reaching >150 °C. This is, however, poorly resolved by the existing deep seismic reflection data and lack of deep heat generation data [
27].
Figure 10.
(a) Deep temperature zones predicted in the base sedimentary aquifer zone for the conservative and (b) speculative with the zone far reaching below the Appalachian wedge.
Figure 10.
(a) Deep temperature zones predicted in the base sedimentary aquifer zone for the conservative and (b) speculative with the zone far reaching below the Appalachian wedge.
8. Discussion of the Prospect Geothermal Energy Drilling Targets
Depending on subsurface temperature and the heat demand at the surface, different applications for using geothermal resources are possible [
28,
29]. Analysis of
Figure 10 shows different emerging geothermal potential zones in the deepest Cambrian–Potsdam aquifers over top of the deepening south-eastward Grenville crystalline basement:
- (1)
Potential for warm water provision (<30 °C) [
28];
- (2)
Potential for heating, high-end heating and small power (>30–<120 °C) [
28,
29];
- (3)
Potential for electrical power production (>120 °C) [
28,
29].
For the major part of the platform, the temperatures above a 2-km depth are high enough to be used for warm water provision or balneological use. Underneath the large urban areas, fluid temperatures are not sufficient to be used for district heating purposes. Here, geothermal heat production appears as a feasible option for use with heat pumps or at EGS projects beneath relatively shallow sediments into the Grenville basement. Drilling into “unknown” prospects due to unknown permeability and geometry of pre-existing fractures makes this prospect more risky. Such a system would also involve tapping into a shallower aquifer’s water to be pumped into a deep engineered fracture zone, creating an artificial heat exchanger.
Out of Quebec’s highest population centers, electrical power production from geothermal heat is generally possible in the deepest part of the basin towards Sherbrooke. There, we predict that deep aquifers’ temperatures under the Appalachians are most probably >120 °C and, in the case of the deepest Cambrian, >150 °C. A suitable spot for a geothermal power plant would be the geothermal anomaly south of the Logan line in the Potsdam group, located >50 km southwest of the St. Lawrence River. Here, temperatures above 150 °C are found in the Cambrian Sandstone Unit of Potsdam at a depth of >5 km in some places and >6 km in others. These are aquifers too deep to be economical to drill. Other good locations for a geothermal power plant are found in the area in Gaspésie Peninsula, where some anomalies point to a depth of 5 km above 150 °C in Devonian porous reef-like carbonates [
25,
26].
For most potential geothermal targets, formations are present at a sufficient depth. Especially the deep foreland basin clastic, sandstone and carbonate plays offer the potential for geothermal applications. In the large urban areas, fluid temperatures in the range of 60 °C–90 °C are found and could be used for district heating, warm water provision and for industrial applications. In the deepest basin, the potential for electricity production by applying EGS technology exists.
Table 3 summarizes the first prospects evaluated in major Québec population centers.
9. Preliminary Assessment of the Economics of the Geothermal System in the Southern Quebec Deep Basin
Assessment of the economics of geothermal energy is important, as amounts of potentially available energy in low enthalpy regions compete against energy inputs needed to run geothermal system (energy to run pumps, plant, energy to drill, etc.). We need net positive energy output and this to be inexpensive to compete against others forms of energy. Geothermal energy competes against other forms of heating (electrical, gas, diesel, etc).
Table 3.
Summary of predicted geothermal options for the most populated centres in the Canadian province of Québec.
Table 3.
Summary of predicted geothermal options for the most populated centres in the Canadian province of Québec.
| Rank | Population centre | Size group | Population in 2011 | EGS Power Prospects | EGS Geothermal Heat Prospects | Direct Geothermal Heat Prospects within 20 km distance |
|---|
| 1 | Montréal | Large urban | 3,407,963 | Artificially fracked deep crystalline | Artificially fracked deep crystalline | Low enthalpy aquifer heat |
| 2 | Québec | Large urban | 696,946 | Artificially fracked deep crystalline | Artificially fracked deep crystalline | Low enthalpy aquifer heat |
| 3 | Ottawa-Gatineau (Quebec part) | Large urban | 236,329 | Artificially fracked deep crystalline | Artificially fracked deep crystalline | Artificially fracked deep crystalline |
| 4 | Sherbrooke | Large urban | 140,628 | Deep aquifer EGS enhanced | Deep aquifer EGS enhanced | Deep aquifer EGS enhanced |
| 5 | Trois-Rivières | Large urban | 126,460 | Artificially fracked deep crystalline | Artificially fracked deep crystalline | Low enthalpy aquifer heat |
| 6 | Chicoutimi-Jonquière | Large urban | 106,666 | Artificially fracked deep crystalline | Artificially fracked deep crystalline | Artificially fracked deep crystalline |
| 7 | Saint-Jean-sur-Richelieu | Medium | 83,053 | Artificially fracked deep crystalline | Artificially fracked deep crystalline | Low enthalpy aquifer heat |
| 8 | Châteauguay | Medium | 70,812 | Artificially fracked deep crystalline | Artificially fracked deep crystalline | Low enthalpy aquifer heat |
| 9 | Drummondville | Medium | 66,314 | Deep aquifer EGS enhanced | Deep aquifer EGS enhanced | Deep aquifer EGS enhanced |
| 10 | Saint-Jérôme | Medium | 65,825 | Artificially fracked deep crystalline | Artificially fracked deep crystalline | Artificially fracked deep crystalline |
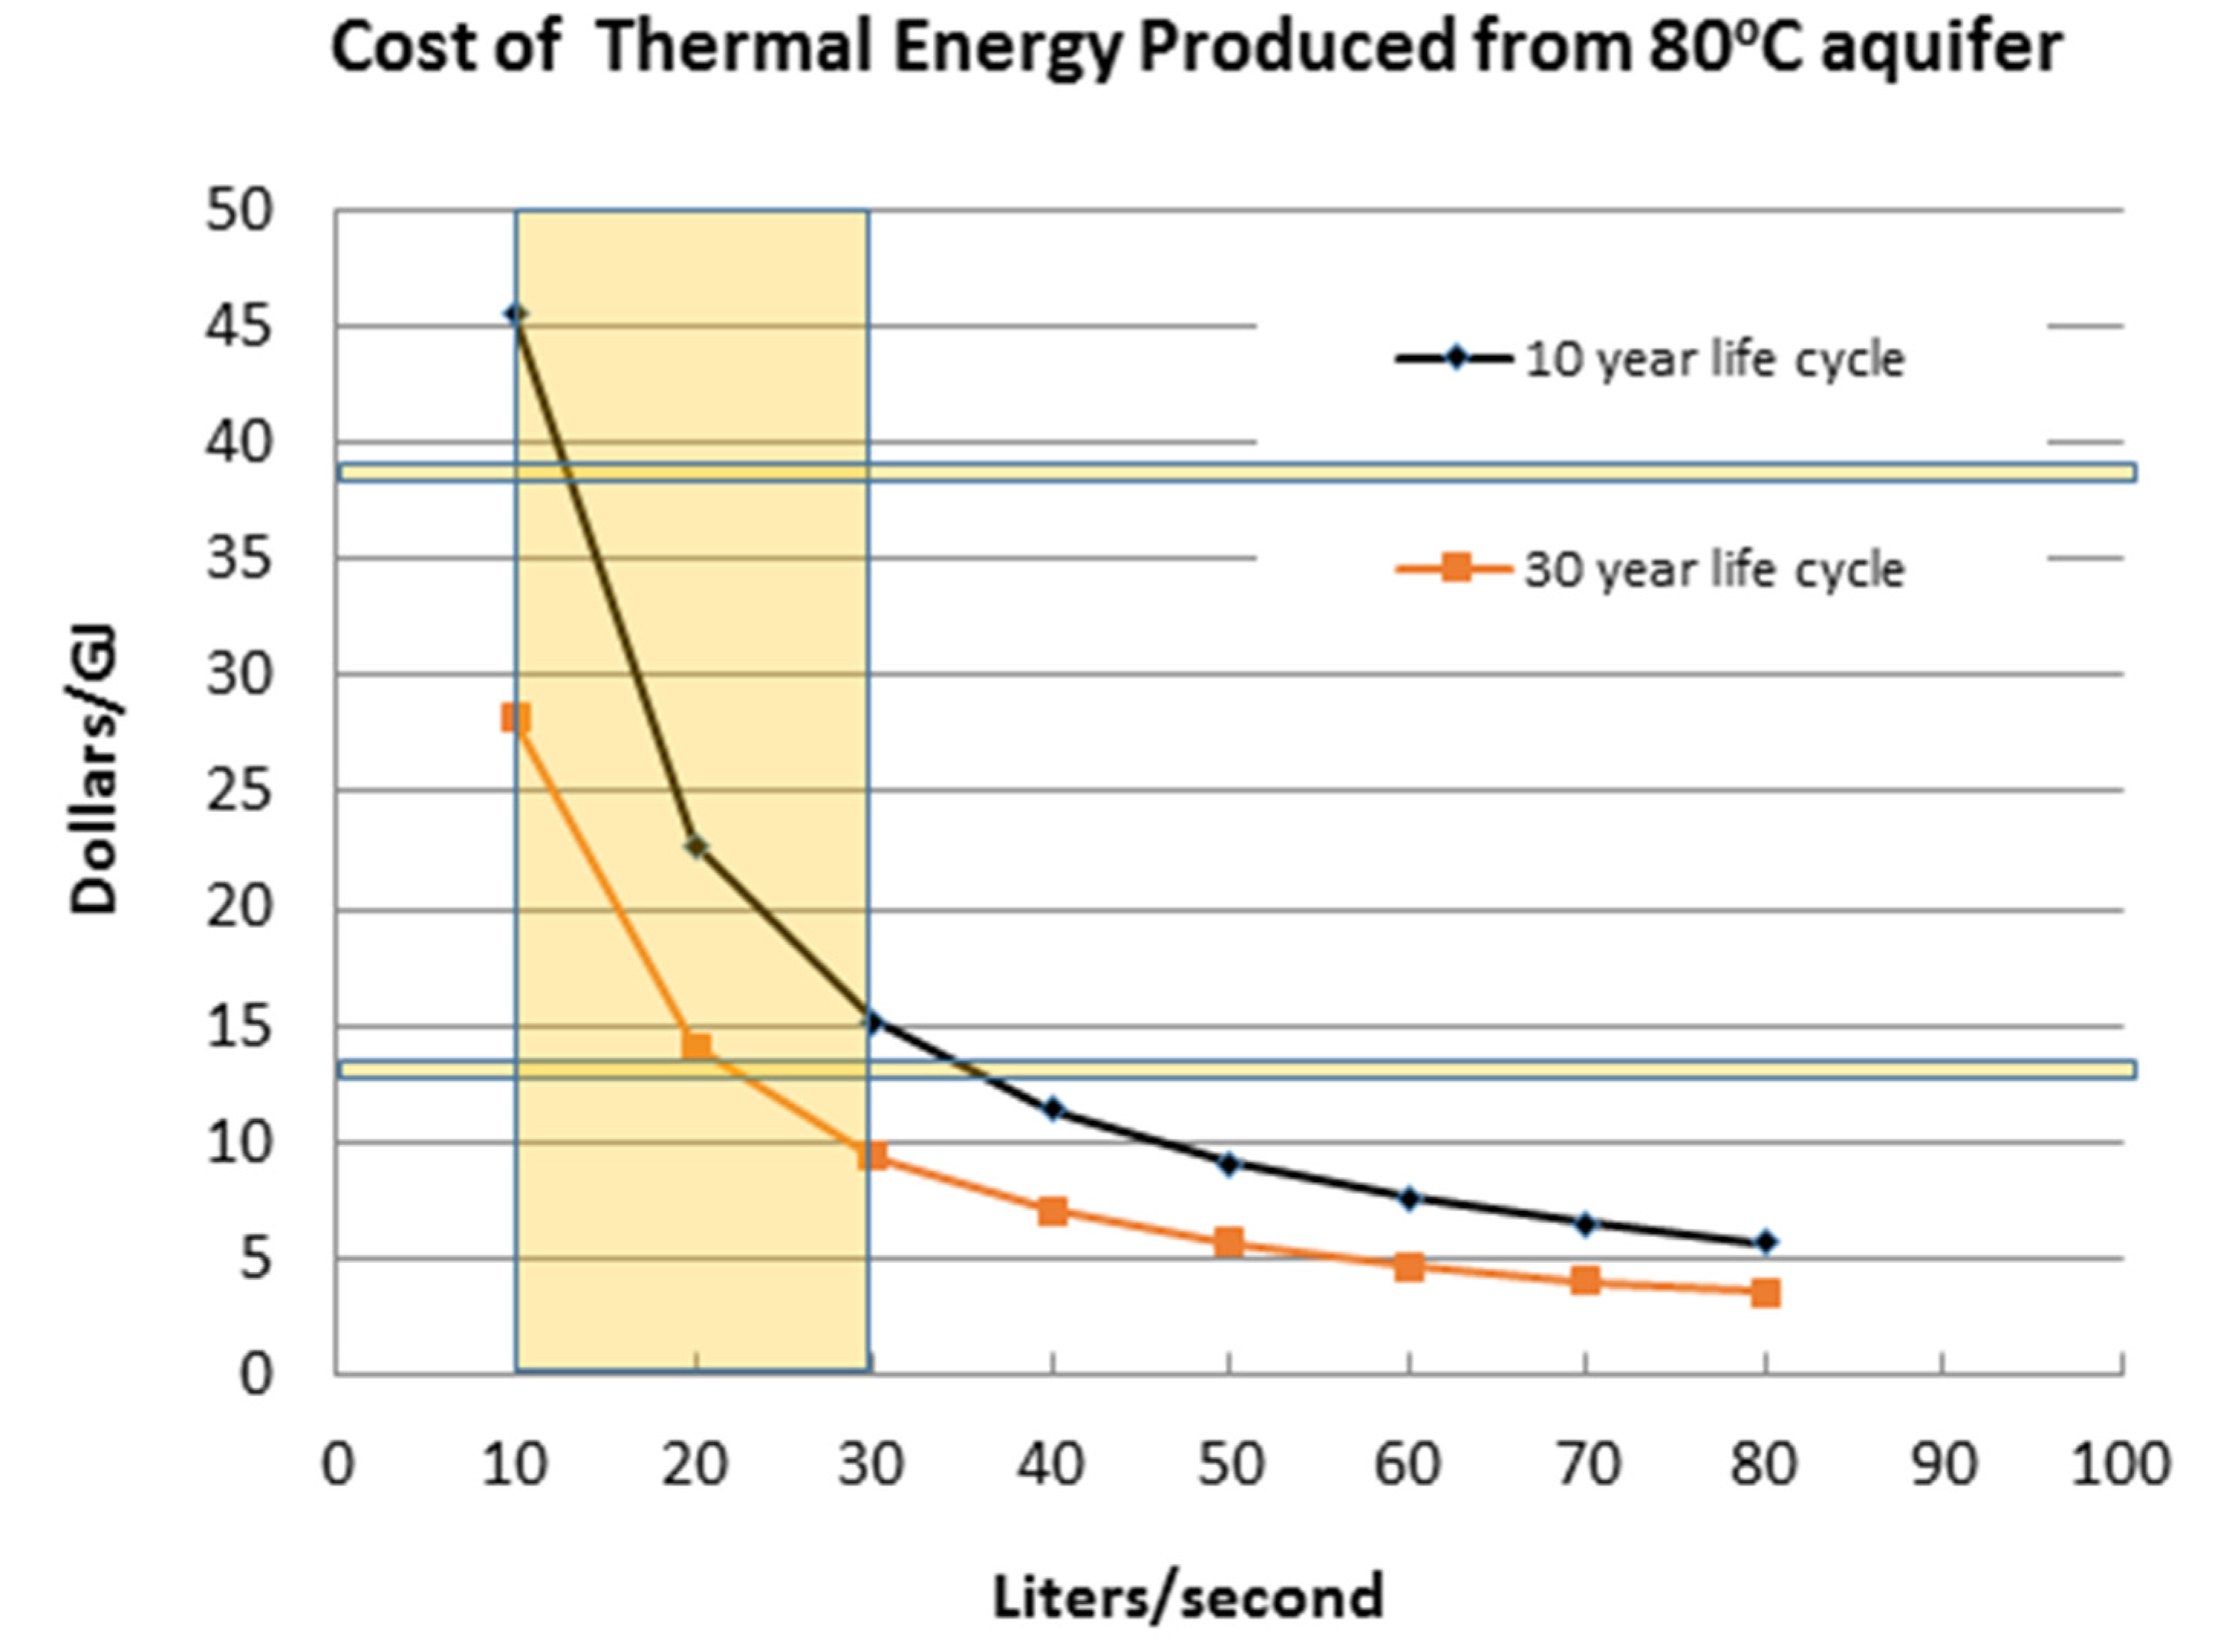
Preliminary calculation of geothermal heat in GJ has been done for a doublet well system (producing and reinjection) for what is basically feasible in the southern Quebec deep sedimentary basin’s parameters. We have done calculations of the cost of energy for a range of temperatures (80 °C–120 °C). Calculation for 80 °C, a temperature which can be reached at reasonable depth of around or less than 3 km in most of Quebec’s basins, is shown to illustrate the varying cost of heat for the range of feasible fluid flow rates and the technical lifetime of the system (
Figure 11). The assumed example case is as follows:
- (i)
Geothermal fluid temperature, 80 °C;
- (ii)
Specific heat capacity of geothermal fluid, 4186 J/kg K;
- (iii)
Drop off (reinjection) temperature, 40 °C;
- (iv)
Geothermal flow rate, 10–80 kg/s.
For costs calculations, additional assumptions have been made:
- (i)
The gross electrical power needed to run pumps (production and reinjection) is 1 MWe (Mega Watts electrical);
- (ii)
The technical lifetime of the geothermal sites varies from 10 to 30 years [
28];
- (iii)
The major overnight investment costs are well costs, which depend on depth drilled, drilling and casing, which can be recovered over the system assumed lifetime depending on the resource and the management of geothermal fluid flows;
- (iv)
The additional costs of fracture enhancement and installation works have been assumed at 0.5 M$ per site;
- (v)
For the case of EGS applications, the fracturing has been approximated based on a statistical compilation performed for several geothermal, oil and natural gas prospective wells by Tester
et al. (2006) [
29].
The results are shown in
Figure 11, which presents an estimation of the specific costs (expressed in $/GJ) of the geothermal heat recovered as a function of the geothermal fluid flow rate, and system lifetimes have been assumed at 10–30 years for southern Québec.
Figure 11.
Specific costs of geothermal heat recovered as a function of geothermal fluid flow rate for an 80 °C well head fluid temperature and system lifetime.
Figure 11.
Specific costs of geothermal heat recovered as a function of geothermal fluid flow rate for an 80 °C well head fluid temperature and system lifetime.
Reference lines (
Figure 11) showing prices for Montréal, Quebec (large industrial) (4.76 Can cents/kWh = 13.22 Can $/GJ) and for Montréal (residential) (6.76 Can cents/kWh = 38.58 Can $/GJ) are from [
30]. This shows (
Figure 11) that flow rates for the EGS in the Quebec deep basin need to be in the upper range of the flow rates for other projects around the world [
2] to make things price competitive. The Soultz EGS project flow rates from different stages of this experiment highlighted in
Figure 11 show that it would be a challenge. Furthermore, with geothermal fluid eventually available at 80 °C in Québec aquifers in the sedimentary platform overlying the Grenville crystalline basement, power generation at economical heat-to-electricity conversion efficiencies and reasonable flow rates is not achievable today, as the maximum power recovered at 10% ORC (Organic Rankin Cycle) efficiency would be only 0.2 Mega Watts electrical (MWe), while substantial electrical power (at least 1 MWe) may be required to operate the submerged and surface auxiliary circulating pumps. However, geothermal district heating may be competitive with the currently high heating fuel prices, such as diesel fuel and propane, which are shipped over very long distances to isolated populated municipalities in remote areas of Québec.
In southern Québec, where deep geothermal heat at temperatures >120 °C could be found at depths over 6.5–7 km, electrical power generation probabilities look more optimistic. In this region, with geothermal flow rates of 30–60 kg/s, enough gross electrical power could be produced to supply the electrical power required for circulating pumps. This depends on permeability and porosity of deep aquifers which are not well known due to lack of deep drilling and projected from shallower wells [
31,
32]. Geothermal heat production for district and/or industrial heating only seems much more competitive at geothermal fluid flow rates <20 kg/s (
Figure 11). Finally, the use of deep geothermal heat for heating purposes could significantly reduce greenhouse gas emissions in the form of CO
2. For example, geothermal heat production at 80 and 120 °C with a very optimistic flow rate of 80 kg/s could reduce CO
2 emissions by 0.02 and 0.04 megatons per year, respectively [
28]. If, for example, 1000 similar installations were implemented in the future, annual reductions of CO
2 emissions of 20–40 megatons could be theoretically achieved in the future compared to conventional energy sources (e.g., heating oil, natural gas or diesel fuel).
10. Conclusions
Low enthalpy geothermal resource areas are the majority of the world’s future possibilities, and as analyzed in this paper, Quebec’s geothermal potential is quite a typical example. Quebec is not an exceptional geothermal prospect, like in some known geothermal sites in France (Massif Central) or southern Germany (Rhein Graben), where high temperatures are available from half the drilling depth. However, there is a large amount of heat at greater depths (>3 km) to be considered if flow rates around 30 kg/s or preferably more are achieved. This will depend on the cost decrease and effectiveness increase of enhancing permeability techniques. Development in drilling in decades to come will be an important factor for achieving economical systems.
However, the analysis of available heat from deep well parameters is limited, as deep wells are in many cases few. This is mainly due to huge up-front investment costs, running tens of millions of dollars for (>4 km) geothermal wells. Important parameters for the evaluation of available geothermal heat, like temperature, come from single-depth BHTs, and correction of these for return to equilibrium is very uncertain science. Lack of continuous equilibrium temperature logs is common. Therefore, in many cases, single-depth measured BHTs plotted against depth give us only a very preliminary assessment of the geothermal gradient. Temperatures from a better evaluation of thermal conductivity with depth give a more conservative estimate of the temperature resource and show, in many cases, a drop of thermal gradient at deeper formations, like in the case of deep Quebec sediments. Corrected single-depth measured BHT vs. depth statistical plots overestimate temperature in case data extrapolated from upper depth measurements in low conductivity sediments. This can lead to overestimation of the heat content at higher depths.
In cases of the basins like the Quebec sediments, porous aquifers are overlaying hard rocks of the basement with no or very little porosity (mainly fractures). In the area of the deep basin southwestward of the major population centers, you can get to much hotter temperatures, but then it becomes a trade-off between the cost of drilling that deep, and also, much less is known about the reservoirs in that area. Usually, we know more about shallow the <3-km part of the basin than in other places where more exploration is required. In the Quebec case, the basin is overlaying the Grenville and Appalachian basements in the southwest–northeast spreading corridor between the Shield and the Appalachians. As high flow rates are required for a successful geothermal application, the most important are deep existing permeable aquifers rather than hard rock, below which fracking would be needed. Unfortunately, the majority of the 10 populated Québec urban centers researched are in the areas where Grenville is exposed (Canadian Shield) or at shallow depths with sedimentary cover with temperatures approximately 30 °C or less. The city of Drumonville will be the exception, as the basement deepens sharply southeast, and higher temperatures reaching >120 °C are expected in deep Cambrian sedimentary aquifers near a 4–5 km depth. There is a chance that such conditions may exist deep under the Sherbrooke area where such sediments could be occurring under Appalachian nappes 6–7 km below, where temperatures way over 150 °C may be found. This is, however, poorly resolved by the existing deep seismic reflection data and deep drilling data [
31,
32,
33], and requires exploration drilling. Such high depths are also too expensive to drill for low enthalpy geothermal energy. More favorable conditions occur within a distance of approximately 50 km southeast of a majority of the other highly populated urban centers, like Montreal, Trois-Rivières, Quebec,
etc., Ten–thirty kilometres southward of these, >60 °C temperatures of deep Cambrian aquifers with saline waters feasible for use in heating would be available. In parts of the deep basin, temperatures as high as 90–120 °C exist at depths of 3–5 km and mainly southeast of the major geological boundary: the Logan line.
Further analysis requires locating target-specific spots for the prefeasibility scientific drilling, addressing geothermal (equilibrium temperature measurements), hydrogeological (aquifers, flow rates), logistical (vicinity of the heat demand and power lines) and economical assessment.


