Abstract
This paper assesses world-wide patterns of material extraction, trade, consumption and productivity based on a new data set for economy-wide material flows, covering used materials for all countries world-wide between 1980 and 2009. We show that global material extraction has grown by more than 90% over the past 30 years and is reaching almost 70 billion tonnes today. Also, trade volumes in physical terms have increased by a factor of 2.5 over the past 30 years, and in 2009, 9.3 billion tonnes of raw materials and products were traded around the globe. China has turned into the biggest consumer of materials world-wide and together with the US, India, Brazil and Russia, consumes more than 50% of all globally extracted materials. We also show that the per-capita consumption levels are very uneven, with a factor of more than 60 between the country with the lowest and highest consumption in 2009. On average, each human being consumed 10 tonnes of materials in 2009, 2 tonnes more than in 1980. We discuss whether decoupling of economies’ growth from resource use has occurred and analyse interrelations of material use with human development. Finally, we elaborate on key environmental problems related to various material groups.
1. Introduction
Since the industrial revolution the Western world has experienced enormous increases in affluence and economic development. Furthermore, during the last decade, a rapid economic development has occurred across the globe in various emerging economies, such as South Korea and Chile which are now members of the Organisation for Economic Co-operation and Development (OECD), and notably also in China, India and Brazil. At the same time, global extraction and use of many natural resources as well as the release of waste and emissions from their use have reached or exceeded crucial ecological limits. Various renewable resources are extracted at a much faster rate than what our global ecosystem can regenerate [1], while proceeding extraction of non-renewable resources requires increasingly extensive ways to obtain them, implicating higher environmental burden [2]. Conventional oil may have surpassed its global peak of production, and its physical trade volume has stagnated since 2006 [3]. Waste and emissions are produced at a scale which surpasses the absorption capacity of the planet’s ecosystems [4]. These developments entail risks of severe environmental change. Therefore, if the current patterns of consumption and production as well as the associated use of natural resources, and the outflows of wastes and emissions into environment and atmosphere, continue, the negative consequences for the planet’s ecosystems and their provision of services may be irreversible [5]. At the same time, competition over key material resources is increasing on the global level, leaving countries and world regions increasingly concerned about how to ensure stable access to these resources [6,7].
Scientists have called for a dematerialization of the world economy for more than two decades. Particularly industrialized countries and “western lifestyles”, which are responsible for the largest share in global material consumption, would have to dematerialize by a factor of five or even 10. In the early 1990s, Friedrich Schmidt-Bleek was one of the first experts to suggest policies and measures for such a dematerialization [8] and many other publications followed this line of argument [9,10,11,12].
Environmental and associated economic threats have led to resource efficiency issues climbing up the policy agenda around the globe in recent years. In addition, expected positive effects brought about by de-coupling of economic growth from resource use and its related environmental impacts led to an increasing importance of resource efficiency [13]. A number of resource efficiency policies and initiatives were therefore started on the European and international level [14,15,16]. The increasing policy interest brings about the further development of indicators on resource use and efficiency, in order to provide decision-makers with tools to reconcile future economic development and human well-being with lower resource use and less environmental impact, while taking into account individual needs for resources across the planet [13].
For the analyses of national material use and productivity, economy-wide material flow accounting (EW-MFA) is the methodology with the longest tradition and highest degree of international harmonization [17]. EW-MFA has been standardised by the European Statistical Office (EUROSTAT, Luxembourg) in regularly updated methodology guides (for the latest version, see [18]) and has also been endorsed by the OECD [19]. The most basic indicators derived from EW-MFA, most notably Domestic Material Consumption (DMC), are now routinely reported by all EU Member States. The DMC indicator is also widely available outside Europe, including for the OECD countries [20], the Asian and Pacific region [21,22,23], Latin America [24,25,26] and Africa [27]. Also, several studies provided comparative assessments of material flows across all countries world-wide. Behrens et al. [28] investigated patterns of material extraction on the continental level. Krausmann et al. [29] described patterns of material use for 175 countries with regard to their respective states of development. Using a revised data set of the one in Krausmann et al. [29], Steinberger et al. [30] investigated differences of material use in relation with its drivers, such as GDP and population, allowing for information about distributional inequalities or income elasticities of material use. In a recent paper, Steinberger et al. [31] assessed the links between DMC and economic growth as well as patterns of de-coupling across a large number of countries in a time series from 1970 to 2004. Another study, conducted by Dittrich and Bringezu [32] based on the UN Comtrade database, analysed trends of physical trade flows over time, demonstrating differences among commodities and interdependencies of world regions. Dittrich et al. [33] presented time series for DMC for all countries world-wide between 1980 and 2008 and illustrated patterns of different economic development paths and their links to material use and environmental problems.
Before this background, this paper presents an assessment of global material flows based on a new data set for all countries world-wide between 1980 and 2009, thereby providing more recent information than what other MFA studies on the global level have presented so far. We aim at answering questions such as: How have global material extraction, direct physical trade and direct consumption of resources developed over the past 30 years? What role does international trade play in the allocation of materials around the globe? Has a decoupling of direct material use from economic growth been achieved in the global economy? What are the links between material use and human development? Finally, which environmental implications do these developments cause around the globe?
It is important to note that this paper thus focuses on presenting and analysing new data on global material flows. The policy questions emerging from the observation of empirical trends, in particular how to best design sustainable resource management policies and initiatives in different world regions, are not addressed in detail in this paper and are subject to further research.
The structure of the paper is as follows: In Section 2, we provide a short methodological background and describe the data which have been used in this study. In Section 3, results are presented regarding global trends and patterns of material extraction, trade, consumption, and material productivity. Section 4 discusses the results from economic, social and environmental perspectives. Section 5 concludes.
2. Methodology and Data
For the compilation of the data used in this paper, we follow the guidelines for economy-wide material flow accounts (EW-MFA) as published by EUROSTAT [18]. We focus on used materials, i.e., the part of material extraction that enters economic processes as well as direct material trade, which reflects the mass of imported and exported products. The main indicator we apply is Domestic Material Consumption (DMC), which is calculated as Domestic Extraction Used (DEU) plus the Physical Trade Balance (PTB), i.e., direct imports minus direct exports.
DMC is currently the most widely used MFA-based indicator in policy processes, for example, in the context of the implementation of the European “Roadmap to a Resource Efficient Europe” [16], where GDP over DMC was selected as the headline indicator. DMC is a widely accepted MFA indicator, in particular in statistical institutions, as it can to a large extent be constructed based on official national production and trade statistics. DMC data have thus been compiled for a much larger number of countries and from a large variety of statistical and academic institutions compared to other more complex indicators, which consider up-stream material flows of imports and exports and often build on modelled data, such as Raw Material Consumption (RMC). Further, DMC has a high environmental relevance as an indicator of potential environmental pressure on the domestic territory. DMC covers all used materials on the input side, which actually flow through the domestic economy and which are either emitted back to the environment as waste and emissions or contribute to the increase of the national physical stock with potential flows of waste and emissions in the future [34]. Furthermore, when designing national strategies for resource management, DMC and its components are easier to address by governments compared to indicators which include material flows in other countries along the supply-chains of imported products and thus require international policy cooperation.
However, it has to be clearly stated that the DMC indicator does not account for all global material flows related to final consumption in a country or region, as indirect (or embodied) materials of imported (and exported) products are not considered. Countries can therefore apparently reduce their material consumption as measured with the DMC indicator by outsourcing material-intensive extraction and processing abroad. Assessing the global material use related to final consumption requires other MFA-based indicators, such as RMC [35,36,37,38]. These aspects need to be considered when evaluating DMC results across countries, for example, regarding achievements of de-coupling material consumption from economic growth (see also Section 4 below). Furthermore, it needs to be emphasised that DMC does not account for unused material extraction, such as overburden from metal or coal mining or harvest residues in agriculture. However, these unused material flows cause various environmental pressures, such as water pollution and landscape changes [39]. In order to consider these flows, indicators such as Total Material Requirement (TMR) or Total Material Consumption (TMC) need to be applied.
This study is based on the integration of two existing data bases. First, the global database on material extraction developed by the authors of this paper and available at www.materialflows.net, which is based on international statistics such as the International Energy Agency (IEA), the Food and Agriculture Organization of the United Nations (FAO), and the US and British Geological Surveys (USGS and BGS, respectively) [40]. The data contained in the data base are subject to various routines of quality assurance such as checks for consistency among different data sources and for plausibility within time series. Still, international MFA data quality varies for the different types of materials: It is generally good for the extraction of fossil fuels and net metal production, however, in many cases, estimations have to be applied regarding the concentration of metals in crude ore extraction. While the FAO data on worldwide harvest of biomass is very comprehensive and to a large extent reliable, estimations need to be applied for some categories in biomass extraction, most notably the direct uptake of biomass by livestock (grazing). It can also be assumed that biomass extraction for subsistence purposes is generally underestimated. Another area where data reporting by companies or national statistical institutions is not satisfying is the extraction of construction minerals. For the data base, these data were estimated based on physical production data of cement and bitumen and compared with reported numbers, in order to get a comprehensive and meaningful coverage [40].
As the second major data source, the global database on resource trade, developed at University of Cologne and the Wuppertal Institute in Germany has been applied. It is based on UN Comtrade data and includes global accounts of imports and exports in physical (weight) units. In UN Comtrade all monetary values of traded commodities are available, but around 5%–20% of the physical values are missing, depending on country/commodity/commodity group and year. Therefore, the missing physical values were filled using the monetary data in combination with the global annual price for each commodity group also available in UN Comtrade, starting with the most differentiated level and working step-wise up to the higher level of aggregation up to the total sum of a country’s physical trade. Major outliers in direct trade flows were corrected by adjusting the concerned values to the extent possible with national or international sector statistics such as data from the IEA. In other cases, bilateral trade data were used to identify outliers, comparing import and respective export data provided by the country and the respecting trading partner and using the more plausible one. If no bilateral data were available global average prices were used to correct outliers. A more detailed methodological description is given by Dittrich [41] and Dittrich and Bringezu [32]. In general, UN Comtrade trade statistics are relatively good with regard to completeness, plausibility and level of differentiation, more so for recent years than for earlier years. The trade statistics for European and Latin American countries are generally good, while the trade statistics for African and Central Asian countries are rather incomplete and fragmented.
Additional data sources for establishing the indicators were the World Bank data on GDP, expressed in constant international 2005 US$ purchasing power parities (PPP) [42] as well as population data from the FAO [43]. Data on the Human Development Index (HDI) were taken from UNDP [44] and data for CO2 emissions from the Human Development Database [45].
3. Results
In the following, we present the main results of the global material flow analysis regarding material extraction, trade, consumption and productivity. Table 1 provides an overview of the results, presenting values for all continents and selected major countries for the years 1980 and 2009.
3.1. Material Extraction
Since 1980, global material extraction grew on average 2.4% per year, with an aggregated growth of 93.4%, from around 35 billion tonnes in 1980 to 67.6 billion tonnes in 2009. The share of non-renewable materials (fossil fuels, metal ores and minerals) in global extraction increased from 61% in 1980 to 71% in 2009, while the share of renewable materials (biomass) decreased from 39% to 29%, respectively, during the same period.

Table 1.
Material extraction, trade, consumption and productivity by continent and in selected major economies, 1980-2009.
| Region | Domestic Extraction Used (DEU)(in million tonnes) | Physical Trade Balance (PTB) (in million tonnes) | Domestic Material Consumption (DMC)(in million tonnes) | DMC per capita (in tonnes/cap) | Material productivity (in US$(PPP), const. 2005/t) | ||||||||||
|---|---|---|---|---|---|---|---|---|---|---|---|---|---|---|---|
| 1980 | 2009 | % change | 1980 | 2009 | % change * | 1980 | 2009 | % change | 1980 | 2009 | % change | 1980 | 2009 | % change | |
| Africa | 2,658.9 | 5,150.0 | 93.7% | −284.4 | −384.3 | −35.1% | 2,395.0 | 4,802.1 | 100.5% | 5.0 | 4.8 | −4.5% | 374.1 | 544.0 | 45.4% |
| Egypt | 141.9 | 616.0 | 334.0% | 1.4 | -6.9 | −583.0% | 143.4 | 609.1 | 324.8% | 3.3 | 7.6 | 132.7% | 753.6 | 702.2 | −6.8% |
| Nigeria | 266.4 | 496.9 | 86.5% | −78.5 | −90.1 | −14.7% | 187.9 | 406.8 | 116.5% | 2.6 | 2.6 | −0.4% | 661.6 | 770.6 | 16.5% |
| South Africa | 524.8 | 667.5 | 27.2% | −32.2 | −101.7 | −215.8% | 492.6 | 565.8 | 14.9% | 16.9 | 11.4 | −32.9% | 490.5 | 815.7 | 66.3% |
| Asia | 14,323.1 | 38,675.2 | 170.0% | −397.8 | 599.5 | 250.7% | 13,925.3 | 39,274.6 | 182.0% | 4.9 | 9.2 | 87.2% | 390.4 | 663.5 | 69.9% |
| China | 2,898.5 | 20,354.2 | 602.2% | 18.5 | 1195.3 | 6,369.8% | 2,917.0 | 21,549.5 | 638.8% | 3.0 | 15.8 | 433.6% | 176.3 | 383.4 | 117.6% |
| India | 1,696.2 | 4,696.1 | 176.9% | 3.2 | 131.3 | 4,064.6% | 1,699.4 | 4,827.4 | 184.1% | 2.5 | 4.0 | 62.0% | 362.3 | 705.2 | 94.7% |
| Japan | 887.7 | 629.1 | −29.1% | 524.7 | 551.7 | 5.1% | 1,412.3 | 1,180.8 | −16.4% | 12.1 | 9.3 | −22.8% | 1,474.7 | 3,200.3 | 117.0% |
| Russian Federation | – | 2341.7 | – | – | −623.2 | – | – | 1,718.6 | – | – | 12.0 | – | – | 1,124.3 | – |
| Europe | 6,730.7 | 6,944.0 | 3.2% | 872.3 | 877.3 | 0.6% | 7,656.8 | 7,951.4 | 3.8% | 16.3 | 13.0 | −19.8% | 971.0 | 1,857.4 | 91.3% |
| France | 776.3 | 705.9 | −9.1% | 152.4 | 144.1 | −5.5% | 928.7 | 850.0 | −8.5% | 17.2 | 13.6 | −21.0% | 1,203.7 | 2,220.4 | 84.5% |
| Germany | 1,481.1 | 951.8 | −35.7% | 205.2 | 198.4 | −3.3% | 1,686.3 | 1150.2 | −31.8% | 21.5 | 14.0 | −35.2% | 968.5 | 2,291.1 | 136.6% |
| United Kingdom | 678.6 | 538.2 | −20.7% | 39.4 | 99.6 | 153.1% | 718.0 | 637.8 | −11.2% | 12.7 | 10.3 | −18.9% | 1,423.9 | 3,146.5 | 121.0% |
| Latin America | 4,019.5 | 8,151.4 | 102.8% | −182.3 | −595.9 | −226.8% | 3,864.7 | 7,636.6 | 97.6% | 10.6 | 13.1 | 23.4% | 685.4 | 715.1 | 4.3% |
| Brazil | 1,337.3 | 3,122.0 | 133.5% | −37.4 | −344.6 | −821.4% | 1,299.9 | 2,777.4 | 113.7% | 10.7 | 14.4 | 34.5% | 708.5 | 658.8 | −7.0% |
| Chile | 192.0 | 733.7 | 282.2% | −3.6 | −5.9 | −63.4% | 188.4 | 727.8 | 286.3% | 16.9 | 42.9 | 154.6% | 335.0 | 321.8 | −3.9% |
| Mexico | 620.0 | 1032.0 | 66.4% | -40.7 | 9.4 | 123.0% | 579.4 | 1041.4 | 79.7% | 8.4 | 9.3 | 11.2% | 1,215.4 | 1,288.1 | 6.0% |
| North America | 6,317.7 | 6,741.9 | 6.7% | 30.7 | 141.9 | 361.5% | 6,348.5 | 6,883.7 | 8.4% | 24.8 | 20.1 | −18.9% | 1,002.4 | 2,012.7 | 100.8% |
| Canada | 886.0 | 958.6 | 8.2% | −91.1 | −215.5 | −136.5% | 794.9 | 743.1 | −6.5% | 32.4 | 22.1 | −31.9% | 713.7 | 1,567.2 | 119.6% |
| United States of America | 5,431.2 | 5,781.3 | 6.4% | 121.9 | 357.4 | 193.2% | 5,553.1 | 6,138.7 | 10.5% | 24.0 | 20.0 | −17.0% | 1,043.8 | 2,067.2 | 98.0% |
| Oceania | 900.5 | 1,933.8 | 114.7% | −143.3 | −696.6 | −386.0% | 761.8 | 1242.1 | 63.0% | 34.6 | 35.6 | 2.9% | 461.0 | 704.8 | 52.9% |
| Australia | 722.8 | 1,713.6 | 137.1% | −142.3 | −684.7 | −381.1% | 580.5 | 1028.9 | 77.2% | 39.7 | 47.0 | 18.5% | 500.8 | 727.3 | 45.2% |
| World ** | 34,950.4 | 67,596.2 | 93.4% | – | – | – | 34,951.9 | 67,790.6 | 94.0% | 7.9 | 9.9 | 25.4% | 753.6 | 952.4 | 26.4% |
Notes: * PTB: Change rates from net export to net import are illustrated as positive, change rates from net import to net export as negative, increasing net exports as negative, increasing net imports as positive, and vice versa; ** Data on DEU and DMC do not exactly match on the global level due to rounding errors.
With 43% in 2009, minerals dominated global material extraction, with the major part consisting of sand and gravel. Fossil fuels made up for almost 19% of global material extraction, in particular hard coal (46% of extracted fossil fuels), crude oil (27%) and natural gas (17%). Almost 10% of global extractions were metal ores, in particular iron ore (36% of extracted metal ores), followed by copper (24%) and gold (13%). Extraction of biomass consisted of feed products (49% of extracted biomass in 2009), plant-based food (38%) and products from forestry (12%). The remaining biomass extraction (1%) is constituted by fish catches and other biomass.
In the period between 1980 and 2009, the majority of materials were extracted in Asian countries. With 170%, the region also had the largest growth in material extraction. Extraction also grew above the world average in Latin America and Oceania (103% and 115%, respectively), in Africa around global average (94%), while it increased below global average in North America and Europe (7% and 3%, respectively). As a consequence, Asia’s share in global extraction grew from 41% in 1980 to 57% in 2009, while Europe’s share declined from 19% to 10% during the same period.
Extraction per capita in 2009 varied significantly among continents, ranging from 5.1 tonnes in Africa to 55.5 tonnes in Oceania. In Asia, the average extraction per capita was 9 tonnes, in Europe 11.4 tonnes, in Latin America 14 tonnes and in North America 19.7 tonnes. Between 1980 and 2009, material extraction per capita increased fastest in Asia (79%), followed by Oceania (35.5%) and Latin America (27%), while in Europe, North America and Africa, material per capita extraction actually declined (−20%, −20% and −8%, respectively).
3.2. Physical Trade
From 1980, on the global level physical trade grew by 3.4% annually, reaching 10.3 billion tonnes in 2008, and dropping to 9.4 billion tonnes in 2009 as a consequence of the global economic crisis, which caused a down-turn of international trade intensity (see [46] for the development of global trade in monetary terms). In physical terms, global trade is dominated by fossil fuels. Trade with fossil fuels increased below the average growth in physical trade (106%), resulting in a decline of its share in total global trade from 56% in 1980 to 49% in 2009. Although its physical trade volume stagnated since 2006, crude oil is still the dominant traded commodity (61% of traded fossil fuels in 2009), followed by coal (19% of traded fossil fuels) and natural gas (13%). Around 1.9 billion tonnes of metal ores and metals, including commodities predominantly made out of metals, were traded in 2009 (1980: 647 million tonnes, +188%), making it the second highest share in global physical trade with 20% in 2009 (up from 16% in 1980). Trade in metals is dominated by iron ores and concentrates as well as steel (in 2009, 69% of traded metals), followed by commodities predominantly made of metals (18%). In 2009, 1.6 billion tonnes of biomass were traded; including commodities predominantly made from biomass such as paper (an increase of about 154% since 1980). The share of biomass in global trade has been constantly around 16% during the investigated 30 years, rising slightly to 17% in 2009. Within the group of traded biomass, trade with food, in particular cereals, dominated with 43% in 2009, followed by products made from biomass (23%) and timber (17%). One billion tonnes of non-metal minerals were traded in 2009, a growth of 131% since 1980 (436 million tonnes), in particular construction minerals (38% of traded non-metal minerals in 2009). Construction minerals are mainly traded between neighbouring countries such as Indonesia and Singapore or Germany and the Netherlands, due to high transport costs.
OECD countries together imported the largest amounts of materials in all investigated years. However, also Australia, the largest supplier of materials globally in 2009, was part of this country group. In contrast, non-OECD countries with high incomes (according to World Bank country classification) are resource exporters, in particular due to the oil-exporting countries. As a group, countries with upper-middle incomes such as Russia, Brazil and South Africa supplied most materials in physical terms during the investigated period. Countries with lower-middle incomes changed from supplier to importer in physical terms mainly due to developments in China and India, which turned from net-material exporters to net-material importers during the 1970s and 1980s, respectively [41]. Low income countries net-exported materials until 1994. Thereafter, they net-imported materials, in particular biomass.
Trade in physical terms was dominated by a small number of countries. In 2009, the 10 countries with the highest physical trade volumes imported and exported 96.7% of globally traded materials while at the bottom end, more than 50 countries together participated less than 1% in total physical trade—or less than 10 million tonnes of materials. Furthermore, the “direction” of net-trade of the countries, i.e., whether countries are net-importers or net-exporters, is generally constant, although the amount of net-imports or net-exports increased. Only a few countries changed from being net-importers to net-exporters, whereas more countries changed from being net-exporters to net-importers. This tendency shows that a rather stagnating number of countries supply increasingly more materials to an increasing number of resource demanders on the global markets [41].
3.3. Material Consumption
On the global level, material extraction equals material consumption. Therefore, in parallel to material extraction, global DMC also increased by 94% up to 67.8 billion tonnes between 1980 and 2009. With 3.4% per annum, growth was particularly fast after the year 2000, mainly due to China’s rapidly increasing material demand. On the continental level, material consumption increased above the global average in Asia (+182%), Africa (+100.5%) and Latin America (+98%) with slower growth in Oceania (including Australia, +63%), North America (+8.5%) and Europe (+4%). With more than 38.6 billion tonnes in 2009 more than half of global material extraction was consumed in Asia (58%), followed by Europe (12%), Latin America (11%) and North America (10%). Africa’s share in global consumption was around 7% and Oceania’s share only 2%. Grouping countries by income levels reveals the major shifts in the world economy even more clearly (see Figure 1).
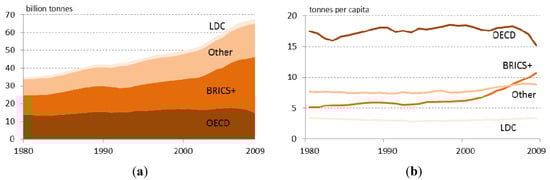
Figure 1.
(a) Absolute material consumption of country groups, 1980–2009; (b) per-capita material consumption of country groups, 1980–2009.
Absolute material consumption of OECD countries increased slightly until 2004 and decreased substantially thereafter, in particular since 2007. However, the relative share changed considerably, shrinking from 43% in 1980 to 24% in 2009. Since 2001, lower middle-income countries (termed BRICS+ in Figure 1) together consumed more materials than OECD countries with the former group quadrupling its material consumption between 1980 and 2008 (an aggregated growth of 304%). The BRICS+ countries have thus turned into the biggest consumer of direct materials, with almost 50% of global DMC in 2009, starting from 21% in 1980. In contrast, the absolute material consumption of low income countries only doubled during the 30 years (+117%), with the share remaining at 4% across the time period. The steep increase in absolute material consumption in the BRICS+ countries was accompanied by huge per-capita increases. In this country group, per-capita consumption grew from 3.7 tonnes in 1980 to 10.7 tonnes in 2009. Material consumption per capita in some BRICS+ countries even outreached average European material consumption, notably China with 15.8 tonnes. At the same time, per-capita consumption remained almost constant in the group of OECD countries (between 17 and 17.5 tonnes) from 1980 to 2008, and fell sharply in 2009 (15.5 tonnes) as a consequence of the emerging economic crisis.
Looking at single countries in the world economy, it can be observed that absolute material consumption is concentrated in only a few countries. In 2009, the five countries with the highest absolute material consumption were China, USA, India, Brazil and Russia. These five countries consumed 55% of globally extracted materials, while making up for 47% of global population. On the other end of the spectrum, the 150 countries with the lowest absolute DMC together held a share of only around 6% of global DMC, together having a share of almost 11% of global population.
This has important policy implications, as the concentration of global material use in a small group of countries implies that any global resource management agreement needs to integrate the top-consuming countries, in order to be able to change global trends in material use [33].
3.4. Material Productivity
As described above, material extraction and consumption increased by 94% between 1980 and 2009. In the same time period, global GDP (in constant PPP terms) increased by 145%. Thus, material productivity (GDP generated per unit DMC) improved by an aggregated 27%, equating to an average annual growth rate of around 1% (Figure 2). The global economy thus reached a relative decoupling of economic growth from material extraction and consumption (expressed with the DMC) in the past three decades; however, since 2000, material consumption increased in parallel to GDP, so for the past 10 years, not even a relative decoupling was achieved on the global level. It is important to note that the decrease in global GDP in 2009 due to the global economic crisis had a remarkable impact on material productivity which decreased by 2% between 2008 and 2009. In this context, it is interesting to note that the main drivers of the global increase of material consumption, most importantly the BRICS countries, have been less affected by the economic crisis compared to the OECD countries. As an effect, global GDP decreased due to the recessions in many OECD countries, while material consumption continued to grow mainly due to increasing demand for raw materials in the BRICS countries.
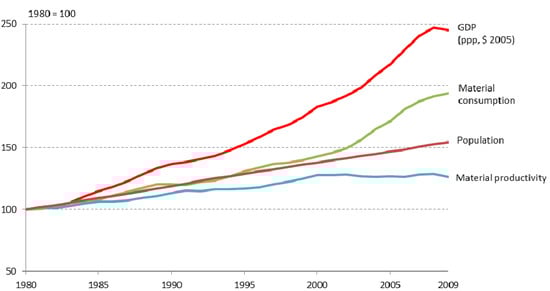
Figure 2.
Trends of GDP, DMC, population, material productivity (GDP/DMC) and material intensity (DMC/GDP), global level, 1980–2009.
Material productivity as measured with GDP/DMC in Europe and North America was constantly higher than in other world regions between 1980 and 2009. North America surpassed Europe in the year 2009, as DMC decreased by 14.7% compared to 2008, while in Europe, DMC was only 6.5% lower. Over the whole period of 1980–2009, both continents significantly improved material productivity, reaching 2013 US$ (PPP) per tonne in North America and 1857 US$ in Europe. Starting from much lower levels in 1980 (see Table 1 above), material productivity also improved in Asia, Africa and Australia (by 70%, 45% and 53%, respectively). With only 4%, material productivity improvements were lowest in Latin America, in particular as GDP growth was slower in Latin America compared to the other developing and emerging regions, while increases in DMC were significant (98% aggregated growth). In general, the differences in material productivity between Europe and North America on the one hand and the other continents on the other hand further increased during the past three decades.
4. Discussion
In this section, we aim to analyse the above-presented results from various perspectives. We discuss to what extent the widely used DMC indicator is a meaningful indicator to monitor progress towards “green growth”. We also elaborate on the relationship between material consumption and human development and finally provide the main aspects of the links between material consumption and environmental impacts of material use.
4.1. Material Consumption, Productivity and “Green Growth”
“Green growth” is a term that has been widely used by international organizations such as the OECD to promote development strategies which “maximise economic growth and development while avoiding unsustainable pressure on the quality and quantity of natural assets” [14]( p. 9). GDP/DMC is often suggested as an indicator of “green growth” and “green economy” [14,15] and applied for the evaluation of trends in material productivity. However, the GDP/DMC indicator underlies shortcomings, in particular when performing a comparative assessment across countries. Higher material productivity as measured with GDP/DMC does not necessarily reflect lower material consumption, but in the majority of cases results from higher economic output and income [47]. This is also confirmed by the data presented in this paper, where DMC has increased in absolute terms across all continents along with an improved material productivity (see Table 1 above). With an increase of 27% during the past three decades or annually 1% on the global level, the improvements of material productivity are still much too slow to achieve an absolute reduction of material use, which would be needed to reduce the pressures put on the global ecosystems.
Further, indirect material flows associated with internationally traded products, i.e., up-stream materials needed for the production of traded goods are not considered by the DMC indicator, which thus does not fully reflect the consequences of increasing globalisation. Some economic sectors such as the agricultural or mining sectors (in particular, the metal mining sector) are more material-intensive than others (e.g. the high-tech or service-oriented sectors) [48]. Thus, countries with higher shares of material-intensive economic sectors in GDP generally show lower material productivity values than countries with higher shares of less material-intensive economic sectors. Examples are Chile with its extraction of metal ores versus South Korea with a high share of knowledge-based production in its economy [49]. Also, oil exporters usually show higher material productivities than metal extracting and exporting countries, because oil exports significantly increase GDP, while having a smaller effect on DMC compared to metal exports see also [31]. The smaller effect on DMC results from the fact that waste arising from metal concentration processes, i.e., the process of transforming crude ores with low concentrations into higher concentrated ores, is allocated to the DMC of the production country. This underlines the statement above that DMC is an indicator for potential environmental pressure on the national territory rather than an indicator reflecting the overall material use related to consumption. Metal extracting and exporting countries therefore generally have high DMC values and low corresponding resource productivities. These particular properties of the DMC indicator need to be considered, when evaluating the “green growth” performance of countries as measured with the indicator GDP/DMC, as it disadvantages resource-rich countries in which the most waste- and pollution-intensive parts of a product life-cycle take place [34].
The majority of countries examined in this paper improved their material productivity between 1980 and 2009 and achieved a relative de-coupling; however, the dynamics behind the respective improvements varied significantly. Figure 3 illustrates the aggregated changes in DMC versus the aggregated GDP growth for all countries world-wide between 1980 and 2009 and thus shows whether or not de-coupling has occurred.
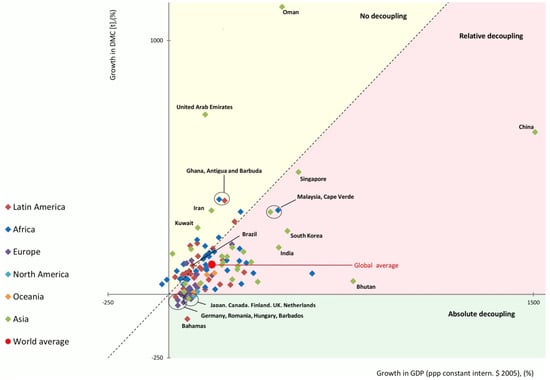
Figure 3.
Growth in constant GDP (PPP) and DMC, 1980–2009.
In general, the majority of countries—as well as the world economy as a whole (see above)—reached relative decoupling between 1980 and 2009, i.e., they were able to increase income faster than DMC. China, as an extreme case, increased its GDP by around 1500%, while DMC increased by 640%, leading to more than double material productivity. In a smaller number of countries, DMC grew more rapidly than GDP, resulting in no decoupling. This is particularly the case for oil exporting countries. For example, in Oman, DMC increased beyond 1000% in the 30-year period, and was also significant in countries such as the United Arab Emirates, Iran or Kuwait.
Absolute decoupling, i.e., GDP growth and falling DMC, was less common and only occurred in countries with relatively low economic growth across the observed period. Among this group of countries, some European countries are found, such as Germany, UK, Finland, the Netherlands or Hungary, but also Japan or Canada. Absolute decoupling of DMC from economic growth can have a variety of reasons, including de-industrialisation, structural change of economies towards service sectors as well as changes in the energy systems away from resource-intensive energy carriers such as coal [31].
Whether these examples of absolute decoupling actually represent an advance towards “green growth” on the international level must be questioned, given that in many cases material-intensive production was outsourced to other countries, thus reducing the DMC. A study by Wiebe et al. [50] found that between 1995 and 2005 the total exports of embodied materials from the BRICSA states, i.e., the BRICS group plus Argentina, to OECD countries increased by 85%, while imports of embodied materials of the BRICSA countries only increased by 50% in the same time range. A recent study by Wiedmann et al. [35] also confirmed that most industrialised countries have not improved their resource productivity when measured with an indicator including indirect material flows of trade (Material Footprints) instead of DMC. Also, other studies [49,51] point in the same direction.
This discussion illustrates the difficulty to define appropriate indicators for measuring national resource productivity [34]. GPD over DMC clearly has limitations in capturing the material effects of dislocation of resource intensive production. However, setting into relation a comprehensive Material Footprint indicator (such as Raw Material Consumption, RMC), which considers material inputs along the whole international supply-chain of products, with a national indicator on economic performance, such as GDP, is also conceptually inconsistent. For example, infrastructure (e.g., buildings, roads, ports, etc.) built-up in China to produce exports contributes significantly to the Chinese GDP, while the construction minerals to produce this export-serving infrastructure are allocated to those countries, which import products from China and are thus not factored into the Chinese resource productivity.
Instead of GDP, an option might be to use the final consumption plus imports minus exports as economic counterpart to RMC. Further conceptual work is needed to better clarify the meaning of various indicators for resource productivity, to elaborate which upstream flows should be allocated to international traded products and to identify the economic variable which is conceptually best fitting to the respective material indicator.
4.2. Material Consumption and Human Development
This paper does not attempt to provide any fundamental insight into the measurement of human well-being. However, it is a critical subject that should be taken into consideration in the debate about limited resource availability as well as when addressing the question of how to achieve well-being with lower average levels of material consumption.
From a range of indicators that have been suggested for measuring this dimension, for the following analysis of links with material consumption levels, we decided to use the Human Development Index (HDI) as a very widely-applied indicator, which is based on robust international data [52]. Also, there seems to be a strong correlation between subjective human well-being and health, wealth and access to basic education [53], which are well represented in the HDI. The following Figure 4 plots the HDI and DMC per capita across all countries world-wide.
Across all countries, only a low positive correlation (R² = 0.35) between HDI and DMC per capita can be observed. It can be seen that most countries with a HDI of below 0.6, in particular African countries, also all have DMC per-capita values of below 10 tonnes.
However, as HDI gets higher, the DMC per capita distribution becomes more scattered, indicating that a relatively high HDI can be achieved at very different DMC levels. For example, Japan, Germany, the US and Australia all have a HDI slightly above 0.9, but their DMC per capita numbers range from around 9.3 tonnes in Japan to around 47 tonnes in Australia.
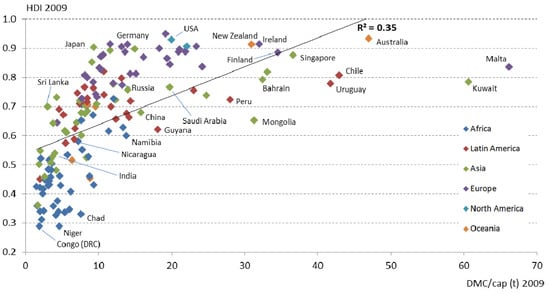
Figure 4.
DMC per capita and Human Development Index (HDI), 2009.
Obviously, patterns of economic specialisation, international trade and sectoral contribution to overall GDP play a key role in explaining these differences across countries with similar HDIs [54]. However, the result can also be interpreted in a way that—similar to higher income—increasing material consumption does not necessarily lead to higher levels of well-being. Easterlin et al. [55] showed that over the long term, life satisfaction in a country does not increase with a rise in average income (and related material consumption) in that country. Instead, nowadays, especially in the industrialised world, an increasing number of people suffer from stress, depression, obesity, and other problems, although not facing material shortages or issues with the fulfilment of their basic needs as do people in the poorer countries. In emerging economies and low income countries, on the other hand, there is still a necessity for resource-based economic growth in order to generate development and raise income levels to overcome poverty.
4.3. The Environmental Implications of Rising Material Consumption
Increasing material consumption on the global level is one of the key drivers for environmental problems and is directly or indirectly responsible for problems such as climate change, water scarcity or biodiversity loss [5,56]. This is due to the fact that extraction and use of materials always require inputs of energy, water or land and produce emissions to air, soil or water. On the aggregated level, a positive correlation can thus be observed between increased DMC and intensified environmental impacts [57].
In the following, we provide some reflections on the environmental consequences related to increasing material consumption of major material groups. We thereby focus on two of the most pressing environmental problems on the global level, fossil fuel consumption and its link to climate change as well as the nexus between biomass consumption and water scarcity. We acknowledge that there are many other issues which could have been assessed in more detail, such as links between increasing consumption of construction materials, land sealing due to spread of cities and transport infrastructure and resulting fragmentation of landscapes, with related negative impacts on biodiversity and ecosystems [58]. However, covering all relevant environmental topics would go far beyond the scope of this paper.
Global consumption of fossil fuels increased considerably in the investigated time period, from a DMC for coal, oil and gas of around 8 billion tonnes in 1980 to 12.6 billion tonnes in 2009. The main driver for this increase was Asia, which nearly doubled its fossil fuel consumption in the past 30 years. This increase is clearly linked to climate change, as fossil fuel combustion is the most important source for greenhouse gas emissions [59]. Figure 5 reveals the relation between the CO2 emissions per capita and DMC per capita in the year 2009 for all countries investigated in this paper.
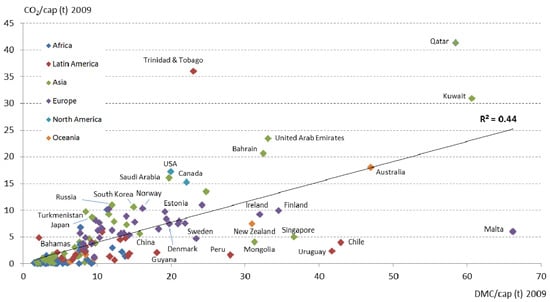
Figure 5.
DMC per capita and CO2 emissions per capita, 2009.
With regard to CO2 emissions, Qatar led the ranking of all countries in 2009, with 41 tonnes; Trinidad and Tobago followed with 36 tonnes, then Kuwait and the United Arab Emirates with 31 tonnes and 23.4 tonnes, respectively. The United States emitted 17 tonnes per capita, which was still more than 400 times as much as the per-capita emissions of the lowest emitter, i.e., the Republic of Congo with an average emission of about 0.04 tonnes [45].
Across all countries, a modest correlation (R² = 0.44) can be observed, indicating that increasing material consumption per capita in general leads to increases in per-capita CO2 emissions. However, the patterns of DMC versus CO2 are different for various country groups. Most Asian and African countries are located in the left bottom corner of the figure, indicating that both environmental pressure indicators per capita are low. Rich, oil exporting countries, such as Qatar and Kuwait show the opposite trend with both indicators at the upper end of the global country ranking. For some countries, high DMC per capita values go along with modest CO2 emissions. This is the case for metal-exporting countries such as Chile, Peru and Mongolia as well as for islands and small city states, such as Malta and Singapore.
Global harvest of biomass increased by 40% in the investigated time period, from around 13.5 billion tonnes in 1980 to around 19.5 billion tonnes in 2009. Of all economic activities, agriculture poses the biggest demand for water, with around 70% of global water use, mostly for irrigation purposes [5]. The irrigated crops often do not only satisfy the local requirements for food, but are often exported as feed or agro-energy source to other parts of the world. Increasingly, these cash crops for exports compete with local needs—not only with regard to the use as food but also to the use of water for other purposes than irrigation. In some regions, increased agricultural production results in a water use beyond the available renewable water reserves, leading to a non-sustainable exploitation of renewable and often also non-renewable water bodies [60]. As a consequence, similarly to the case of materials, when goods and services are exchanged, so-called “virtual water” (i.e., embedded water) necessary for their production is traded in the global economy. The more water-intensive the production of e.g. traded feed crops is, the higher the amount of traded embodied water [61]. This also leads to the question whether regions with water abundance should focus on the production of more water-intensive products and supply water-scarce regions with these products. The current situation shows that in fact the quantities of biomass production do not go hand in hand with the availability of water and that some countries specialize on water-intensive production despite facing water-shortage at the same time [61]. With changing diets to more animal products in many world regions [62] and increasing demand for biomass for energy generation, the pressures to increase biomass production will also further intensify water scarcity problems.
We are aware that, as explained above, environmental impacts of material consumption are more varied and complex than could be mirrored by these two examples. However, the examples illustrate that growing levels of global DMC and its components such as fossil fuels or biomass in the future will generally increase environmental pressures on the global level.
5. Conclusions
This paper presented and analysed selected material flow-based indicators and provided an assessment of material extraction, trade and consumption of all countries across the globe for the time range of 1980–2009. With 94%, global resource extraction and consumption increased considerably in the past 30 years to a level of around 70 billion tonnes today. In absolute numbers, Asia plays the most important role and in 2009 extracted, imported, exported, and consumed around half of all globally extracted materials. Per-capita material consumption increased most rapidly in the fast-growing emerging economies, such as China. At the same time, the share of OECD countries in global material consumption has significantly decreased, along with the shrinking contribution of this group to global GDP. Among the OECD countries, per-capita consumption remained more or less constant across the past 30 years. Material productivity has increased in the majority of countries, leading to a relative decoupling, but the relative improvements were overcompensated by economic growth. Along with the growing absolute levels of material consumption, environmental problems such as climate change or water scarcity increased. Based on the data underlying this paper, it must be concluded that the world as a whole is not on a track towards “greener growth” or a “green economy” [31].
Therefore, appropriate policies and frameworks have to be implemented, leading to reduced resource use and absolute reductions (dematerialisation) particularly in industrialised economies, in order to enable a more balanced allocation of material resources across the globe, which is also a requirement for improving the HDI in the poorest countries. An absolute reduction of material use would also decrease various pressures on the natural environment, including GHG emissions and demand for land and water. Although resource efficiency issues are in the core of several policy strategies on the European and international level, their impact on the actual trends so far has been very limited, as this paper has illustrated.
Data and methods underlying material flow-based indicators are still in process of improvement for providing a solid basis for policy assessments. Relevant examples concerning the further development of data on used material extraction are the calculations for biomass extraction of grazing animals (feed) and the development of harmonised procedures and data bases reporting the concentration of metals in crude ores.
Apart from data improvements, material-flow based indicators need to be further developed. One important direction is to develop more robust consumption-based indicators, which consider indirect material flows associated with internationally traded products. The DMC indicator should therefore be complemented by indicators such as Raw Material Consumption (RMC), which reflect the global material use related to the consumption of goods and services in a specific country or world region. Additionally, a more elaborated reflection on the advantages and limitations of various options for measuring material productivity as well as of the reasonable application of each methodology in a globalising world is required, in order to provide an appropriate basis for comparing the resource efficiency performance across countries.
Acknowledgments
We thank Liesbeth de Schutter for her feedback to a draft version and three anonymous reviewers for their very helpful comments.
Author Contributions
Stefan Giljum and Monika Dittrich designed the research. Monika Dittrich, Stephan Lutter and Mirko Lieber compiled and analysed the data. Stefan Giljum and Monika Dittrich wrote the paper.
Conflicts of Interest
The authors declare no conflict of interest.
References
- World Wide Fund for Nature. Living Planet Report 2012: Biodiversity, Biocapacity and Better Choices; World Wide Fund for Nature (WWF): Gland, Switzerland, 2012. [Google Scholar]
- Mudd, G.M. The Environmental sustainability of mining in Australia: Key mega-trends and looming constraints. Resour. Policy 2010, 35, 98–115. [Google Scholar] [CrossRef]
- International Energy Agency (IEA). World Energy Outlook 2012; International Energy Agency: Paris, France, 2012. [Google Scholar]
- Rockström, J.; Steffen, W.; Noone, K.; Persson, A.; Chapin, F.S.; Lambin, E.F.; Lenton, T.M.; Scheffer, M.; Folke, C.; Schellnhuber, H.J.; et al. A safe operating space for humanity. Nature 2009, 461, 472–475. [Google Scholar] [CrossRef]
- United Nations Environment Programme (UNEP). Global Environmental Outlook 5; United Nations Environment Programme: Nairobi, Kenya, 2012. [Google Scholar]
- European Commission. Tackling the Challenges in Commodity Markets and on Raw Materials; COM(2011) 25 Final; European Commission: Brussels, Belgium, 2011. [Google Scholar]
- Lee, B.; Preston, F.; Kooroshy, J.; Bailey, R.; Lahn, G. Resources Futures. A Chatham House Report; The Royal Institute of International Affairs: London, UK, 2012. [Google Scholar]
- Schmidt-Bleek, F. Will Gemany remain a good place for Industry? The ecological side of the coin. Fresenius Environ. Bull. 1992, 1, 417–422. [Google Scholar]
- Schmidt-Bleek, F. MIPS—A universal ecological measure. Fresenius Environ. Bull. 1992, 2, 407–412. [Google Scholar]
- Schmidt-Bleek, F. The Earth: Natural Resources and Human Intervention; Haus Publishing Limited: London, UK, 2009. [Google Scholar]
- Von Weizsäcker, E.; Hargroves, K.C.; Smith, M.H.; Desha, C.; Stasinopoulos, P. Factor 5. Transforming the Global Economy through 80% Improvements in Resource Productivity; Earthscan: Oxford, UK, 2009. [Google Scholar]
- World Resources Forum (WRF). Countries Should Annually Report on Resource Efficiency, WRF Concludes; WRF: Davos, Switzerland, 2013. [Google Scholar]
- Fischer-Kowalski, M.; Swilling, M.; von Weizsäcker, E.U.; Ren, Y.; Moriguchi, Y.; Crane, W.; Krausmann, F.; Eisenmenger, N.; Giljum, S.; Hennicke, P.; et al. Decoupling Natural Resource Use and Environmental Impacts from Economic Growth, A Report of the Working Group on Decoupling to the International Resource Panel; United Nations Environment Programme: Geneva, Switzerland, 2011. [Google Scholar]
- Organisation for Economic Co-operation and Development (OECD). Monitoring Progress towards Green Growth. OECD Indicators; Organization for Economic Cooperation and Development: Paris, France, 2011. [Google Scholar]
- United Nations Environment Programme (UNEP). Green Economy: Metrics and Indicators; United Nations Environment Programme: Geneva, Austria, 2012. [Google Scholar]
- European Commission. Roadmap to a Resource Efficient Europe; COM(2011) 571 Final; European Commission: Brussels, Belgium, 2011. [Google Scholar]
- Fischer‐Kowalski, M.; Krausmann, F.; Giljum, S.; Lutter, S.; Mayer, A.; Bringezu, S.; Moriguchi, Y.; Schütz, H.; Schandl, H.; Weisz, H. Methodology and indicators of economy-wide material flow accounting. J. Ind. Ecol. 2011, 15, 855–876. [Google Scholar] [CrossRef]
- European Statistical Office (EUROSTAT). Economy-Wide Material Flow Accounts (EW-MFA). Compilation Guide 2013; Statistical Office of the European Communities: Luxembourg, 2013. [Google Scholar]
- Organisation for Economic Co-operation and Development (OECD). Measuring Material Flows and Resource Productivity; ENV/EPOC/SE(2006)1/REV3; Organization for Economic Co-operation and Development: Paris, France, 2007. [Google Scholar]
- Organisation for Economic Co-operation and Development (OECD). Resource Productivity in the G8 and the OECD; Organization for Economic Co-operation and Development: Paris, France, 2011. [Google Scholar]
- United Nations Environment Programme (UNEP). Recent Trends in Material Flows and Resource Productivity in Asia and the Pacific 2013; UNEP Division of Early Warning and Assessment: Bangkok, Thailand, 2013. [Google Scholar]
- Schandl, H.; West, J. Resource use and resource efficiency in the Asia–Pacific region. Glob. Environ. Change 2010, 20, 636–647. [Google Scholar] [CrossRef]
- Giljum, S.; Dittrich, M.; Bringezu, S.; Polzin, C.; Lutter, S. Resource Use and Resource Productivity in Asia: Trends over the Past 25 Years; Sustainable Europe Research Institute: Vienna, Austria, 2010. [Google Scholar]
- United Nations Environment Programme (UNEP). Recent Trends in Material Flows and Resource Productivity in Latin America; United Nations Environment Programme: Nairobi, Kenya, 2013. [Google Scholar]
- West, J.; Schandl, H. Material use and material efficiency in Latin America and the Caribbean. Ecol. Econ. 2013, 94, 19–27. [Google Scholar] [CrossRef]
- Russi, D.; Gonzalez-Martinez, A.C.; Silva-Macher, J.C.; Giljum, S.; Martinez-Alier, J.; Vallejo, M.C. Material flows in Latin America. A comparative analysis of Chile, Ecuador, Mexico and Peru, 1980–2000. J. Ind. Ecol. 2008, 12, 704–720. [Google Scholar] [CrossRef]
- United Nations Conference on Trade and Development (UNCTAD). Economic Development in Africa. 2012 Report. Structural Transformation and Sustainable Development; United Nations Conference on Trade and Development: Geneva, Switzerland, 2012. [Google Scholar]
- Behrens, A.; Giljum, S.; Kovanda, J.; Niza, S. The material basis of the global economy: Worldwide patterns of natural resource extraction and their implications for sustainable resource use policies. Ecol. Econ. 2007, 64, 444–453. [Google Scholar] [CrossRef]
- Krausmann, F.; Fischer-Kowalski, M.; Schandl, H.; Eisenmenger, N. The global socio-metabolic transition: Past and present metabolic profiles and their future trajectories. J. Ind. Ecol. 2008, 12, 637–656. [Google Scholar] [CrossRef]
- Steinberger, J.K.; Krausmann, F.; Eisenmenger, N. Global patterns of material use: A socioeconomic and geophysical analysis. Ecol. Econ. 2010, 69, 1148–1158. [Google Scholar] [CrossRef]
- Steinberger, J.K.; Krausmann, F.; Getzner, M.; Schandl, H.; West, J. Development and dematerialization: An international study. PLoS One 2013, 8. [Google Scholar] [CrossRef]
- Dittrich, M.; Bringezu, S. The physical dimension of international trade. Part I: Direct global flows between 1962 and 2005. Ecol. Econ. 2010, 69, 1838–1847. [Google Scholar] [CrossRef]
- Dittrich, M.; Giljum, S.; Lutter, S.; Polzin, C. Green Economies around the World? The Role of Resource Use for Development and the Environment; Sustainable Europe Research Institute (SERI): Vienna, Austria, 2012. [Google Scholar]
- Marra Campanale, R.; Femia, A. An environmentally ineffective way to increase resource productivity: Evidence from the Italian case on transferring the burden abroad. Resources 2013, 2, 608–627. [Google Scholar] [CrossRef]
- Wiedmann, T.; Schandl, H.; Lenzen, M.; Moran, D.; Suh, S.; West, J.; Kanemoto, K. The material footprint of nations. Proc. Natl. Acad. Sci. 2013. [Google Scholar] [CrossRef]
- Munoz, P.; Giljum, S.; Roca, J. The raw material equivalents of international trade: Empirical evidence for Latin America. J. Ind. Ecol. 2009, 13, 881–897. [Google Scholar] [CrossRef]
- Schaffartzik, A.; Eisenmenger, N.; Krausmann, F.; Weisz, H. Consumption-based material flow accounting. Austrian trade and consumption in raw material equivalents 1995–2007. J. Ind. Ecol. 2013, 2013. [Google Scholar] [CrossRef]
- Femia, A.; Moll, S. Use of MFA-Related Family of Tools in Environmental Policy-Making. Overview of Possibilities, Limitations and Existing Examples of Application in Practice; European Environment Agency: Copenhagen, Denmark, 2005. [Google Scholar]
- Bringezu, S.; Schütz, H.; Moll, S. Rationale for interpretation of economy-wide materials flow analysis and derived indicators. J. Ind. Ecol. 2003, 7, 43–64. [Google Scholar] [CrossRef]
- SERI. Technical Report on the Compilation of the Material Flow Database. 2013. Available online: http://www.materialflows.net/fileadmin/docs/materialflows.net/MFA_technical_report_May_2013.pdf (accessed on 6 October 2013).
- Dittrich, M. Physische Handelsbilanzen. Verlagert der Norden Umweltbelastungen in den Süden? Kölner Geographische Arbeiten: Köln, Germany, 2010. (in German) [Google Scholar]
- World Bank World Development Indicators, International Comparison Program database. Available online: http://data.worldbank.org/indicator/NY.GDP.MKTP.PP.KD (accessed on 22 October 2013).
- FAOSTAT, Population. Available online: http://faostat3.fao.org/faostat-gateway/go/to/download/O/OA/E (accessed on 31 May 2013).
- UNDP Human Development Report Office (HDRO). Available online: http://hdrstats.undp.org/en/indicators/103106.html (accessed on 17 October 2013).
- World Bank World Development Indicators. Available online: http://data.worldbank.org/indicator/EN.ATM.CO2E.KT (accessed on 31 October 2013).
- World Trade Organisation (WTO). International Trade Statistics 2010; World Trade Organisation: Geneva, Switzerland, 2010. [Google Scholar]
- Steinberger, J.K.; Krausmann, F. Material and energy productivity. Environ. Sci. Technol. 2011, 45, 1169–1176. [Google Scholar] [CrossRef]
- European Environment Agency (EEA). Environmental Pressures from European Consumption and Production: A Study in Integrated Environmental and Economic Analysis; EEA Report No. 2/2013; European Environment Agency: Copenhagen, Denmark, 2013. [Google Scholar]
- Dittrich, M.; Giljum, S.; Bringezu, S.; Polzin, C.; Lutter, S. Resource Use and Resource Productivity in Emerging Economies: Trends over the Past 20 Years; SERI Report No. 12; Sustainable Europe Research Institute (SERI): Vienna, Austria, 2011. [Google Scholar]
- Wiebe, C.; Bruckner, M.; Giljum, S.; Lutz, C.; Polzin, C. Carbon and materials embodied in the international trade of emerging economies: A multi-regional input-output assessment of trends between 1995 and 2005. J. Ind. Ecol. 2012, 16, 636–646. [Google Scholar] [CrossRef]
- Schütz, H.; Bringezu, S.; Moll, S. Globalisation and the Shifting Environmental Burden. Material Trade Flows of the European Union; Wuppertal Institute: Wuppertal, Germany, 2004. [Google Scholar]
- United Nations Development Programme (UNDP). 2013 Human Development Report—The Rise of the South: Human Progress in a Diverse World; United Nations Development Programme: New York, NY, USA, 2013. [Google Scholar]
- White, A. A global projection of subjective well-being: A challenge to positive psychology. Psychtalk 2007, 56, 17–20. [Google Scholar]
- Steger, S.; Bleischwitz, R. Drivers for the use of materials across countries. J. Clean. Prod. 2011, 19, 816–826. [Google Scholar] [CrossRef]
- Easterlin, R.A.; McVey, L.A.; Switek, M.; Sawangfa, O.; Zweig, J.S. The happiness-income paradox revisited. Proc. Natl. Acad. Sci. 2010, 107, 22463–22468. [Google Scholar]
- European Environment Agency (EEA). Material Resources and Waste—2012 Update; European Environment Agency: Copenhagen, Denmark, 2012. [Google Scholar]
- Van der Voet, E.; van Oers, L.; Nikolic, I. Dematerialisation: Not just a matter of weight. J. Ind. Ecol. 2005, 8, 121–137. [Google Scholar]
- European Environment Agency (EEA). Landscape Fragmentation in Europe; EEA Report No. 2/2011; European Environment Agency: Copenhagen, Denmark, 2011. [Google Scholar]
- Intergovernmental Panel on Climate Change (IPCC). Climate Change 2013. The Physical Science Basis; Intergovernmental Panel on Climate Change: Geneva, Switzerland, 2013. [Google Scholar]
- Global Water Partnership (GWP). Integrated Water Resources Management; Global Water Partnership: Stockholm, Sweden, 2000. [Google Scholar]
- Allan, J.A. Virtual water—The water, food and trade nexus: Useful concept or misleading metaphor? Water Int. 2003, 28, 4–11. [Google Scholar] [CrossRef]
- Kastner, T.; Rivas, M.J.I.; Koch, W.; Nonhebel, S. Global changes in diets and the consequences for land requirements for food. Proc. Natl. Acad. Sci. 2012, 109, 6868–6872. [Google Scholar] [CrossRef]
© 2014 by the authors; licensee MDPI, Basel, Switzerland. This article is an open access article distributed under the terms and conditions of the Creative Commons Attribution license (http://creativecommons.org/licenses/by/3.0/).