Article

A Smart Shirt Made with Conductive Ink and Conductive Foam for the Measurement of Electrocardiogram Signals with Unipolar Precordial Leads

1
Advanced Scientific Research Leaders Development Unit, Gunma University, 1-5-1 Tenjin-cho, Kiryu, Gunma 376-8515, Japan
2
Department of Mechanical Science and Technology, Gunma University, 1-5-1 Tenjin-cho, Kiryu, Gunma 376-8515, Japan
3
Department of Anesthesiology, Gunma University, 3-39-22, Showa-machi, Maebashi, Gunma 371-8511, Japan
*
Author to whom correspondence should be addressed.
These authors contributed equally to this work.
Fibers 2015, 3(4), 463-477; https://doi.org/10.3390/fib3040463
Submission received: 21 September 2015 / Accepted: 28 October 2015 / Published: 3 November 2015
(This article belongs to the Special Issue Smart Textiles)

Abstract

:
The Holter monitor is used to measure an electrocardiogram (ECG) signal while a subject moves. However, the Holter monitor is uncomfortable for the subject. Another method of measuring the ECG signal uses a smart shirt. We developed a smart shirt that has six electrodes on the chest and can measure a detailed ECG, obtained with unipolar precordial leads. The electrodes and wires of the shirt are made of conductive ink that is flexible and stretchable. The smart shirt is stretchable and fits the body well. However, because of the gap between the smart shirt and the body, electrodes V1 and V2 do not touch the body consistently. We developed a conductive foam block that fills this gap. We investigated the characteristics of the conductive foam block, and measured ECG signals using the smart shirt. The electrical resistance of the conductive foam block was reduced by pressure. This characteristic could be utilized to measure the ECG signal because the block was pressed by the body and smart shirt. We could measure the ECG signal using the smart shirt and blocks while the subject walked and could detect peaks of the ECG signal while the subject jogged slowly.

Graphical Abstract

1. Introduction

In the fields of medicine and sports science, the Holter monitor is used to measure an electrocardiogram (ECG) signal while a subject moves. Electrodes must be pasted to the skin of the subject using electrical conductive adhesion gel, and cables are used to connect the electrodes to the Holter monitor. These electrodes and cables make ECG measurements uncomfortable for the subject. To eliminate the uncomfortable feeling of the electrodes and cables, other methods using dry electrodes have been proposed [1,2,3,4,5,6,7,8,9,10,11,12,13,14,15,16]. The electrodes and wires in such methods are made of conductive textile [1,2,3,5,6,7,8,9,10,12,13,14,15,16] or conductive ink [4,11], and are embedded in a shirt or belt. Such a shirt is called a smart shirt and the biological signals are measured for a person wearing the shirt [1,2,3,4,5,6,7,8,9]. The belt is wound around a subject’s body and measures biological signals [10,11,12,13,14,15,16]. Smart shirts and belts measure various biological signals, including ECG signals [1,2,3,4,5,6,7,8,9,10,11,12,13,14,15,16], electromyogram (EMG) signals [1,2,7,11], and signals of the respiration rate [1,7,14,15,16] and other body properties [1,6,7,11,12,14,15]. We consider an ECG measurement made using smart shirts and belts.
Smart shirts and belts for ECG measurement can be categorized by the number of electrodes. The number of the electrodes relates to the method of ECG measurement. Different methods of the ECG measurement employ bipolar leads, unipolar leads, standard limb leads, and unipolar precordial leads. Almost all existing smart shirts and belts adopt unipolar leads to measure the ECG signal, with the use of three electrodes being the simplest method [2,3,4,5,6,7,10,11,12,13,14,15,16]. Unipolar leads allow the measurement of the signal of a simple ECG signal but cannot be used to measure the signal of a detailed ECG. A few smart shirts have six electrodes on the chest with unipolar precordial leads for the measurement of the signal of a detailed ECG [1,8,9]. However, existing smart shirts that adopt unipolar precordial leads have not yet been discussed in terms of the subject’s motion. There are two problems to overcome in conducting an ECG measurement using the smart shirt if the subject moves. The first problem is the size of the electrode on the smart shirt. Each electrode has to be small enough to avoid contact between neighboring electrodes, yet a stable measurement of the ECG signal is difficult if the electrode is small. The second problem relates to the positions of the V1 and V2 electrodes. These electrodes are placed on a concave area of the chest. Thus, these electrodes on the smart shirt are not in stable contact with the subject’s skin. This problem is difficult to resolve because it originates from the structure of the human body. To resolve this problem, a novel electrode that can fill the gap between the smart shirt and body is required.
In this study, we developed a smart shirt that resolves the two problems above. The smart shirt has electrodes and wires made of conductive ink, and had 10 small electrodes and unipolar precordial leads for measuring the ECG signal. Six electrodes functioning as active electrodes were placed on the chest of the smart shirt. The remaining four electrodes were used as indifferent electrodes and a neutral electrode, and were placed at the scapulae and lumbar. Furthermore, we developed a conductive foam block that fills the gap between the smart shirt and body. The electrical resistance of the block was low enough for the ECG measurement and was reduced by compression pressure. We investigated whether the conductive foam block could fill the gap and be used for the ECG measurement. Finally, we made an ECG measurement while the subject not only rested but also walked.

2. Experimental Materials and Methods

2.1. Manufacturing of the Smart Shirt

We used a compression shirt (UA Heat Gear Armour, manufactured by DOME Corporation, Tokyo, Japan) as a substrate of the smart shirt. The compression shirt was very stretchable and well fitted a subject’s body. Electrodes and wires for the ECG measurement were conductive ink printed onto the compression shirt. Placement of the electrodes is shown in Figure 1. This placement is referred to as the placement of unipolar precordial leads [17]. The conductive ink contained 35 wt% urethane elastomer (AR binder GS, manufactured by Matsui Shikiso Chemical Co., Ltd., Kyoto, Japan) and 65 wt% Ag flakes (AgC-A, manufactured by Fukuda Metal Foil & Powder Co., Ltd., Kyoto, Japan). The conductivity of this ink was 6.1 × 10⁻⁵ Ωcm when the ink was pasted on a glass slide and cured at 70 °C for 20 min. The conductive ink wire was stretchable and had elongation durability [18]. In a previous study [18], the conductive ink (80 wt% Ag flakes contained) was printed on polyester and polyurethane elastic webbing; the dimensions of the printed ink were 2 mm × 45 mm × 30 μm. The conductive ink was repeatedly stretched at 10% strain for 4500 cycles. The resistance of the conductive ink after stretching was approximately 1 kΩ. This elongation durability was expected for our smart shirt.
Figure 1. Placement of electrodes with unipolar precordial leads used to measure the ECG: (a) front view; (b) cross-sectional view of the chest.
Fibers 03 00463 g001
The conductive ink electrode and wire were manufactured by procedures shown in Figure 2. In step (1), non-conductive ink made of urethane elastomer (AR binder GS, the same as that mentioned above) was printed on the compression shirt to create a bottom insulation layer. The ink was cured at 70 °C for 20 min. Curing was repeated after each subsequent step. In step (2), conductive ink was printed on the insulation layer to create an electrode and wire. In step (3), non-conductive ink was printed on the conductive ink, but the electrode and terminal were left unprinted. These procedures produced three layers of conductive ink wire that had a water resistant property. In step (4), a snap button was mounted on each terminal. A portable electrocardiograph was connected to the smart shirt through the snap buttons. To reinforce the fabric of the smart shirt, conductive fabric tape (E05R, manufactured by Seiwa Electric Mfg. Co., Ltd., Kyoto, Japan), which was not stretchable, was pasted on the terminal.
Figure 2. Procedure of the manufacture of the conductive ink electrode and wire.
Fibers 03 00463 g002

2.2. Manufacturing of a Conductive Foam Block

Our smart shirt well fitted the subject’s body. However, electrodes V1 and V2 were not in stable contact with the skin because of the body structure shown in Figure 1. To improve the contact condition, conductive foam blocks were inserted between the smart shirt and body. We manufactured the conductive foam block as follows.
The substrate of the conductive foam block was made of low-rebound urethane foam (EGR-6H, manufactured by Softpren Industry Corporation, Saitama, Japan). We added an electrical conduction property to the urethane foam by constructing nanostructured Ag in a sonoprocess [19]. We used reaction liquid that contained 1.0 wt% Ag2O, 98.9 wt% ethanol, and 0.1 wt% ethylene glycol. The urethane foam block with dimensions of 20 mm × 20 mm × 15 mm was immersed in the reaction liquid. The urethane foam block with the reaction liquid was irradiated using an ultrasonic washing machine (nominal frequency of 38 kHz) for 21 h. Following this procedure, nanostructured Ag was constructed on the urethane foam block, and the conductivity was expressed.

2.3. Measuring the Contact Pressure at Each Electrode

The contact pressure of the smart shirt was different at each electrode. We investigated the contact pressure of the smart shirt to confirm the contact condition of the electrode. The contact pressure was measured by a pressure sensor (PDA-500KPA, manufactured by Tokyo Sokki Kenkyujo Co., Ltd., Tokyo, Japan). The pressure sensor was used only before measuring the ECG and was fixed at the placement of each electrode on the subject. Moreover, the increase in pressure due to the insertion of the pressure sensor could be ignored because of the small size of the sensor; the diameter and thickness were 6 and 2 mm, respectively.

2.4. Measuring the ECG

The subject wore the manufactured smart shirt. A portable electrocardiograph (BAQT-0001, manufactured by Bio Signal Co., Ltd., Osaka, Japan) was connected to the smart shirt. The portable electrocardiograph had four differential input channels for which the input impedance was 10 MΩ, and measured the ECG signals at 200 Hz. Measured ECG signals were transferred to a personal computer by a wireless connection using an XBee module (XB24-AWI-001, manufactured by Digi International Inc., MN, USA) in real time. In this experiment, the portable electrocardiograph was unable to measure the complete ECG signal with unipolar precordial leads owing to its simple design; i.e., the electrocardiograph had only four input channels. In this study, we measured signals from four of the six electrodes that are used in unipolar precordial lead measurements. Moreover, the skin moisture of the subject was measured by a moisture sensor (MY-808S, manufactured by Scalar Corporation, Tokyo, Japan). In the experiments, we measured the ECG signals while the subject rested, walked, and slowly jogged. Furthermore, we confirmed the usability of the conductive foam block.

3. Results and Discussion

3.1. Manufactured Smart Shirt

A manufactured smart shirt is shown in 
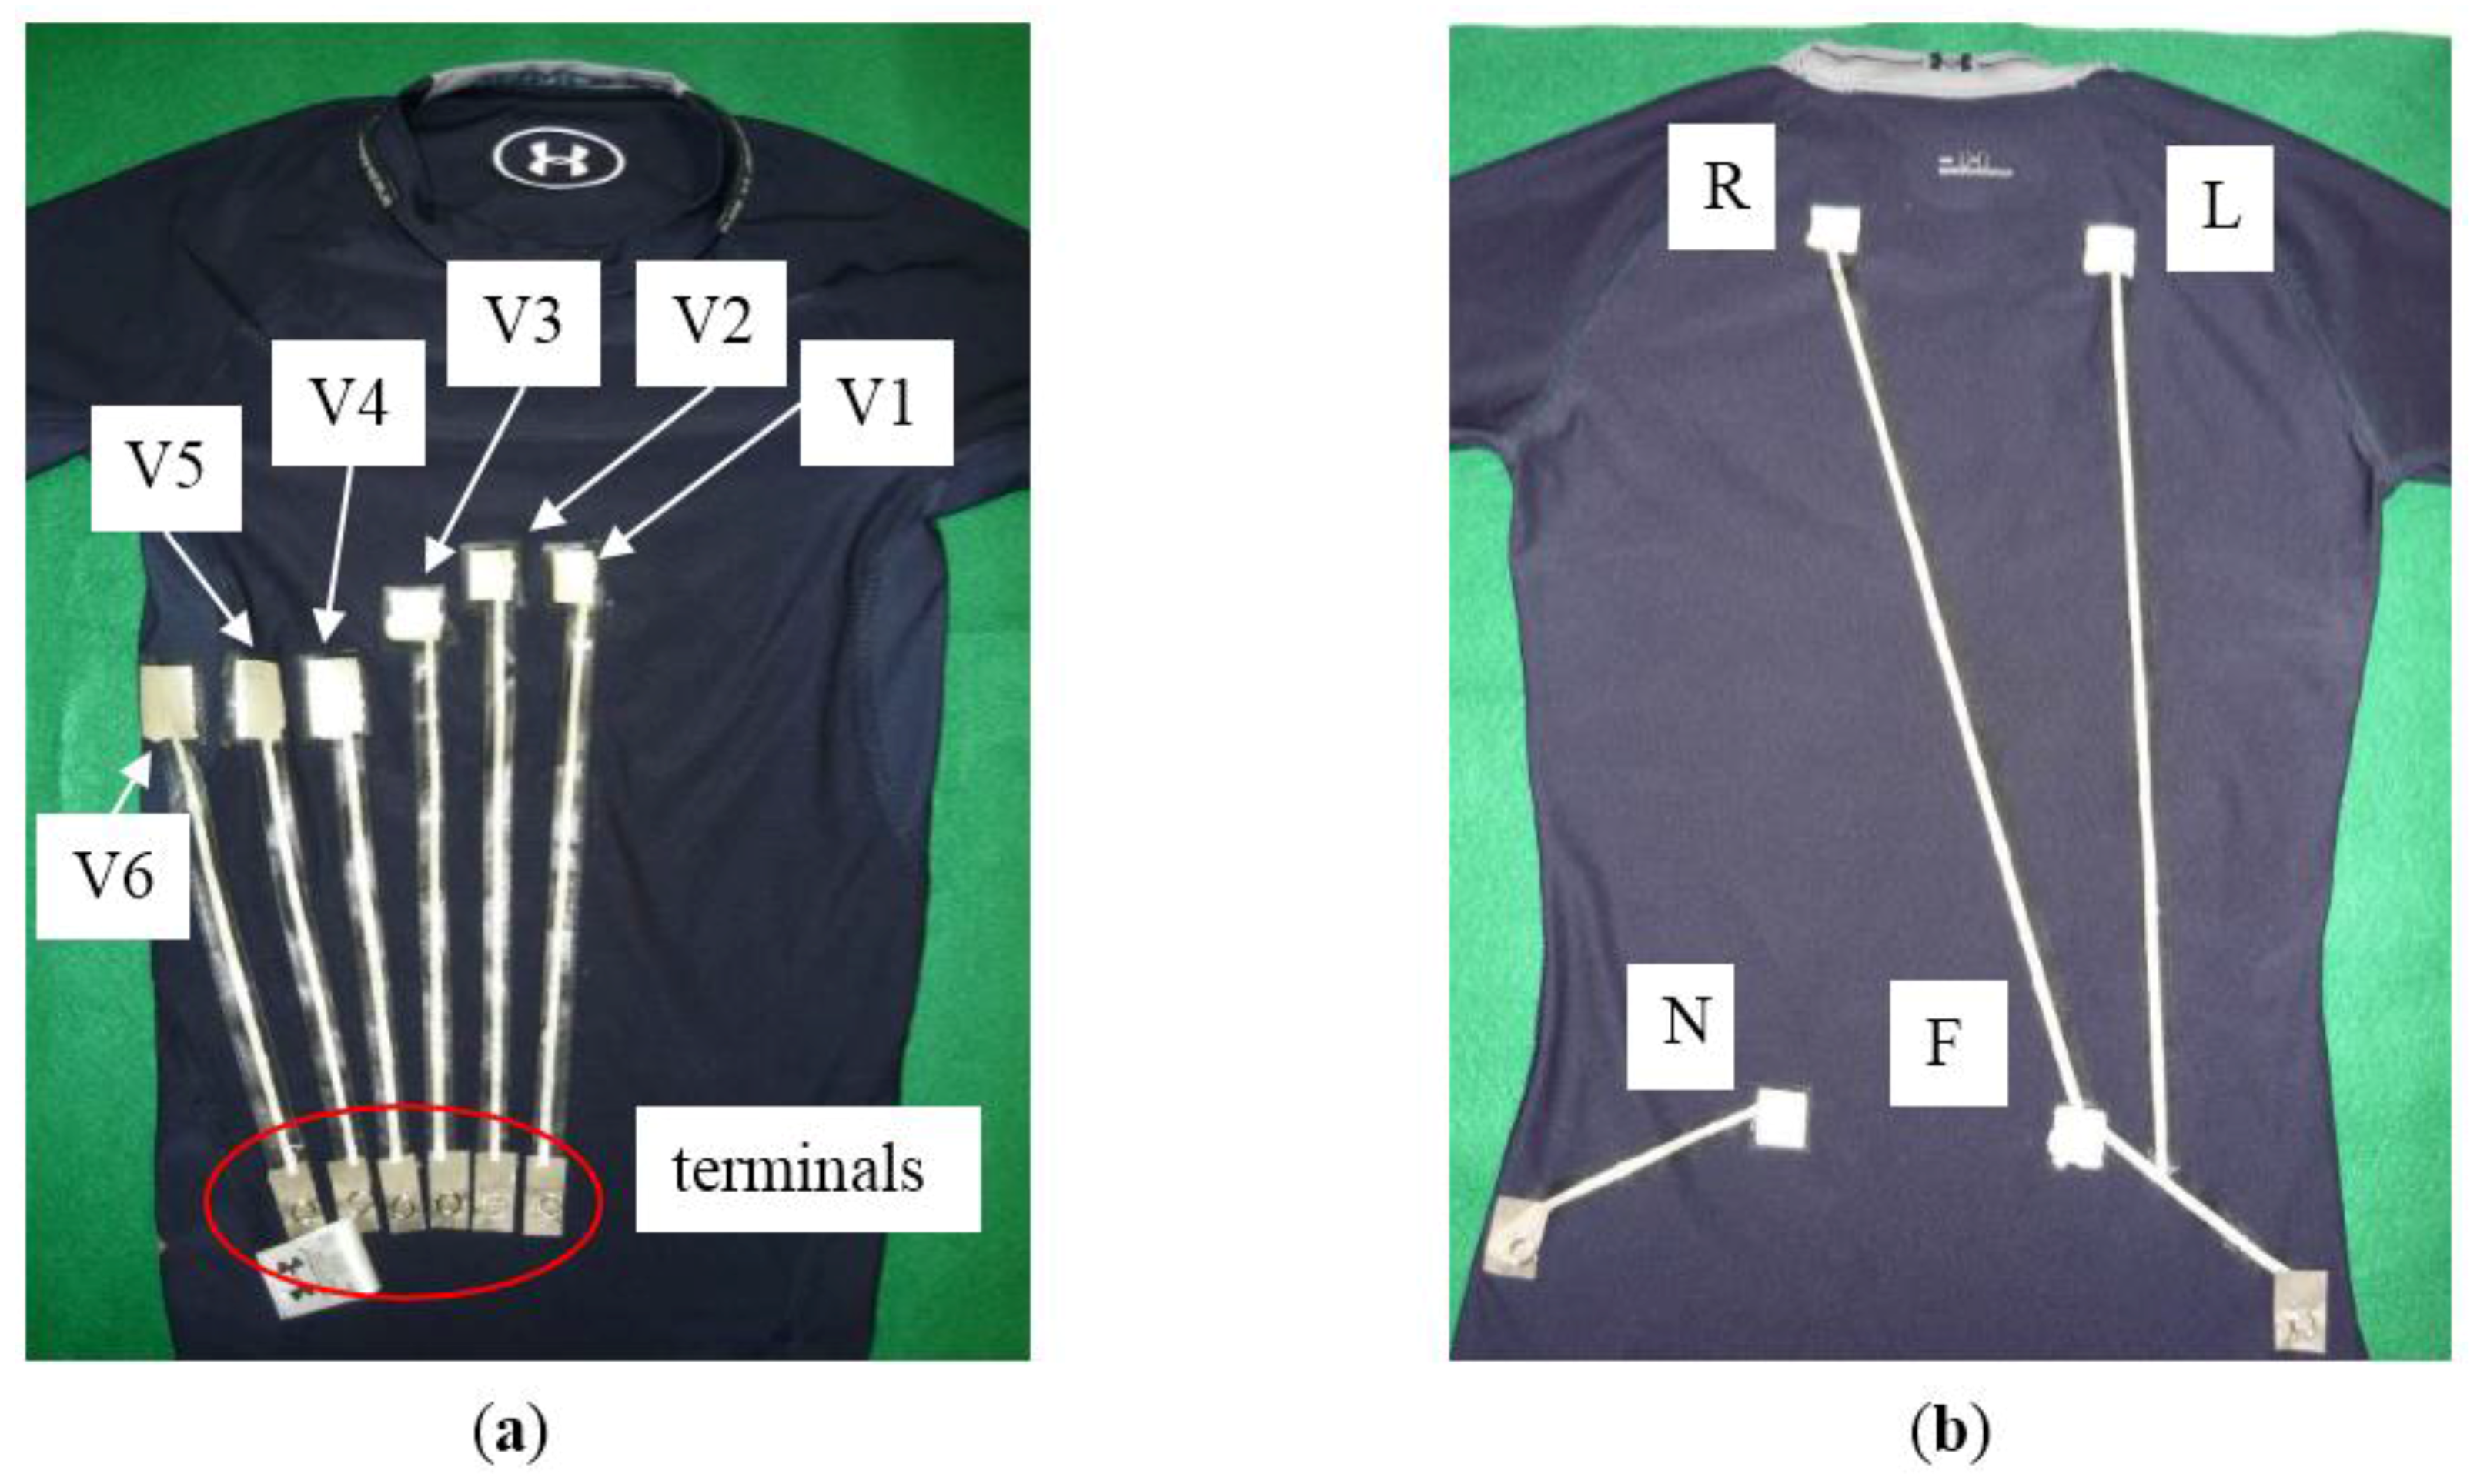
Figure 3. The smart shirt in the figure is presented inside out to show the electrodes. 
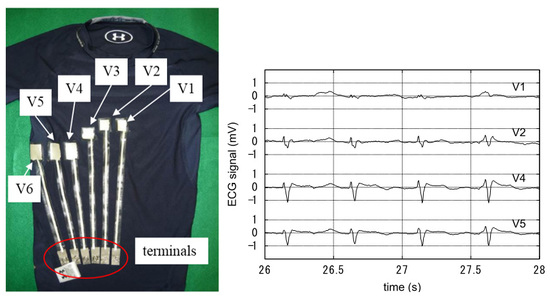
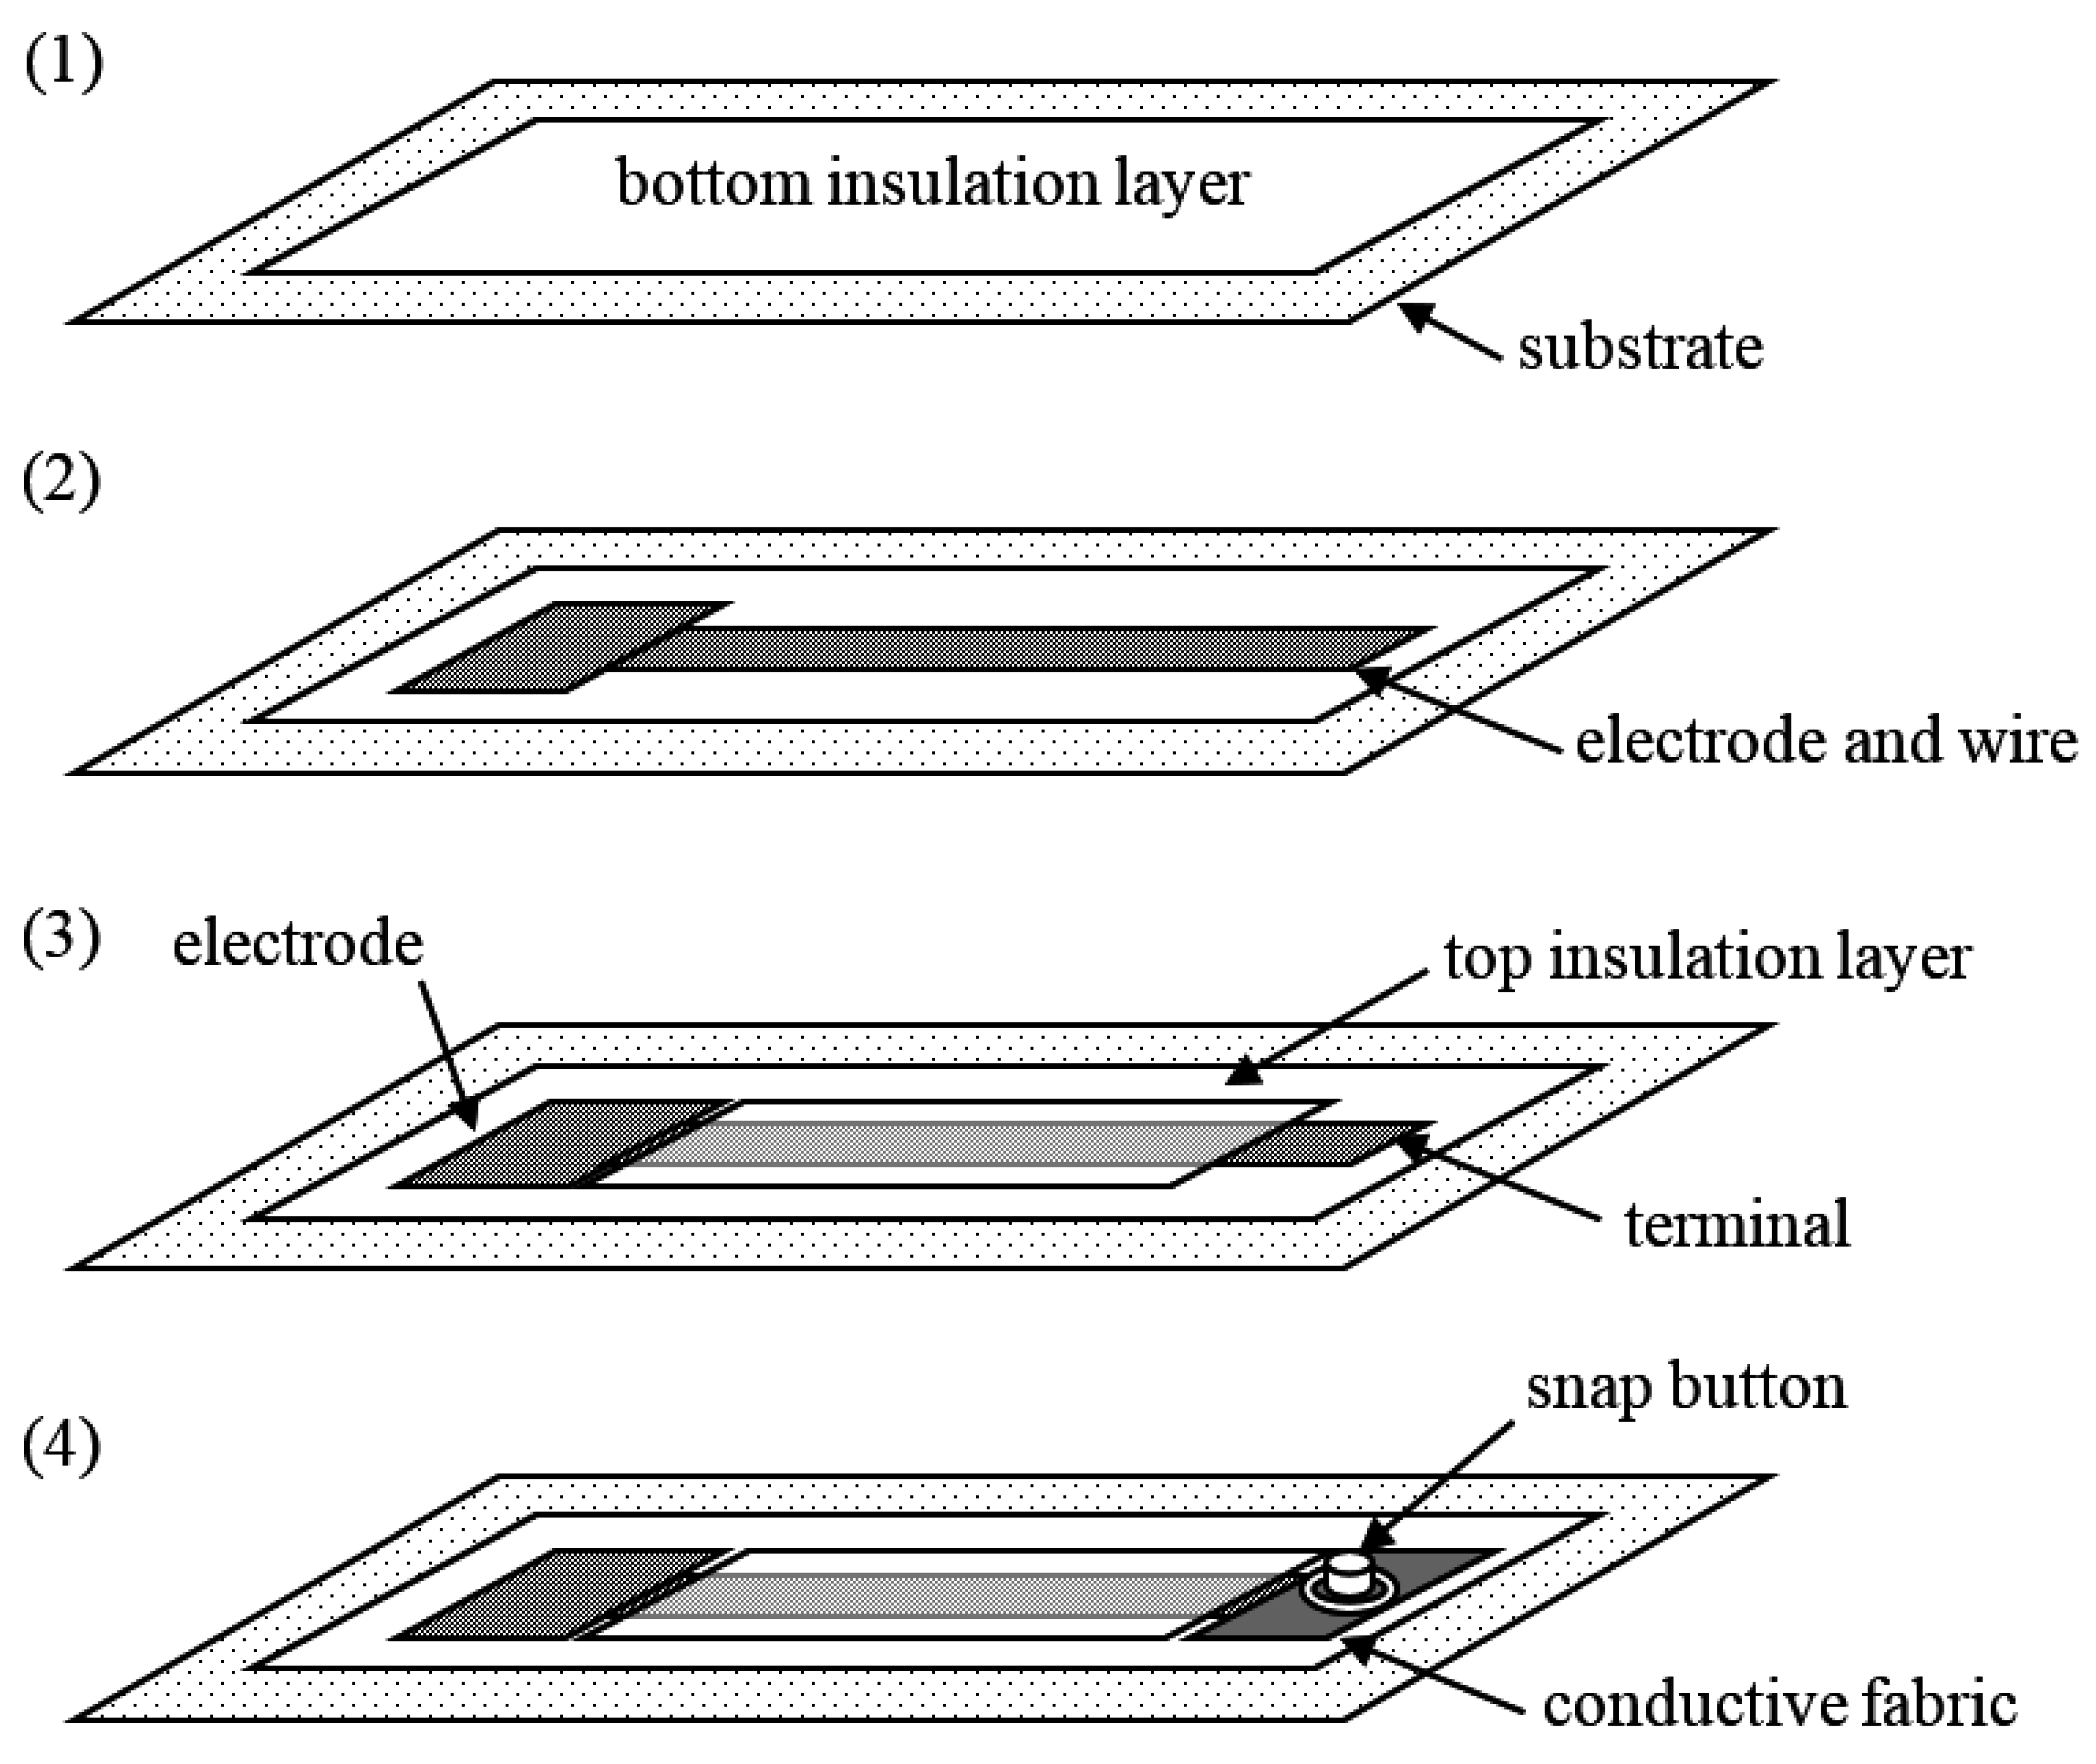
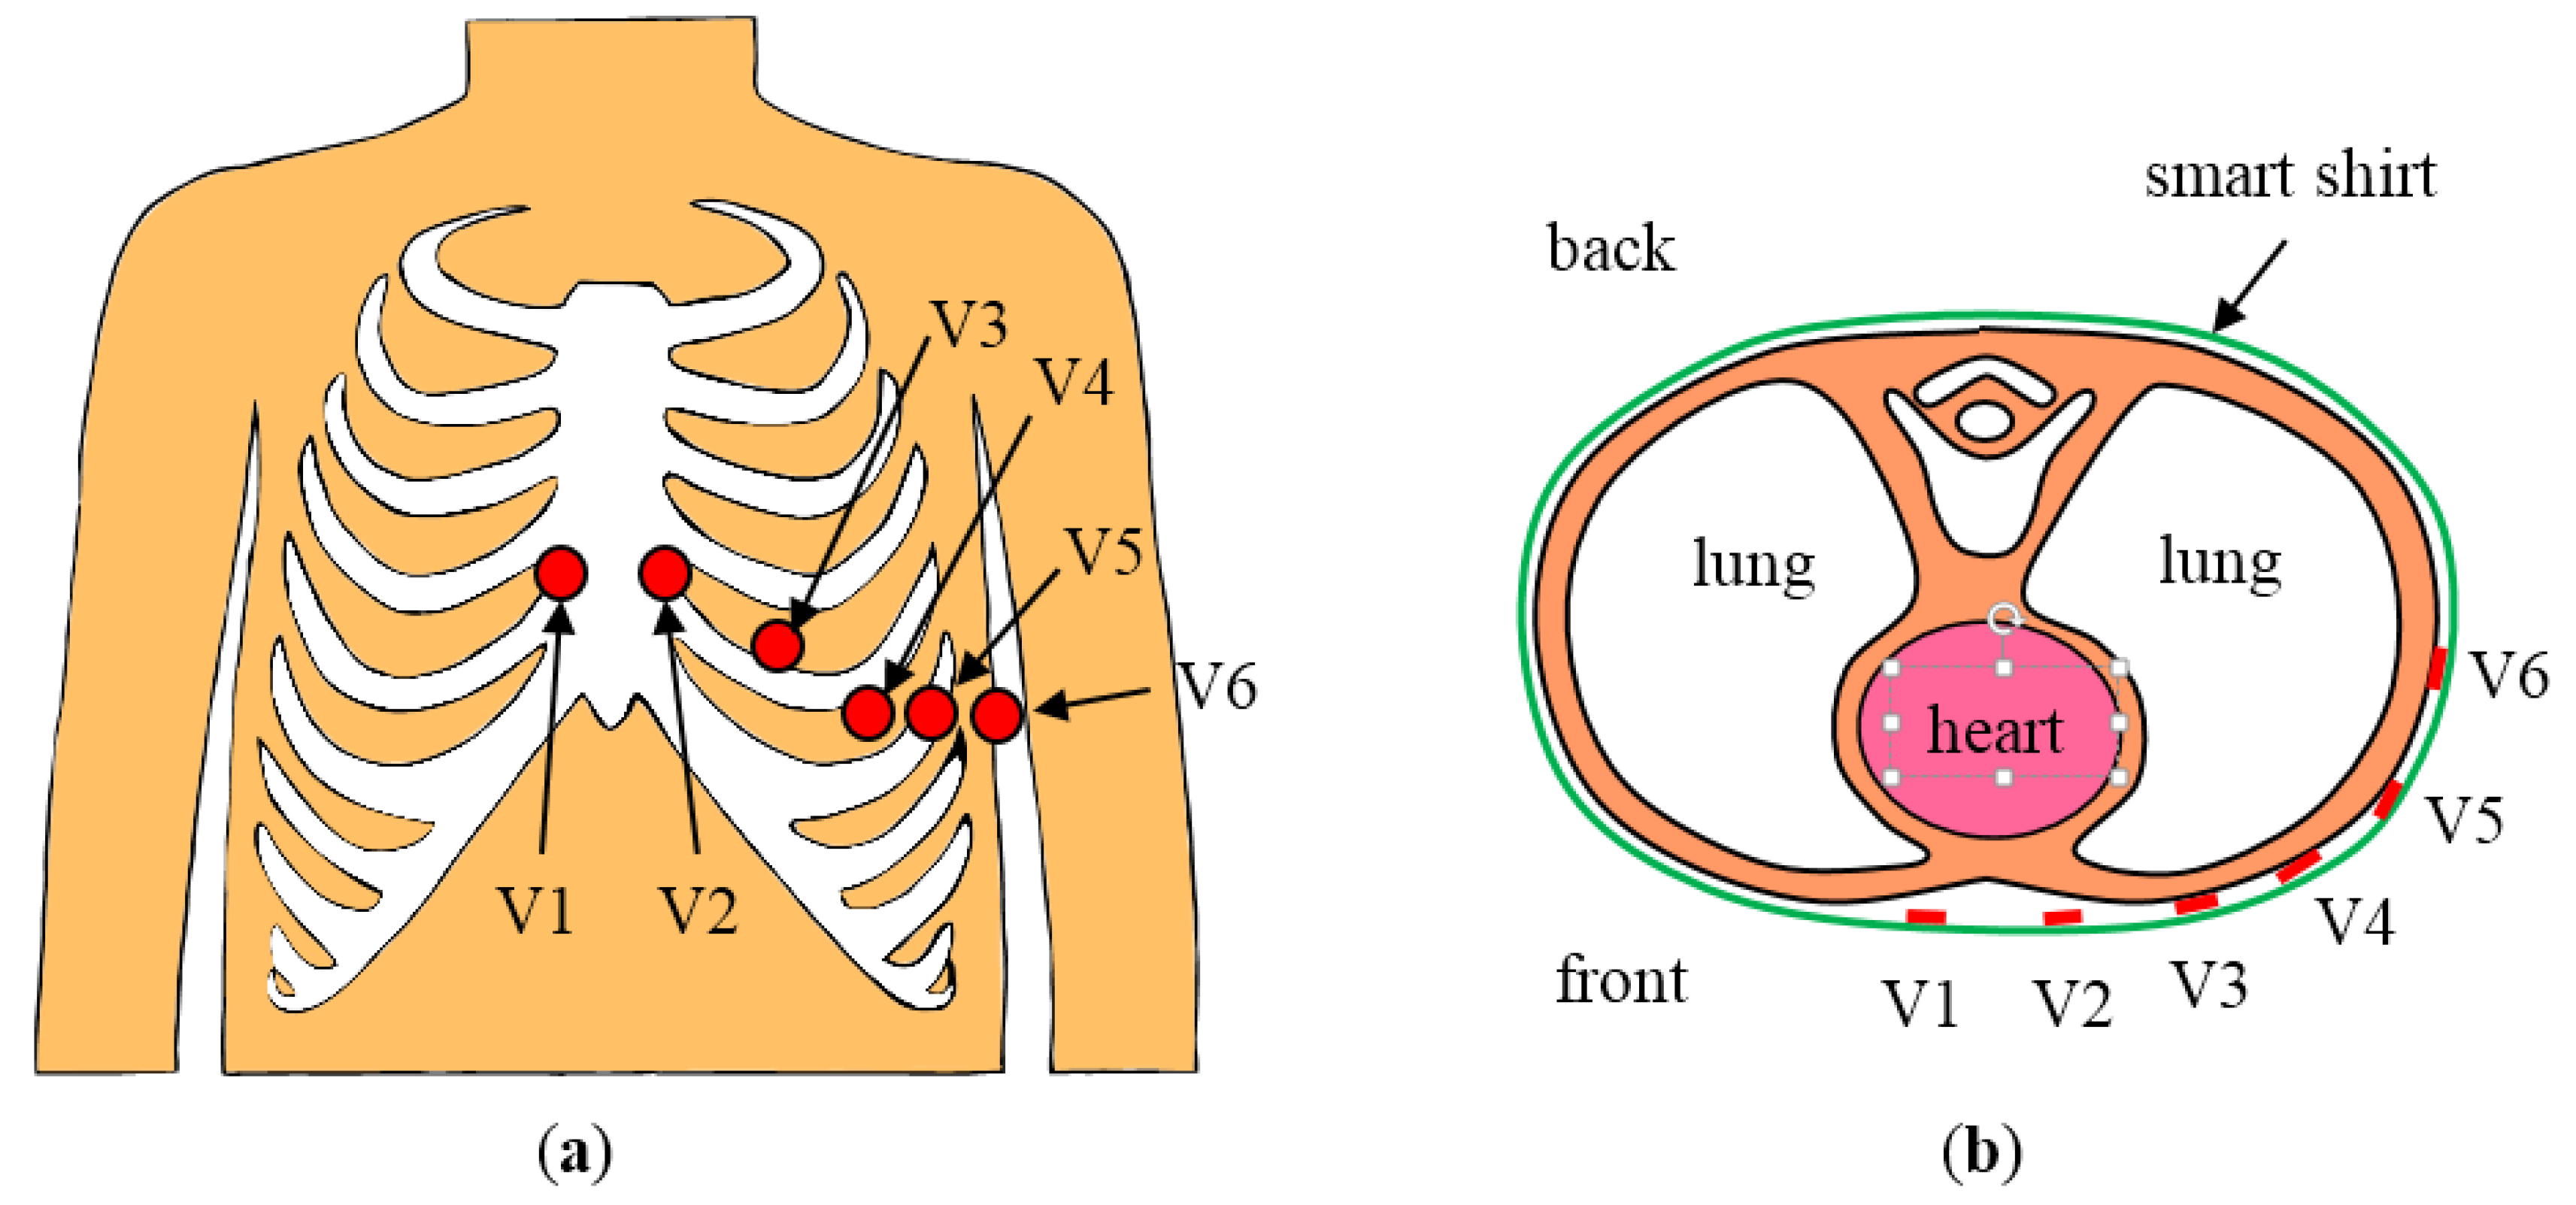
Figure 3a shows the front of the smart shirt. The dimensions of electrodes V1 and V2 were 20 mm × 20 mm, while the dimensions of the other electrodes were 20 mm × 30 mm. Positions of electrodes V1 to V6 corresponded to active electrodes with unipolar precordial leads. In the standard measurement using unipolar precordial leads, indifferent and neutral electrodes are placed on both wrists and both ankles. In this study, however, these electrodes were printed on the back of the smart shirt shown in Figure 3b. The indifferent electrodes R, L, and F were printed on the scapulae and left lumbar part on the smart shirt. These electrodes were connected to one wire because the wiring was defined by the unipolar precordial lead configuration. The neutral electrode N was printed on the right lumbar part of the smart shirt. The indifferent and neutral electrodes were placed on the convex area of the scapulae and lumbar. These electrodes were therefore in stable contact with the subject’s body. The longest length of wire was 480 mm for electrode R. The electrical resistance of this wire was 7.0 Ω before the smart shirt was worn. The resistance increased to 17.1 Ω when the subject wore the smart shirt, but the resistance was low enough for measurement of the ECG signal.
Figure 3. Manufactured smart shirt. The smart shirt is inside out in the photographs to show electrodes and wires: (a) front view; (b) back view.
Fibers 03 00463 g003

3.2. Manufactured Conductive Foam Block

A block of low-rebound urethane foam in reaction liquid was irradiated with ultrasound for 21 h. After irradiation, the urethane foam block was washed with ethanol and dried at 60 °C for 60 min. 
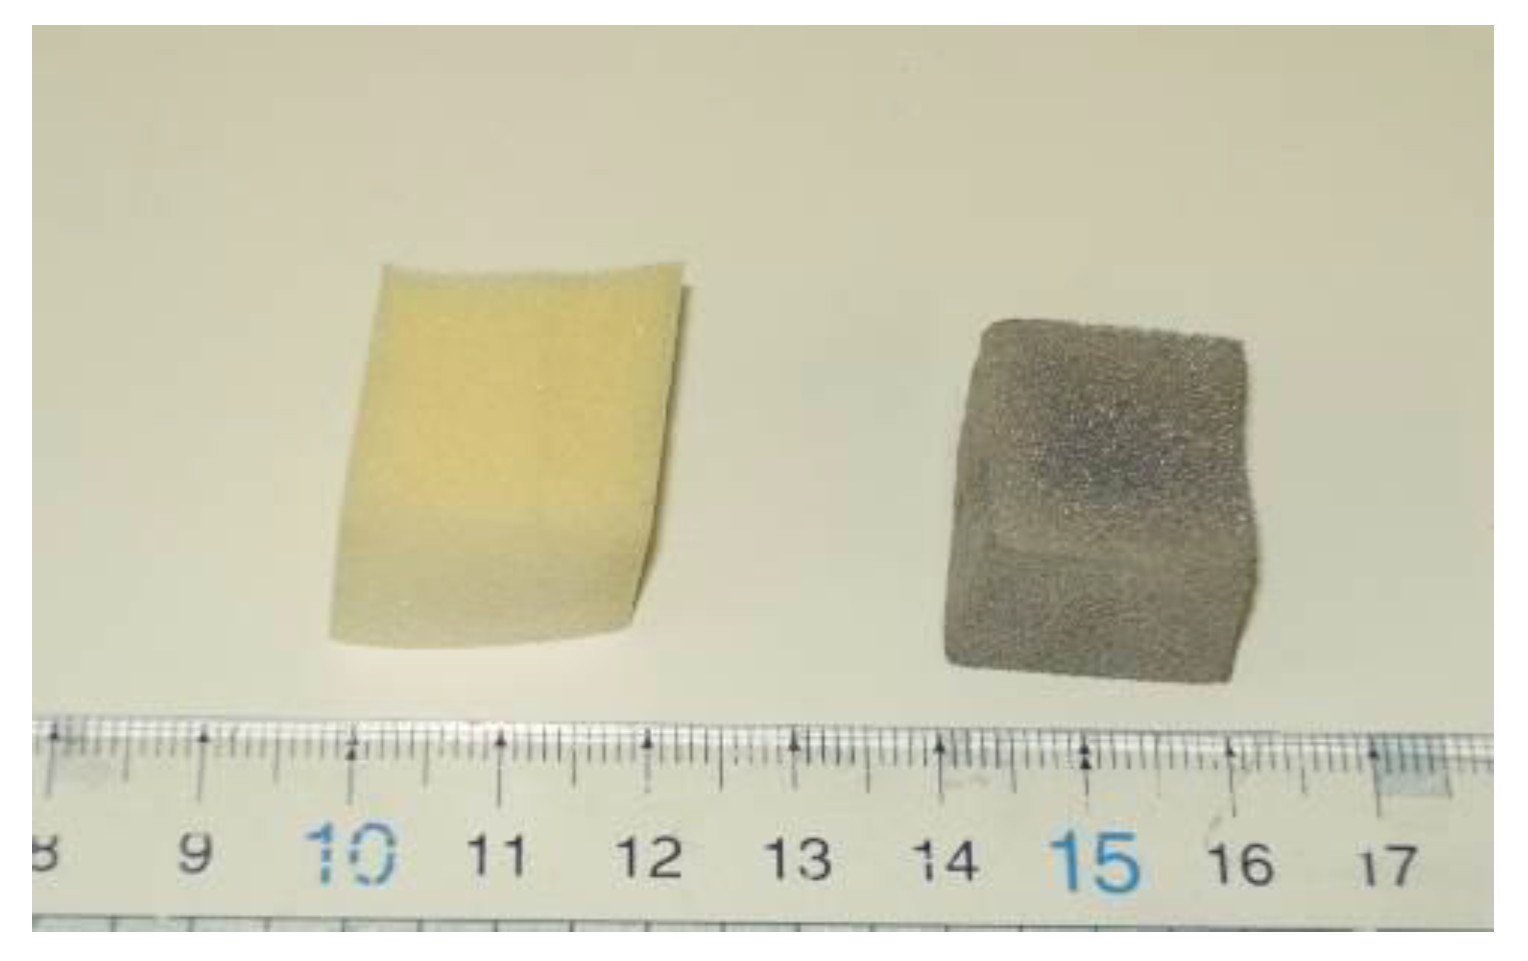
Figure 4 shows the urethane foam block before and after irradiation. The irradiated urethane foam block changed color to dark gray because of the nanostructured Ag and became electrically conductive. A preliminary study of the nanostructured Ag showed that the nanostructured Ag was strongly attached to the urethane foam and did not peel off easily.
Figure 4. (Left) Low-rebound urethane foam block before irradiation with ultrasound; (Right) Conductive foam block produced by irradiating the urethane foam block with ultrasound in the reaction liquid.
Fibers 03 00463 g004
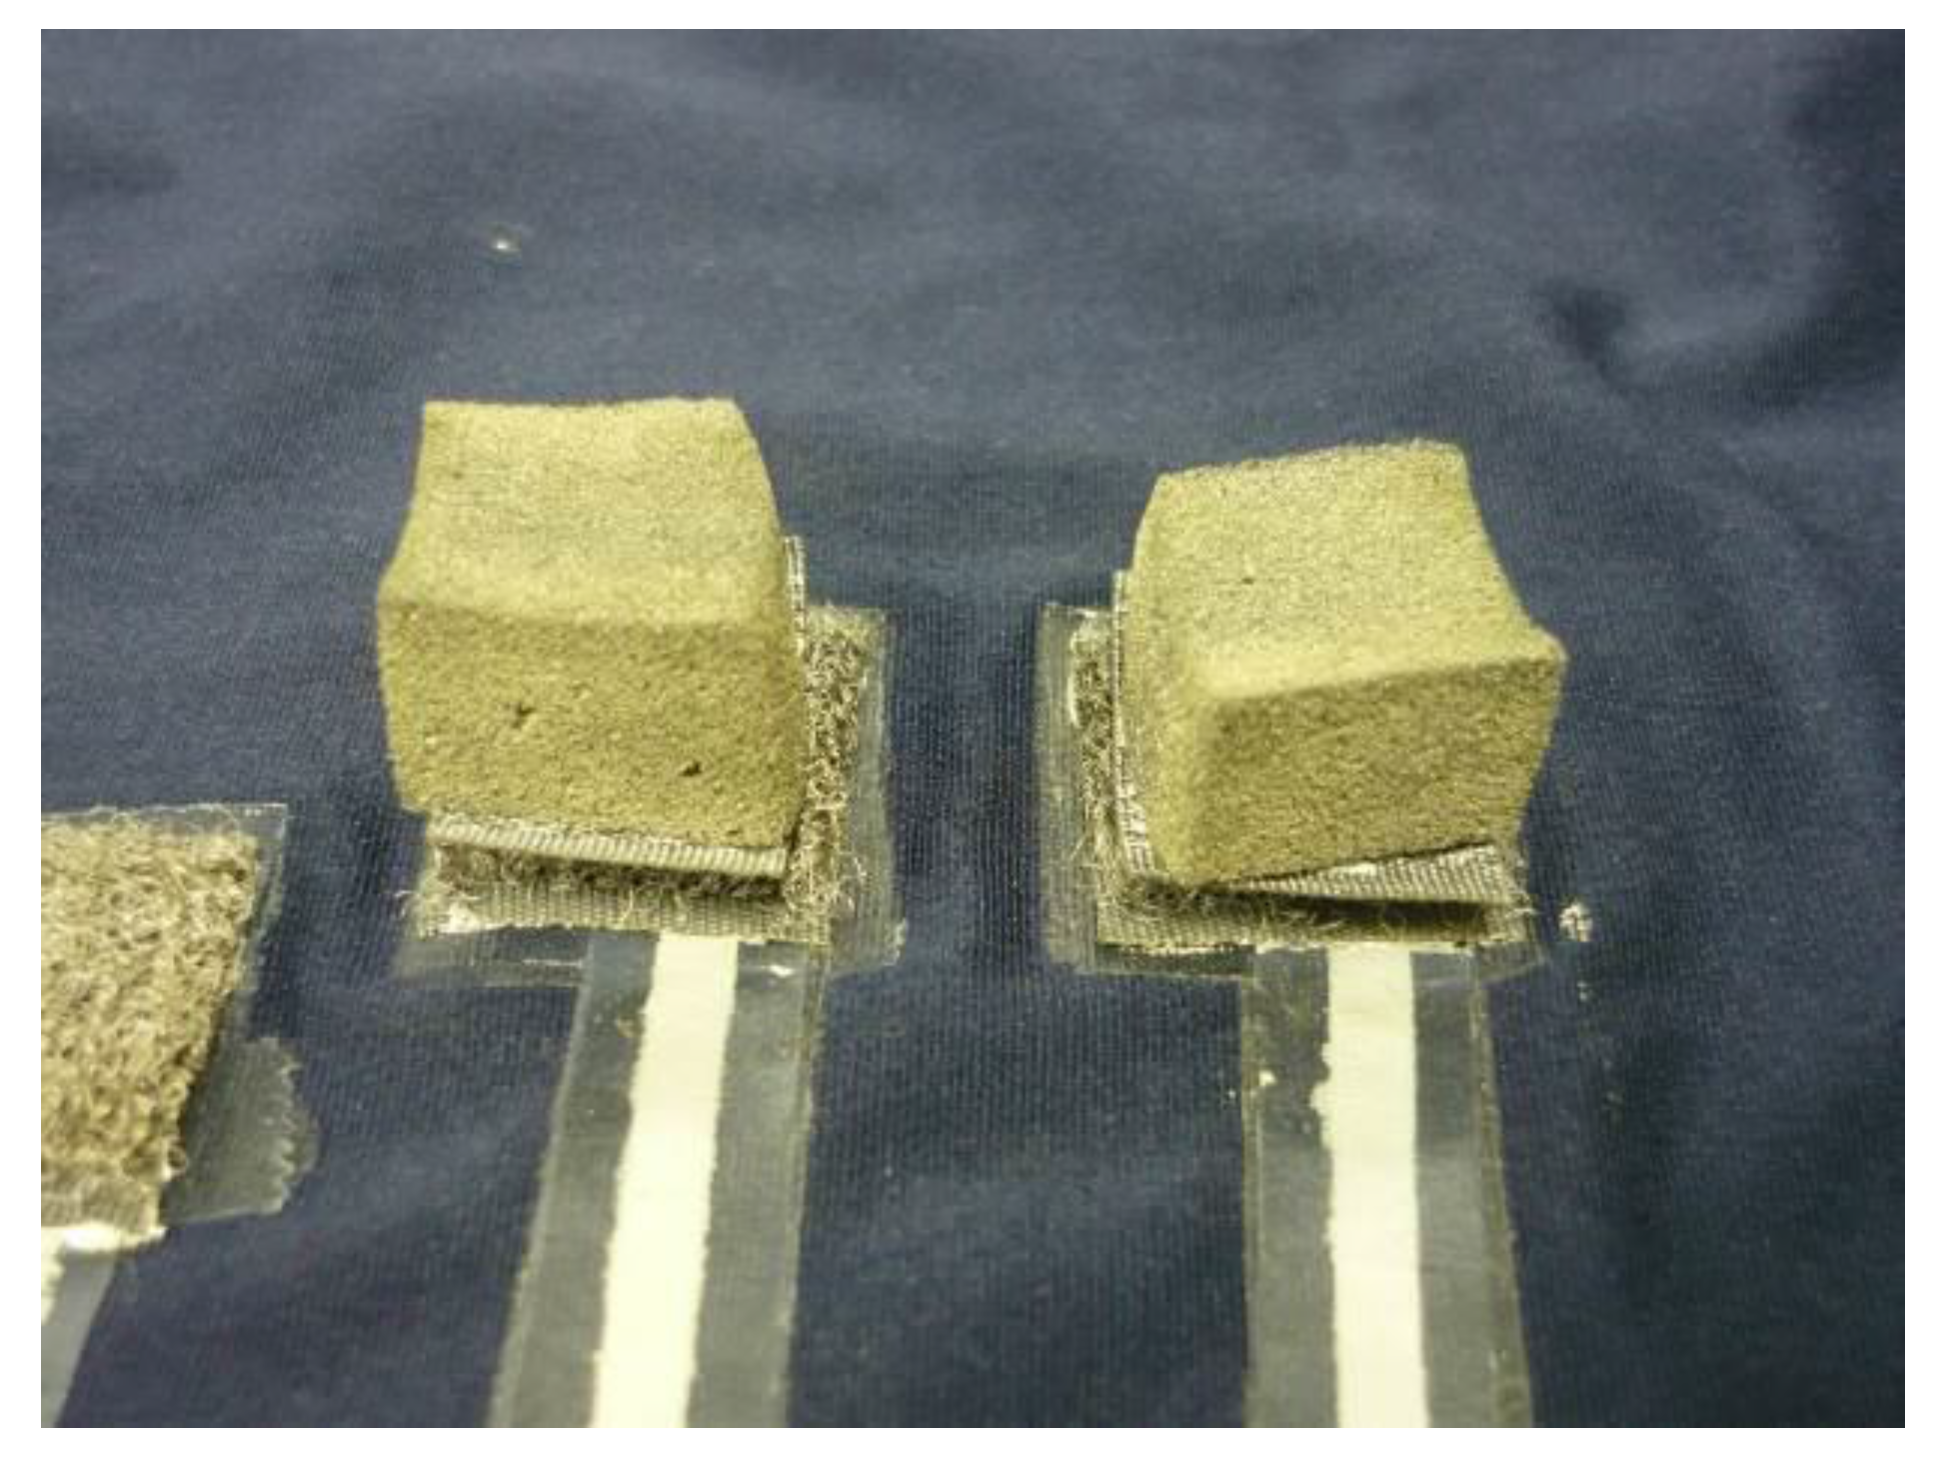
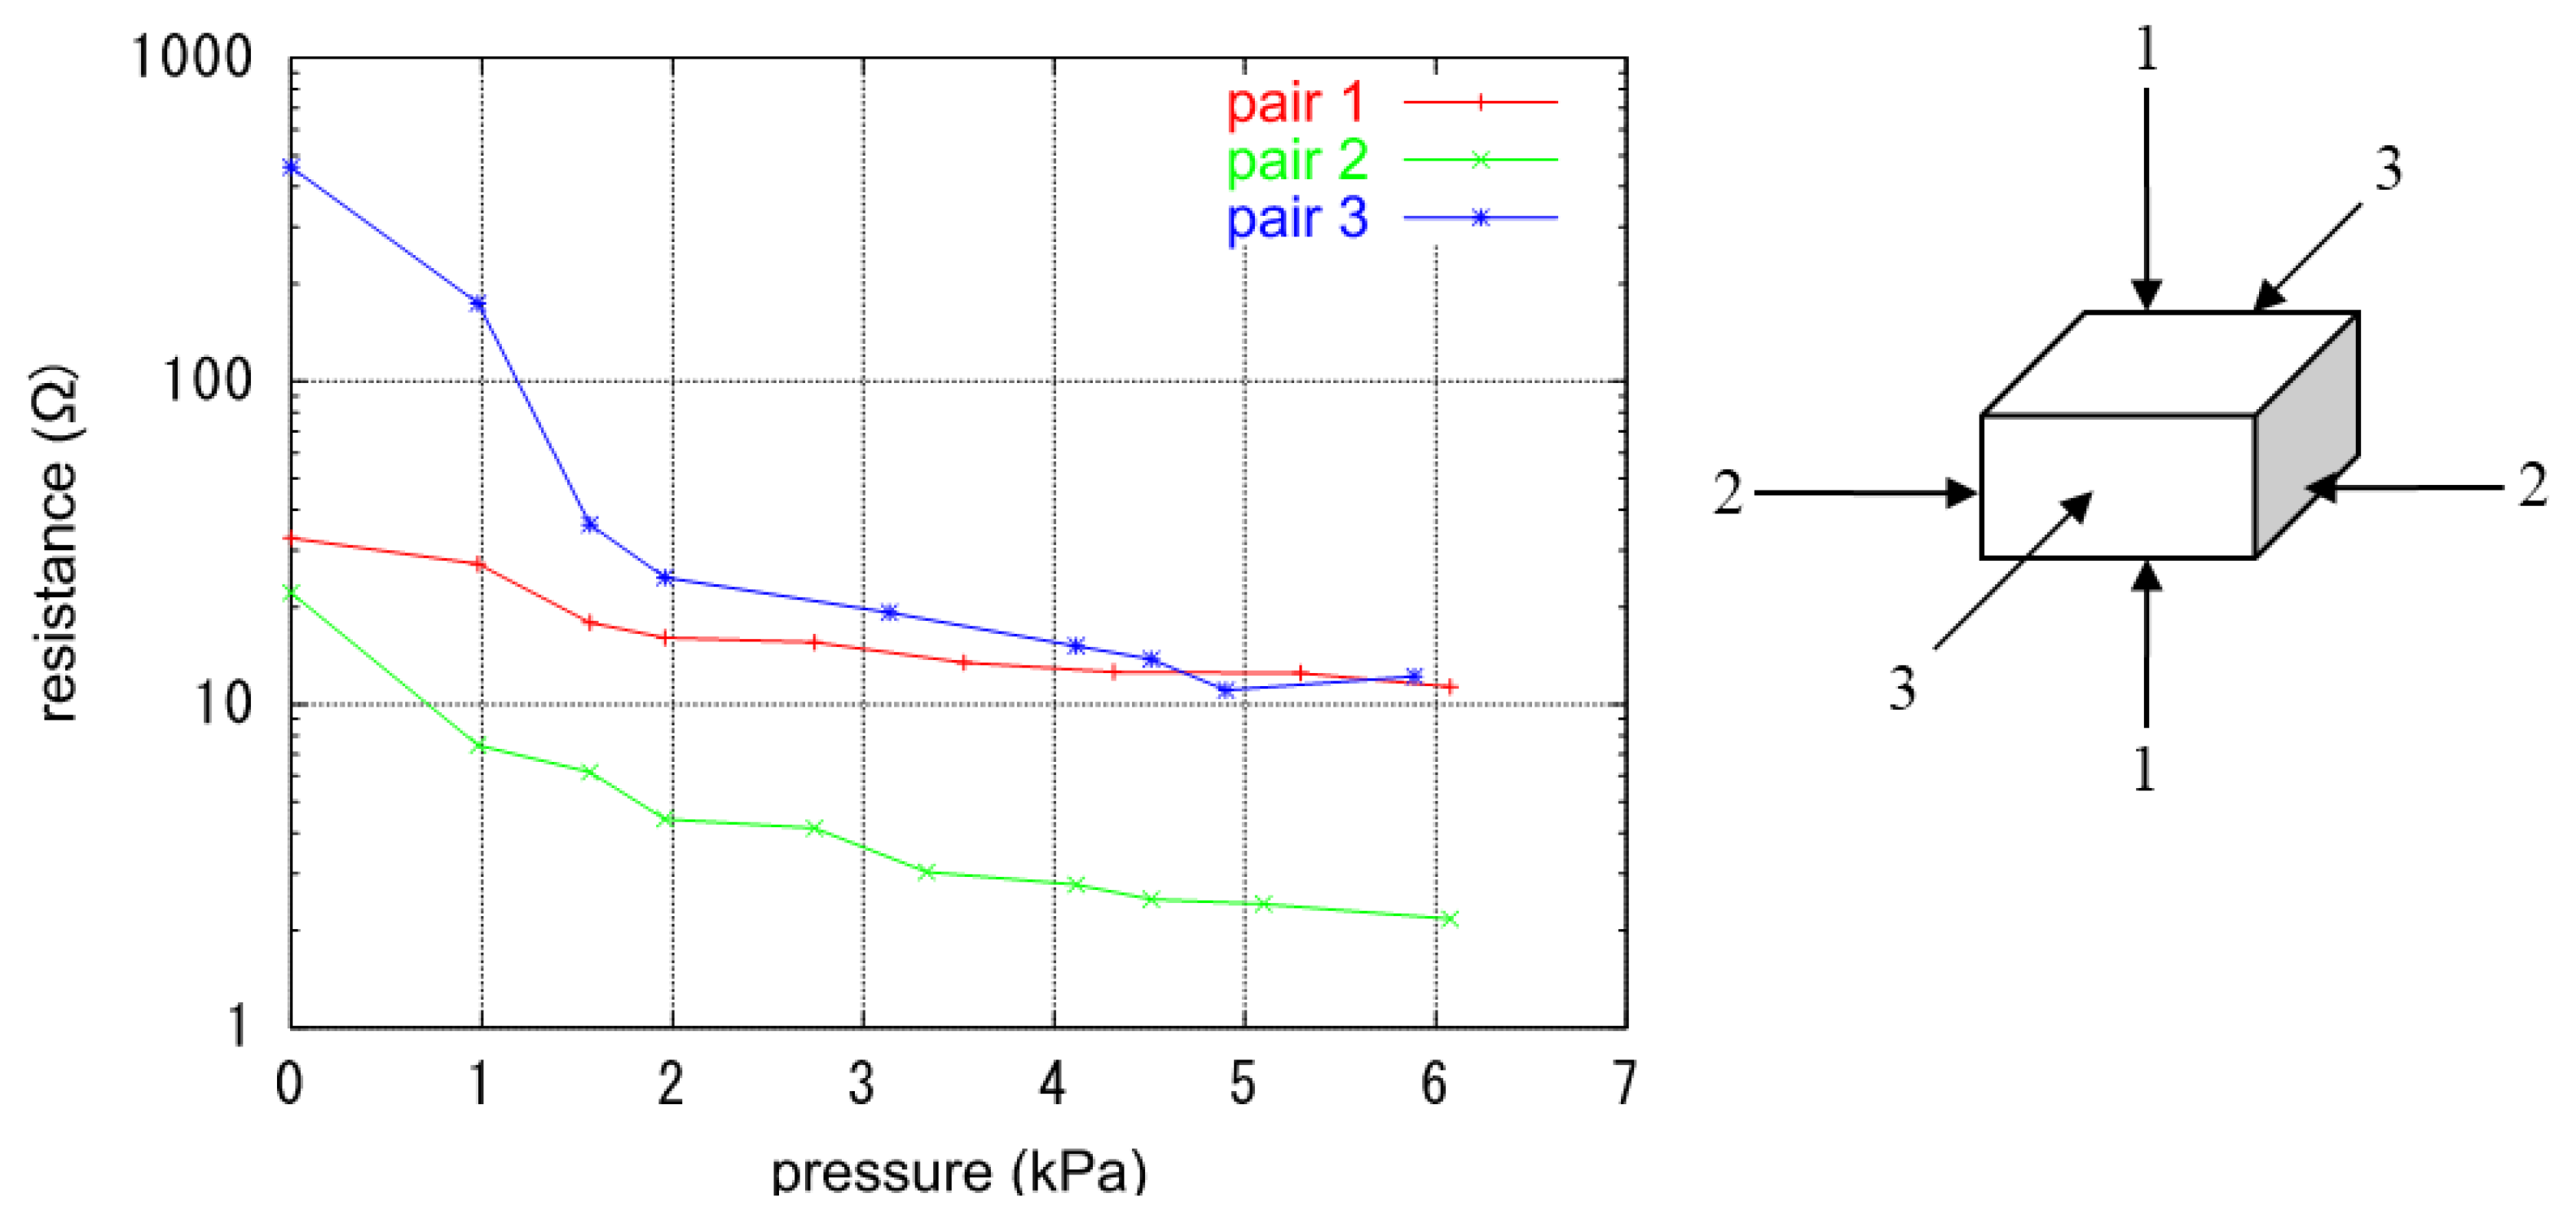
The initial electrical resistance of the conductive foam block was different for each pair of opposing faces and ranged from 22.2 to 460.0 Ω. In the measurement of electrical resistance, the block was not compressed by probes of the resistance meter. However, the block received pressure from the smart shirt and the subject’s body when the block was attached to the smart shirt. We investigated the resistance of the block when the block was pressed. Figure 5 shows relationships between the compression pressure and resistance. The resistance was measured for pairs 1, 2, and 3 of opposing faces. The figure indicates that the resistance was different for each pair of faces but was reduced by pressure in each case. The difference in resistance for each pair of opposing faces was due to the unbalanced ultrasound irradiation; the ultrasound was transmitted in one direction, and the block in the reaction liquid was not rotated. However, the resistance at pressure of 2.0 kPa was less than 30 Ω even though the initial resistance was 460.0 Ω (pair 1); this was sufficient for the measurement of the ECG signal. Moreover, we measured the resistance of the other blocks manufactured by employing the same method. The resistance and characteristics of those blocks were similar to those mentioned above.
Figure 5. Relationships between compression pressure and electrical resistance. The schematic on the right labels pairs of opposing faces in the measurement.
Fibers 03 00463 g005
We here discuss the reason why the resistance was reduced by pressure. We assumed that the decrease in resistance was due to the change in contact area, and investigated the contact area before and after compressing the conductive foam block. The block before compression was filled with resin and polished. A surface of the block filled with resin was observed under a microscope. 
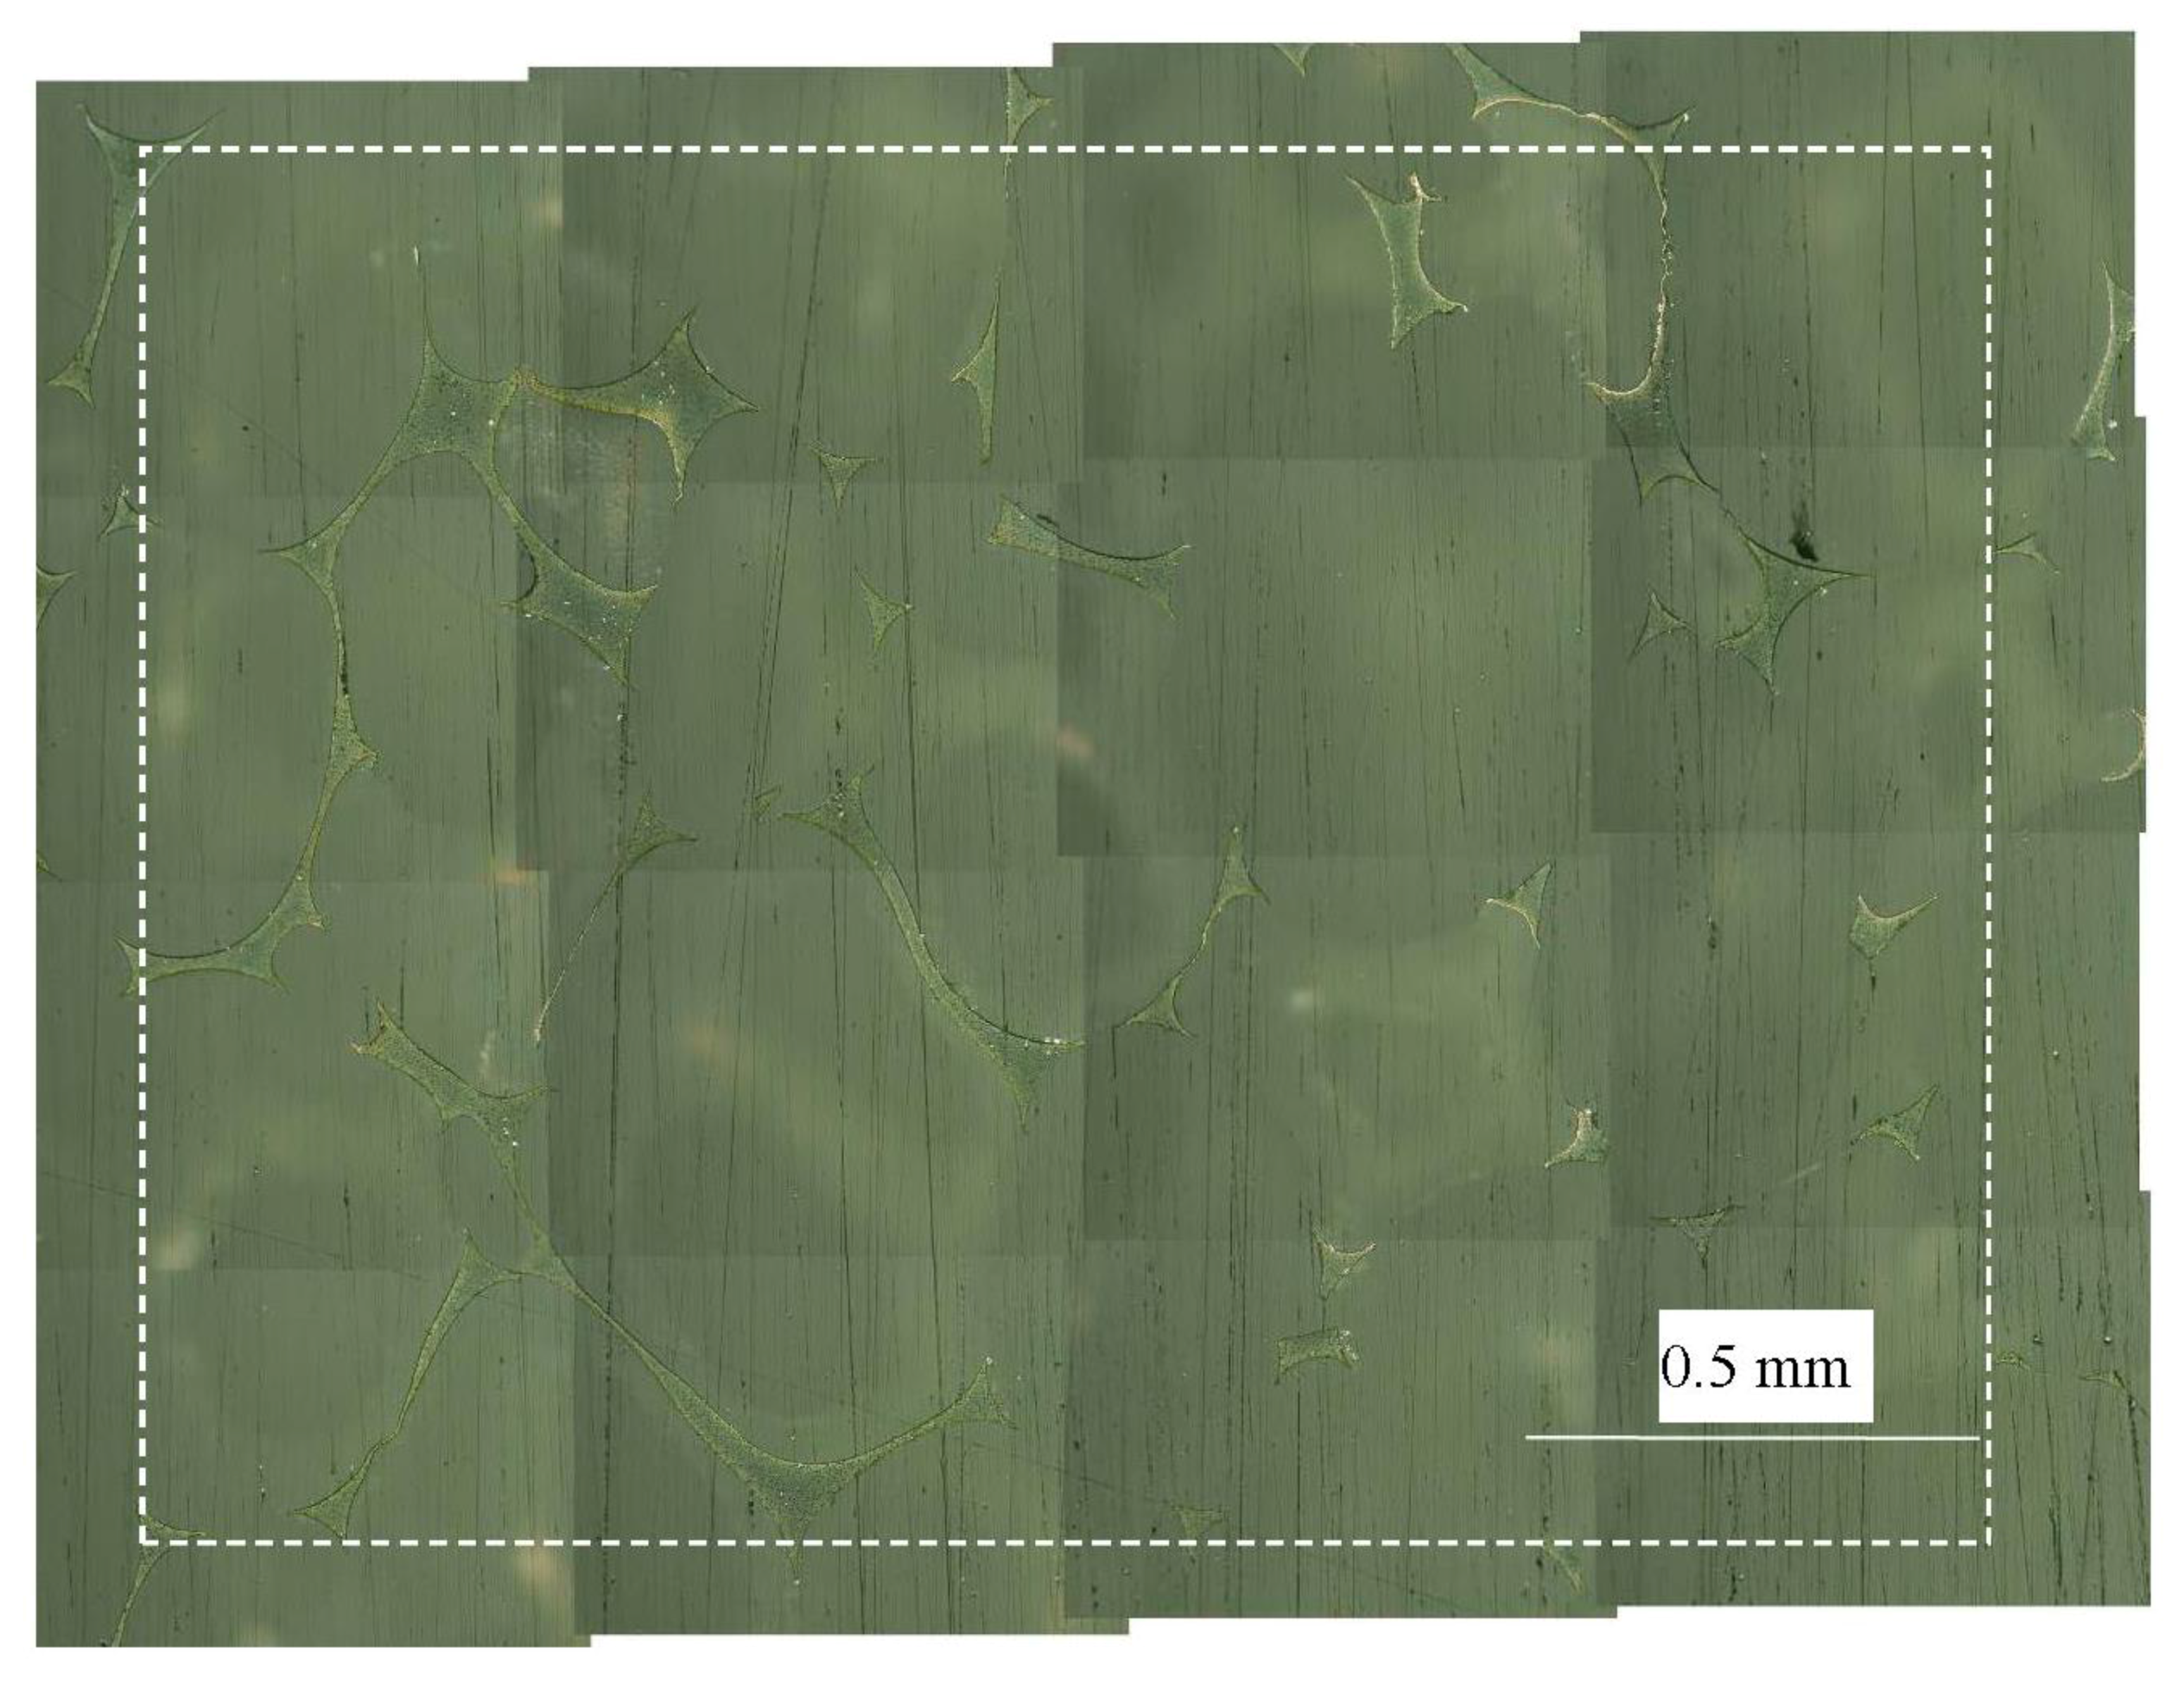
Figure 6 shows the surface of the block. The figure is a composite of 16 images because the field of view of the microscope was narrow. The spiky long and thin features were fibers of conductive urethane foam. The broken-line rectangle (2.0 mm × 1.5 mm) was the observation area in this experiment. Moreover, we converted the image to the monochrome image shown in Figure 7a to improve visibility. The dimensions of each figure in Figure 7 are 1.5 mm × 2.0 mm; the images are rotated for ease of comparison.
Black areas in the figure indicate the conductive foam; i.e., the contact area. The combined area of contact was 0.16 mm2. The pressed conductive foam blocks were observed employing the same method. 
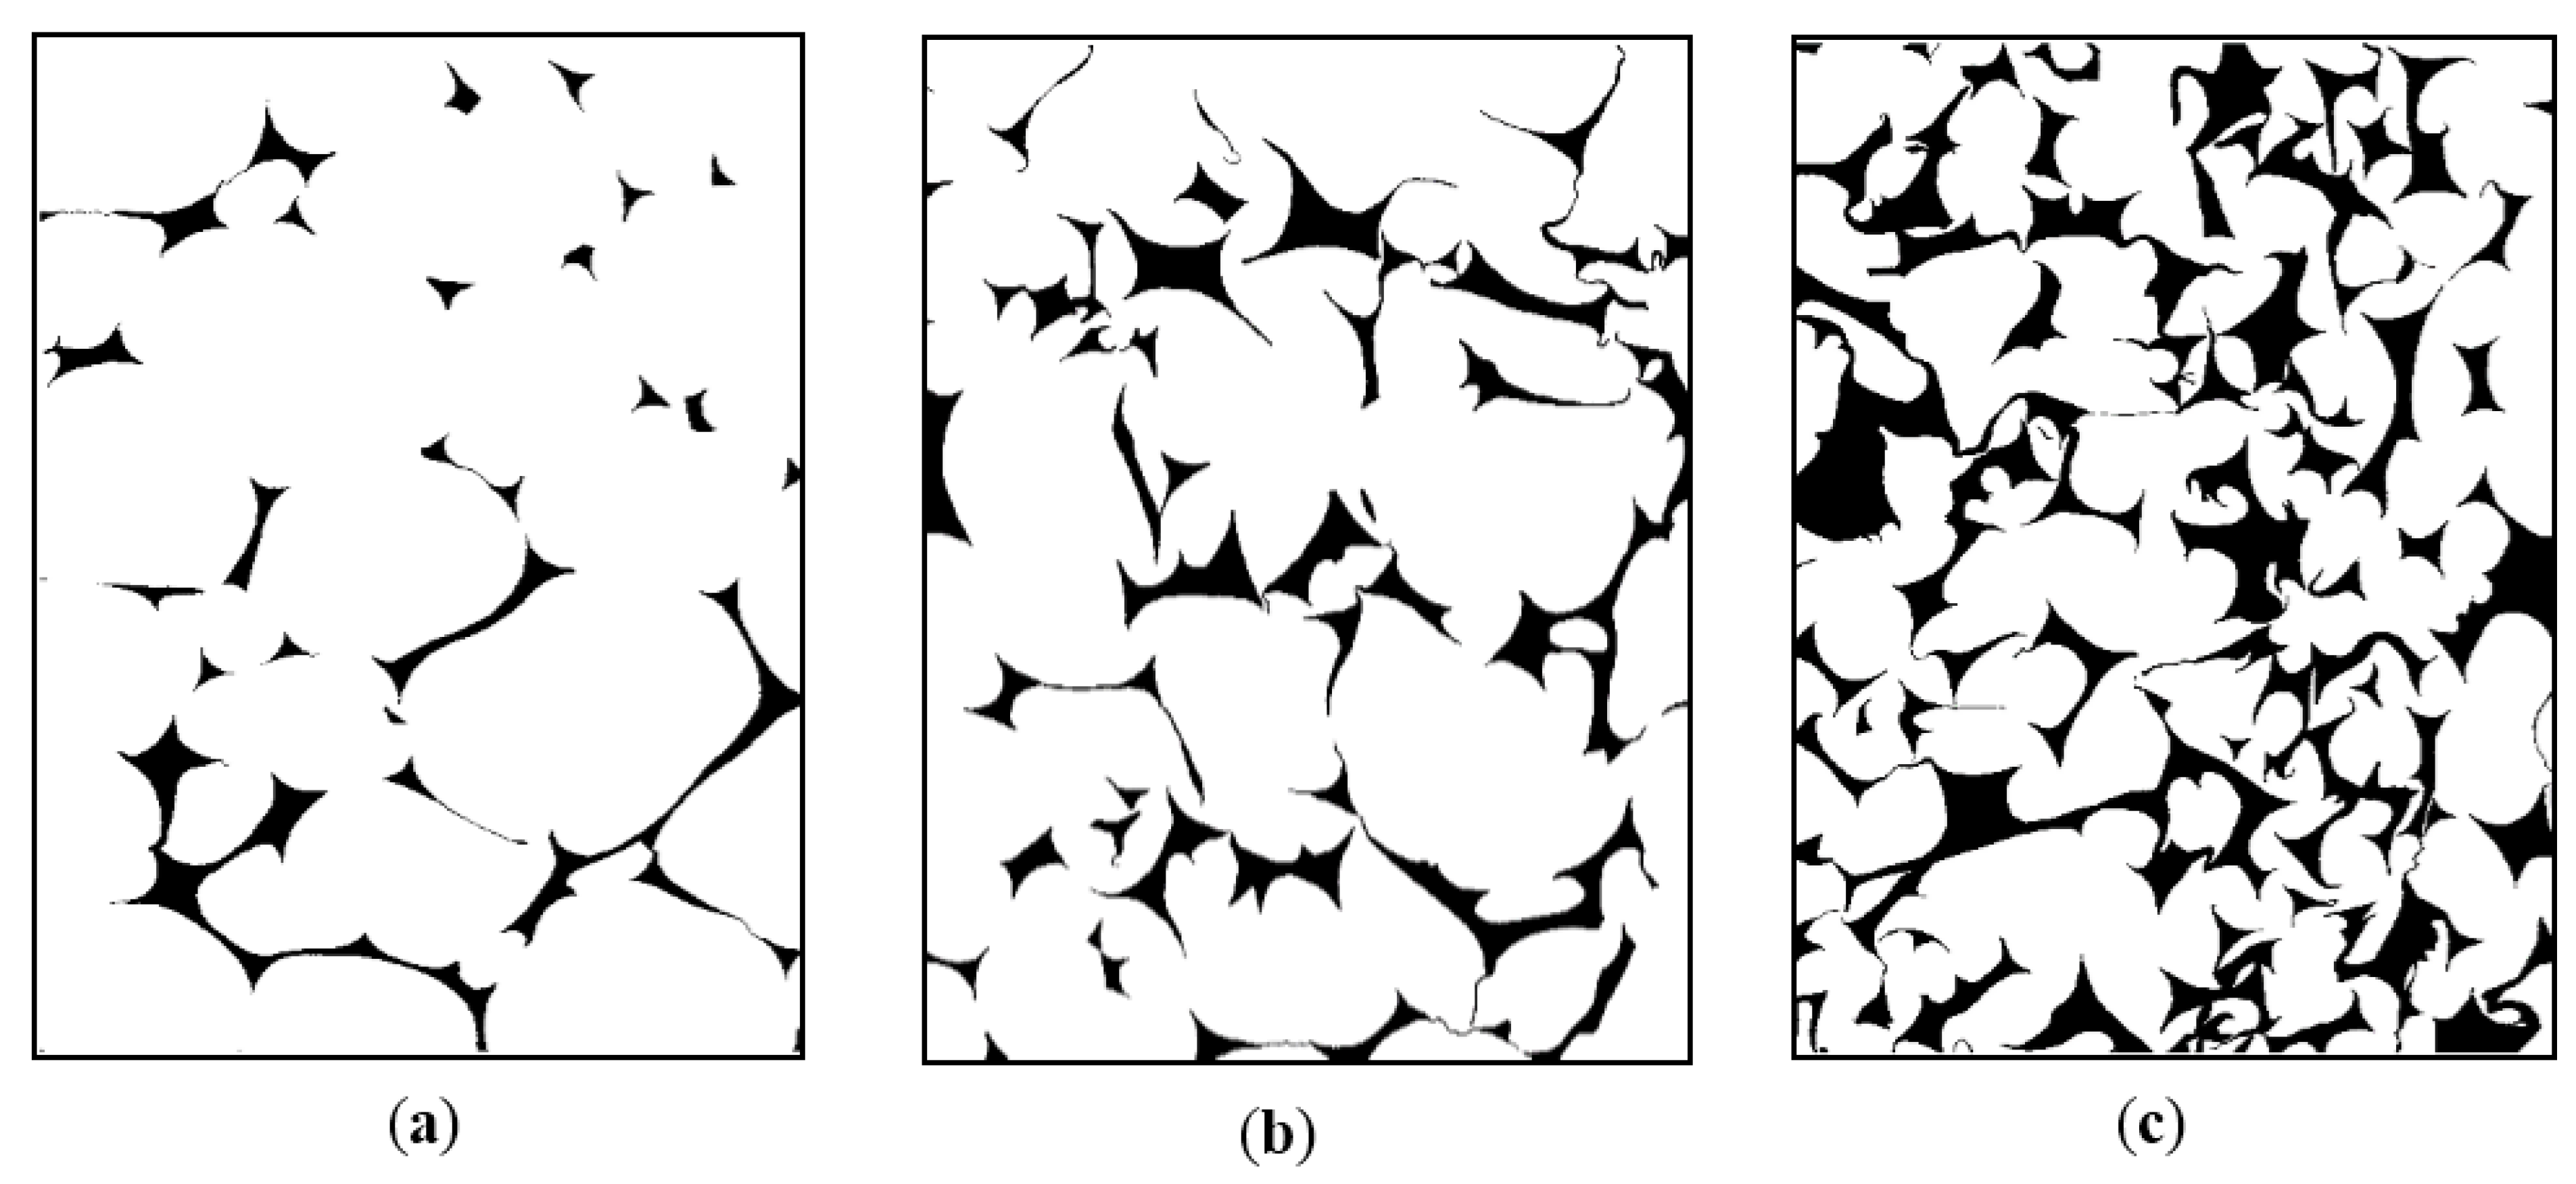
Figure 7b,c show surfaces of the blocks pressed at 2.0 and 3.0 kPa, respectively; summations of the contact area were 0.35 and 0.75 mm2, respectively. It is thus seen that the contact area of the block was increased by compression pressure, and the resistance of the conductive foam block was decreased by increasing the contact area of the block.
Figure 6. Surface of the conductive foam block. The compression pressure was 0.0 kPa. This figure is the combination of 16 images. Spiky long and thin features are fibers of the conductive foam. The broken-line rectangle shows the observation area (2.0 mm × 1.5 mm).
Fibers 03 00463 g006
Figure 7. Comparison of contact areas of the conductive foam. Black areas indicate the surface of the conductive foam: (a) no compression (0.0 kPa); (b) compressed at 2.0 kPa; (c) compressed at 3.0 kPa.
Fibers 03 00463 g007

3.3. Measured Contact Pressure at Each Electrode

We measured the contact pressure at each electrode when the subject wore the smart shirt. At first, the contact pressure was measured without the conductive foam blocks inserted between the shirt and body. We then measured the contact pressure when the conductive foam blocks were attached to the smart shirt (Figure 8).
Measured pressures at each electrode are given in Table 1. The upper row of the table gives the contact pressure when the blocks were not attached. The pressures at electrodes V1 and V2 have values of 0.0 kPa because these electrodes did not touch the body. The other pressures were approximately 2 to 3 kPa. In contrast, pressures were approximately 3 to 5 kPa when the blocks were attached to the shirt; i.e., all electrodes were in contact with the body because of the conductive foam blocks.
Table 1. Compression pressures at electrodes V1 to V6.
ElectrodeV1V2V3V4V5V6
without conductive foam blocks (kPa)0.00.02.72.41.82.0
with conductive foam blocks (kPa)3.73.54.54.93.53.3
Figure 8. Conductive foam blocks on the smart shirt.
Fibers 03 00463 g008

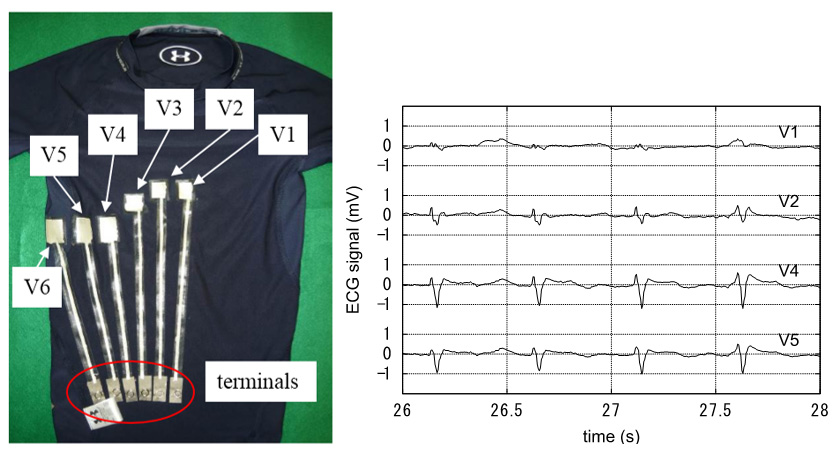
3.4. Measured ECG Signals

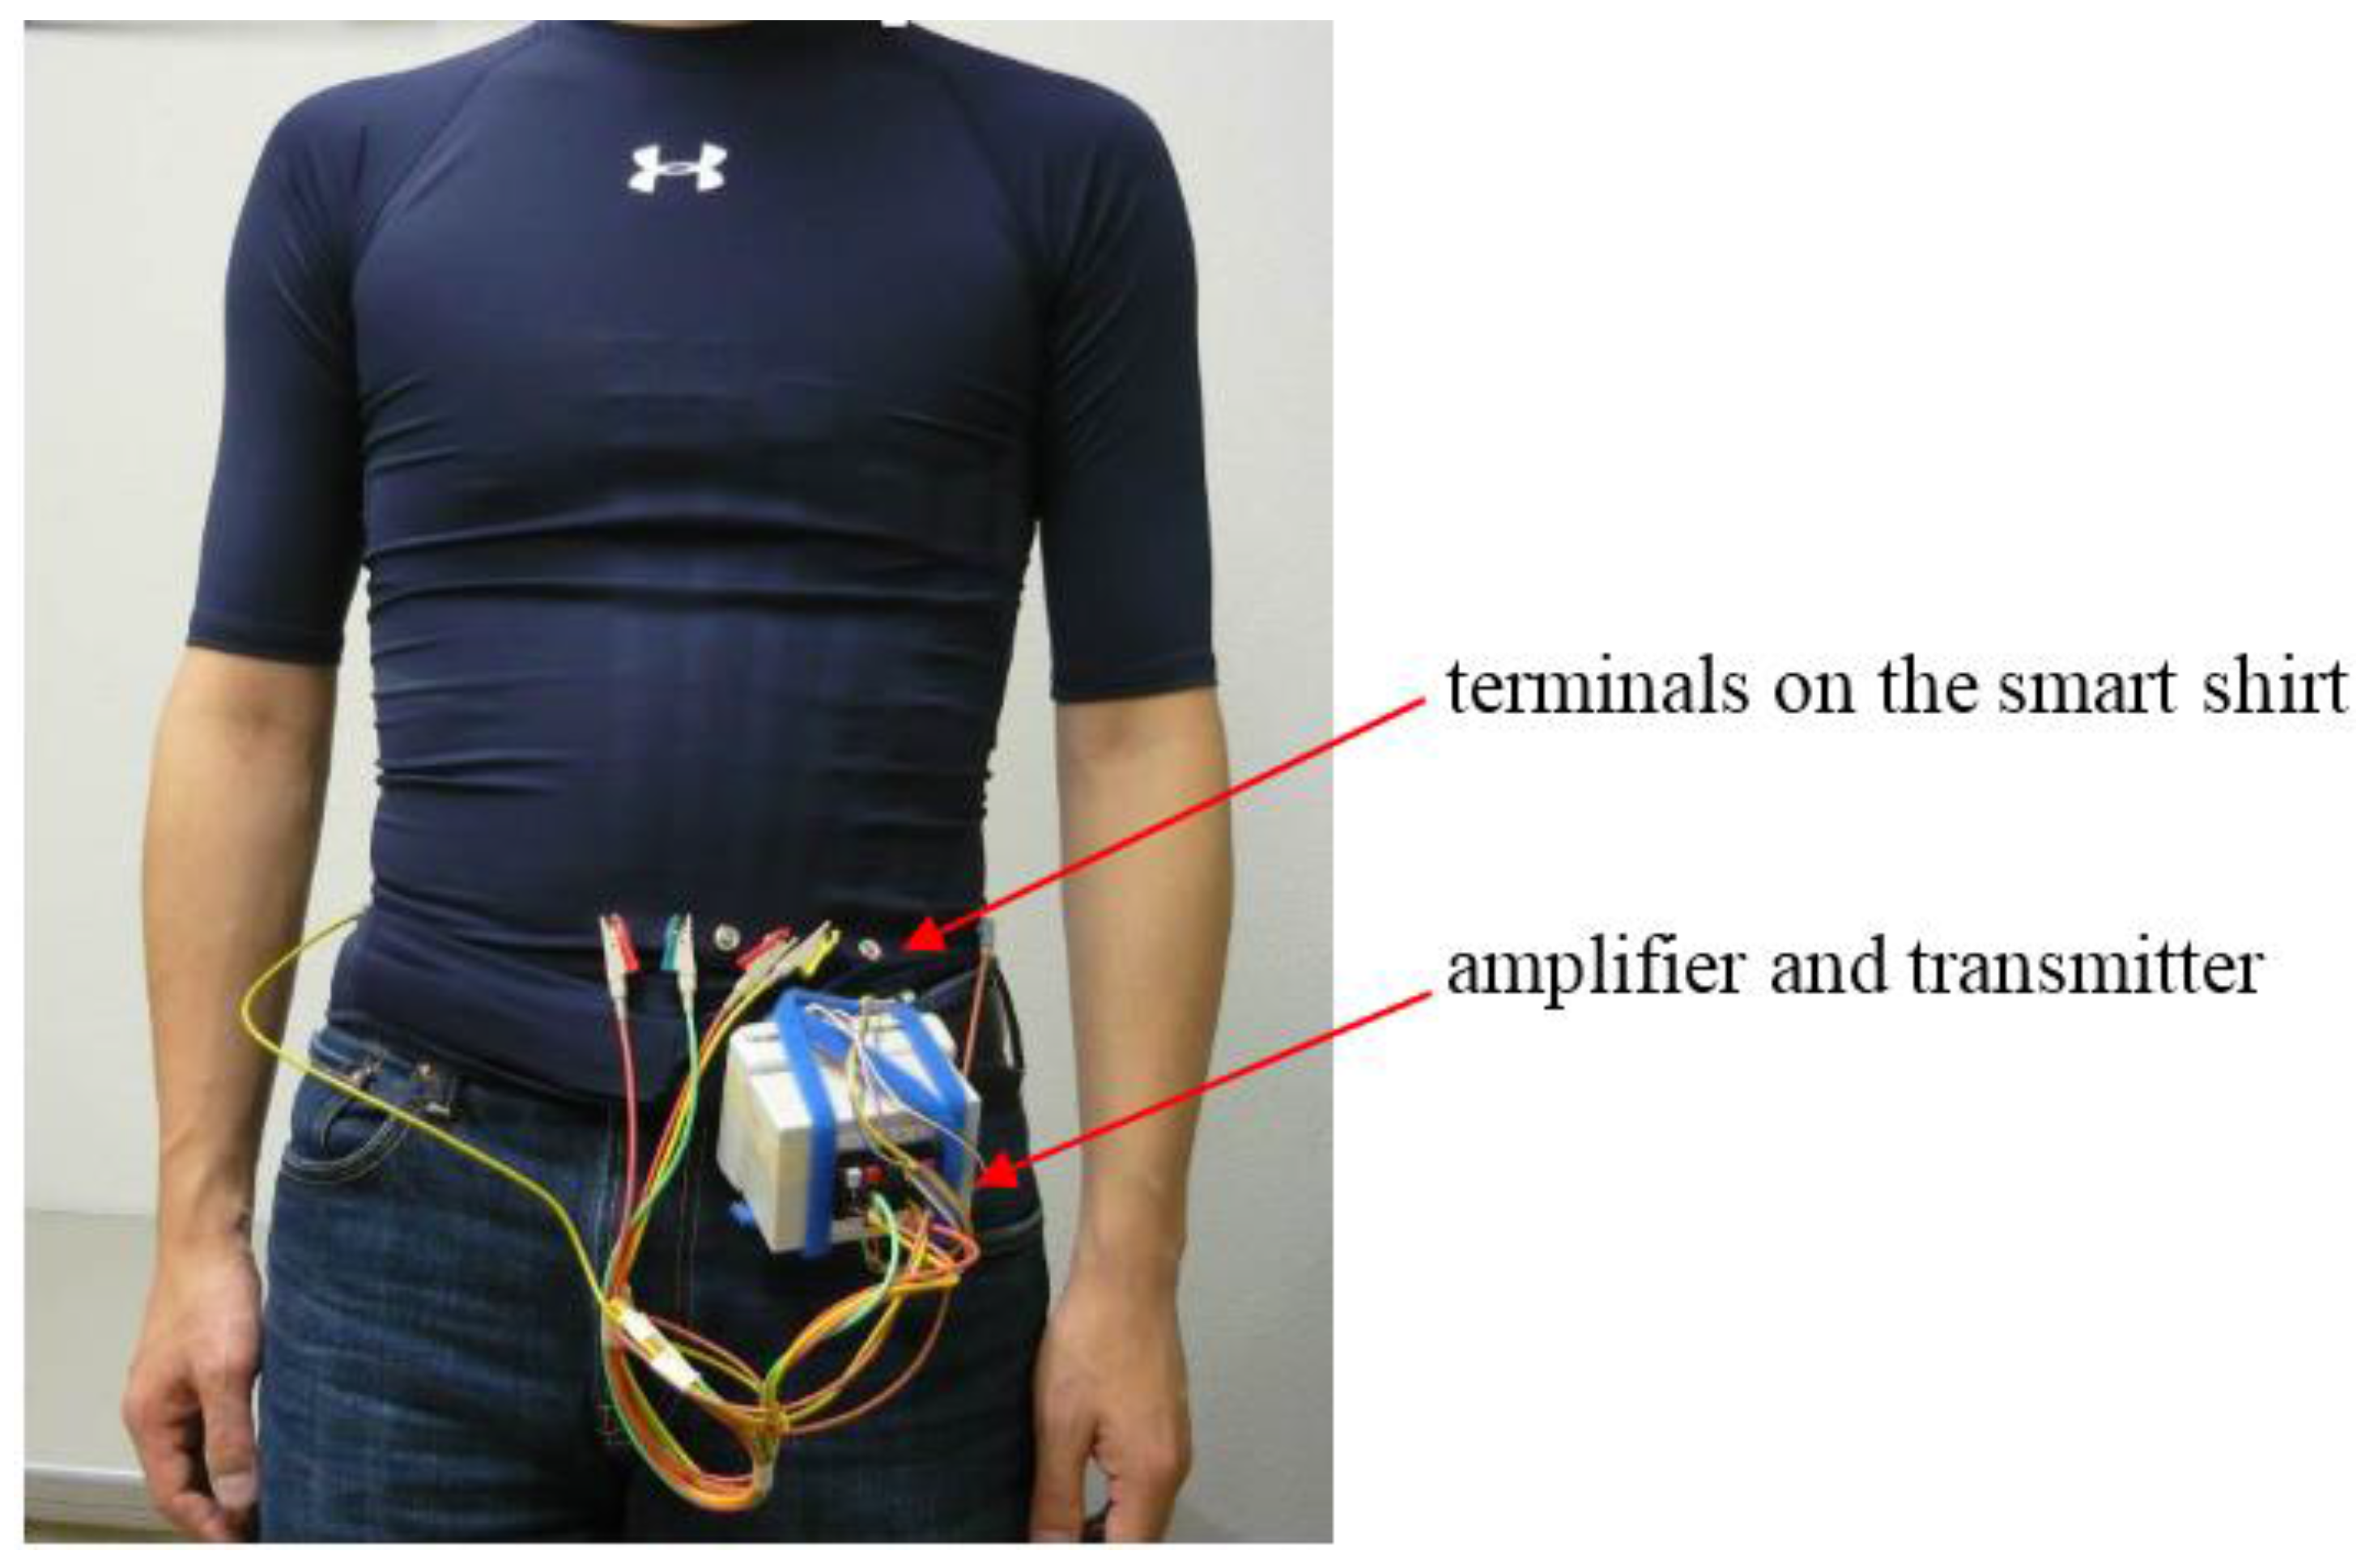
We measured the subject’s ECG signals using the smart shirt (Figure 9). In experiments, we measured the signals from four electrodes—V1, V2, V4, and V5—because the amplifier had only four input channels. This selection was decided by the contact conditions of the electrodes. The contact conditions (noncontact or contact) of electrodes V1 and V2 changed drastically if the conductive foam blocks were used. In contrast, electrodes V4 and V5 were in contact with the body irrespective of whether the blocks were used.
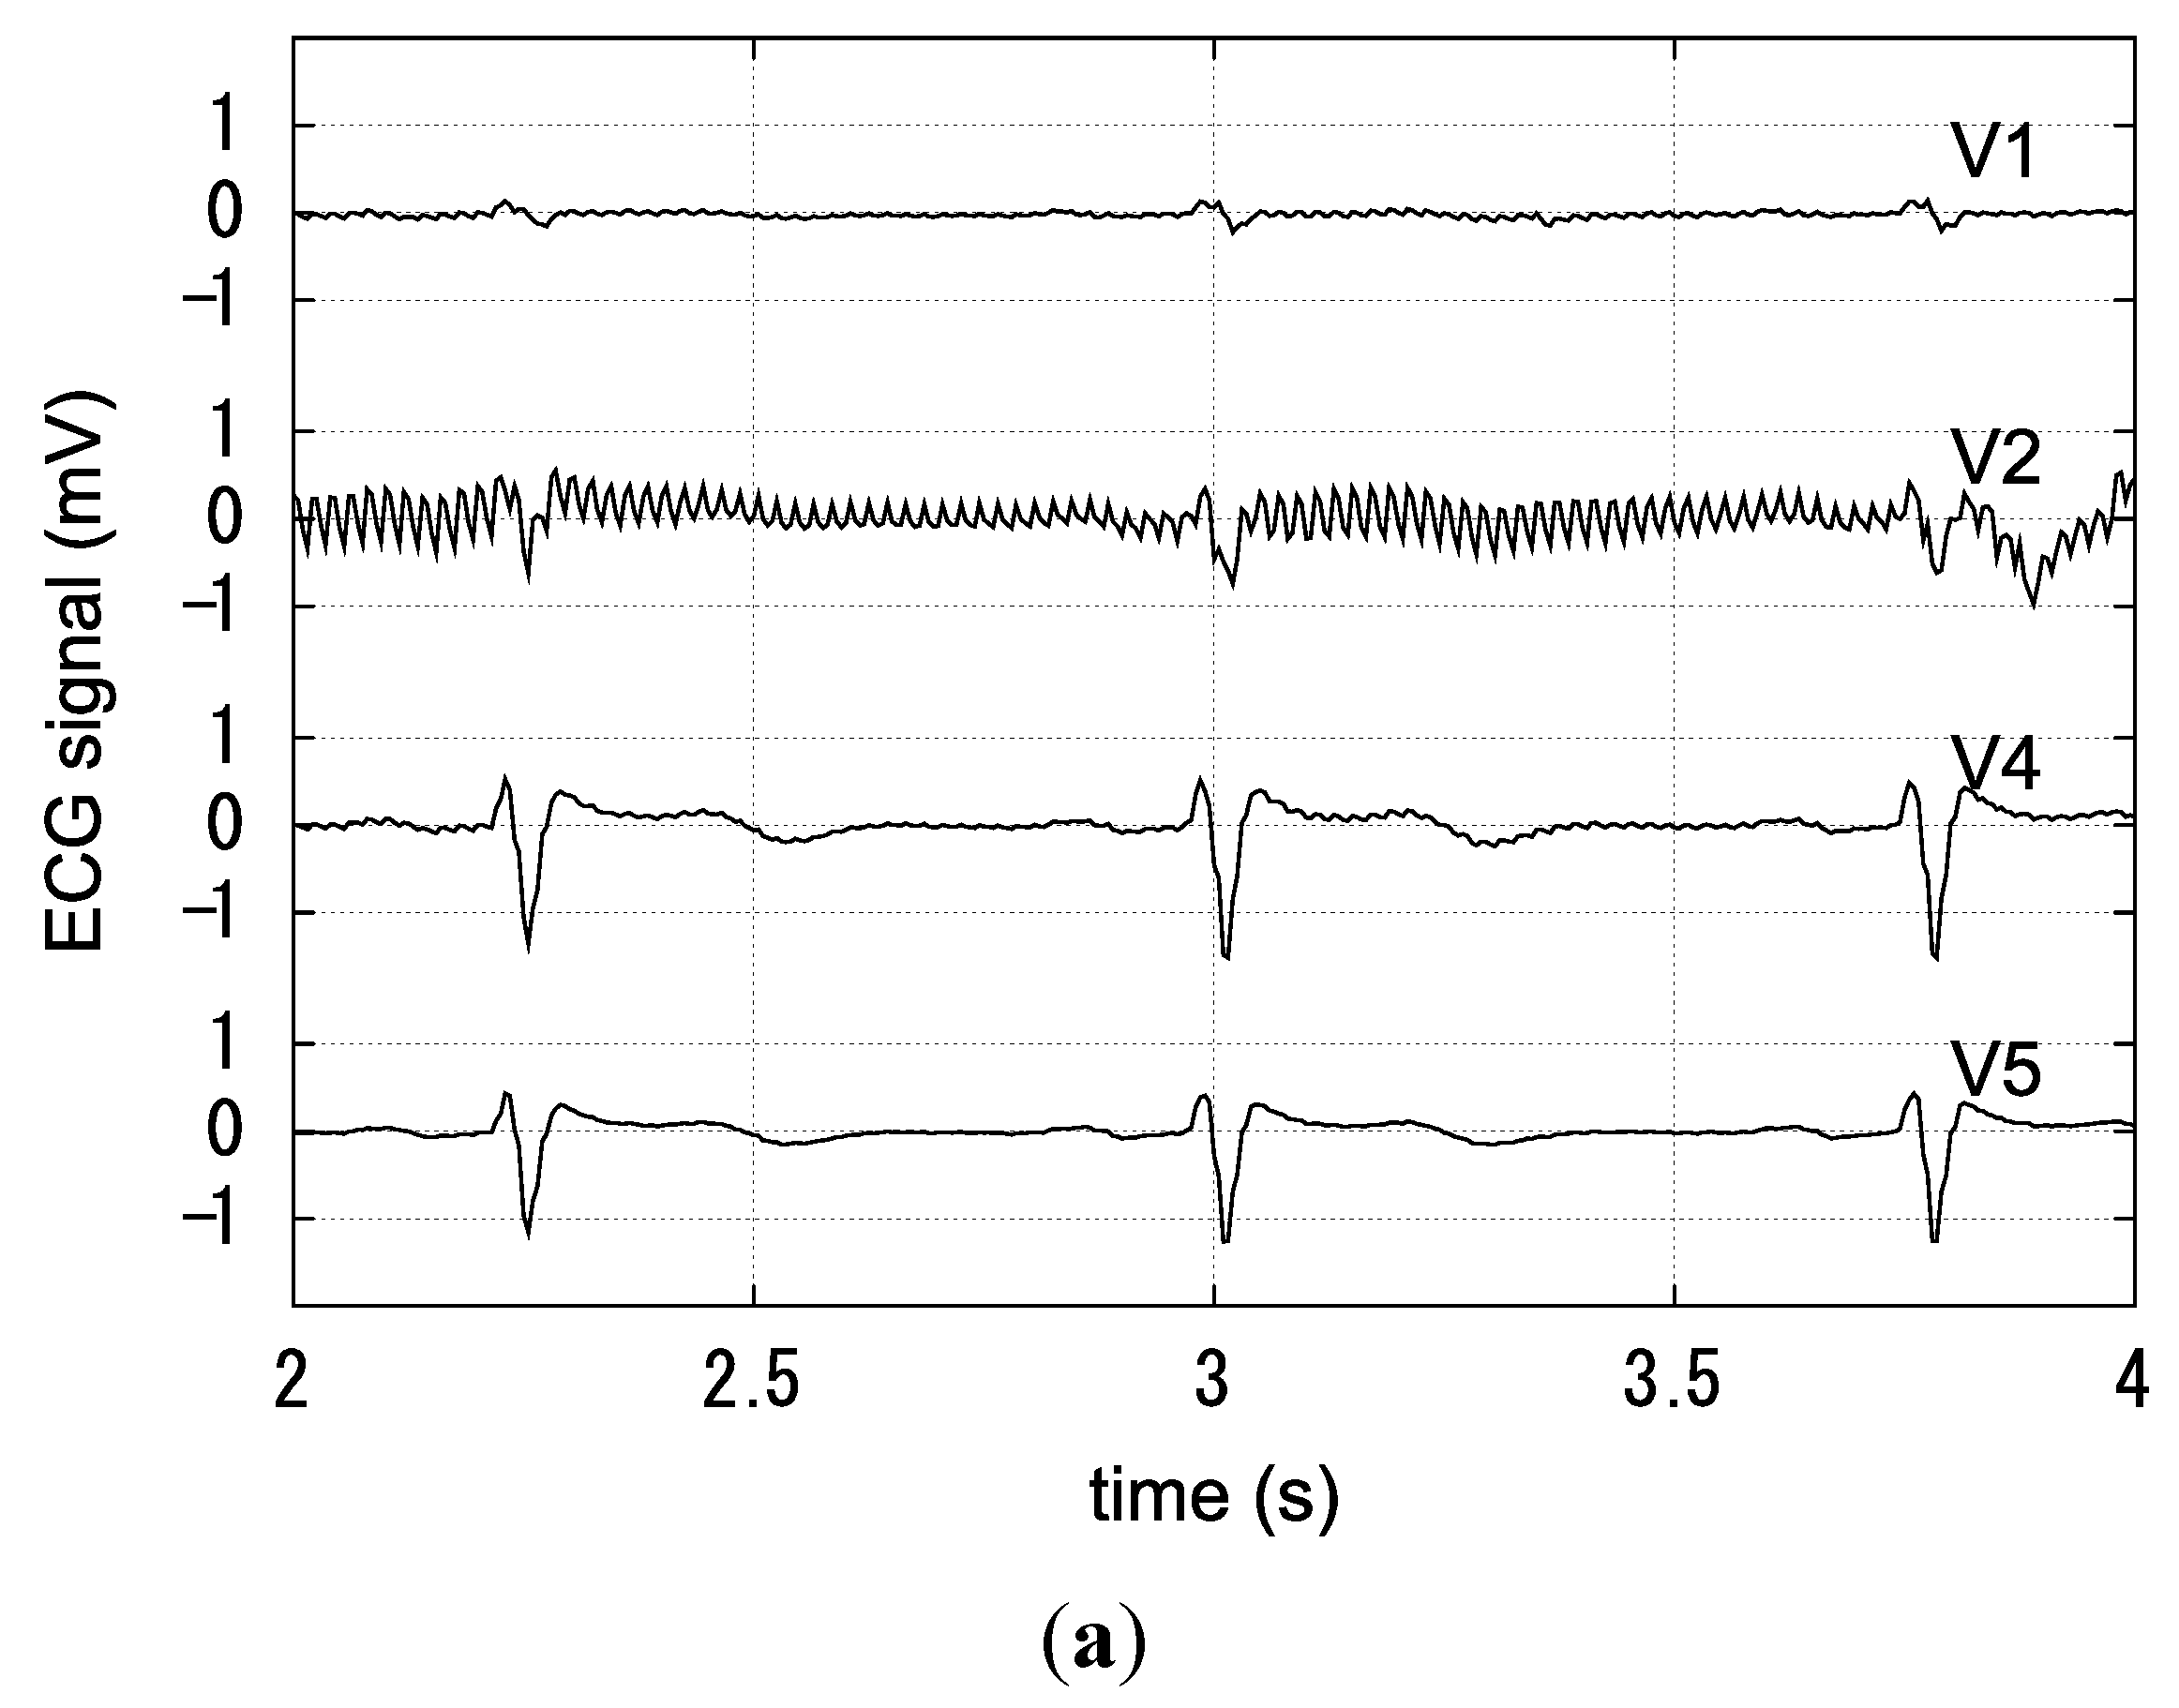
At first, the conductive foam blocks were not attached to the smart shirt. The subject was slightly sweaty; skin moisture was approximately 40%. The ECG measurement when the subject rested in a chair is shown in Figure 10a. There was a humming noise in the V2 signal. In contrast, the V4 and V5 signals were stable. V1 and V2 signals appeared like the ECG signals even though the contact pressure was 0.0 kPa as described in section 3.3. This was because the electrodes were in slight contact with the body. Figure 10b shows the ECG signals recorded while the subject walked. V1 and V2 signals were not discriminable as ECG signals because of swing noise and irregular peaks. In contrast, V4 and V5 signals were stable and discriminable as ECG signals. Moreover, we measured the ECG signals shown in Figure 10c while the subject jogged slowly. V1 and V2 signals had much swing noise and could not be distinguished as ECG signals. There were slight swings in V4 and V5 signals, but peaks of the ECG signal were detectable.
Figure 9. Subject wearing our smart shirt.
Fibers 03 00463 g009
Figure 10. ECG signals measured by the smart shirt without the conductive foam blocks: (a) the subject resting in a chair; (b) the subject walking; (c) the subject slowly jogging.
Fibers 03 00463 g010aFibers 03 00463 g010b
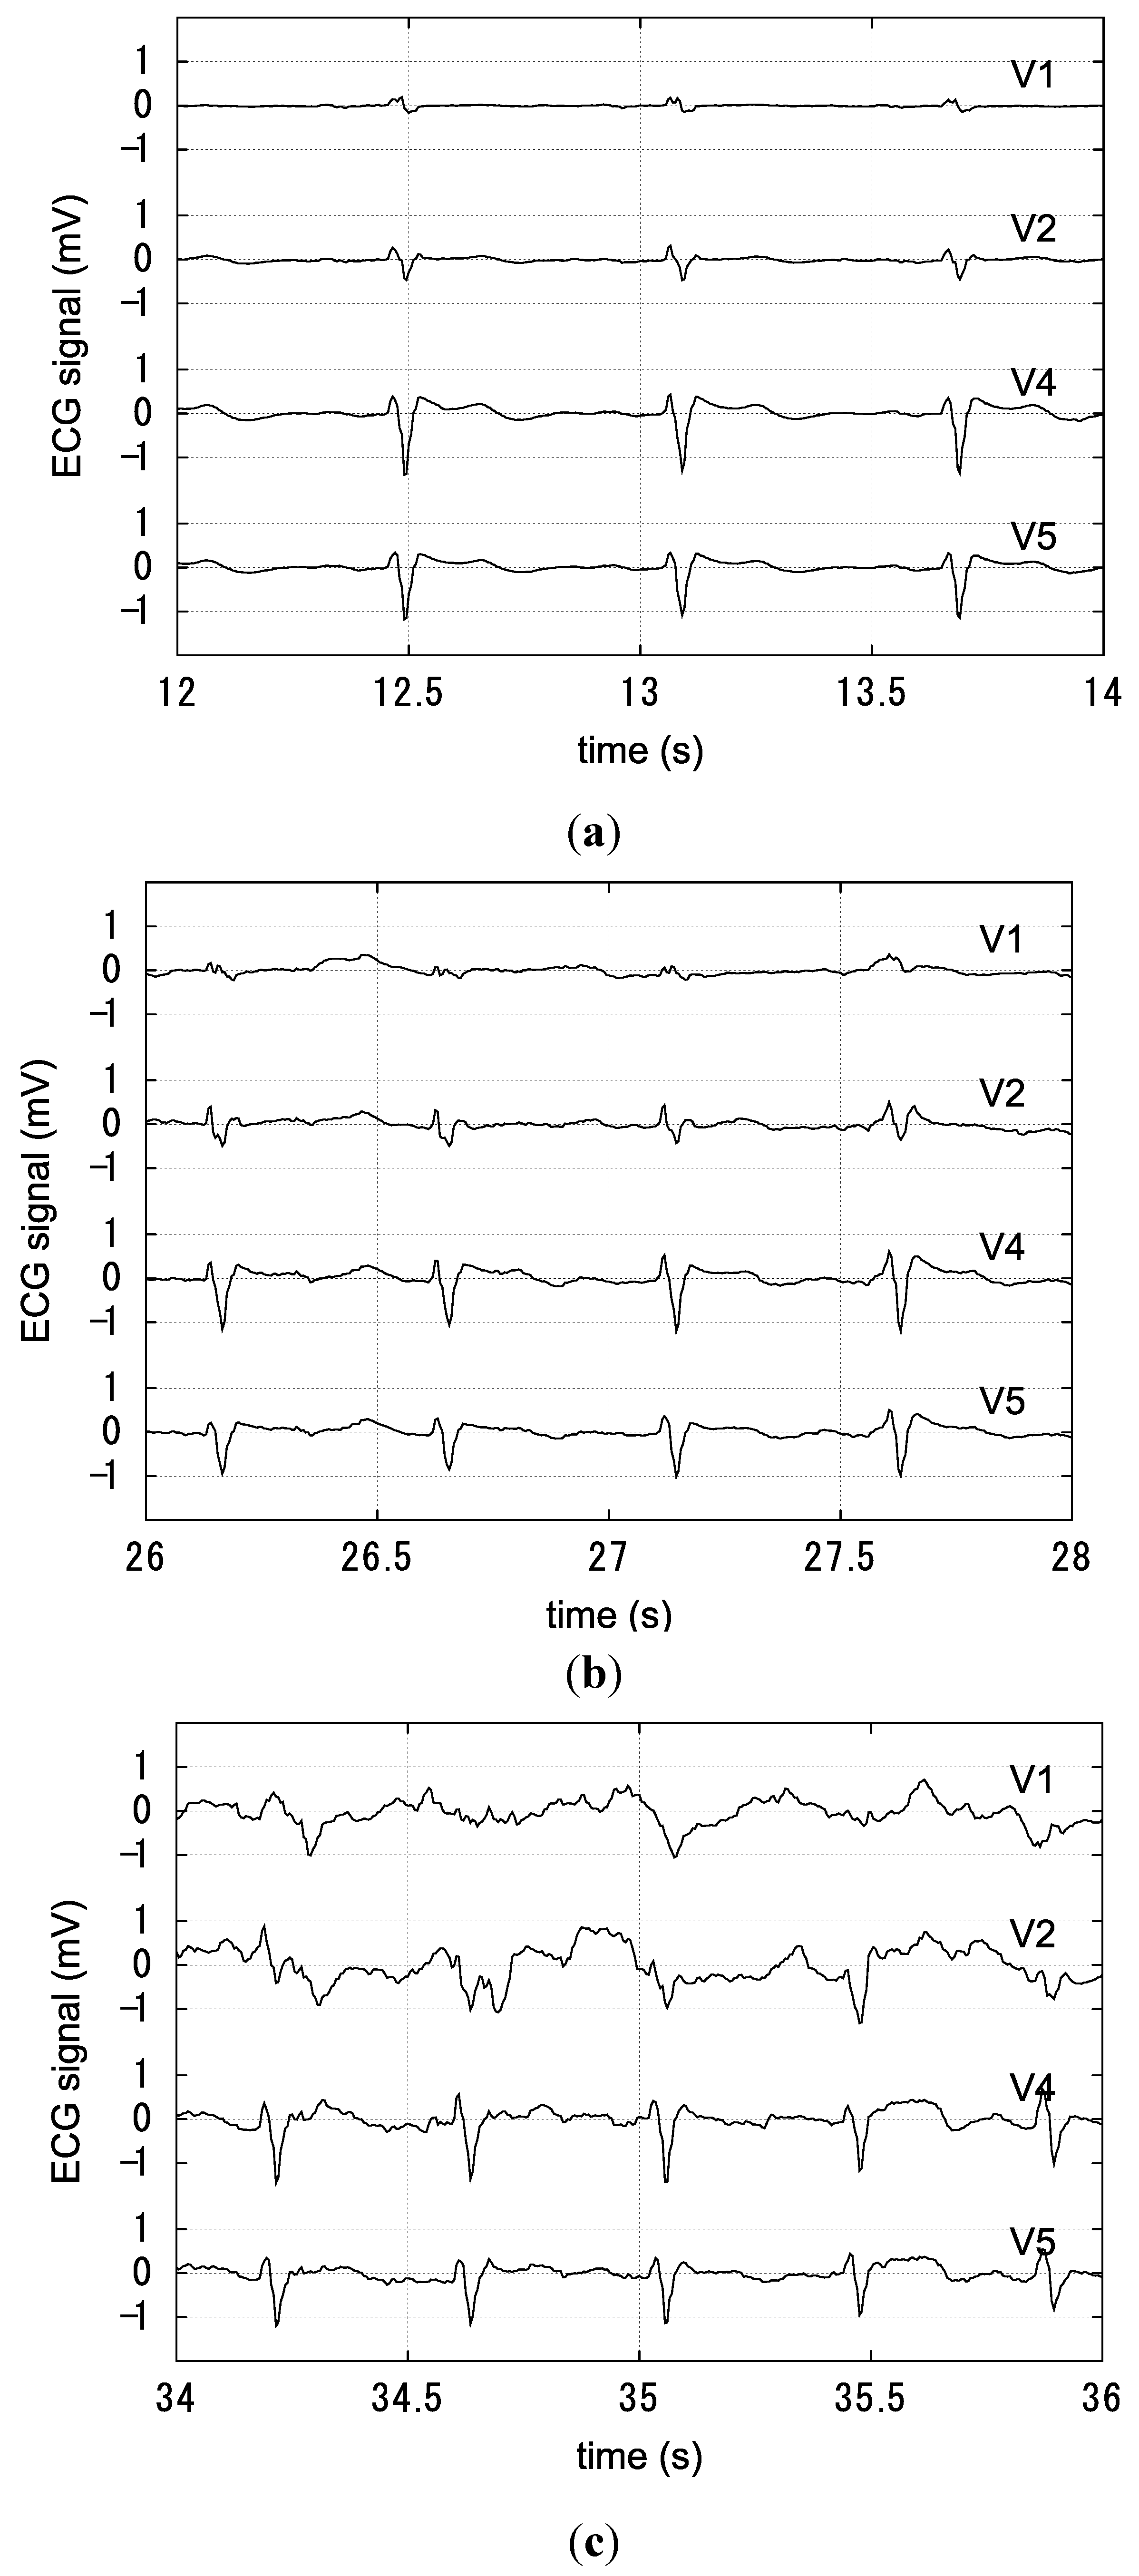
In the next experiments, conductive foam blocks were attached at electrodes V1, V2, V4 and V5 on the smart shirt. We measured the ECG signal while the subject rested, walked, and slowly jogged. Figure 11a shows the ECG signals recorded while the subject rested. The ECG signals were very stable and easy to discriminate. The ECG signals recorded while the subject walked are shown in Figure 11b. The ECG signal was easy to discriminate, but there was small swing noise. Finally, Figure 11c shows the ECG signals recorded while the subject jogged slowly. V1 and V2 signals had much swing noise and could not be distinguished as ECG signals. V4 and V5 signals had small swing noise and distinguishable peaks of ECG signals.
The above experimental results are summarized as follows. The ECG signals from electrodes V1 and V2 that were difficult to measure stably without the conductive foam blocks could be measured with the conductive foam blocks. The ECG signals from all electrodes were measured stably even though the subject was walking. We thus considered that our smart shirt could measure ECG signals during light activities of daily life. However, measuring the ECG was difficult when the subject was exercising.
Figure 11. ECG signals measured by the smart shirt with the conductive foam blocks: (a) the subject resting in a chair; (b) the subject walking; (c) the subject slowly jogging.
Fibers 03 00463 g011
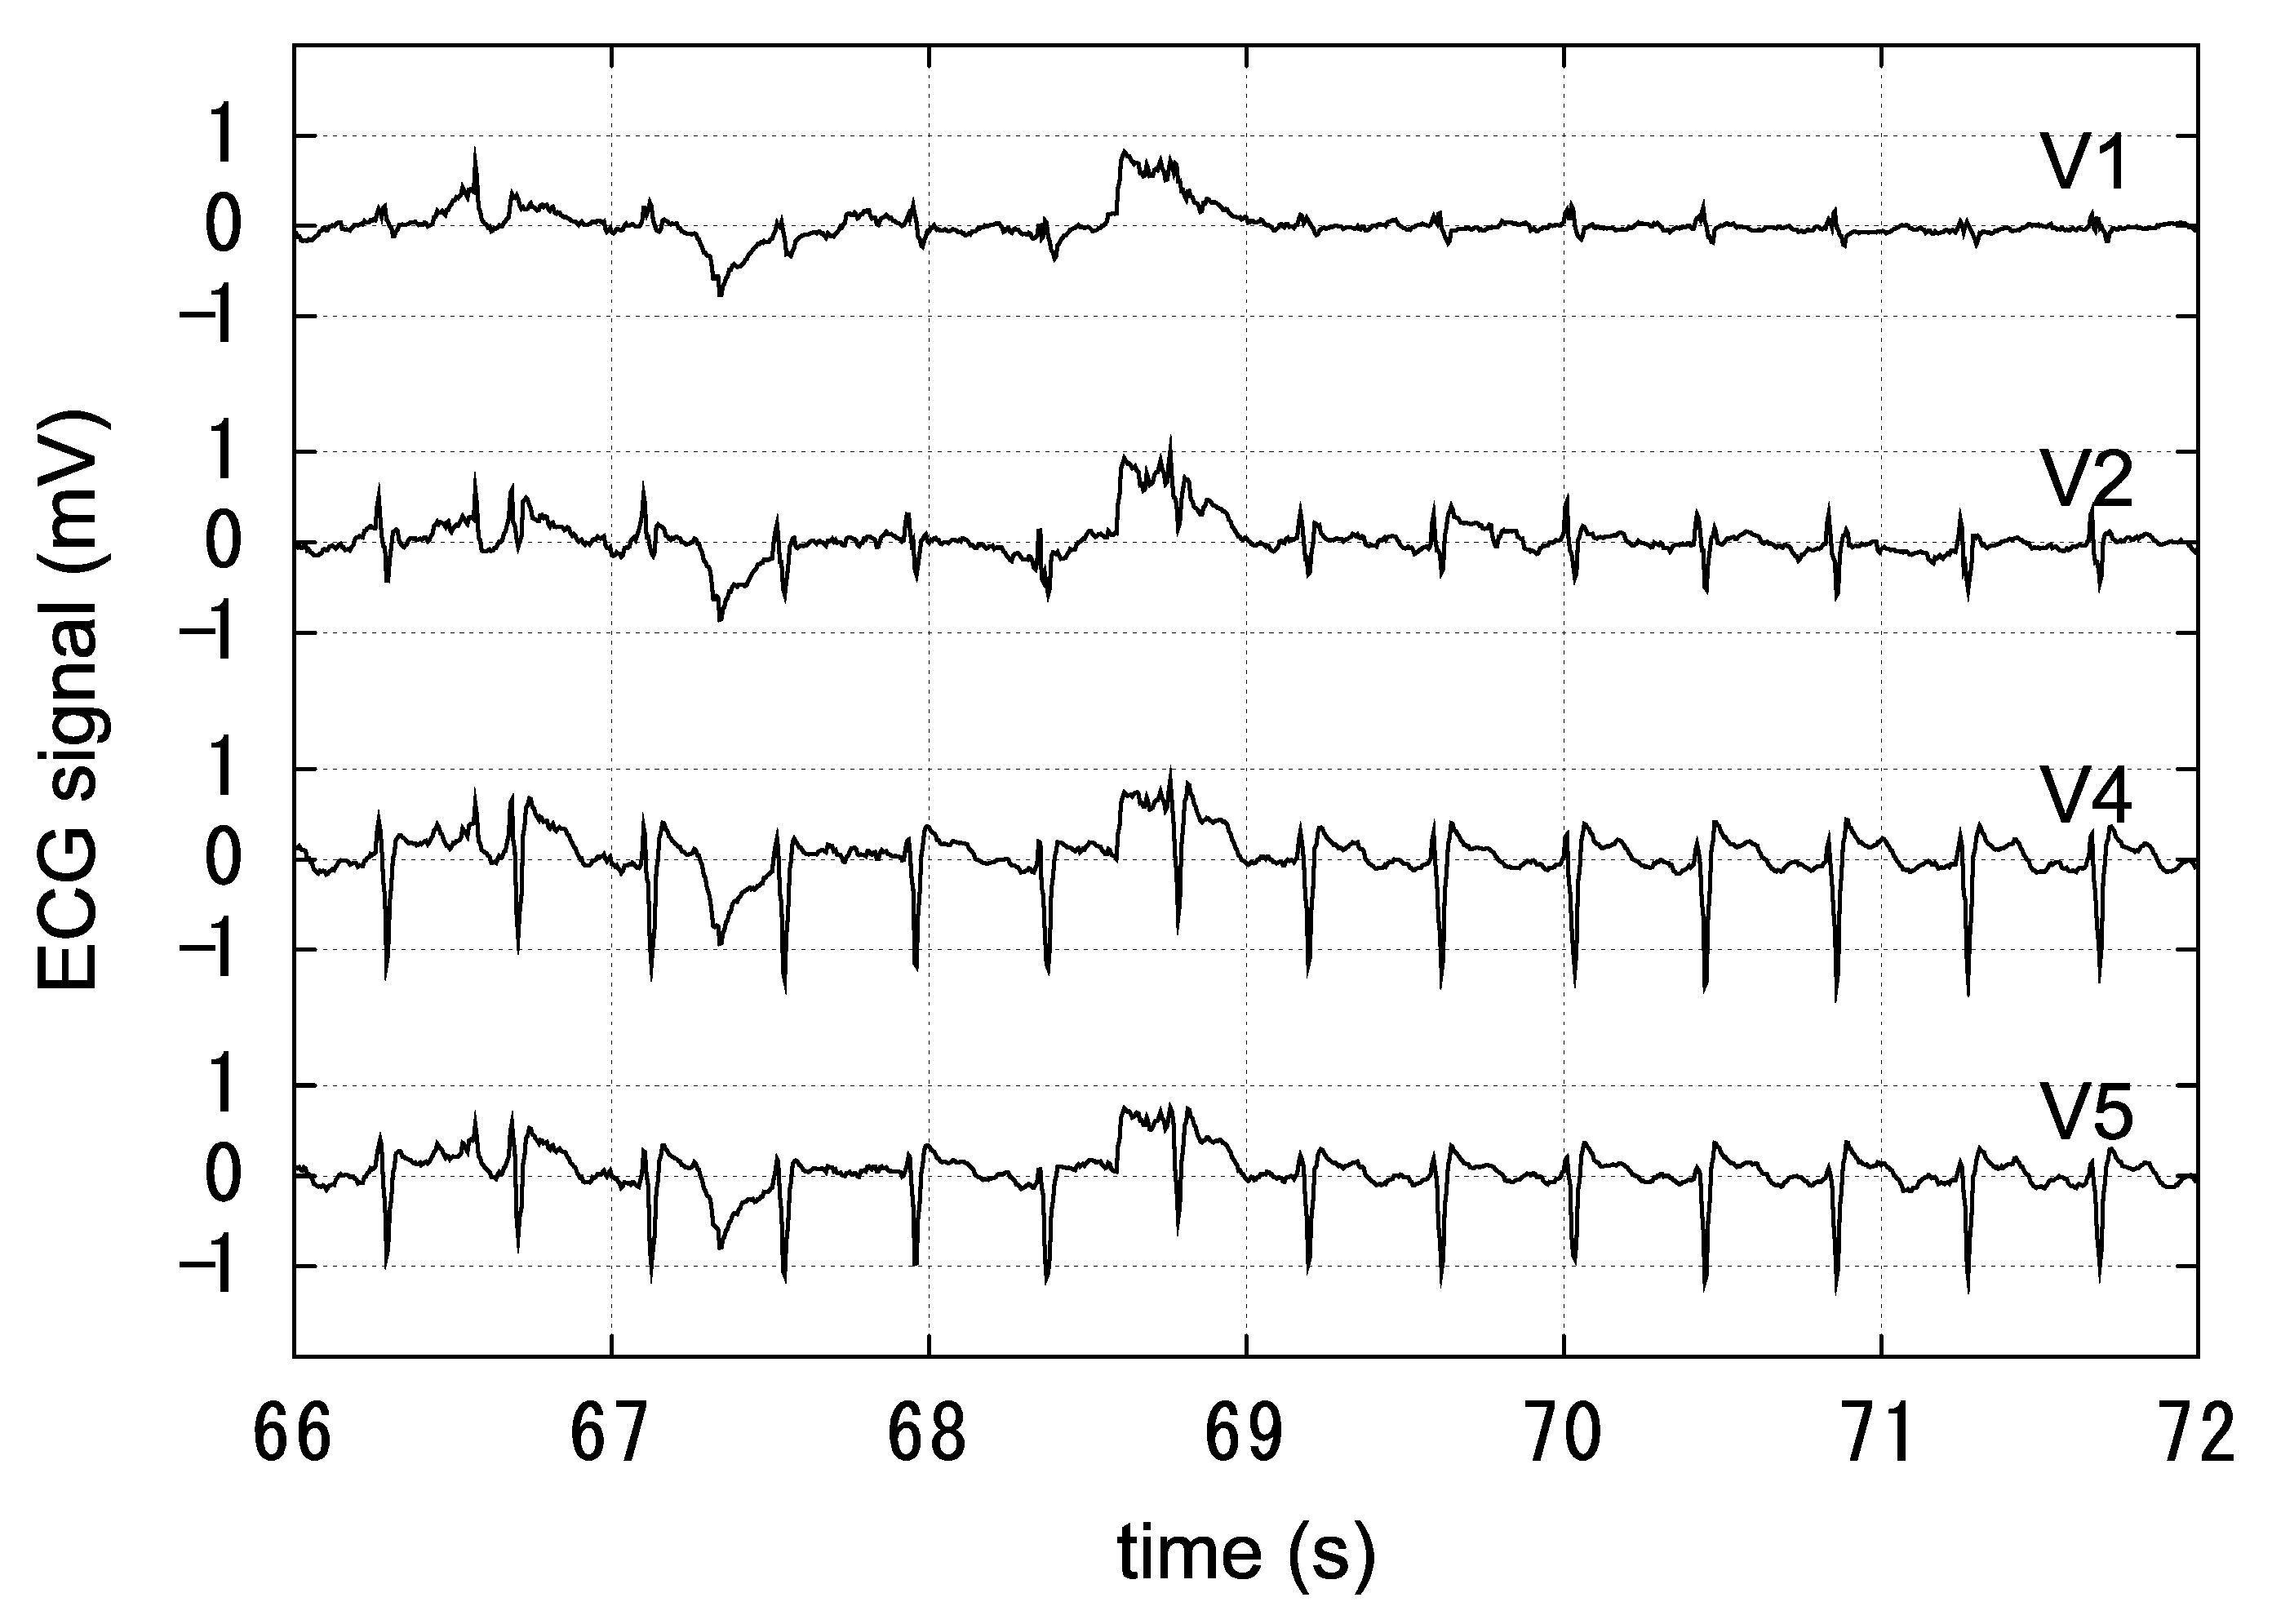
Figure 12 shows the ECG signals recorded when the subject jogged for 69 s and then rested in a standing position. The figure indicates that the measured ECG signals became stable immediately when the subject stopped exercising. Therefore, the smart shirt could measure the ECG signals intermittently when the subject was exercising.
Figure 12. ECG signals measured by the smart shirt with the conductive foam blocks. The subject slowly jogged for 69 s and then rested in a standing position. The ECG signals became stable immediately when the subject stopped exercising.
Fibers 03 00463 g012
The stability of signals from electrodes V1 and V2 has to be improved. The contact condition of these electrodes was greatly affected by the vibration of jogging. We considered that the change in the contact condition was a cause of the unstable signal. If the contact pressure increases, the electrodes are pushed close against the body and the ECG signal can be measured stably.

4. Conclusions

We developed a smart shirt that had 10 electrodes made of conductive ink and could measure the ECG with a unipolar precordial lead configuration. The smart shirt well fitted the subject’s body. However, electrodes V1 and V2 were not in stable contact with the body because they were placed on a concave area of the chest. To fill the gap between the smart shirt and body, we developed conductive foam blocks. The substrate of each block was made of the urethane foam and was irradiated by ultrasound within a reaction liquid. The irradiated urethane foam block became conductive because of nanostructured Ag. Moreover, the resistance of the conductive foam block was reduced by compression of the block. This characteristic is suitable for the smart shirt because the block attached to the shirt is compressed when the shirt is worn.
We measured ECG signals using the smart shirt. The ECG signals from electrodes V1 and V2 were unstable when the conductive foam blocks were not attached to the smart shirt. In contrast, ECG signals from all electrodes could be measured if the conductive foam blocks were attached at each electrode. The ECG signals were also measured stably while the subject walked. However, the ECG signals from electrodes V1 and V2 contained large swing noise when the subject jogged slowly. In this case, the ECG signals from electrodes V4 and V5 also contained swing noise but we could detect peaks of the ECG signal.
We considered that signals from electrodes V1 and V2 were noisy because of the change in the contact conditions. Large vibrations due to exercise led to the large swing noise. Solutions to this problem might include the use of a petrosal conductive foam block that increases the contact pressure and/or the use of softer conductive foam that allows close contact. We will investigate these methods in future work.
The smart shirt should have washing durability and the electrodes should have long-term stability. These properties are being investigated by our group. Furthermore, for different subjects, we will investigate the comfort of the smart shirt and the conductive foam, and we will investigate the accuracy of the ECG measurement.

Acknowledgments

A portable electrocardiograph in this study was provided by Bio Signal Co., Ltd., Osaka, Japan.

Author Contributions

Yasunori Tada, Yusaku Amano, Tomonobu Sato, Shigeru Saito, and Masahiro Inoue designed the experiments; Yasunori Tada and Yusaku Amano performed the experiments; Yasunori Tada wrote the paper.

Conflicts of Interest

The authors declare no conflict of interest.

References

  1. Paradiso, R.; Rossi, D.D. Advances in textile technologies for unobtrusive monitoring of vital parameters and movements. In Proceedings of the 28th IEEE EMBS Annual International Conference, New York City, NY, USA, 30 August–3 September 2006; pp. 392–395.
  2. Karlsson, J.S.; Wiklund, U.; Berglin, L.; Östlund, N.; Karlsson, M.; Bäcklund, T.; Lindecranz, K.; Sandsjö, L. Wireless Monitoring of Heart Rate and Electromyographic Signals Using a Smart T-shirt. In Proceedings of the 5th International Workshop on Wearable Micro, and Nano Technologies for Personalised Health, pHealth, Valencia, Spain, 21–23 May 2008.
  3. Vojtech, L.; Bortel, R.; Neruda, M.; Kozak, M. Wearable Textile Electrodes for ECG Measurement. Adv. Elect. Electr. Eng. 2013, 11, 410–414. [Google Scholar] [CrossRef]
  4. Tada, Y.; Inoue, M.; Tokumaru, T. An evaluation of the characteristics of a stretchable ink wire suitable for the measurement of biological signals. J. Text. Inst. 2014, 105, 692–700. [Google Scholar] [CrossRef]
  5. Tsukada, S.; Kasai, N.; Kawano, R.; Takagahara, K.; Fujii, K.; Sumitomo, K. Electrocardiogram Monitoring Simply by Wearing a Shirt—For Medical, Healthcare, Sports, and Entertainment. NTT Tech. Rev. 2014, 12, 1–7. [Google Scholar]
  6. Lage, J.; Catarino, A.; Carvalho, H.; Rocha, A. Smart Shirt with Embedded Vital Sign and Moisture Sensing. In Proceedings of The First International Conference on Smart Portable, Wearable, Implantable and Disability-oriented Devices, Brussels, Belgium, 21–26 June 2015; pp. 25–30.
  7. Carvalho, H.; Catarino, A.P.; Rocha, A.; Postolache, O. Health monitoring using textile sensors and electrodes: An overview and integration of technologies. In Proceedings of the 2014 IEEE International Symposium on Medical Measurements and Applications (MeMeA), Lisbon, Portugal, 11–12 June 2014; pp. 1–6.
  8. Morrison, T.; Silver, J.; Otis, B. A Single-chip Encrypted Wireless 12-Lead ECG Smart Shirt for Continuous Health Monitoring. In Proceedings of the 2014 Symposium on VLSI Circuits Digest of Technical Papers, Honolulu, HI, USA, 10–13 June 2014; pp. 1–2.
  9. Reuters: ECG Shirt Warns Wearer of Heart Problems via Smartphone. Available online: http://www.personal-healthwatch.com/reuters-ECG-shirt.aspx (accessed on 25 August 2015).
  10. Marozas, V.; Petrenas, A.; Daukantas, S.; Lukosevicius, A. A comparison of conductive textile-based and silver/silver chloride gel electrodes in exercise electrocardiogram recordings. J. Electrocardiol. 2011, 44, 189–194. [Google Scholar] [CrossRef] [PubMed]
  11. Paul, G.; Torah, R.; Beedy, S.; Tudor, J. The development of screen printed conductive networks on textilesfor biopotential monitoring applications. Sens. Actuator A 2014, 206, 35–41. [Google Scholar] [CrossRef]
  12. Seoane, F.; Mohino-Herranz, I.; Ferreira, J.; Alvarez, L.; Buendia, R.; Ayllón, D.; Llerena, C.; Gil-Pita, R. Wearable Biomedical Measurement Systems for Assessment of Mental Stress of Combatants in Real Time. Sensors 2014, 14, 7120–7141. [Google Scholar] [CrossRef] [PubMed]
  13. Lobodzinski, S.S.; Laks, M.M. Comfortable textile-based electrocardiogram systems for very long-term monitoring. Cardiol. J. 2008, 15, 477–480. [Google Scholar] [PubMed]
  14. Sardini, E.; Serpelloni, M. Instrumented Wearable Belt for Wireless Health Monitoring. In Proceedings of the Eurosensors XXIV, Linz, Austria, 5–8 September 2010; pp. 580–583.
  15. Sardini, E.; Serpelloni, M.; Ometto, M. Multi-parameters wireless shirt for physiological monitoring. In Proceedings of the 2011 IEEE International Workshop on Medical Measurements and Applications, Bari, Italy, 30–31 May 2011; pp. 316–321.
  16. Trindade, I.G.; Martins, F.; Miguel, R.; Silva, M.S. Design and Integration of Wearable Devices in Textiles. Sens. Transducers 2014, 183, 42–47. [Google Scholar]
  17. Wagner, G.S.; Strauss, D.G. Marriott’s Practical Electrocardiography, 12th ed.; Lippincott Williams & Wilkins: Philadelphia, PA, USA, 2013; pp. 28–30. [Google Scholar]
  18. Inoue, M.; Itabashi, Y.; Tada, Y. Development of Bimodal Electrically Conductive Pastes with Ag Micro- and Nano-fillers for Printing Stretchable E-textile Systems. In Proceedings of the 20th European Microelectronics and Packaging Conference & Exhibition, Friedrichshafen, Germany, 14–16 September 2015.
  19. Inoue, M.; Hayashi, Y.; Takizawa, H.; Suganuma, K. Formation mechanism of nanostructured Ag films from Ag2O particles using a sonoprocess. Colloid Polym. Sci. 2010, 288, 1061–1069. [Google Scholar] [CrossRef]

