Numerical Verification of Gallium Nitride Thin-Film Growth in a Large MOCVD Reactor
by
 ,
,
Chih-Kai Hu
1 ,
,
Chun-Jung Chen
2,
Ta-Chin Wei
2,
Tomi T. Li
1,*,
Chih-Yung Huang
3,
Chu-Li Chao
3 and
Yi-Jiun Lin
3 1
Department of Mechanical Engineering, National Central University, Taoyuan 32001, Taiwan
2
Department of Chemical Engineering, Chung Yuan Christian University, Taoyuan 32023, Taiwan
3
Industrial Technology Research Institute, 195, Sec. 4, Chung Hsing Rd., Chutung, Hsinchu 31040, Taiwan
*
Author to whom correspondence should be addressed.
Coatings 2017, 7(8), 112; https://doi.org/10.3390/coatings7080112
Submission received: 20 June 2017
/
Revised: 28 July 2017
/
Accepted: 29 July 2017
/
Published: 31 July 2017
(This article belongs to the Special Issue Chemical Vapor Deposition)
Abstract
:A numerical verification procedure and the effects of operating conditions in a large, vertical, and close-spaced reactor for metalorganic chemical vapor deposition are investigated through simulation and analysis. A set of epitaxy experiments are presented for verifying the growth rate of the gallium nitride (GaN) mechanism reported in our previous study. The full governing equations for continuity, momentum, energy, and chemical reaction are solved numerically. The results show that the real operating parameters (susceptor temperature: 1188 °C or 1238 °C; pressure: 100–300 torr) affect thin-film uniformity, and the predicted growth rates agree reasonably well with the experimental data, indicating the accuracy of the projected chemical reaction mechanisms.
1. Introduction
Computational fluid dynamics (CFD) modeling has recently become a critical tool for designing and optimizing the performance of metalorganic chemical vapor deposition (MOCVD) reactors. Flow-stability maps have been developed through the two-dimensional (2D) and three-dimensional (3D) numerical modeling of possible process parameters. These maps show that all typical flow types encountered in a rotating-disc reactor capture the effects of the process parameters on the flow stability in the reactor [1,2].
The transport phenomena and thermoflow structure of vertical rotating-disk reactors have been investigated in several numerical simulation studies, and flow-stability maps have been developed through the 2D and 3D numerical modeling of possible process parameters for the entire domain. All typical flow types encountered in a rotating-disc reactor have been shown to capture the effects of all process parameters on flow stability in such reactors [3,4,5]. Systematic CFD studies have investigated the effects of various operating parameters—such as chamber pressure, wafer-carrier rotation rate, growth temperature, and total carrier-gas flow rate for different carrier gases—on the deposition rate and uniformity in vertical rotating-disc MOCVD reactors [6,7].
Yakovlev et al. presented the temperature kinetic effects in the metalorganic vapor-phase epitaxy of III–V compounds as well as a novel approach for the simulation of the growth of group-III nitrides, wherein the growth rate and solid-phase composition were predicted theoretically and compared with available experimental data; moreover, the data were verified for a commercial reactor [8,9,10].
In 2017, Crose et al. developed a multiscale CFD model of the plasma chemistry and transport phenomena in a plasma-enhanced chemical vapor deposition reactor by using the hybrid kinetic Monte Carlo method and an exponentially weighted moving average control algorithm [11,12]. The mass, momentum, and energy equation were solved through discretization. Hu et al. [13,14,15] have recently developed a modified large MOCVD reactor for producing uniform and large-volume gallium nitride (GaN) epitaxial thin films; they also numerically solved the full governing equations for continuity, momentum, energy, and chemical species.
By integrating these aforementioned studies and extending the work of Hu et al. [15], the current paper presents a verification procedure for the numerical analysis of flow-mixing phenomena in large MOCVD reactors.
2. Materials and Methods
The prediction of the GaN growth rate and thin-film uniformity on the surface or wafer requires a coupled solution of the conservation of mass, momentum, energy, and species equations—in other words, finite-rate homogeneous chemical reactions must be considered. To this end, the commercial CFD code Ansys Fluent (version 14.5) was used. The proposed mechanisms for GaN growth were implemented in a series of simulations of a large, vertical, and close-spaced MOCVD reactor.
2.1. Numerical Modeling
In a previous study [15], we presented a novel, useful, and simplified mechanism for predicting the blue-LED process: we simplified the complicated chemical mechanism [15] in previous studies through rate of production (ROP) analysis. The optimized reaction mechanism model was then employed as the input to a 2D CFD code, enabling the accurate prediction of growth rates for GaN thin film. The results not only furthered GaN research in academia but also extended blue-LED knowledge in industry. The current study, an extension of the aforementioned study, develops a verification procedure for the numerical modeling of a real epitaxy experiment at the Industrial Technology Research Institute (ITRI), Taiwan.
2.2. Two-Dimensional Analysis
In Fluent (version 14.5) computation, first, the laminar-flow model is used for representing the viscous conditions; second, the species-transfer model is used for concentration diffusion; and third, the finite-rate model is used for chemical reaction. Because the steady-state, pressure-based solver is used in this study, the computational time is the mean time for iteration. Thus, the time discretization in Ansys Fluent (version 14.5) is based on the finite-volume method; by default, it stores discrete values of the scalar at the cell centers; however, face values are required for the convection terms and must be interpolated from the cell center values. This is accomplished using an upwind scheme, where “upwind” means that is derived from quantities in the cell upstream. The spatial discretization for pressure, momentum, all species, and energy is the second-order upwind scheme; when second-order accuracy is desired, quantities at cell faces are computed using a multidimensional linear reconstruction approach. In this approach, high-order accuracy is achieved at the cell faces through a Taylor series expansion of the cell-centered solution about the cell centroid. Thus, when the second-order upwind is selected, is computed as
where and ∇ are the cell-centered value and its gradient in the upstream cell, and is the displacement vector from the upstream cell centroid to the face centroid. This formulation requires the determination of the gradient ∇ in each cell. The second-order upwind is available in pressure- and density-based solvers.
The following five equations are for 2D computation in Fluent (version 14.5), including the final calculation of the obtained growth rate of GaN:
• Continuity equation:
The general integral mass-conservation equation in differential form is
where is the velocity vector.
• Momentum equation of motion:
The general Navier–Stokes equation is
For an incompressible fluid, the left side of this equation is the momentum difference of the system, μ is the viscosity coefficient, and is the body force.
• Energy equation:
This equation involves the total work done by pressure and the work done by the viscous force; k is the thermal conductivity for the fluid, T is temperature, and e is the energy per unit mass for the fluid.
• Species transportation equation:
This conservation equation is expressed as
where R is the net ROP of species by chemical reaction, Y is the local mass fraction of each species, S is the rate of creation by addition from the dispersed phase plus any user-defined sources, and is the diffusion flux of species.
• Laminar finite-rate equation and Arrhenius equation:
The laminar finite-rate equation is written in the general form as
where N is the number of chemical species in the system, is the stoichiometric coefficient for reactant i in reaction r, is the stoichiometric coefficient for product i in reaction r, Mi is a symbol denoting species i, kf,r is the forward rate constant for reaction r, and kb,r is the backward rate constant for reaction r.
The forward rate constant (growth rate) is computed using the Arrhenius expression:
where A is the pre-exponential factor, n is the temperature exponent, Ea is the activation energy for the reaction, and R is the universal gas constant.
2.2.1. Two-Dimensional Numerical Assumptions
The following were assumed for the 2D model: (1) the gas mixture is treated as a continuum; (2) the steady state is considered; (3) the gas behavior is axisymmetric; (4) radiation between the walls is neglected; and (5) incompressible gas behavior is ideal.
2.2.2. Boundary Conditions
The simulations were performed using the commercial CFD code Fluent, which employs the finite-volume method to solve the governing fluid equations of mass, momentum, energy, and species conservation laws in a stationary state. The gas-flow conditions in various MOCVD reactors and their chemical conditions were calculated using Fluent (version 14.5). The boundary conditions for the model are as follows. A no-slip condition was imposed on the reactor wall, and the velocity boundary condition was specified as the velocity at the showerhead or nozzle gas inlet, which was obtained from the given volume flow rate. The temperature and species mole fraction were also specified for the inlet. For the outlet, the outflow boundary condition, which assumes a fully developed flow at the outlet, was applied. For the wall, zero velocity, constant temperature (27 °C), zero species gradient, and zero thermal flux were assumed.
2.3. Development of Numerical Modeling
2.3.1. Experiment Schematic
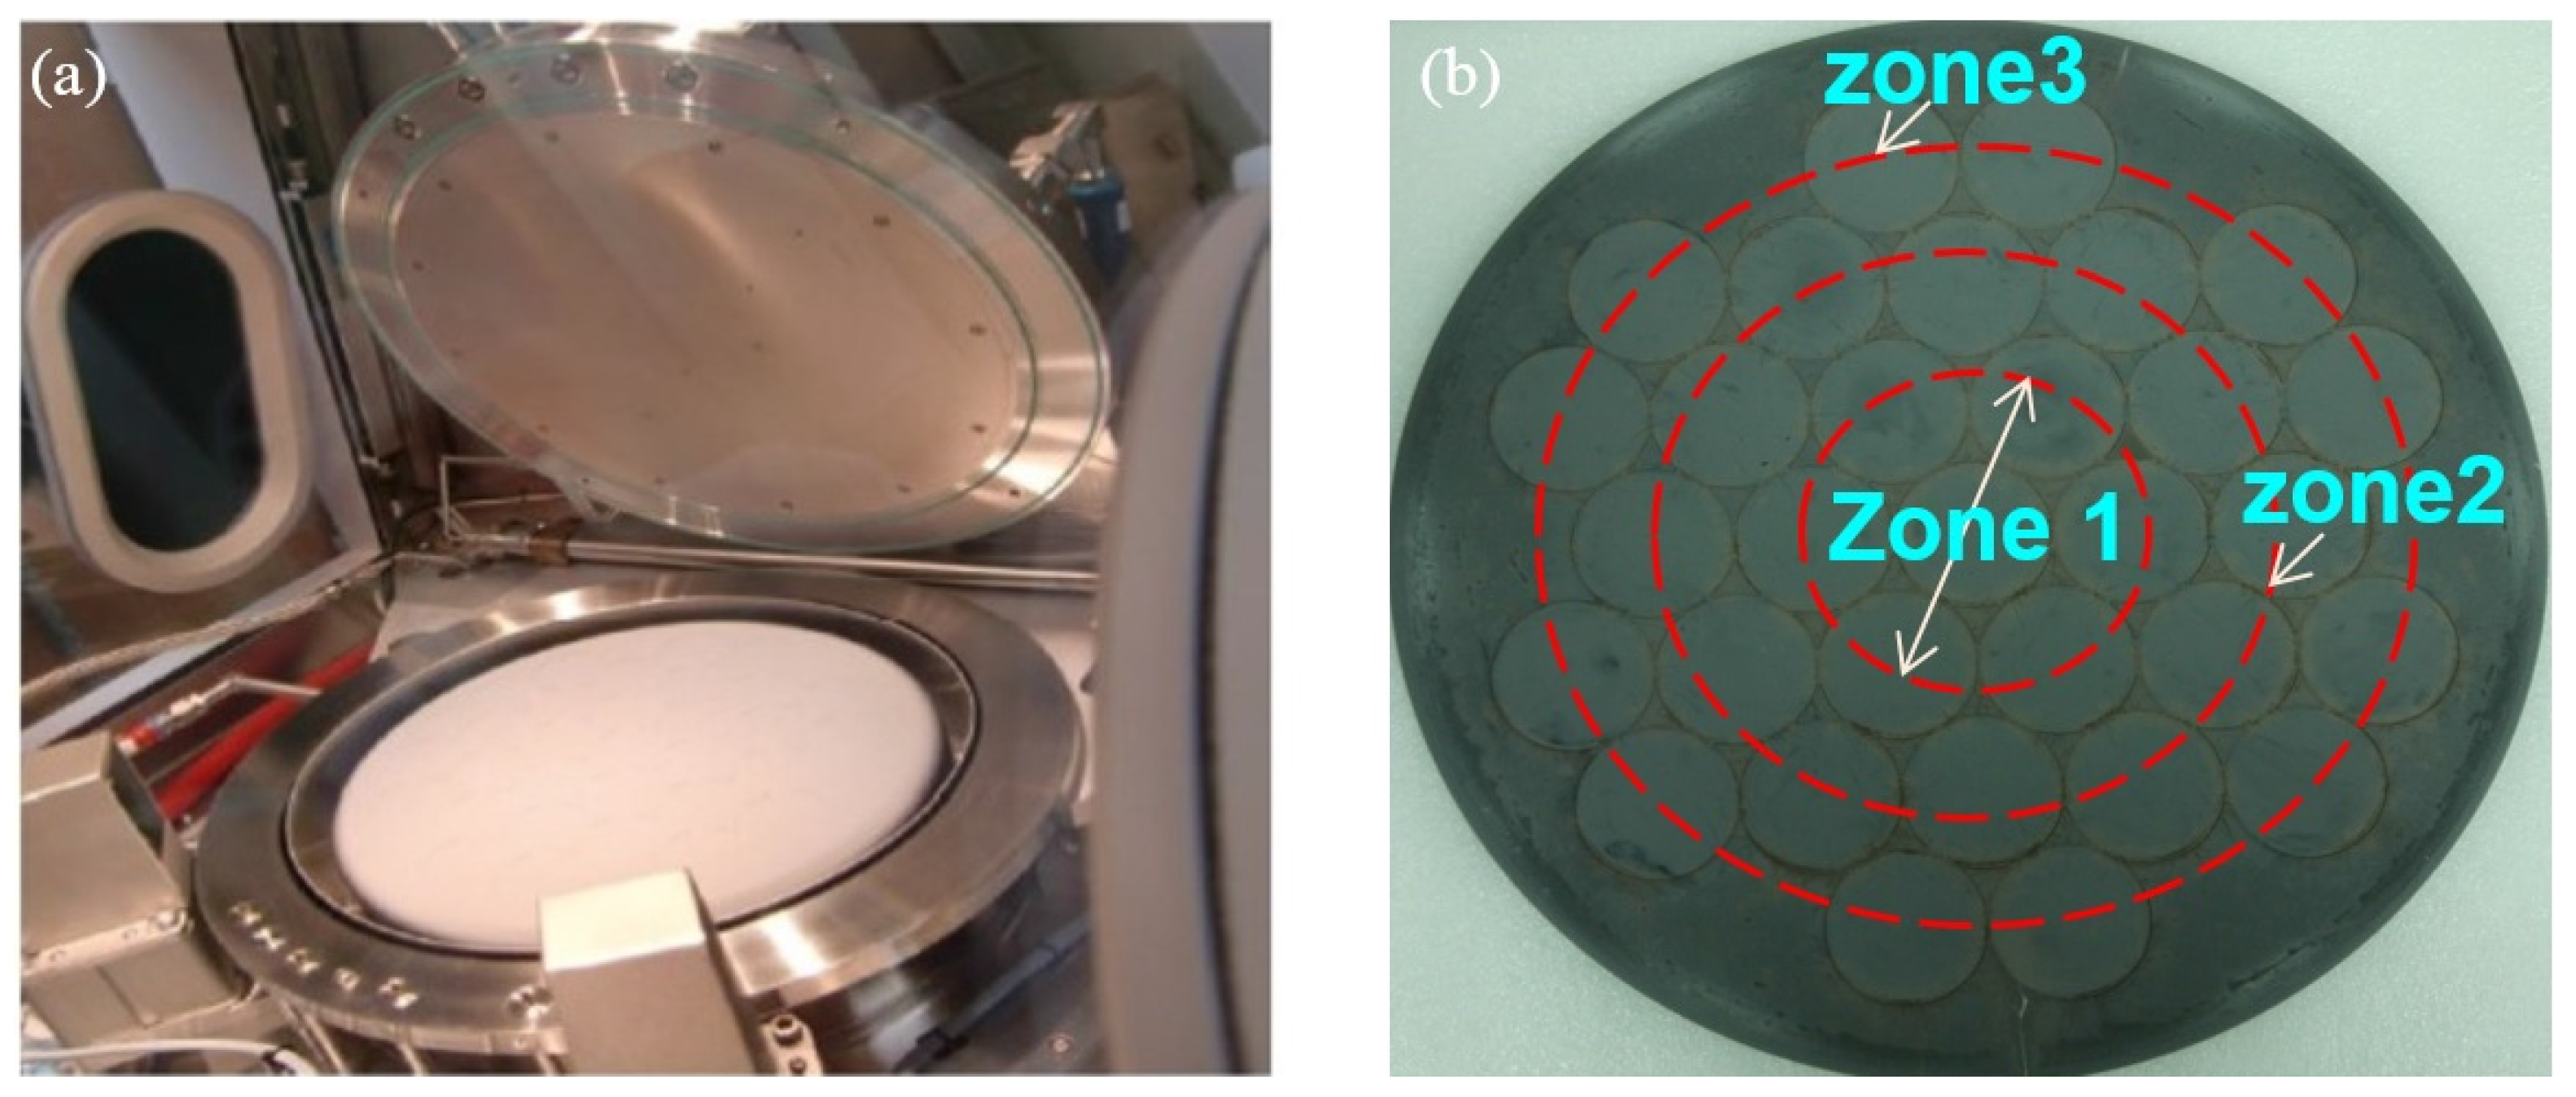
Aixtron Crius I vertical close-spaced MOCVD (Figure 1) is adopted for this research. The total gas inlet areas for species III, V, and H2 are 0.00348, 0.006, and 0.000275 m2, respectively. During the process, the reactant vapors enter the chamber from the top of the showerhead and flow vertically down into the reactor. Upon reaching the surface of the susceptor, the reactant vapor flow turns 90° and flows radially outward atop the susceptor and finally exhausts to the outlet.
The susceptor is divided into three zones: zone 1 (inner zone), zone 2 (middle zone), and zone 3 (outer zone) (Figure 1b). The verification procedure is initiated by introducing a set of epitaxy experiments (Table 1), wherein the target wafer is placed in zone 3, which has the maximum temperature drop near the reactor wall. If the GaN layer on the wafer in zone 3 is highly smooth and uniform, it indicates that the layer is also smooth and uniform in zones 1 and 2.
As listed in Table 1, the average growth thickness is measured at susceptor temperatures of 1238 °C and 1188 °C and a constant wall temperature of 27 °C. The pressure is varied from 100 to 300 torr. The rotation rate and process time are maintained at 60 rpm and 180 min (3 h), respectively. The mass flow rate for each species is as listed in the table.
2.3.2. Schematic of the Numerical Modeling
Figure 2 shows a schematic of the Aixtron Crius I MOCVD reactor and its numerical mesh diagram. The tubes for species III and V are placed in a staggered manner in gas inlet III/V zone and that for H2 is placed in the outer-ring in the gas inlet zone. For an accurate solution, mesh number 93189 (skewness: 0.6326) is selected, and the structure mesh is implemented using Ansys mesh. A typical method of characterizing flow stability in MOCVD reactors is the use of dimensionless numbers obtained using the Navier–Stokes equations for incompressible flow. The Grashof number characterizes the significance of natural convection in the reactor. Moreover, the flow-stability criteria can be defined using some critical values of the dimensionless groups that represent the ratio of the relative strengths of the different forces in the reactor [15]. The usual phenomena in a MOCVD reactor are force convection, force convection (rotation), and natural convection [6], all of which exert interactive effects during epitaxy processing. If the gas flow rate in (or rotation speed of) the reactor is high, the force convection effect increases. The magnitude of the Grashof number is proportional to the characteristic length (i.e., the space between the gas inlet and the susceptor) and pressure. Because the reactor is close-spaced, the space between the gas inlet and susceptor is 11 mm. Thus, the pressure effect is very weak (i.e., natural convection).
3. Results and Discussion
3.1. Approximate Approach of the Real Showerhead
In a real MOCVD process, to obtain uniform thin films, the gas inlet tube in the showerhead is staggered layer by layer to ensure adequate mixing of the reactant flow over the susceptor. However, calculating the chemical reaction, including the mixing phenomena, using a standard computer is difficult. Therefore, in this section, an approach is introduced to approximate the real showerhead.
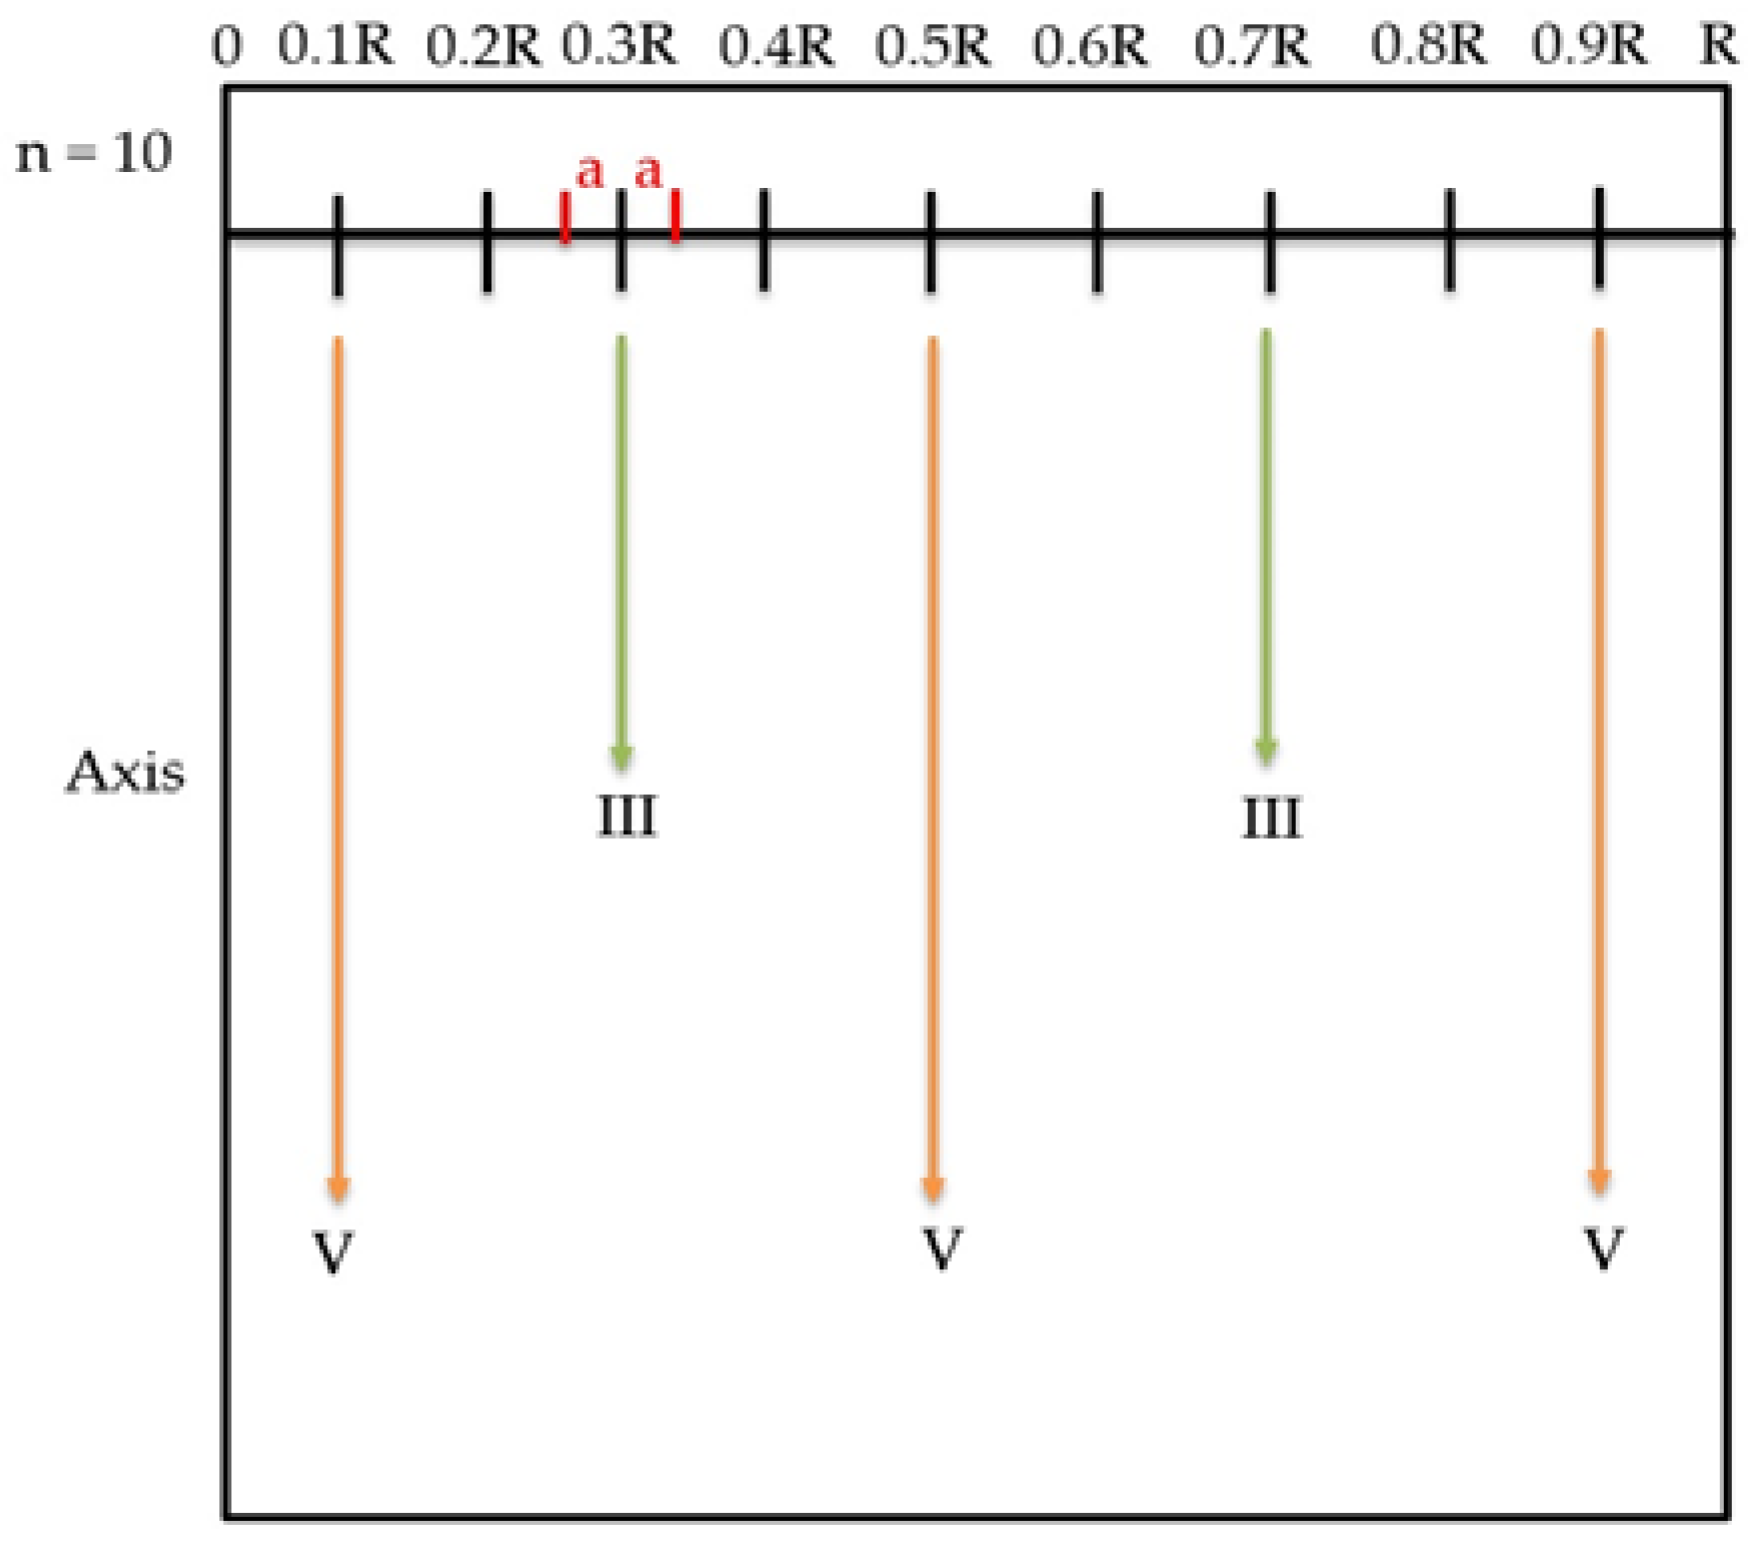
Figure 3 is an axisymmetric reactor diagram for the proposed approximate approach. For example, the hypothetical radius R is divided into 10 parts, the length of each part is 0.1R. Moreover, a new parameter n is introduced to illustrate the summation of each number of each part. Then, we defined the tubes for species V are located at 0.1R, 0.5R, and 0.9R, whereas those for species III are at 0.3R and 0.7R. “a” is the hypothetical radius of each tube. The example computation is as follows:
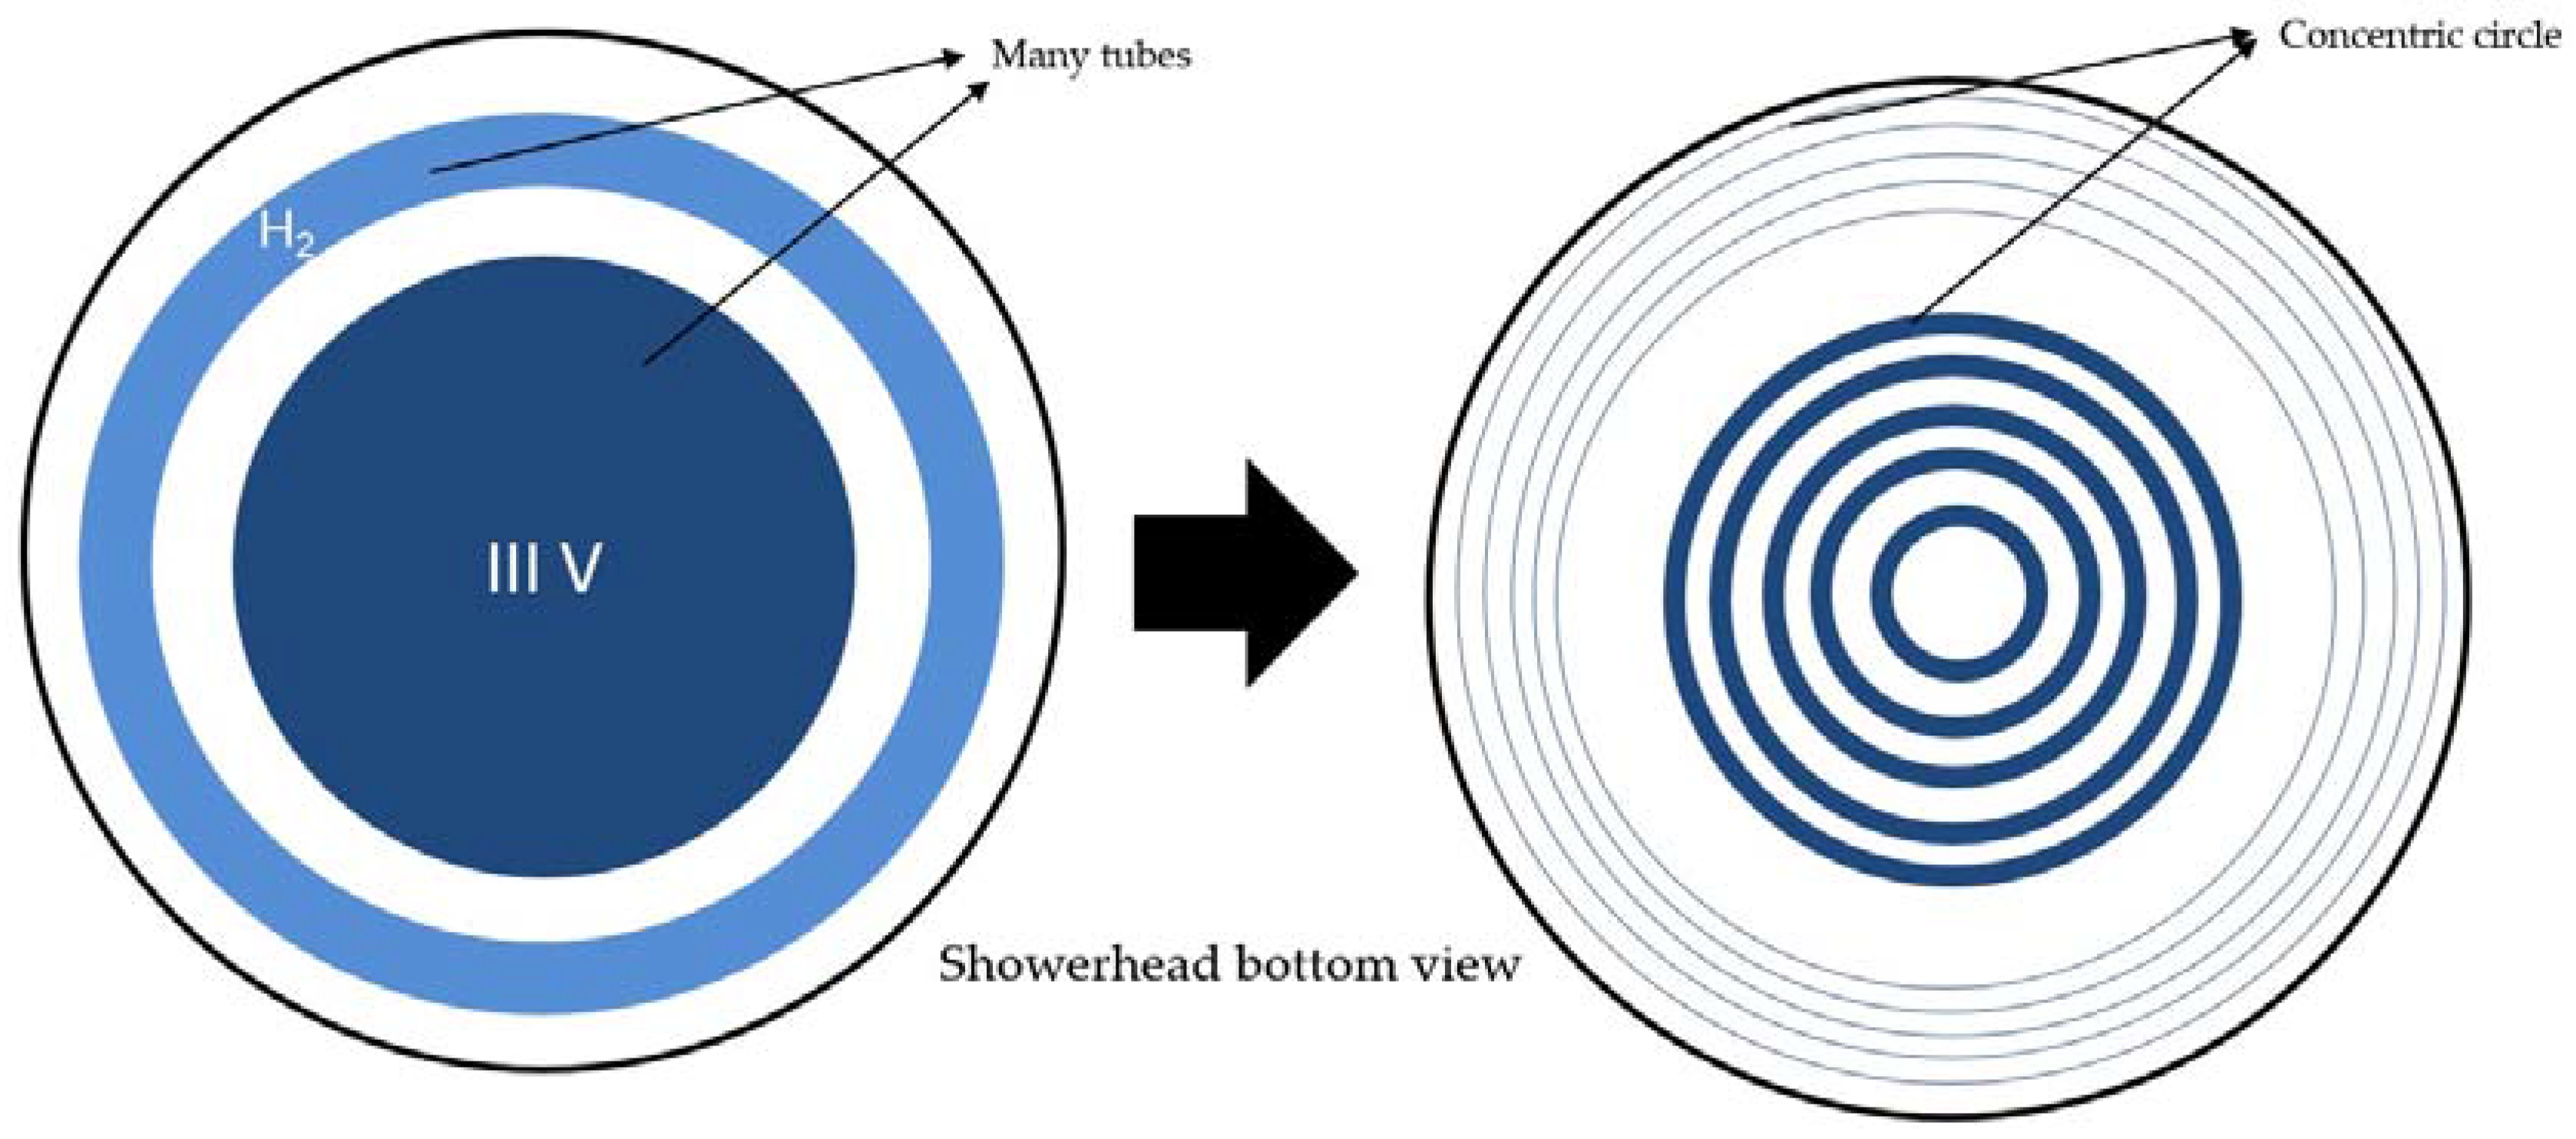
For a given total gas inlet area, these two equations yield the hypothetical radius a. Then, because the volume flow rate is known, the velocity for each species can be obtained by dividing the volume flow rate by the gas inlet area. Because this reactor is axisymmetric, these equations can be used to simulate the real showerhead inlet as a concentric gas inlet. To this end, we must rearrange each tube in the original showerhead as a concentric ring. Figure 4 is the Illustration of the showerhead and its concentric-ring equivalent of this concept.
Then, we change the value of n to see the variation of the result, the best result will be elected to the further numerical modeling. Figure 5 presents the predicted growth rates for different values of n for wafer 1 according to the parameters listed in Table 1. Moreover, because there are so many “diameters” in a circle, so we use the word “wafer length” to elaborate the only wafer diameter from the center of the susceptor in x axis. Clearly, as the value of n increases, the results become smoother and more uniform. However, because this method simulates gas inlets as concentric rings, too many reactants reach the wafer surface; thus, although thin-film uniformity is high, the growth rate is too high in this method. Although the tube type showerhead usually has the highest uniformity and is sufficiently accurate, the 3D computational requirements are extremely high, and the calculations require several days using a standard computer. Therefore, parallel computing may be the most effective means for solving this problem; however, this approach is cost-intensive. Hence, by using the proposed transfer method, which is a 2D computation problem, the concentric rings can be designed to model the growth line along the experimental wafer.
3.2. Verification of Two-Dimensional Numerical Modeling
In this section, the most uniform result (n = 160) is chosen for verification, and the simplified reaction mechanism [15] model is employed as the input to the 2D CFD code for predicting the growth rates for GaN thin films. The input parameters, listed in Table 1, are the practical application parameters used at ITRI for growing µ-GaN (undoped GaN thin films). The other boundary conditions for 2D computation are as listed in the previous section. First, the growth rate predicted in Figure 5 is too large for the epitaxy process; therefore, it is reasonable to adjust the reaction rate constant for GaN growth, as shown in Table 2, where A is the pre-exponential factor, n is the temperature exponent, Ea is the activation energy.
Through trial and error, we found that the order of the numerical result is more accurate than the experimental result when A and n equal 3.68× 10⁶ and 0.72, respectively. Moreover, Ea (activation energy) remains the same, because the reaction rate is highly sensitive to temperature. However, obtaining an accurate result by adjusting the activation energy is difficult.
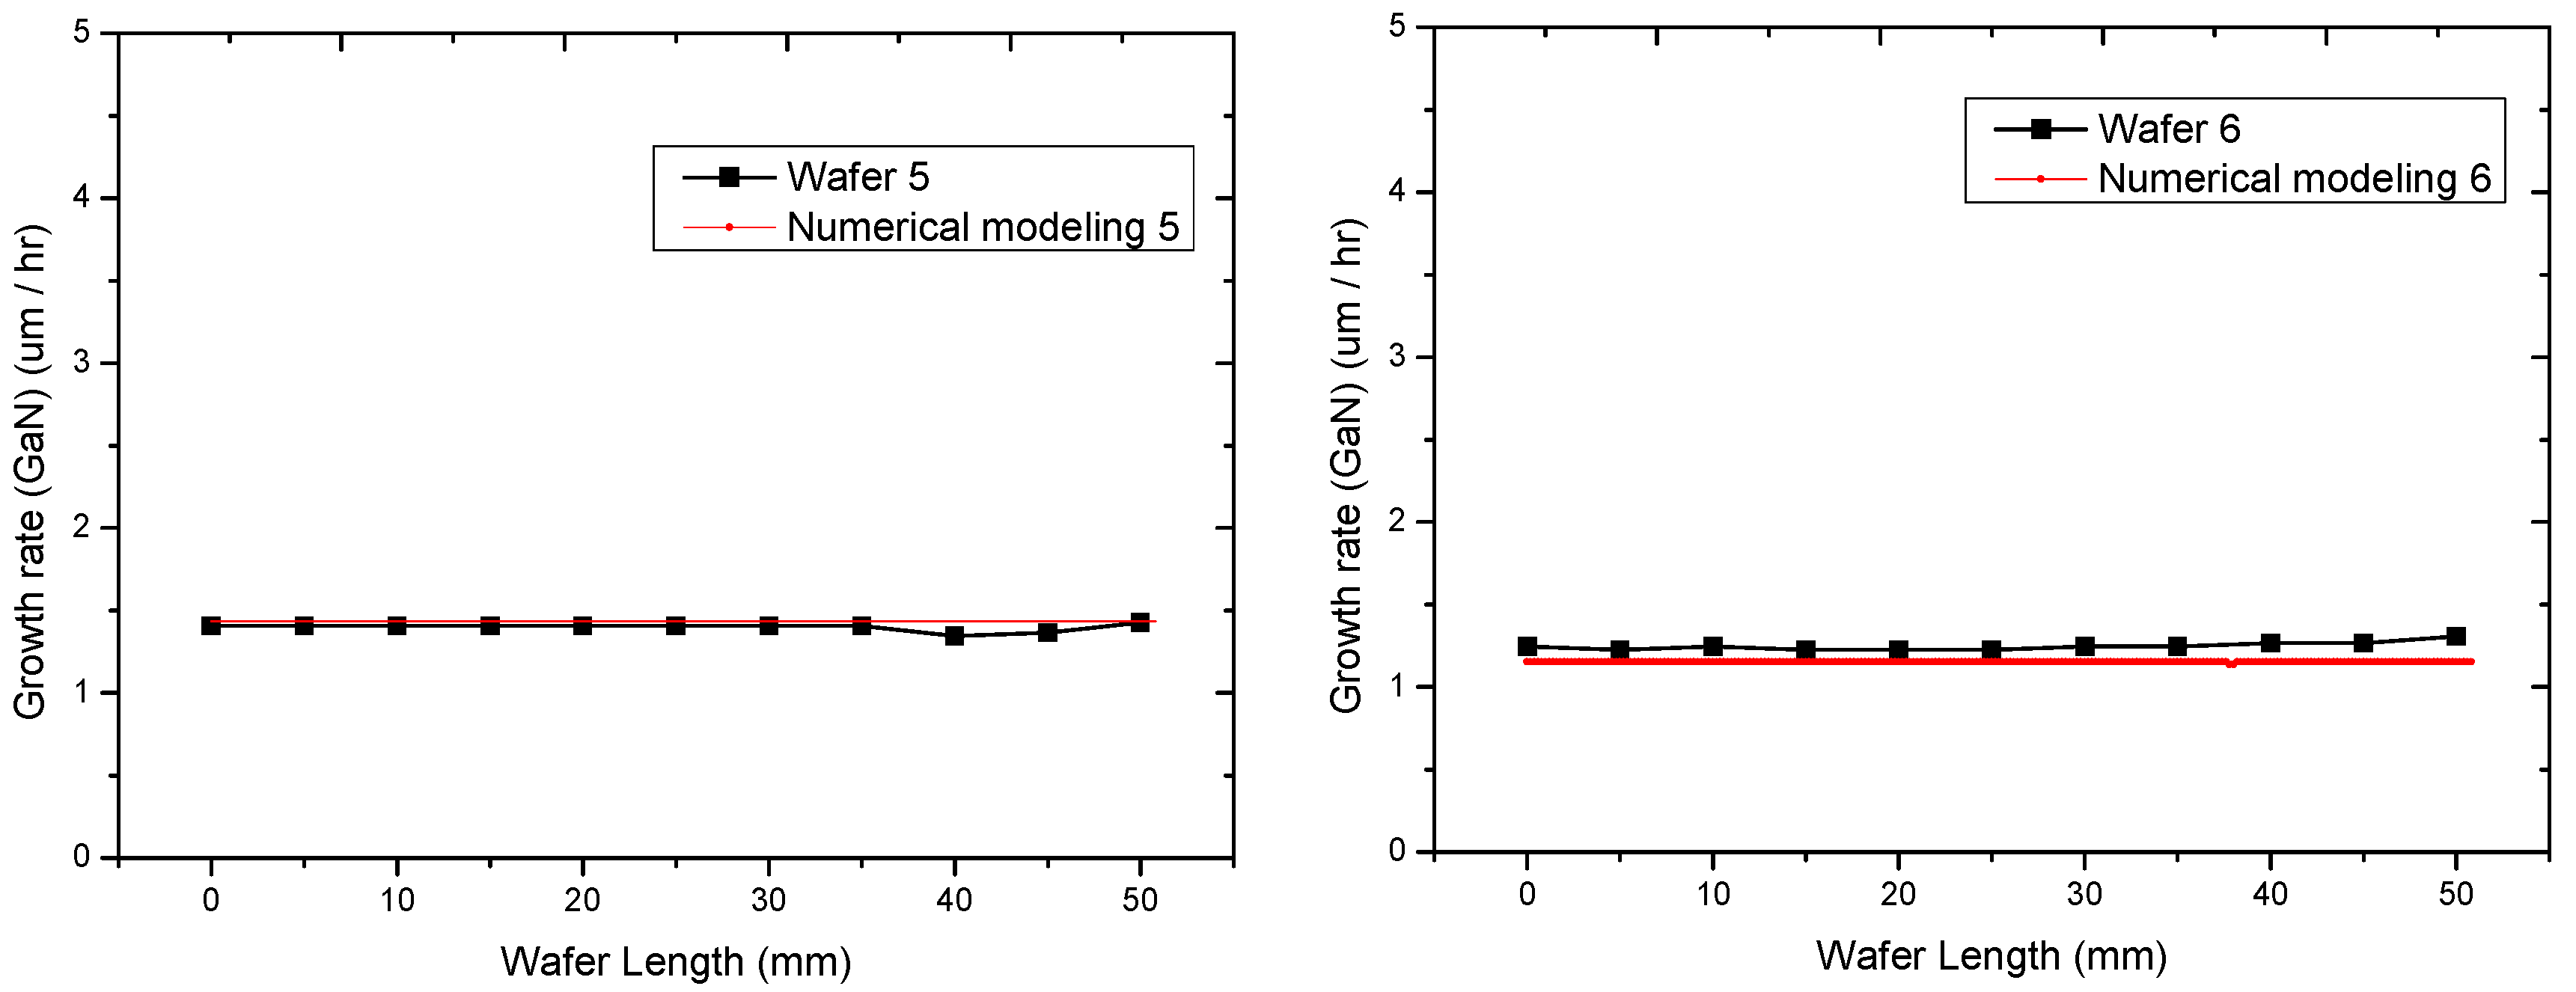
The predicted growth rates and the experimental results are plotted in Figure 6, Figure 7 and Figure 8. Evidently, the predicted growth rates agree well with the experimental data. In Figure 6, the temperature difference is very small; hence, the growth rate appears to be a constant. The volume flow rate (as inlet velocity) is used as the gas inlet boundary condition. The working gases are all assumed to be ideal, so P ∝ ρ2 in the natural convection mechanism, where ρ is the gas density. Natural convection is a natural phenomenon caused by thermal expansion, and the characteristic length dominates the physical field if the inertial force effect is weak. Because the characteristic length is very small in a close-spaced MOCVD reactor, the natural convection effect is almost negligible; in other words, a high susceptor rotation rate is unnecessary (60 rpm would suffice). However, because the wafer is located on the outer zone, a large temperature drop usually occurs due to high flow velocity on the susceptor edge. Hence, the pressure and rotation effect are relatively significant on the outer zone. This may explain the decrease in the growth rate of wafer 3. Correspondingly, the inlet flow rate drops from wafer 4 to wafer 6 because of the flow rate of species III. In sum, in a close-spaced reactor, considering natural convection is important for process control. This study focused on obtaining a quick solution for mass-transport temperature. The experimental results had some fluctuations when the wafer length exceeded 30 mm, which might be because of heating non-uniformity in the three zones or boundary-layer diffusion.
In addition, the mechanism we import to Fluent (version 14.5) is the most simplified one (New model), the temperature in blue-LED is our target temperature, this study focuses on how to get a quick reference answer in mass transport-limited growth. In the low temperature zone, the adduct reaction is deleted by our view [15], so in a low temperature zone, the prediction result may not quite correspond to the real experiment, which is a limitation of this study. But this is not of concern, because we were aiming for a quick solution at high temperature and mass transport-limited zone (around 1050 °C). Few adducts exist in such high-temperature areas. Therefore, we think the accuracy and repeatability of the experiments are reliable in this study.
The new information from this study and the previous study [15] provides a usefully simplified mechanism for predicting the blue-LED process which had not been developed in previous literature, and the accuracy is reliable for 0-D and 2-D numerical modeling. The mechanism can provide not only for academic investigation of the GaN mechanism, but also for R&D study of the blue-LED in industry. The work and concept in this study is introduced to a human-machine interface, and the connection between academics and industry is our new perspective. Since we have a cooperation with Taiwan’s Industrial Technology Research Institute (ITRI), we will export this concept and database into ITRI (Taiwan)’s human-machine interface; before the R&D researchers start their experiment, they can run a quick numerical computation in the interface, to see the result is bad or good. Reducing gas consumption is our hope in practical systems.
4. Conclusions
This study is an extension of our earlier work [15]. A numerical verification method for the growth of gallium nitride thin films in a large MOCVD reactor was demonstrated. The results showed that real operating parameters (susceptor temperature: 1188 °C or 1238 °C; pressure: 100–300 torr) affect thin-film uniformity. After some geometrical transformation, the predicted growth rates correspond reasonably well with the experimental data. The mechanism to be imported to Fluent (version 14.5) is the most simplified [15], and blue-LED temperature is the target temperature. This most simplified chemical mechanism can be used to predict the growth rate of a blue-LED process before the actual process begins, both in R&D and in industry. Thus, the proposed verification mechanism can save gas consumption. In the future, to verify the adaptability of our mechanism for practical applications, the proposed mechanism will be implemented in a human–machine interface. Overall, the proposed mechanism is of use not only in GaN research in academia but also for the early development studies of the blue-LED process.
Acknowledgments
This study was supported by the Department of Mechanical Engineering, National Central University, Taiwan; the Industrial Technology Research Institute, Taiwan; and Chung Yuan Christian University. We acknowledge Wallace Academic Editing for editing this manuscript.
Author Contributions
Chih-Kai Hu, Chun-Jung Chen, Ta-Chin Wei, and Tomi T. Li conceived and designed the experiments; Chih-Kai Hu performed the experiments; Chih-Kai Hu and Tomi T. Li analyzed the data; Chih-Yung Huang, Chu-Li Chao, and Yi-Jiun Lin contributed materials and analysis tools; and Chih-Kai Hu and Tomi T. Li wrote the paper.
Conflicts of Interest
The authors declare no conflict of interest.
References
- Evans, G.H.; Greif, R. A Numerical Model of the Flow and Heat Transfer in a Rotating Disk Chemical Vapor Deposition Reactor. J. Heat Transfer 1987, 109, 928–935. [Google Scholar] [CrossRef]
- Thompson, A.G.; Stall, R.A.; Zawadzki, P.; Evans, G.H. The scaling of CVD rotating disk reactors to large sizes and comparison with theory. J. Electron. Mater. 1996, 25, 1487–1494. [Google Scholar] [CrossRef]
- Fotiadis, D.I.; Kieda, S.; Jensen, J.F. Transport phenomena in vertical reactors for metalorganic vapor phase epitaxy. J. Cryst. Growth 1990, 102, 441–470. [Google Scholar] [CrossRef]
- Zuo, R.; Zhang, H.; Liu, X.L. Transport phenomena in radial flow MOCVD reactor with three concentric vertical inlets. J. Cryst. Growth 2006, 293, 498–508. [Google Scholar] [CrossRef]
- Soong, C.Y.; Chyuan, C.H.; Tzong, R.Y. Thermo-Flow Structure and Epitaxial Uniformity in Large-Scale Metalorganic Chemical Vapor Deposition Reactors with Rotating Susceptor and Inlet Flow Control. J. Appl. Phys. 1998, 37, 5823–5834. [Google Scholar] [CrossRef]
- Mitrovic, B.; Gurary, A.; Kadinski, L. On the flow stability in vertical rotating disc MOCVD reactos under a wide range of process parameters. J. Cryst. Growth 2006, 287, 656–663. [Google Scholar] [CrossRef]
- Mitrovic, B.; Gurary, A.; Quinn, W. Process conditions optimization for the maximum deposition rate and uniformity in vertical rotating disc MOCVD reactors based on CFD modeling. J. Cryst. Growth 2007, 303, 323–329. [Google Scholar] [CrossRef]
- Talalaev, R.A.; Yakovlev, E.V.; Karpov, S.Y.; Makarov, Y.N. On low temperature kinetic effects in metal–organic vapor phase epitaxy of III–V compounds. J. Cryst. Growth 2001, 230, 232–238. [Google Scholar] [CrossRef]
- Karpov, S.Y.; Prokofyev, V.G.; Yakovlev, E.V.; Talalaev, R.A.; Makarov, Y.N. Novel approach to simulation of group-III nitrides growth by MOVPE. MRS J. Nitride Semicond. Res. 1999, 4, e4. [Google Scholar] [CrossRef]
- Yakovlev, E.V.; Shpolyanskiy, Y.A.; Talalaev, R.A.; Karpov, S.Y.; Makarov, Y.N.; Bergunde, T.; Lowry, S.A. Detailed Modeling of Metal Origanic Vapor Phase Epitaxy of III-V Ternary Compounds in Production-Scale AIX 2400G3 Planetary Reactor. In Fundamental Gas-Phase and Surface Chemistry of Vapor Deposition II and Process Control, Diagnostics and Modeling in Semiconductor Manufacturing IV: Proceedings of the Internatioal Symposium; Swihart, M.T., Allendorf, M.D., Meyyappan, M., Eds.; The Electrochemical Society: Atlantic, NJ, USA, 2001; Volume 2001–2013, pp. 292–300. [Google Scholar]
- Crose, M.; Kwon, J.S.; Tran, A.; Christofides, P.D. Multiscale modeling and run-to-run control of PECVD of thin film solar cells. Renew. Energy 2017, 100, 129–140. [Google Scholar] [CrossRef]
- Crose, M.; Tran, A.; Christofides, P.D. Multiscale Computational Fluid Dynamics: Methodology and Application to PECVD of Thin Film Solar Cells. Coatings 2017, 7, 22. [Google Scholar] [CrossRef]
- Hu, C.K.; Chien, H.I.; Li, T.T. Numerical analysis for the growth of epitaxy layer in a large-size MOCVD reactor. Key Eng. Mater. 2015, 656, 515–519. [Google Scholar] [CrossRef]
- Hu, C.K.; Li, T.T.; Lin, Y. The optimization of thermal flow field in a large-size MOCVD reactor. ECS Trans. 2013, 52, 1021–1026. [Google Scholar] [CrossRef]
- Hu, C.K.; Chen, C.J.; Wei, T.C.; Li, T.T.; Wang, C.C.; Huang, C.Y. Investigation of a Simplified Mechanism Model for Prediction of Gallium Nitride Thin Film Growth through Numerical Analysis. Coatings 2017, 7, 43. [Google Scholar] [CrossRef]
Figure 1.
(a) Aixtron Crius I vertical close-spaced MOCVD reactor (ITRI, Taiwan); (b) Top view of the susceptor in the reactor.
Figure 1.
(a) Aixtron Crius I vertical close-spaced MOCVD reactor (ITRI, Taiwan); (b) Top view of the susceptor in the reactor.

Figure 2.
Schematic of (a) Aixtron Crius I MOCVD reactor and (b) its mesh.
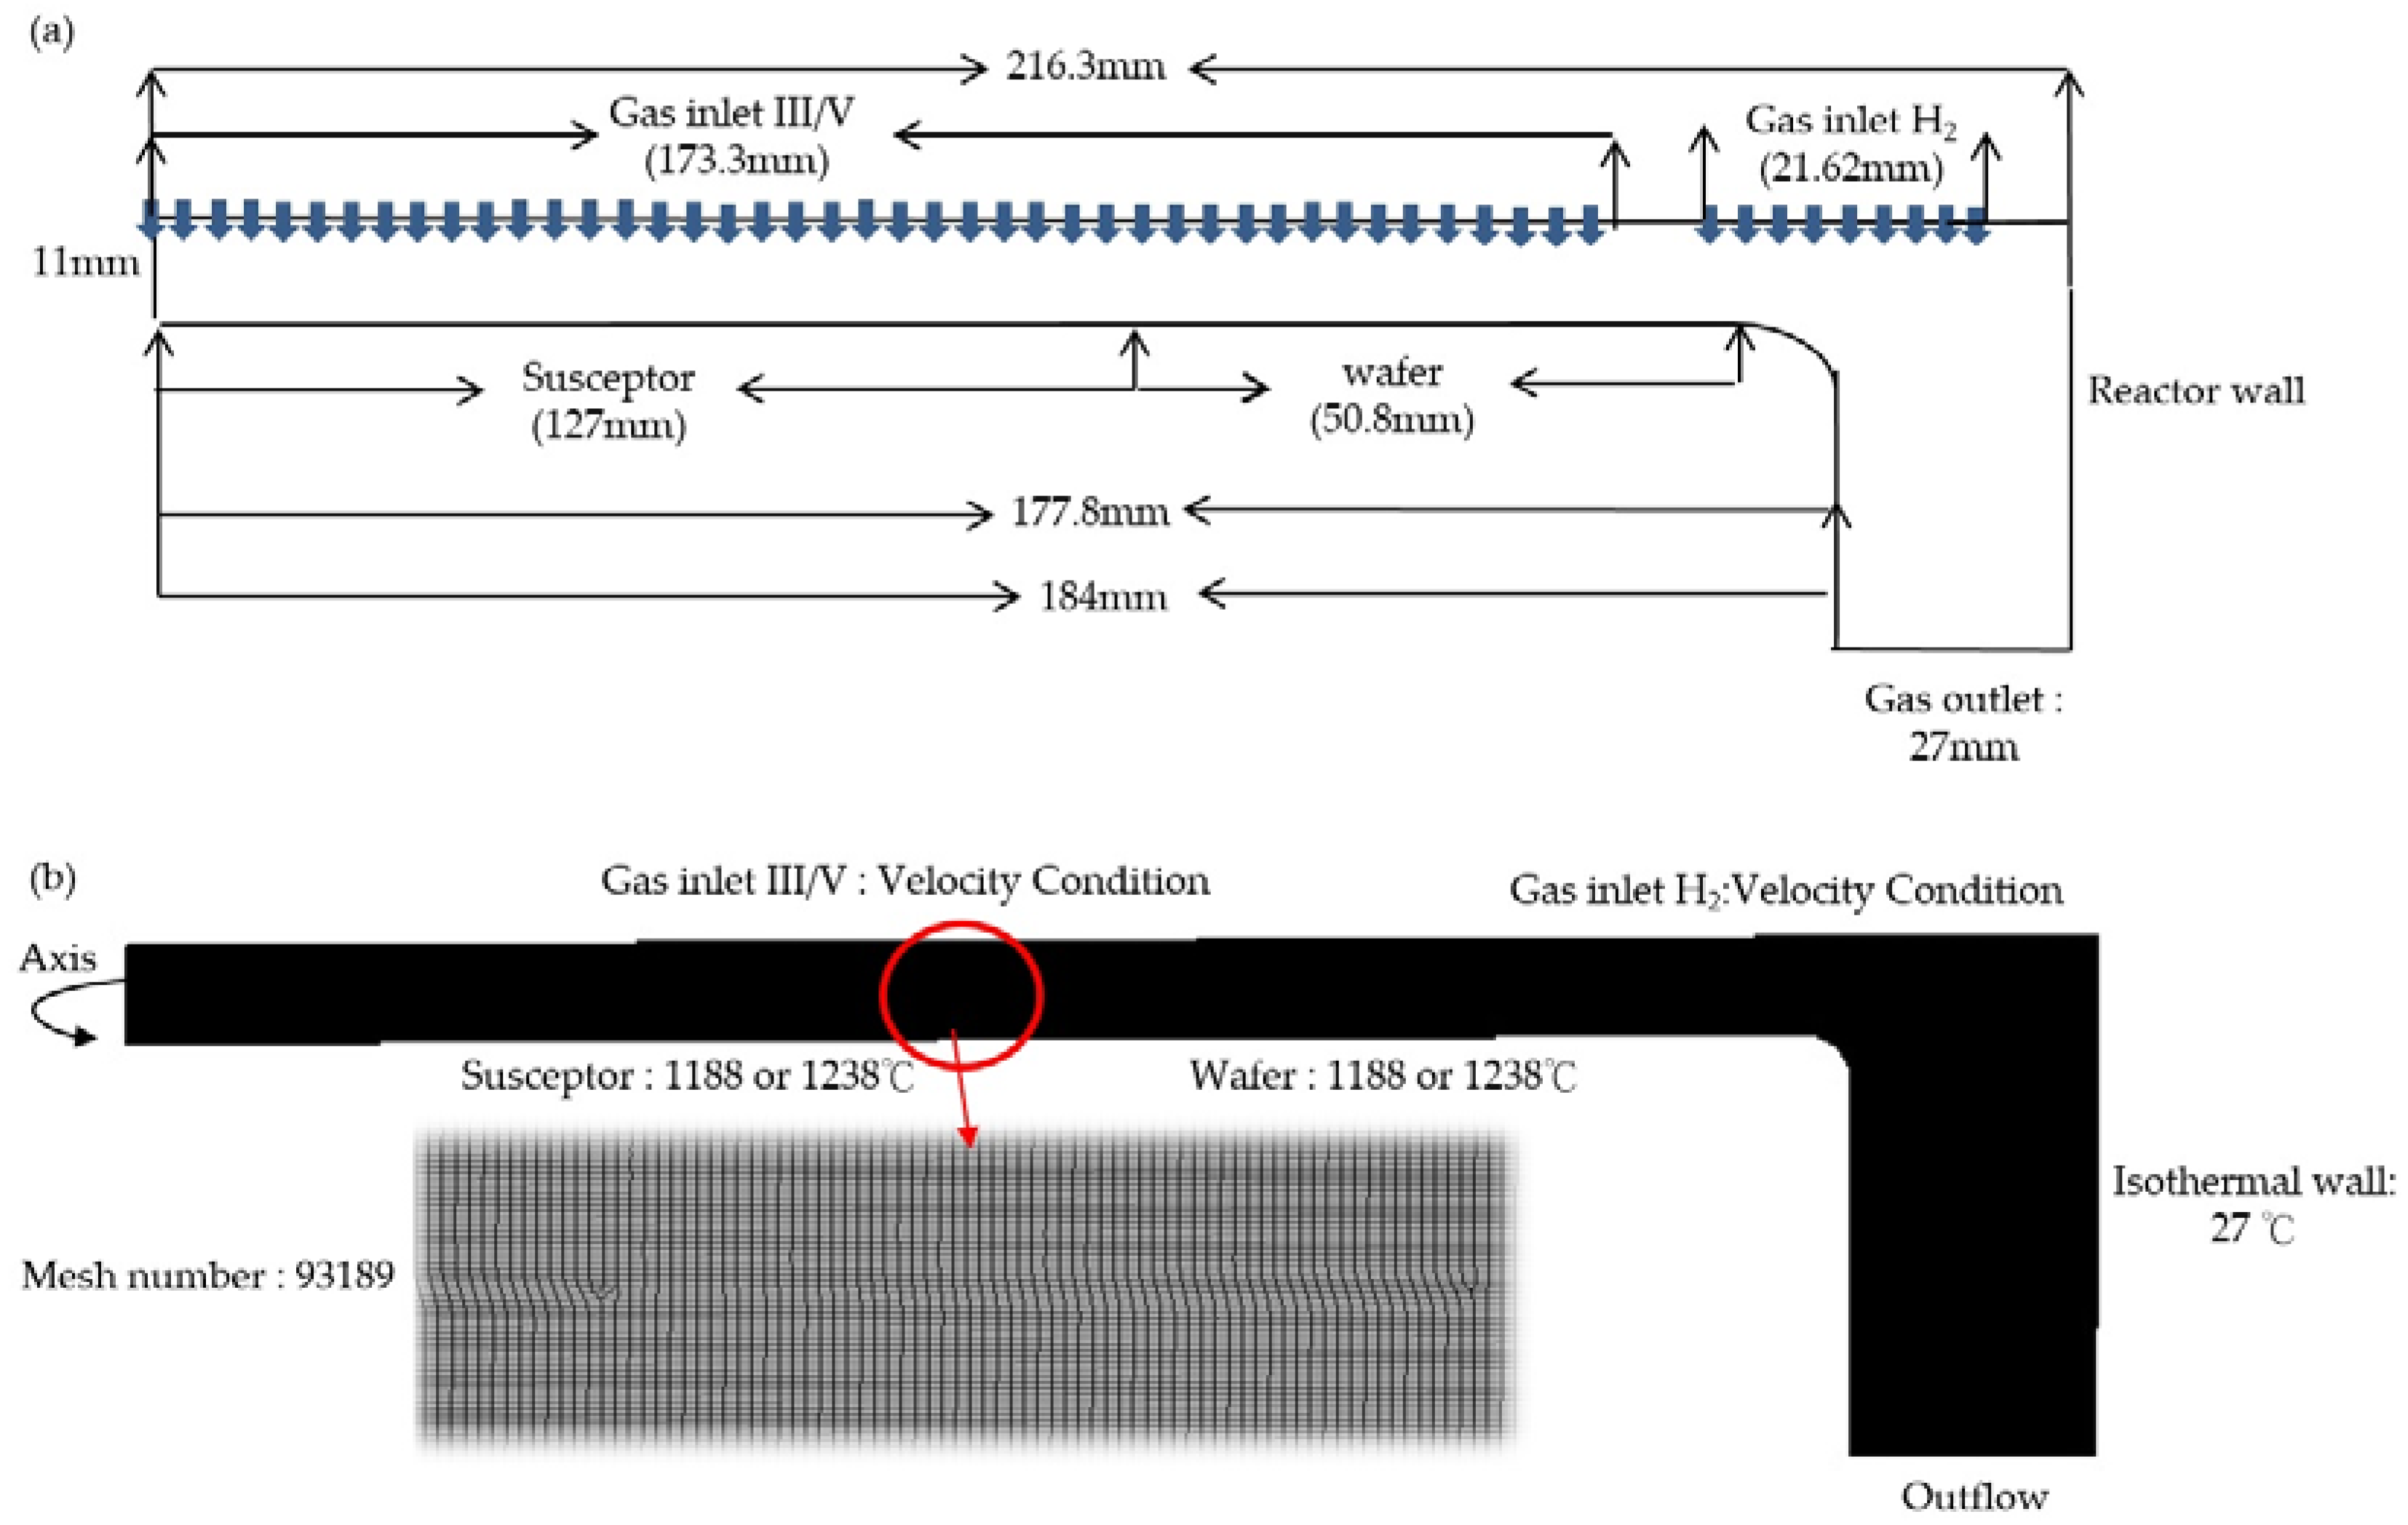
Figure 3.
Schematic reactor diagram for the approximate approach.

Figure 4.
Illustration of the showerhead and its concentric-ring equivalent.

Figure 5.
Predicted growth rate for each n.
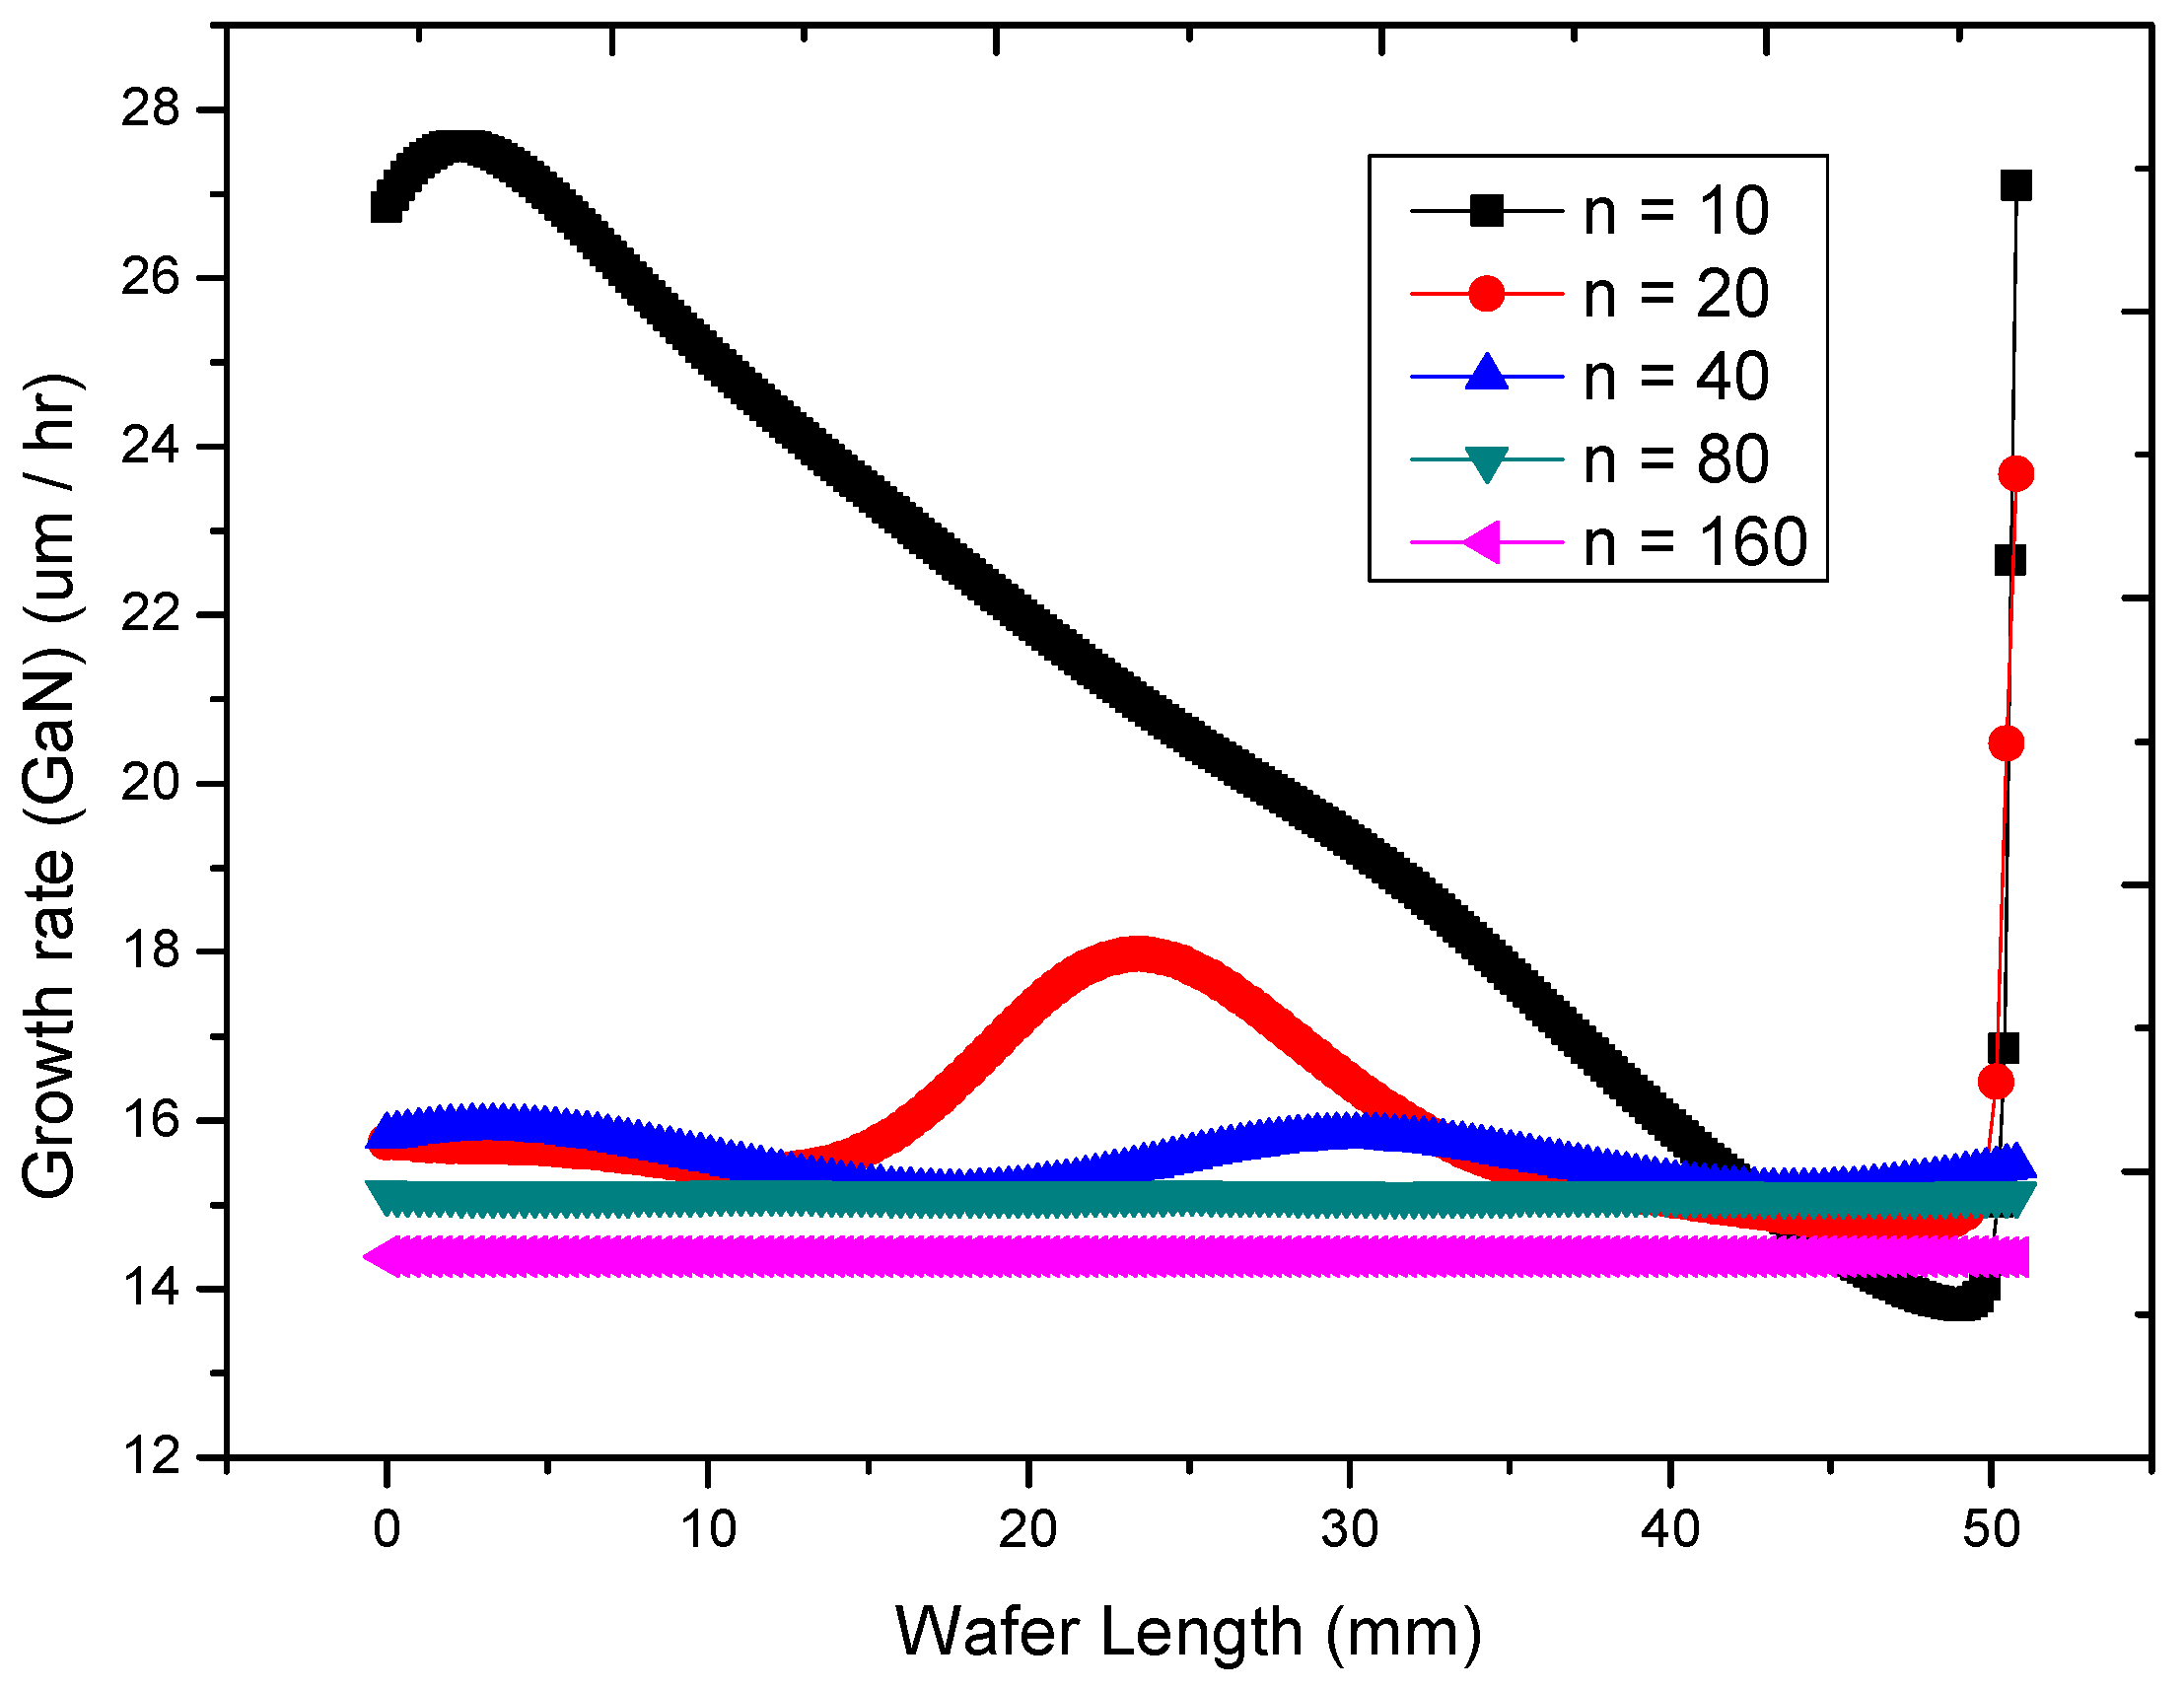
Figure 6.
Predicted growth rate for wafers 1 and 2 vs. experimental results.
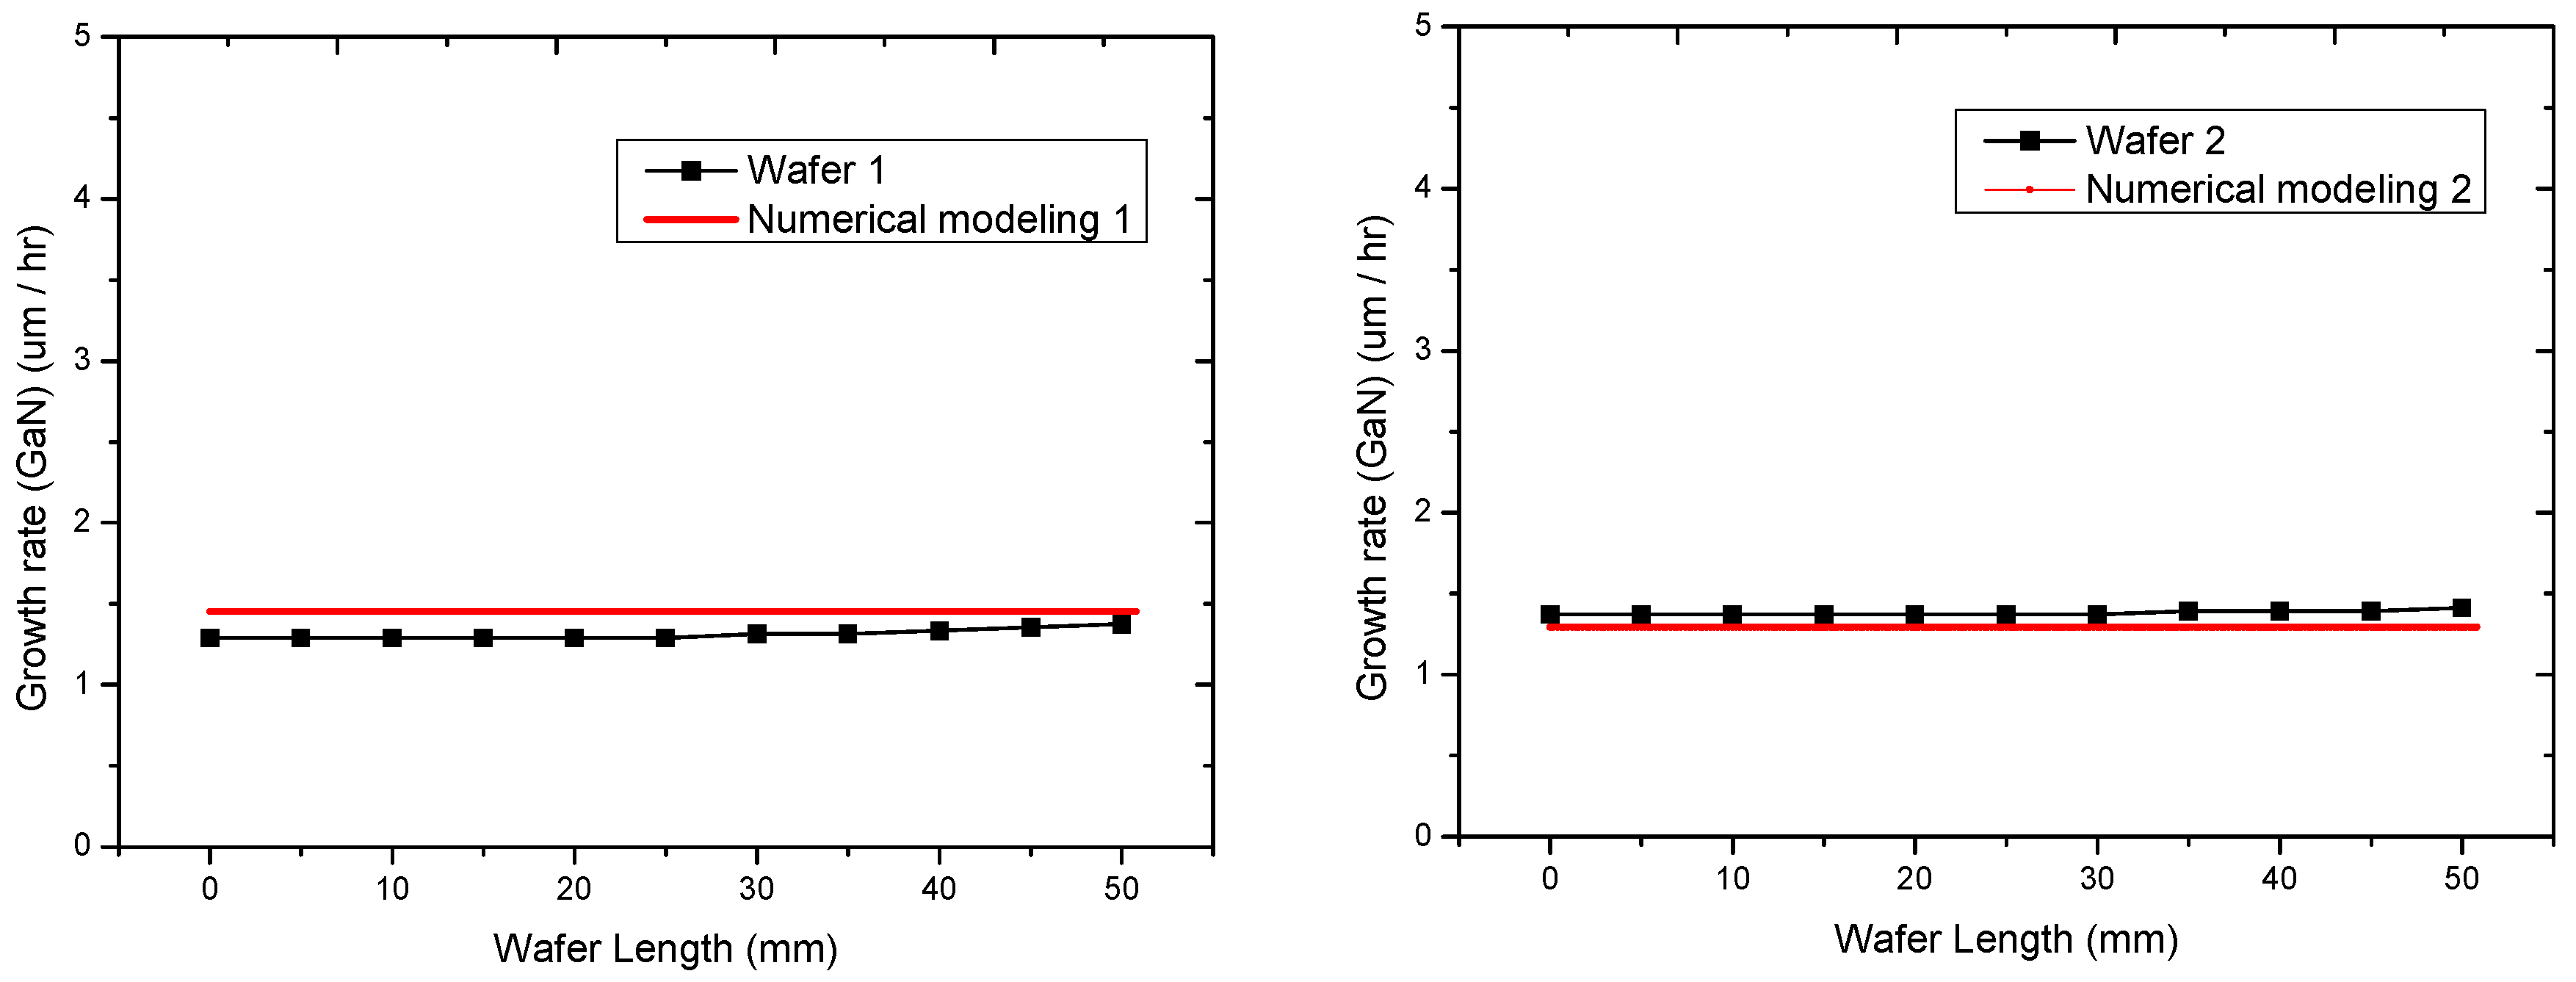
Figure 7.
Predicted growth rate for wafers 3 and 4 vs. experimental results.
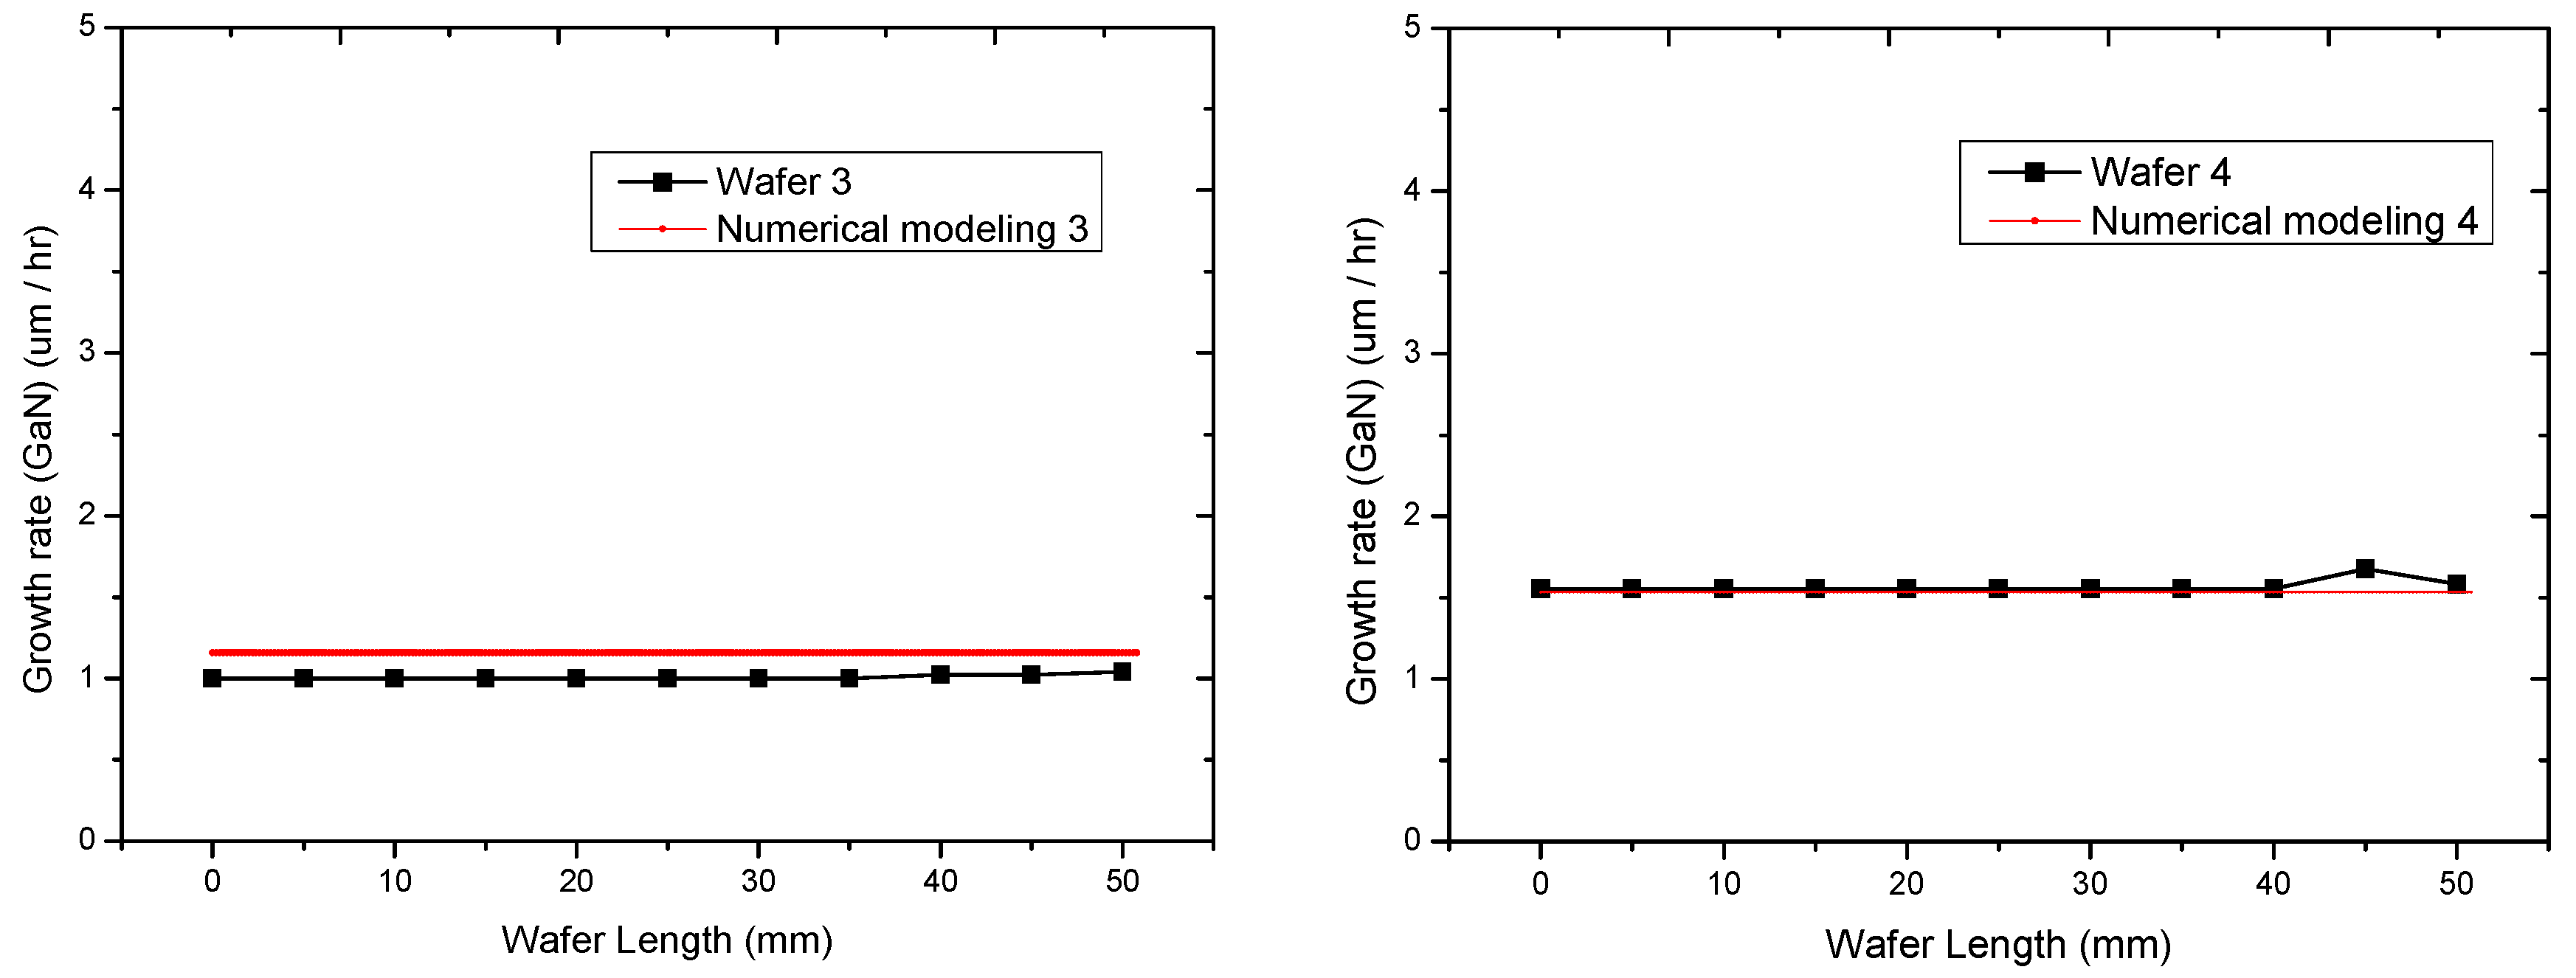
Figure 8.
Predicted growth rates for wafers 5 and 6 vs. experimental results.


Table 1.
Parameters of the epitaxy experiment set.
| Wafer Code | 1 | 2 | 3 | 4 | 5 | 6 |
|---|---|---|---|---|---|---|
| Parameter | ||||||
| Temperature (°C): Susceptor | 1238 | 1188 | 1188 | 1188 | 1188 | 1188 |
| Temperature (°C): Wall | 27 | 27 | 27 | 27 | 27 | 27 |
| Pressure (mbar) | 267 | 267 | 400 | 133 | 133 | 133 |
| Pressure (torr) | 200 | 200 | 300 | 100 | 100 | 100 |
| TMGa (sccm) | 220 | 220 | 220 | 220 | 165 | 150 |
| NH3 (sccm) | 20,000 | 20,000 | 20,000 | 20,000 | 20,000 | 20,000 |
| H2 (sccm) | 2500 | 2500 | 2500 | 2500 | 2500 | 2500 |
| Rotation rate (rpm) | 60 | 60 | 60 | 60 | 60 | 60 |
| Process time (min) | 180 | 180 | 180 | 180 | 180 | 180 |
| Average Thickness (um) | 4 | 4.2 | 3.15 | 4.8 | 4.16 | 3.8 |
Table 2.
Original K and modified K.
| Parameter | A | n |
|---|---|---|
| Origin K | 3.68 × 10⁹ | 2.05 |
| Modified K | 3.68× 10⁶ | 0.72 |
© 2017 by the authors. Licensee MDPI, Basel, Switzerland. This article is an open access article distributed under the terms and conditions of the Creative Commons Attribution (CC BY) license (http://creativecommons.org/licenses/by/4.0/).
Share and Cite
MDPI and ACS Style
Hu, C.-K.; Chen, C.-J.; Wei, T.-C.; Li, T.T.; Huang, C.-Y.; Chao, C.-L.; Lin, Y.-J. Numerical Verification of Gallium Nitride Thin-Film Growth in a Large MOCVD Reactor. Coatings 2017, 7, 112. https://doi.org/10.3390/coatings7080112
AMA Style
Hu C-K, Chen C-J, Wei T-C, Li TT, Huang C-Y, Chao C-L, Lin Y-J. Numerical Verification of Gallium Nitride Thin-Film Growth in a Large MOCVD Reactor. Coatings. 2017; 7(8):112. https://doi.org/10.3390/coatings7080112
Chicago/Turabian StyleHu, Chih-Kai, Chun-Jung Chen, Ta-Chin Wei, Tomi T. Li, Chih-Yung Huang, Chu-Li Chao, and Yi-Jiun Lin. 2017. "Numerical Verification of Gallium Nitride Thin-Film Growth in a Large MOCVD Reactor" Coatings 7, no. 8: 112. https://doi.org/10.3390/coatings7080112
Note that from the first issue of 2016, this journal uses article numbers instead of page numbers. See further details here.