1. Introduction
Lead zirconate titanate (PbZr
xTi
1-xO
3 or PZT) ceramics, solid solutions of PbTiO
3 (PT) and PbZrO
3 (PZ) have been extensively and intensively studied for several decades [
1], because they are important for a variety of applications such as transducers, sonars, micropositioners, actuators or pyroelectric sensors due to their outstanding ferroelectric, piezoelectric, pyroelectric, and opto-electronic properties. Although PZT ceramics of different compositions have various functions, one of the salient features of the phase diagram for this solid solution system is the existence of a practically temperature-independent phase boundary around x = 0.52−0.53 which separates a rhombohedral Zr-rich phase from a tetragonal Ti-rich phase. Relative permittivity, the piezoelectric constant and the electromechanical coupling coefficient all exhibit pronounced maxima for the composition corresponding to this phase boundary, which is generally referred to as the morphotropic phase boundary (MPB) [
1]. This behavior is mainly attributable to the existence of a mixture of phases at the boundary and the presence of a larger number of reorientable polarization directions existing in the MPB mixed-phase region.
PZT ceramics with the composition of MPB can be used as actuators and transducers with excellent performances. Similarly to its end components PT and PZ, PZT has been prepared by a conventional solid-state reaction process as well as by various chemical and physical processing routes. For example, a sputtering process enables sputter rates of 200–250 nm/min and a complete covering of a six-inch Si-wafer with a 12 μm thick PZT film within 60 min [
2].
Plasma sprayed PZT ceramics have rarely been reported and analyzed. The application of thermal spraying technologies to deposit ferroelectric PZT coatings is a fairly complicated issue due to the extremely high thermal load during the spray process and the thermal instability of this material. It has been shown [
3] that the PZT powder in the plasma jet is subjected to temperatures exceeding the point of incongruent decomposition which occurs at about 1350 °C.
PZT powders with x = 0.50/0.58/0.66 were sprayed [
4] and the relative permittivity after annealing at temperatures between 600 and 1000 °C was in the range of 200 to 800. Powders with various size distributions peaking between 40 and 65 µm were tested. The coarser initial powder brought higher permittivity whereas the finer powder was decomposed into various phases including PbO and ZrO
2 which led to low permittivity. Another focus was the spraying of powder prepared with an excess of PbO, the goal being to compensate for evaporation of this low-melting point component [
5]. Annealing at the usual sintering temperatures, for PZT at 1280–1300 °C, was necessary in order to completely restore the original crystal structure. The elastic modulus measured by the nanoindentation technique for plasma sprayed PZT coatings sprayed at 20 and 32 kW power [
6] was 113 and 98 GPa, respectively. Nanohardness, at 8 mN load, for a 20 kW coating was found to be 1.53 GPa but reduced to 1.44 GPa for a 32 kW coating. The difference in the elastic modulus and hardness for the two energies was attributed to the porosity and microstructure incurred by the evaporation of PbO during plasma spraying.
Conventionally, PZT powders are sintered. It was observed [
7] that when PZT powder is sintered together with polymethyl methacrylate pore formers, the relative permittivity decreases nearly linearly from 310 to 220 at 1 kHz with increasing porosity from 4 to 15%. Moreover, the loss factor is also strongly dependent on the porosity.
As an adaptive optical mirror for EUV lithography, a PZT film with a thickness of 100 µm was deposited on the top of a four-inch Si wafer [
8]. On driving the PZT thick film pattern, the Si wafer bent in a parabolic manner. The maximum deflections in a planar direction were both about 200 µm.
The aim of our work was to spray PZT in order to obtain coatings with various thicknesses on various substrates. We also produced a free-standing body which has never been reported in the literature to be plasma sprayed. Our main target was to produce a supporting body for a deformable piezoelectric mirror similar to [
8], but made of PZT by sputtering techniques. For this application, the physical and chemical compatibility of the substrate with PZT is vital. The substrate should have good mechanical integrity without cracks and critically its mechanical properties must not be dependent on thickness.
2. Experimental
2.1. Spraying
Feedstock powder for plasma spraying was reactively sintered by Noliac (Hradec Kralove, Czech Reublic) with nominal size between 35 and 75 µm. Because of reported problems concerning several substrates by PZT, namely Al [
9], we tested substrates with different character. PZT feedstock powder (coef. of thermal expansion CTE 5 µm/m °C) was sprayed onto graphite (CTE 3 µm/m °C), silicon wafer (CTE 3 µm/m °C), low carbon steel (CTE 13 µm/m °C), cobalt sheet (CTE 13 µm/m °C) and Al sheet (CTE 25 µm/m °C).
The majority of the substrates were grit blasted before spraying whereas Si wafers were only slightly hand-coarsened using SiC paper. Power 24 kW (48 V, 500 A) was used with a gas-stabilized plasma torch Plasmatechnik F4 (Sulzer, Wohlen, Switzerland). Argon was applied as the primary plasma gas with the flow rate 65 slpm and hydrogen as the secondary plasma gas with as low a flow rate as 2 slpm. Ar was used also as the powder feeding gas and spraying distances from 75 to 100 mm were applied.
2.2. Characterizations
The porosity was studied by optical microscopy on polished cross sections. The micrographs were taken via a CCD camera and processed using an image analysis (IA) software (Lucia G, Laboratory Imaging, Czech Republic). A minimum of 10 images of microstructures taken from various areas of a cross section were analyzed. The used magnification was 250 in all cases. For a better description of the porosity certain additional criteria were introduced.
X-ray diffraction (XRD) was performed on a SIEMENS D500™ theta-2theta diffractometer in Bragg-Brentano parafocusing geometry equipped with X-ray lamp with cobalt anode. The goal was to gain information about the crystalline phases present in the coatings and feedstock powder.
Scanning electron microscopy was done using a Cameca SX100 device with energy-dispersive microanalysis. Voltage of 15 kV at current 6 nA was applied and the electron beam for the elemental analysis was defocused to 2 µm. The background level was recorded for 5 s and the spectral lines themselves for 10 s.
The microhardness was measured by a Hanemann microhardness head (Zeiss, Germany) mounted on an optical microscope with a fixed load of 1 N using a Vickers indenter. Ten indentations from various areas of a cross section for each sample were analyzed.
A Setaram TG-DTA 92 machine was used for differential thermal analysis. A plasma sprayed sample was manually milled to powder with a grain size comparable with the size of the initial feedstock powder. As a reference substance α-Al2O3 powder with grain size below 60 μm was used. The mass of each measured sample was 50 mg. All measurements were performed with a constant heating rate of 5 °C/min.
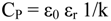
Electrical measurements were performed on the sample released from the steel substrate and thus forming a free-standing body. The surface of specimens was ground to eliminate surface roughness. Layers of aluminum as thin film electrodes were sputtered under reduced pressure onto both sides of each sample. The electric field was applied parallel to the spraying direction, i.e., perpendicular to the substrate surface. Capacitance was measured in the frequency range from 40 Hz to 1 MHz using a programmable impedance analyzer model PM6306 (Fluke, the Netherlands). Applied voltage was 1 V AC. Relative permittivity εr was calculated from measured capacitances CP and specimen dimensions since εr is directly proportional to CPin Equation 1.
where ε0 = 8.854 × 10⁻¹² F m−1; 1/k [m] is defined as the ratio between the surface area and the thickness of the sample. The same arrangement and equipment was used for the loss factor measurement at the same frequencies as the capacitance.
One coating on a Si wafer was annealed at 750 °C for 2 hours using a laboratory furnace and an air atmosphere. The purpose of this thermal post-treatment was to observe the effect of annealing [
4] on the phase composition of the PZT coating and the reactivity with the Si substrate.
3. Results
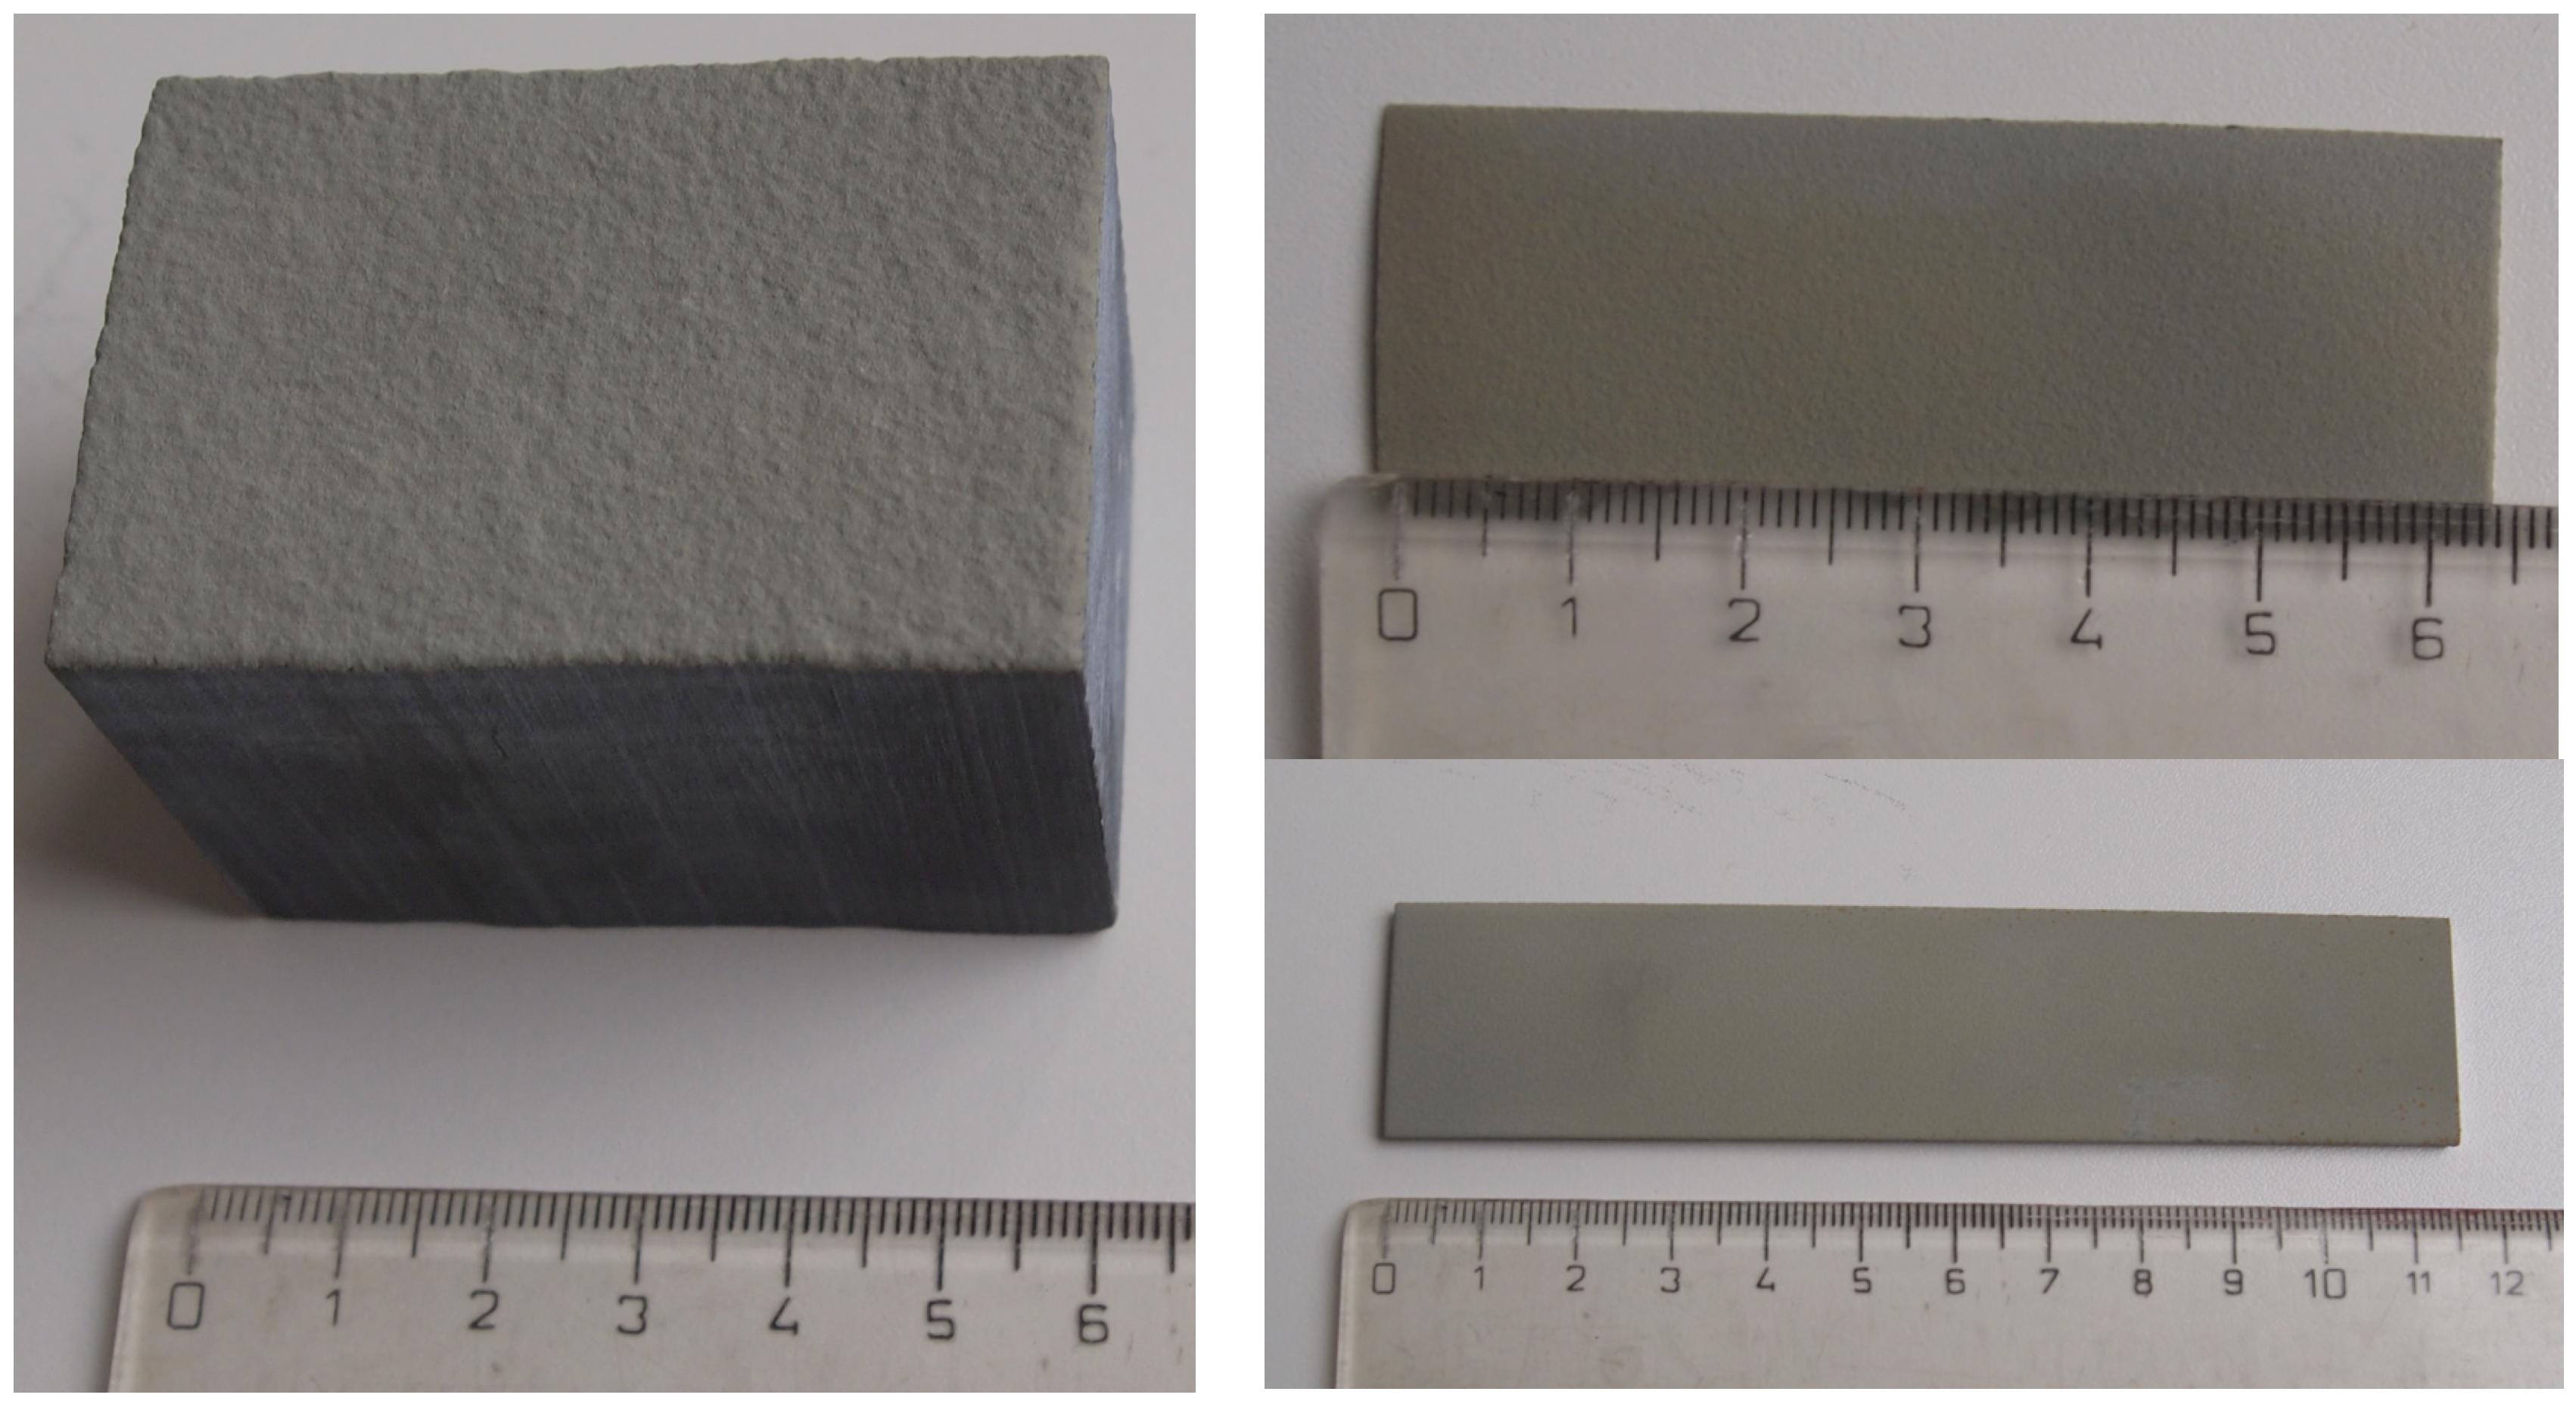
The appearance of the coating-substrates of the two markedly different systems as well as one free-standing body is visible in
Figure 1. Typical coating thickness was about 0.3 mm whereas also 0.6 mm thick free-standing body was sprayed using longer pauses between torch passes to cool the as-sprayed layer effectively.
Figure 1.
Lead zirconatetitanate (PZT) coating on graphite block (left); thick free-standing body (top right) and coating on carbon steel (bottom right).
Figure 1.
Lead zirconatetitanate (PZT) coating on graphite block (left); thick free-standing body (top right) and coating on carbon steel (bottom right).
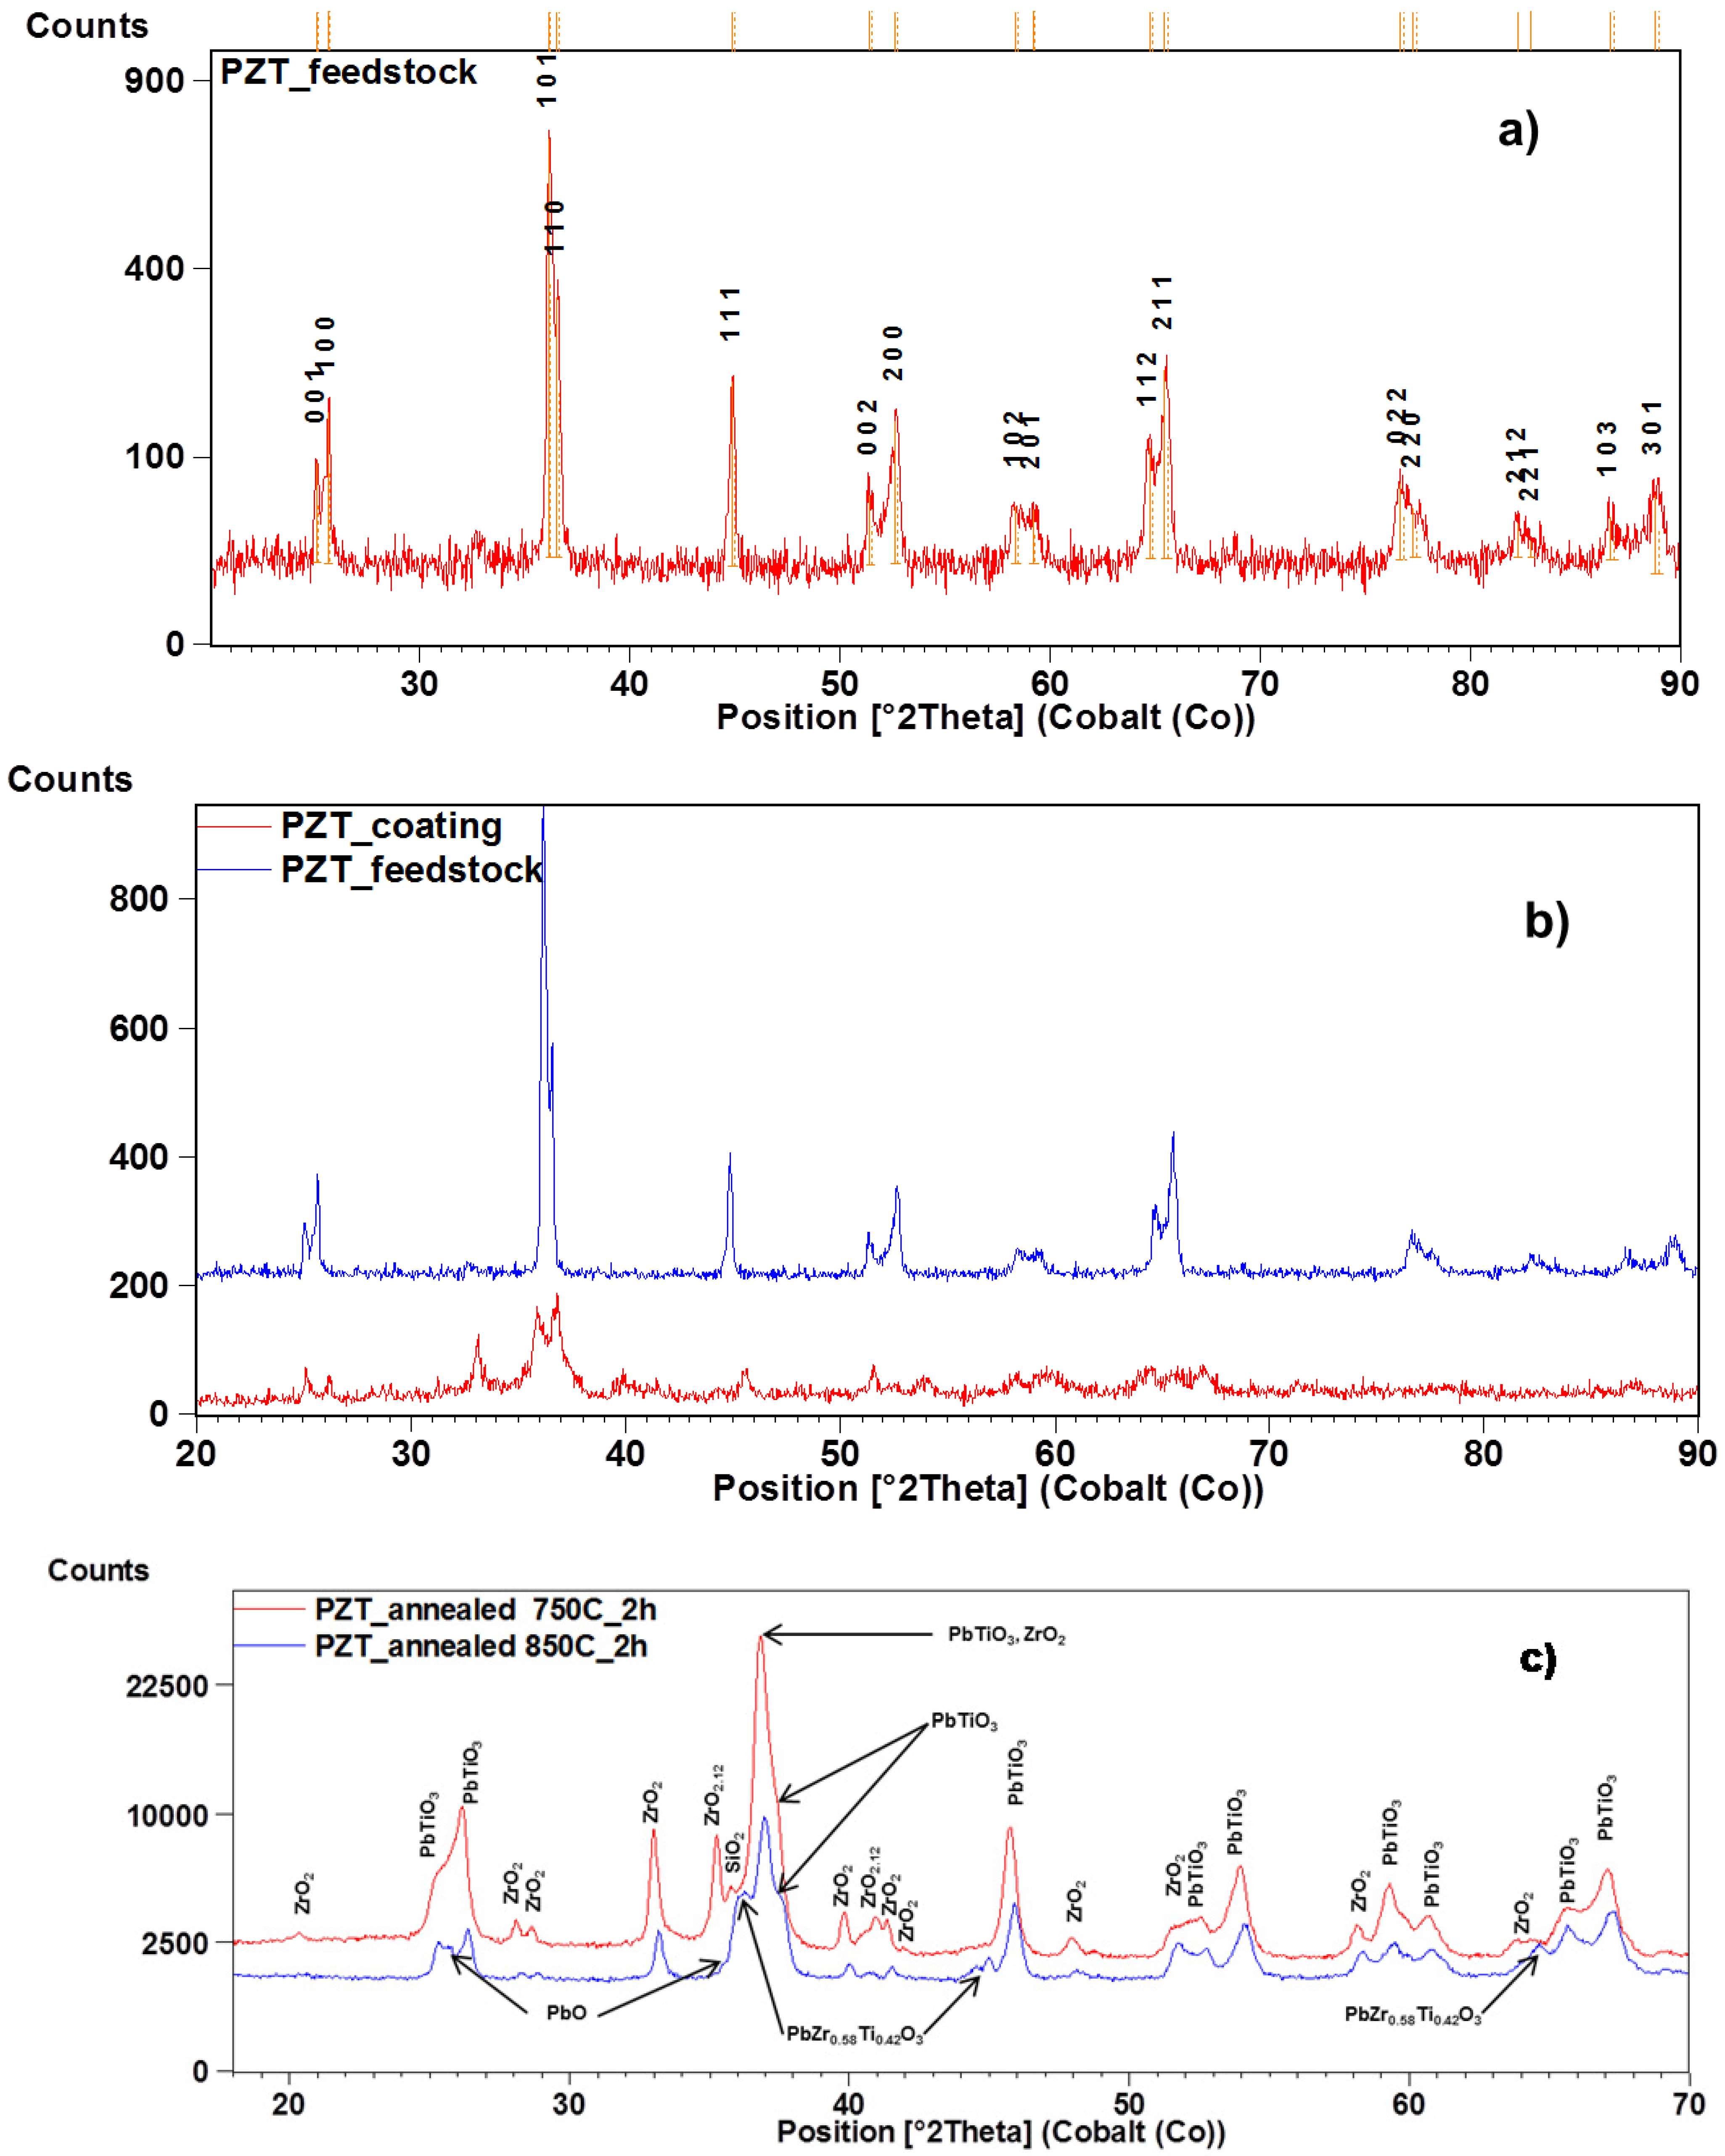
Feedstock powder and free-standing body in the as-received and annealed states were subjects of XRD analysis. In the feedstock powder, the dominant phase was tetragonal PbZr
0.52Ti
0.48O
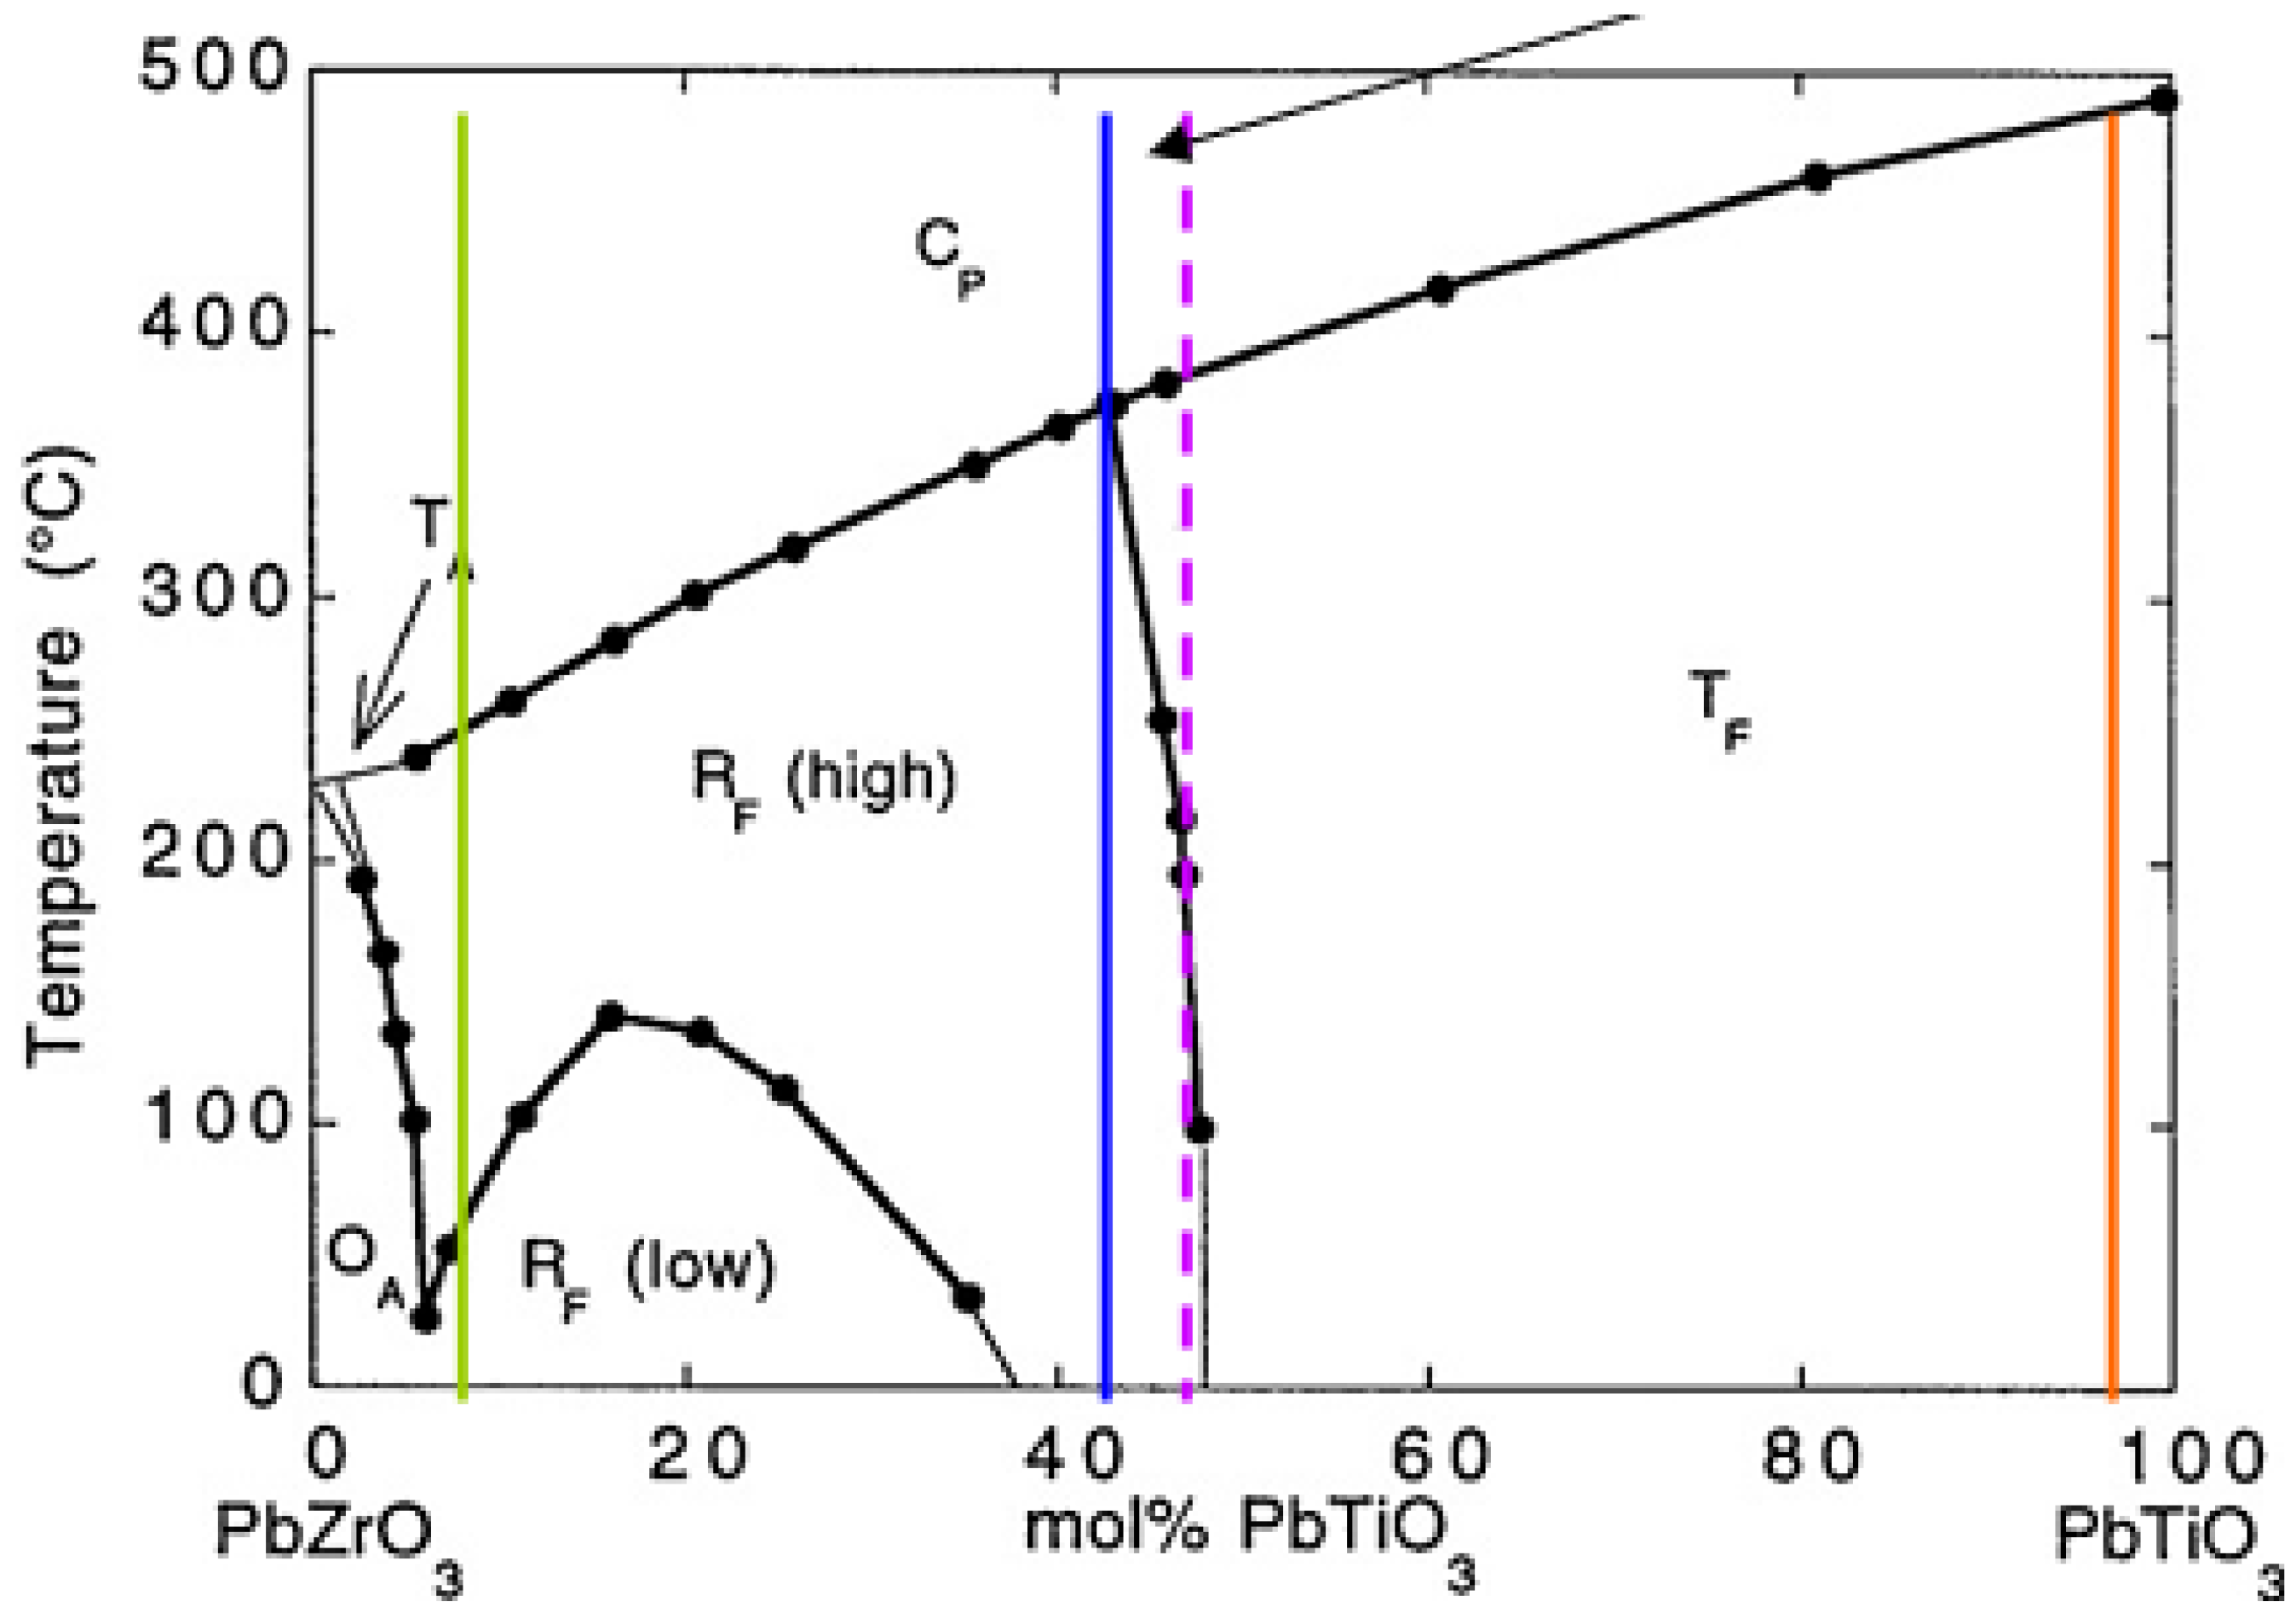
3 (PDF card No. 33-784) representing approximately the composition corresponding to MPB as seen by the dashed line in
Figure 2. It is observed that this phase decomposes during plasma spraying into PbZr
0.58Ti
0.42O
3 with a “near-MPB” composition and two phases having a composition similar to the end components of the phase diagram,
i.e., tetragonal PbTiO
3 and rhombohedral PbZr
0.9Ti
0.1O
3, c.f.
Table 1,
Figure 3a and the three full lines in
Figure 2. The presence of binary oxides ZrO
2 and PbO was also detected, moreover, ZrO
2 in both monoclinic and cubic form was found in the irradiated volume. XRD of samples subjected to annealing at 750 and 850 °C showed the presence of Baddeleyite,
i.e., monoclinic ZrO
2, and PbTiO
3 in both samples; after annealing at higher temperature PbZr
0.58Ti
0.42O
3, and PbO phases were found in the sample, see
Figure 3c. Rietveld refinement analysis gave evidence of a minor fraction of PbZr
0.9Ti
0.1O
3 phase in the sample annealed at 850 °C.
Figure 2.
Phase diagram of PZT [
1] with vertical lines corresponding to the phases detected by the X-ray diffraction (XRD) measurement; morphotropic phase boundary (MPB) is indicated by the upper arrow.
Figure 2.
Phase diagram of PZT [
1] with vertical lines corresponding to the phases detected by the X-ray diffraction (XRD) measurement; morphotropic phase boundary (MPB) is indicated by the upper arrow.
Table 1.
X-ray diffraction (XRD) analysis of the plasma sprayed Lead ZirconateTitanate (PZT).
Table 1.
X-ray diffraction (XRD) analysis of the plasma sprayed Lead ZirconateTitanate (PZT).
| PDF Code | Chemical Formula | Crystal System | Space Group |
|---|
| 1-78-299 | PbTiO3 | tetragonal | P4mm |
| 1-70-743 | PbZr0.9Ti0.1O3 | rhombohedral | R3c |
| 37-517 | PbO2 | orthorhombic | C |
| 1-78-47 | ZrO2 | monoclinic | P21/c |
| 1-73-2022 | PbZr0.58Ti0.42O3 | rhombohedral | R3m |
| 7-337 | ZrO2 | cubic | Fm3m |
| 1-78-1663 | PbO | orthorhombic | Cmma |
Figure 3.
XRD pattern of the PZT feedstock (a) exhibiting only PbZr0.52Ti0.48O3 diffraction lines denoted by Miller indices; its comparison with plasma sprayed PZT (b) and coatings annealed at 750 and 850 °C for 2 hours (c).
Figure 3.
XRD pattern of the PZT feedstock (a) exhibiting only PbZr0.52Ti0.48O3 diffraction lines denoted by Miller indices; its comparison with plasma sprayed PZT (b) and coatings annealed at 750 and 850 °C for 2 hours (c).
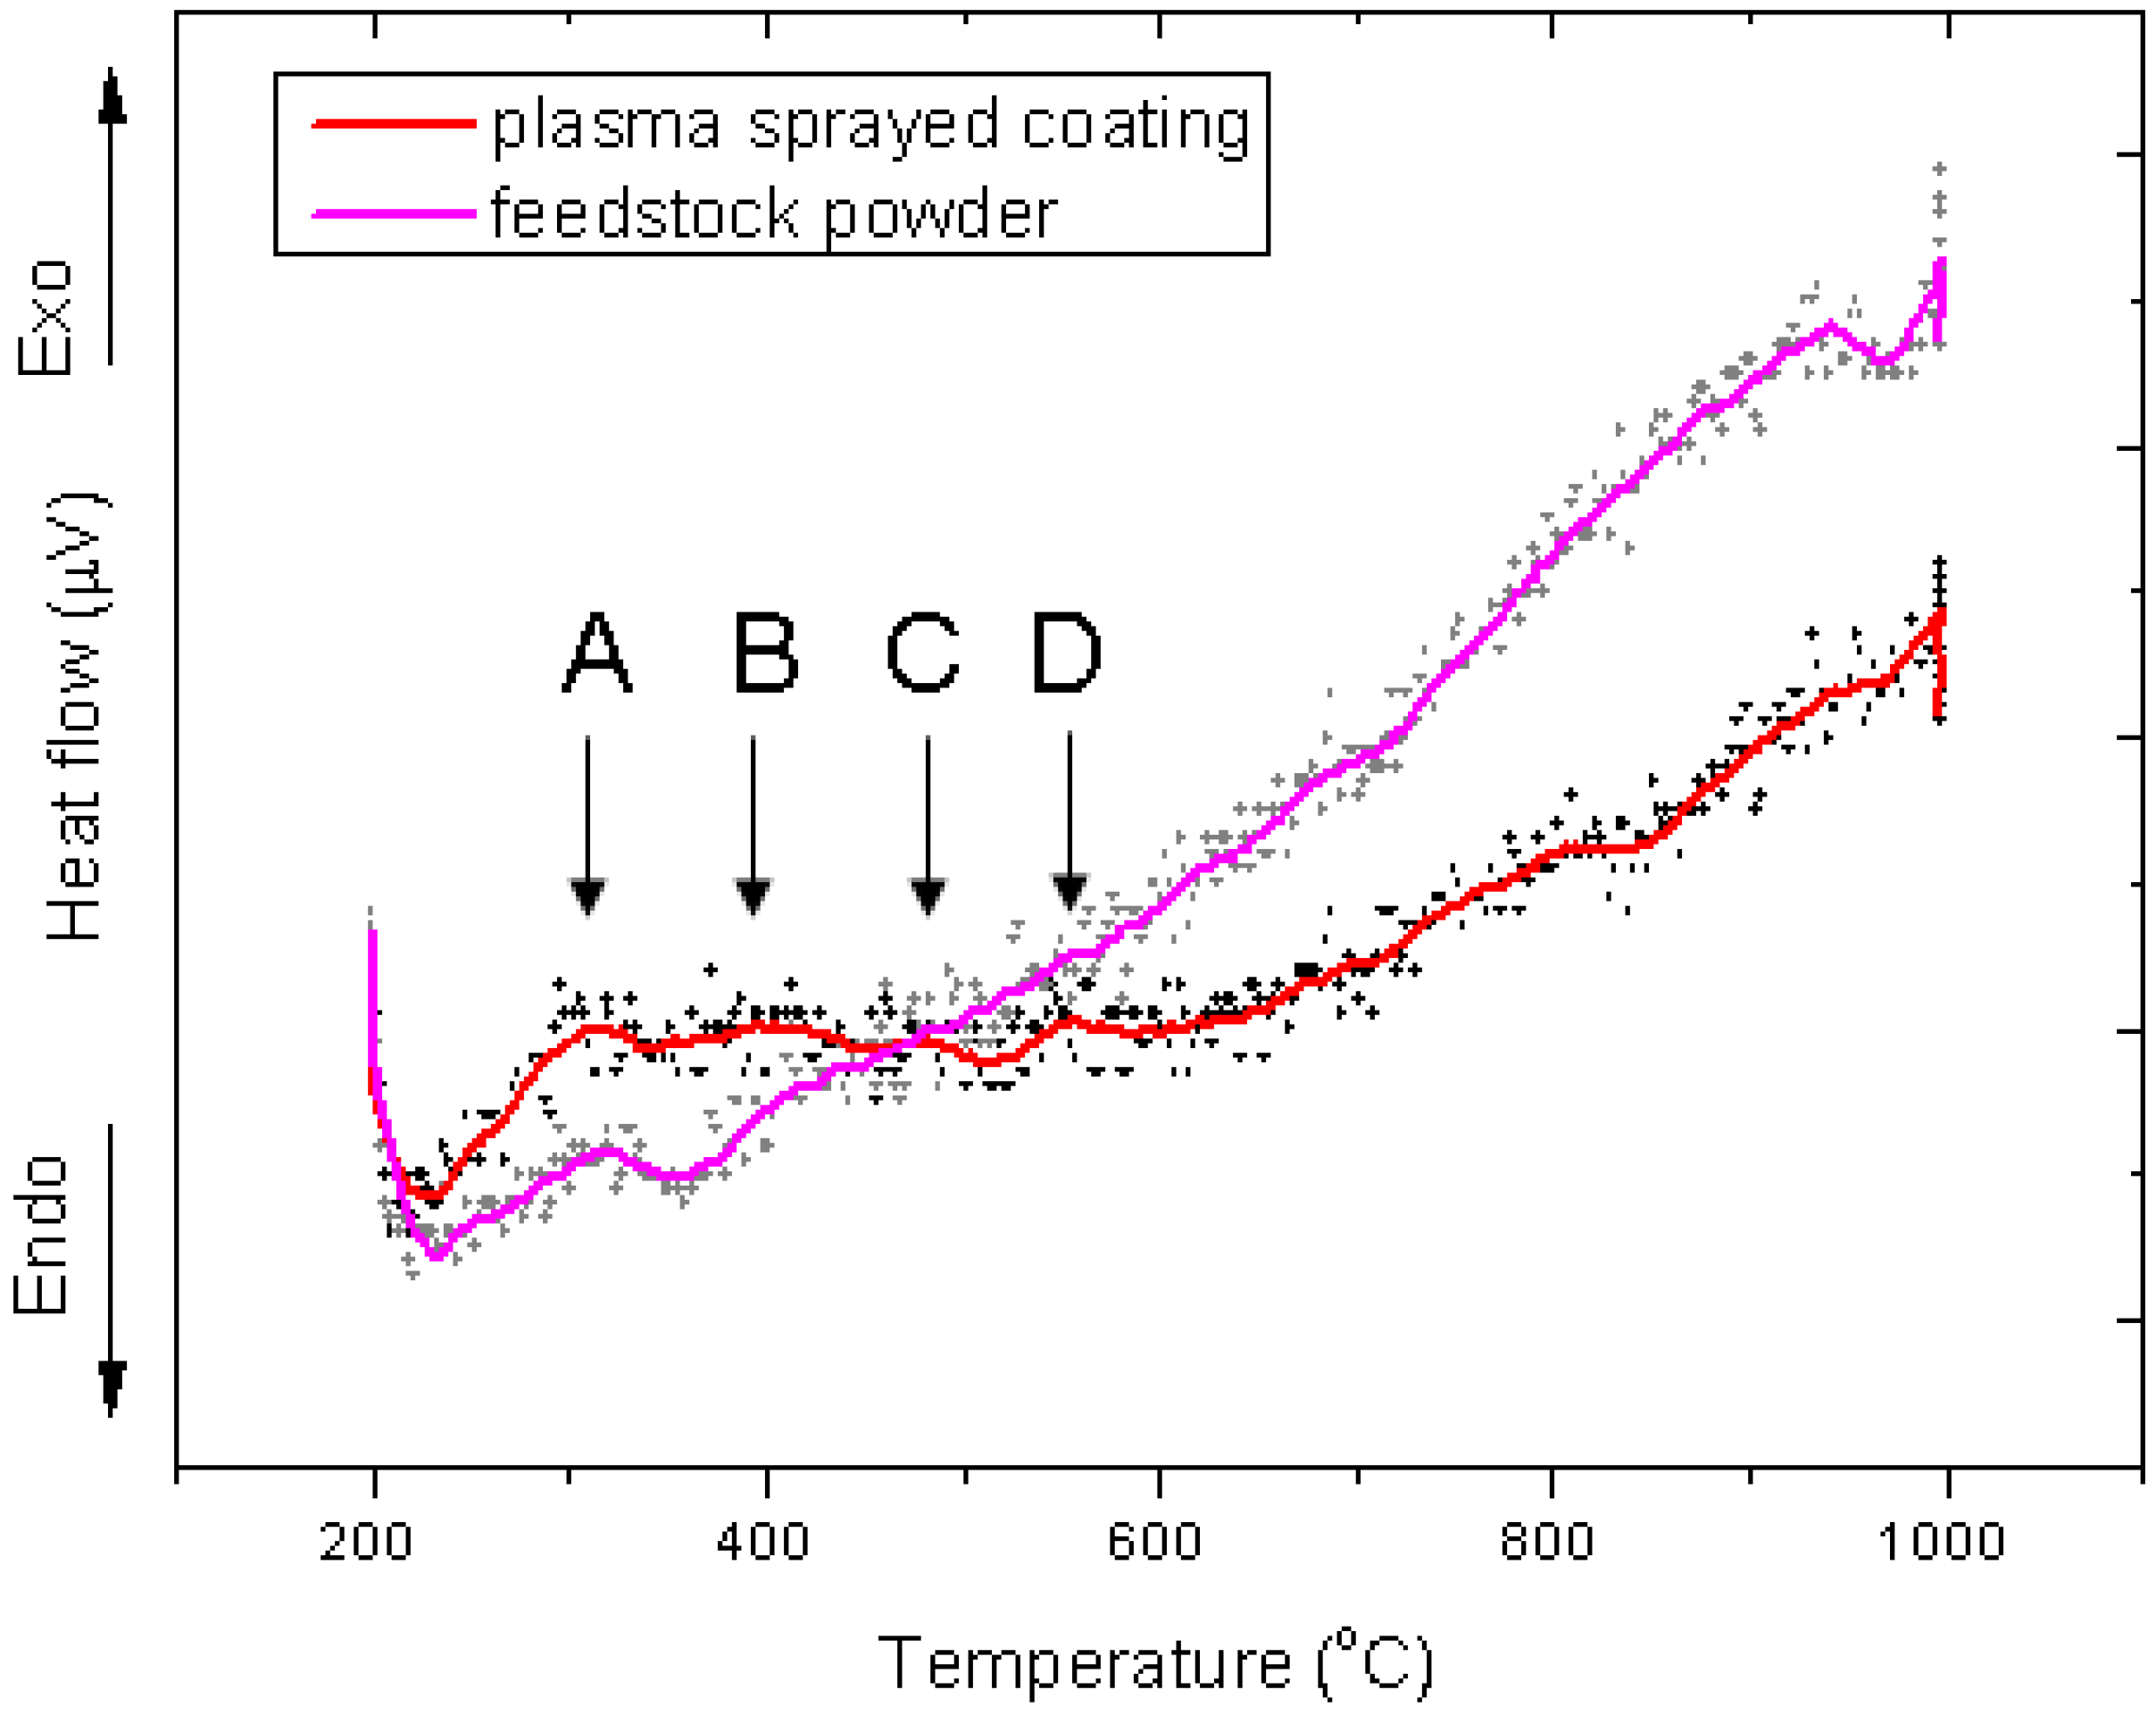
Differential thermal analysis (DTA) done on the feedstock and a selected coating is shown in
Figure 4. The phase corresponding to MPB has Curie temperature 340 °C marking the boundary that triggers ferroelectric properties. In
Figure 4 we can see a plateau between 300 °C and 500 °C in the DTA curve of the coating with several small peaks which correspond to subsequent transformations of all components that have different Curie temperatures, e.g., 418 °C in the PbTiO
3-rich tetragonal phase [
3]. The first peak, denoted A, at about 310 °C corresponds to the transformation of the rhombohedral PbZr
0.9Ti
0.1O
3, the second peak B at about 380 °C corresponds to the transformation of the rhombohedral PbZr
0.58Ti
0.42O
3, the third peak C at about 500 °C corresponds to the transformation of the tetragonal PbTiO
3, whereas the fourth peak D at 550 °C remains unidentified.
Figure 4.
Differential thermal analysis recorded for the feedstock and coating.
Figure 4.
Differential thermal analysis recorded for the feedstock and coating.
The surface roughness of the coatings and blasted substrates is summarized in
Table 2. Silicon wafer was coarsened manually, and from the viewpoint of the observed roughness parameters, its surface remained more or less in its initial state.
Table 2.
Surface roughness of coatings and blasted substrates.
Table 2.
Surface roughness of coatings and blasted substrates.
| Sample | Ra [µm] | Ry max [µm] |
|---|
| PZT on steel | 8.5 ± 0.3 | 66.2 ± 6.0 |
| Steel | 6.5 ± 0.2 | 60.9 ± 7.5 |
| PZT on graphite | 14.1 ± 1.1 | 100.9 ± 8.5 |
| Graphite | 10.8 ± 1.3 | 88.4 ± 16.9 |
| PZT on silicon | 8.4 ± 0.7 | 67.4 ± 3.3 |
| Silicon | 0.7 ± 0.1 | 16.4 ± 11.3 |
| PZT on aluminium | 11.7 ± 0.4 | 90.3 ± 5.1 |
| Aluminium | 9.7 ± 1.3 | 78.8 ± 12.7 |
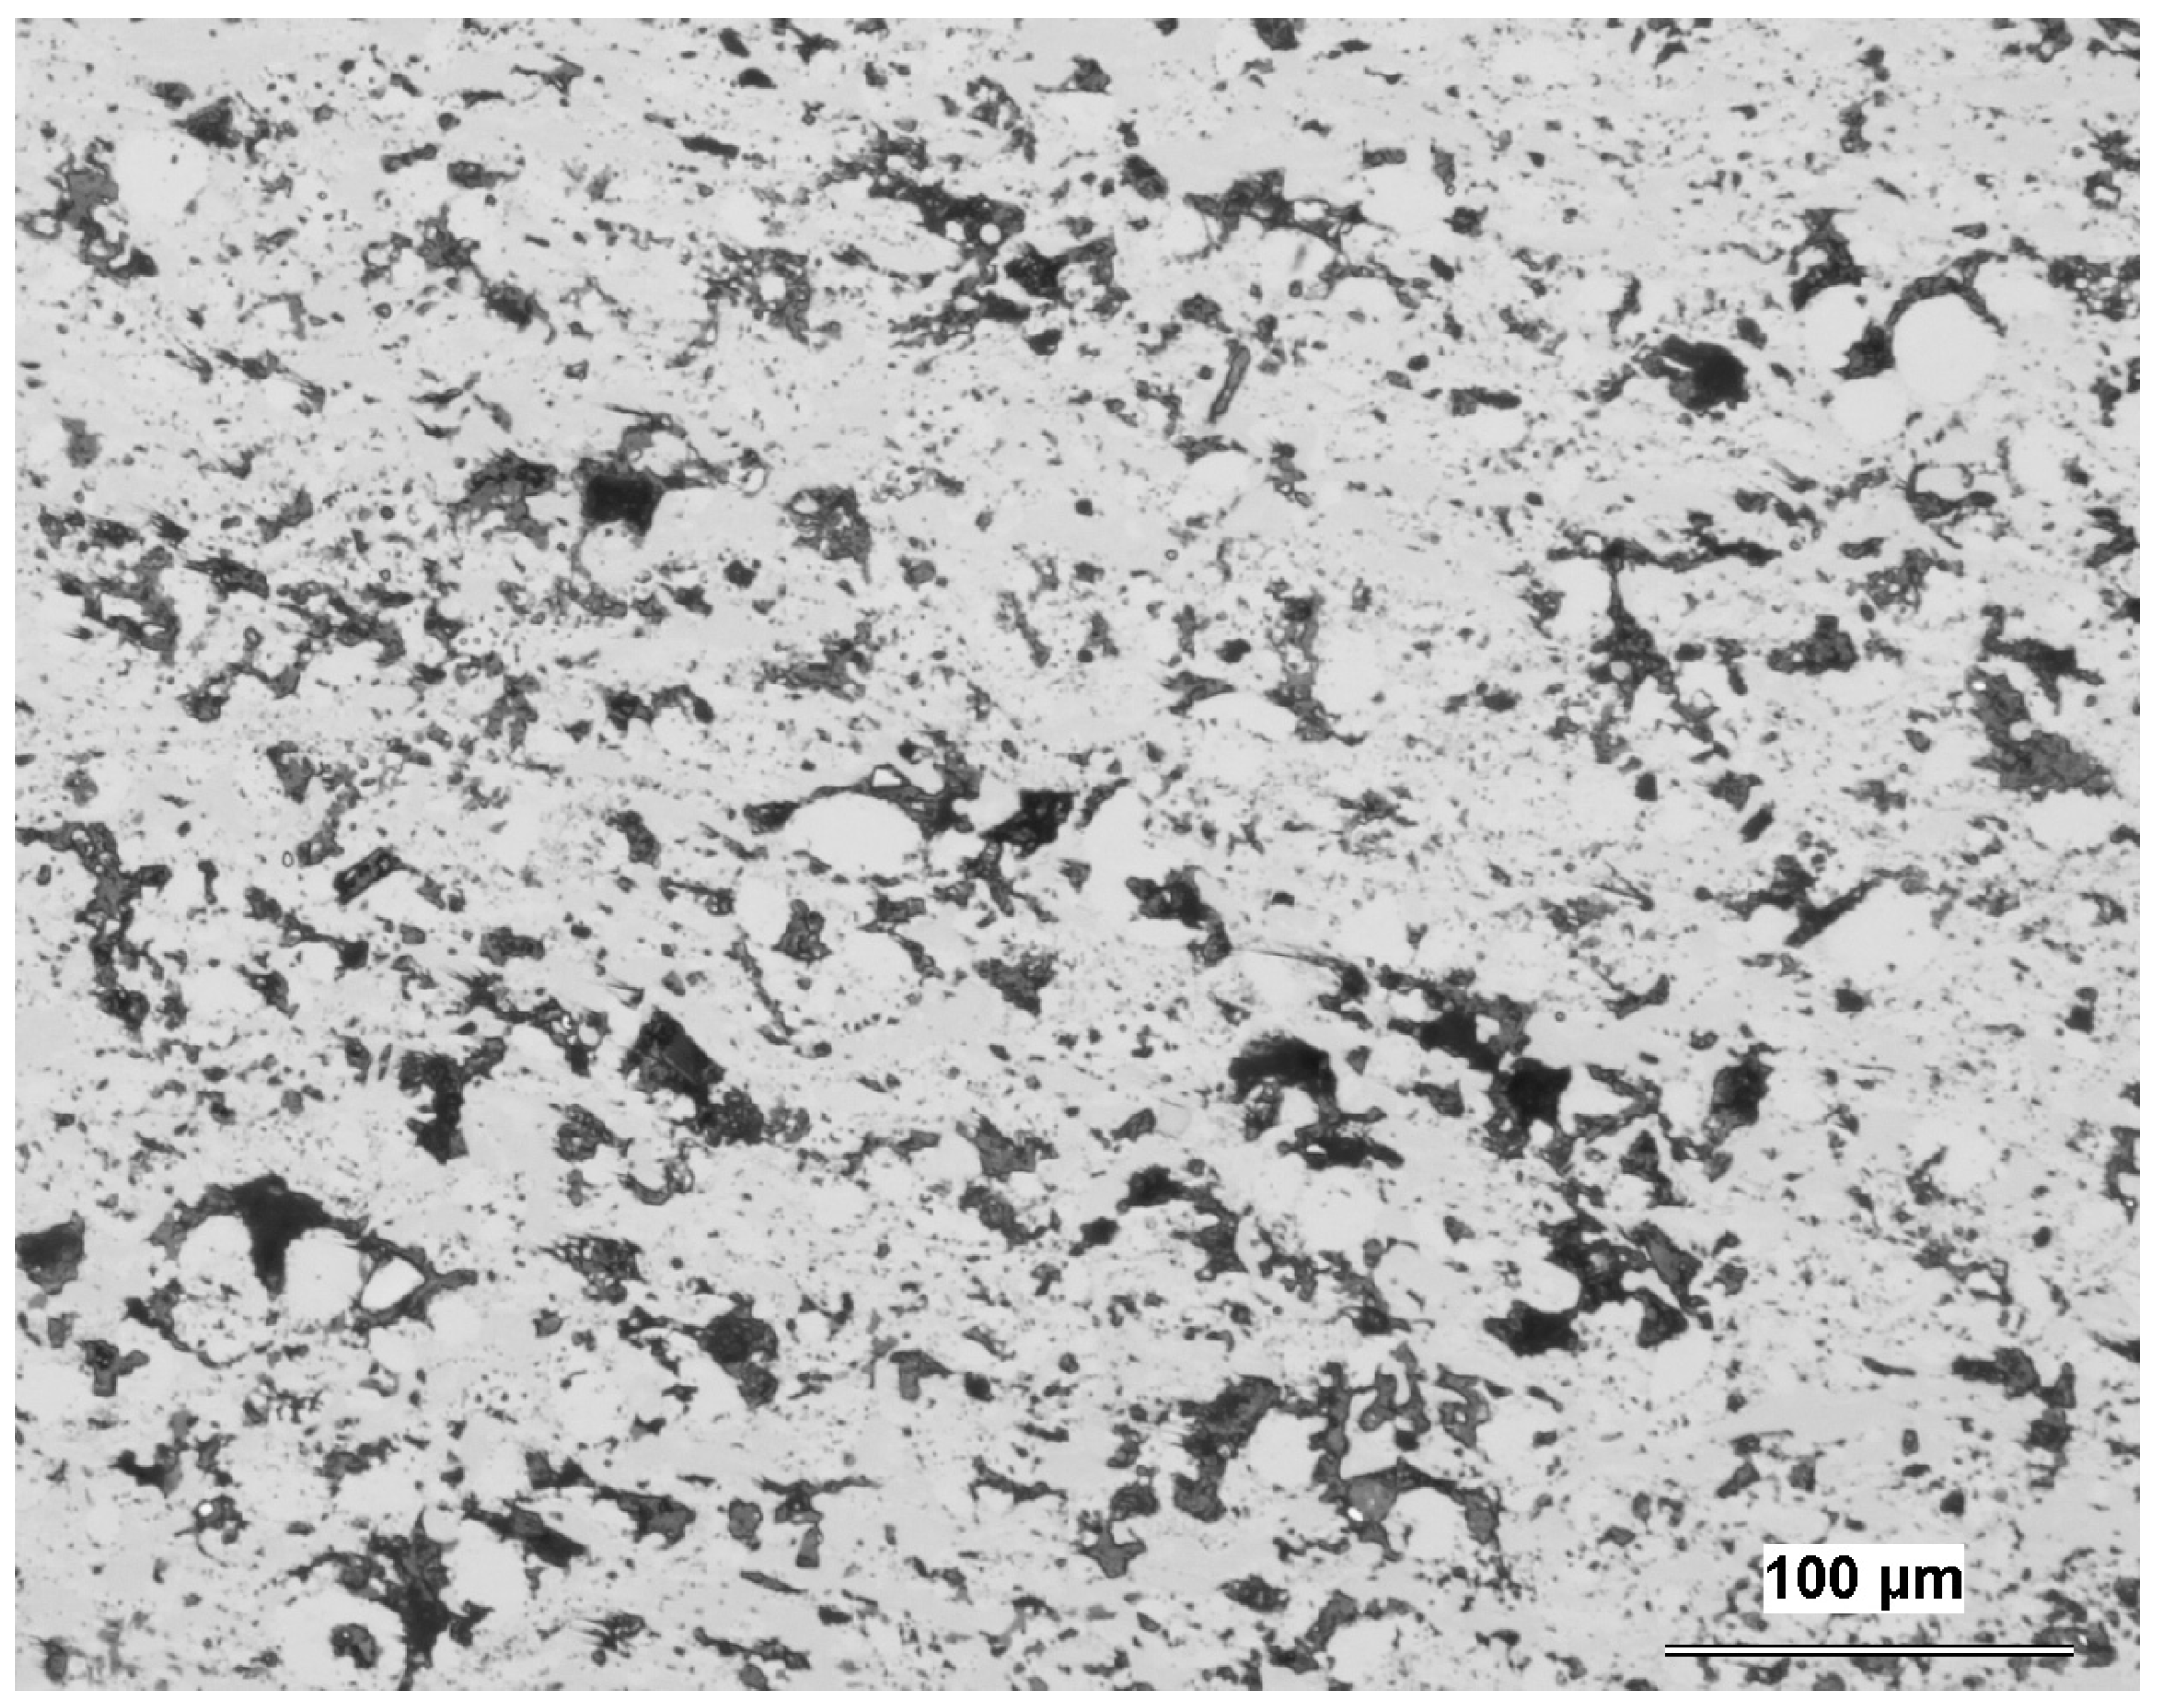
The polished cross section of the PZT coating is shown in
Figure 5. A free-standing body, 600 µm thick, exhibits relatively high porosity and a number of imperfections within the structure. The results of porosity, as measured by image analysis, are summarized in
Table 3.
Figure 5.
Polished cross section of the PZT coating; light microscopy.
Figure 5.
Polished cross section of the PZT coating; light microscopy.
Table 3.
Image analysis and microhardness results.
Table 3.
Image analysis and microhardness results.
| Parameter | Porosity [%] | Mean pore size [µm] | Microhardness [GPa] |
|---|
| PZT | 14.8 ± 1.7 | 4.3 ± 0.2 | 3.5 ± 0.9 |
| BaTiO3 [10] * | 4.7 ± 0.5 | 4.5 ± 0.1 | 6.6 ± 1.2 |
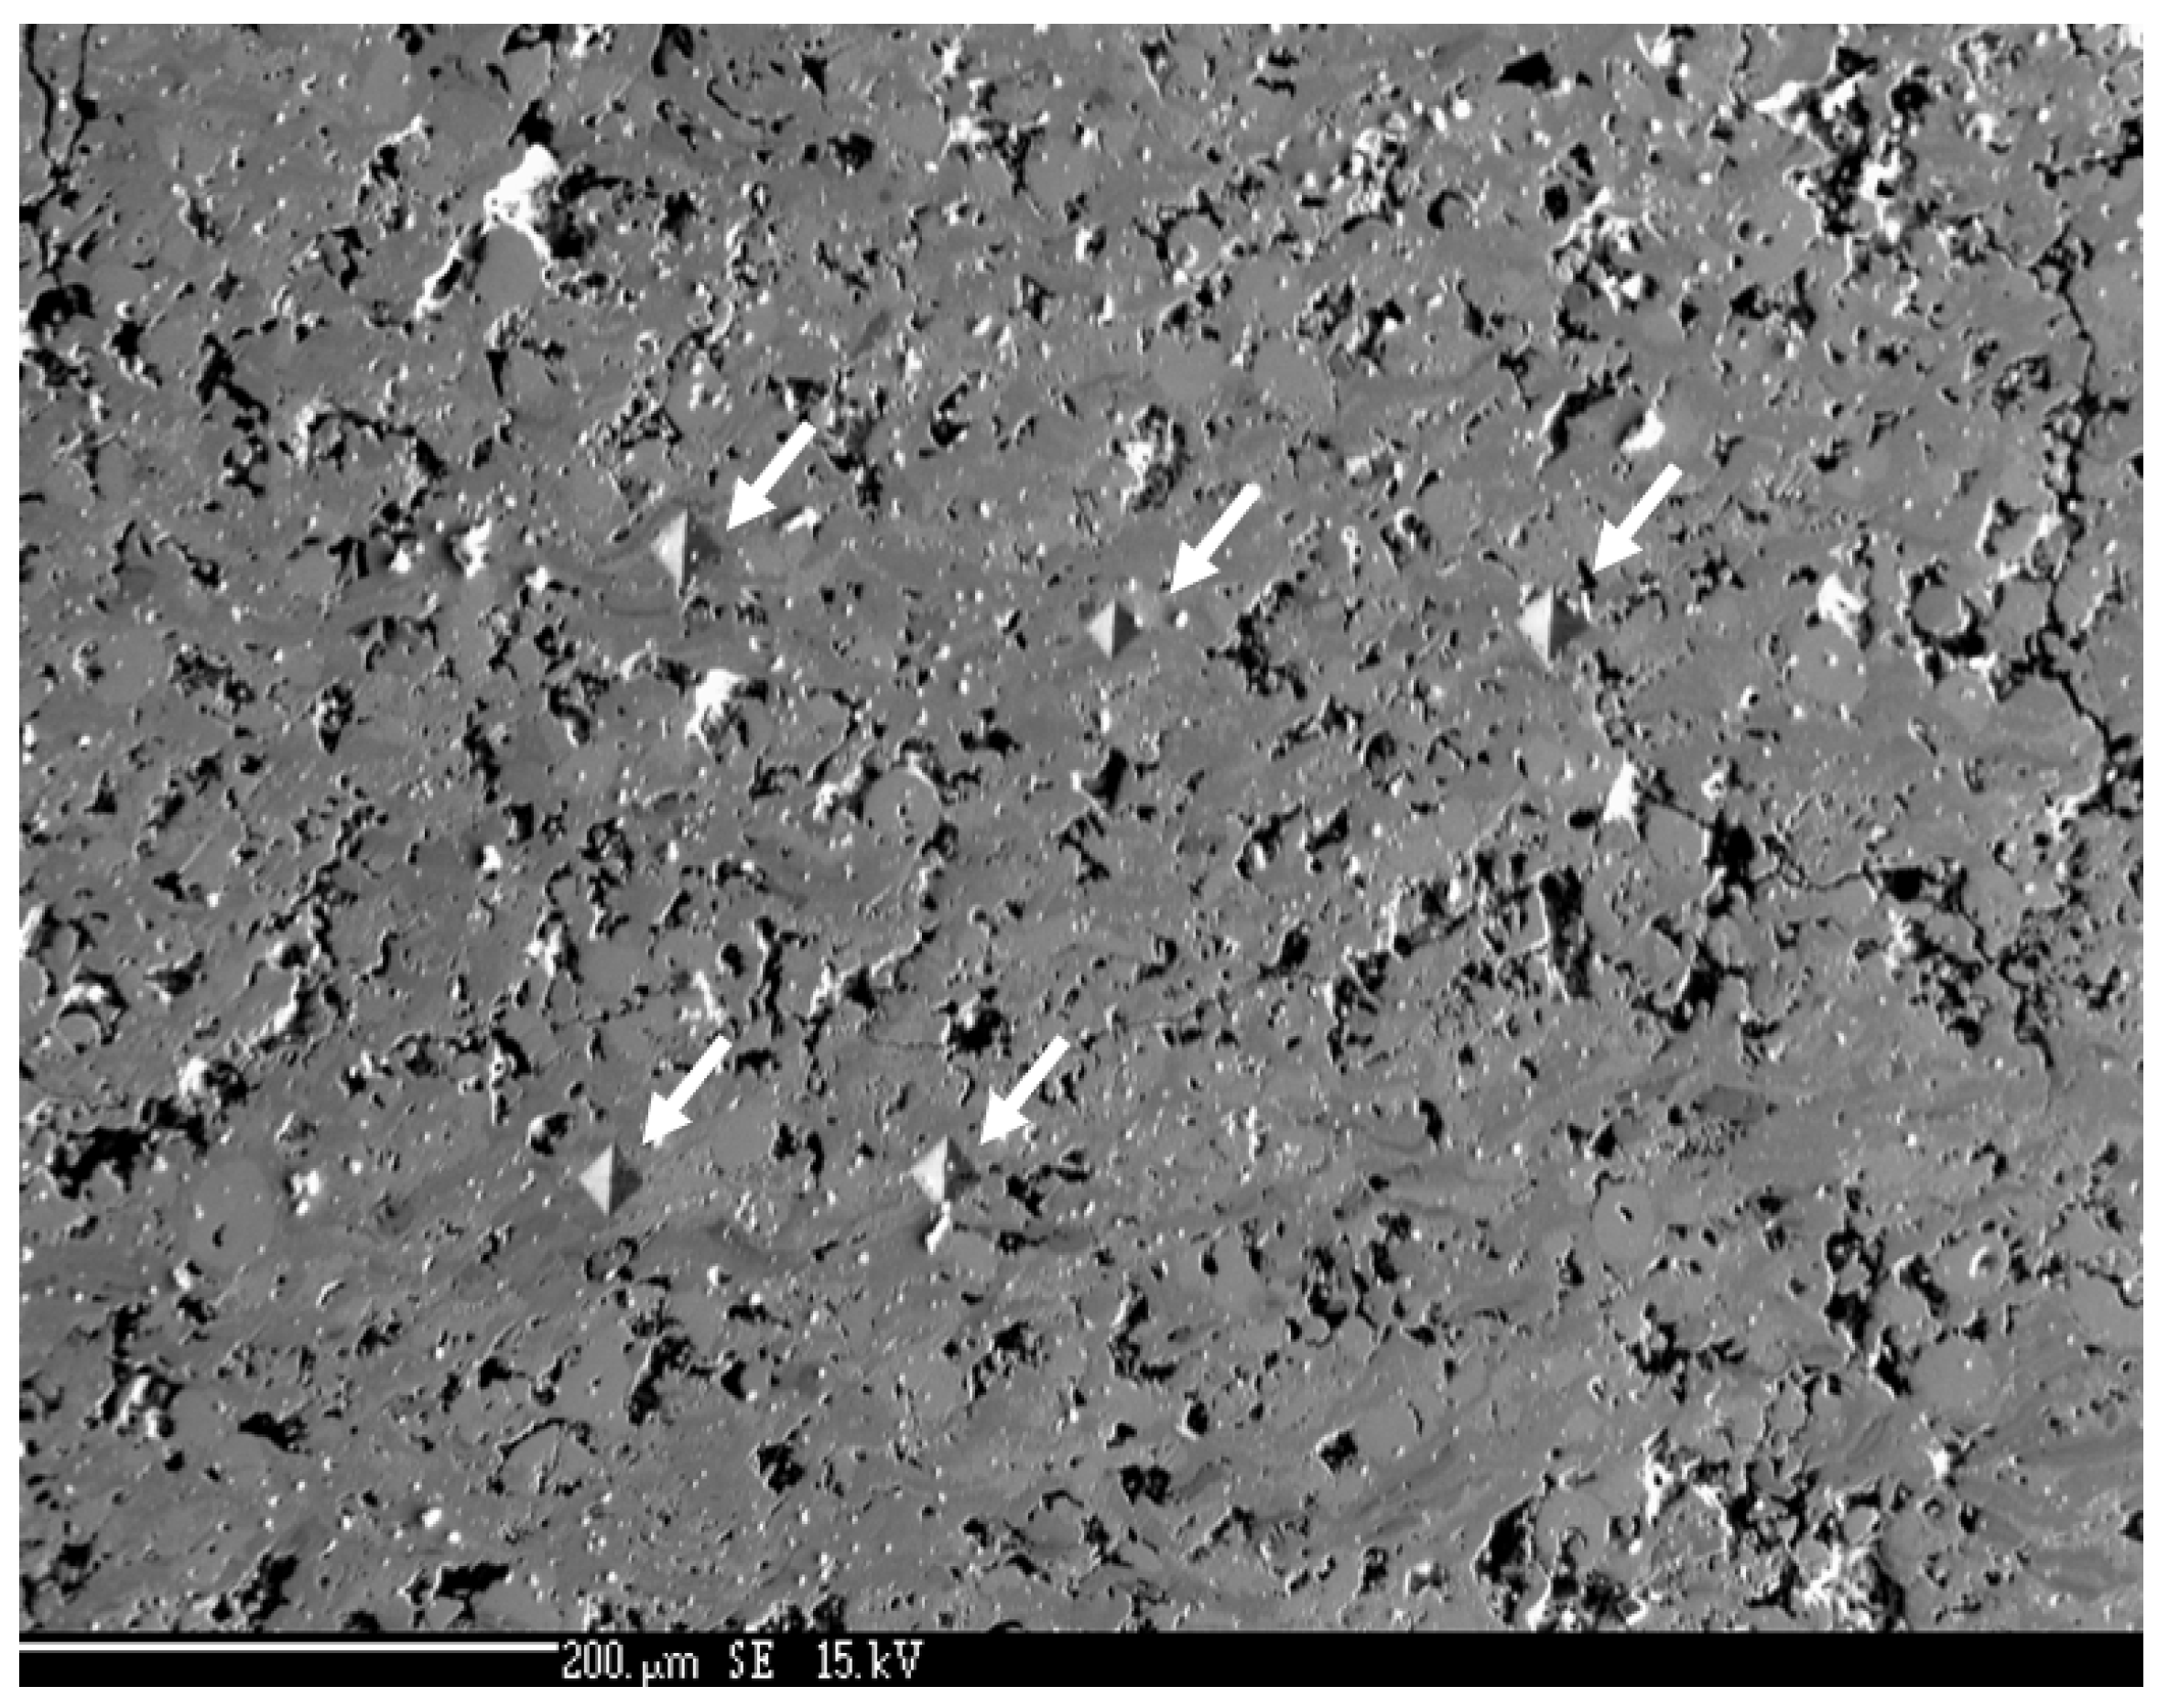
Microhardness of the free-standing body is 3.5 ± 0.9 GPa pointing to harder material than other reported PZT coatings [
6]. Five Vicker’s indents are indicated by arrows on
Figure 6.
Figure 6.
Polished cross section of the PZT coating with Vicker’s indents; SEM-SE.
Figure 6.
Polished cross section of the PZT coating with Vicker’s indents; SEM-SE.
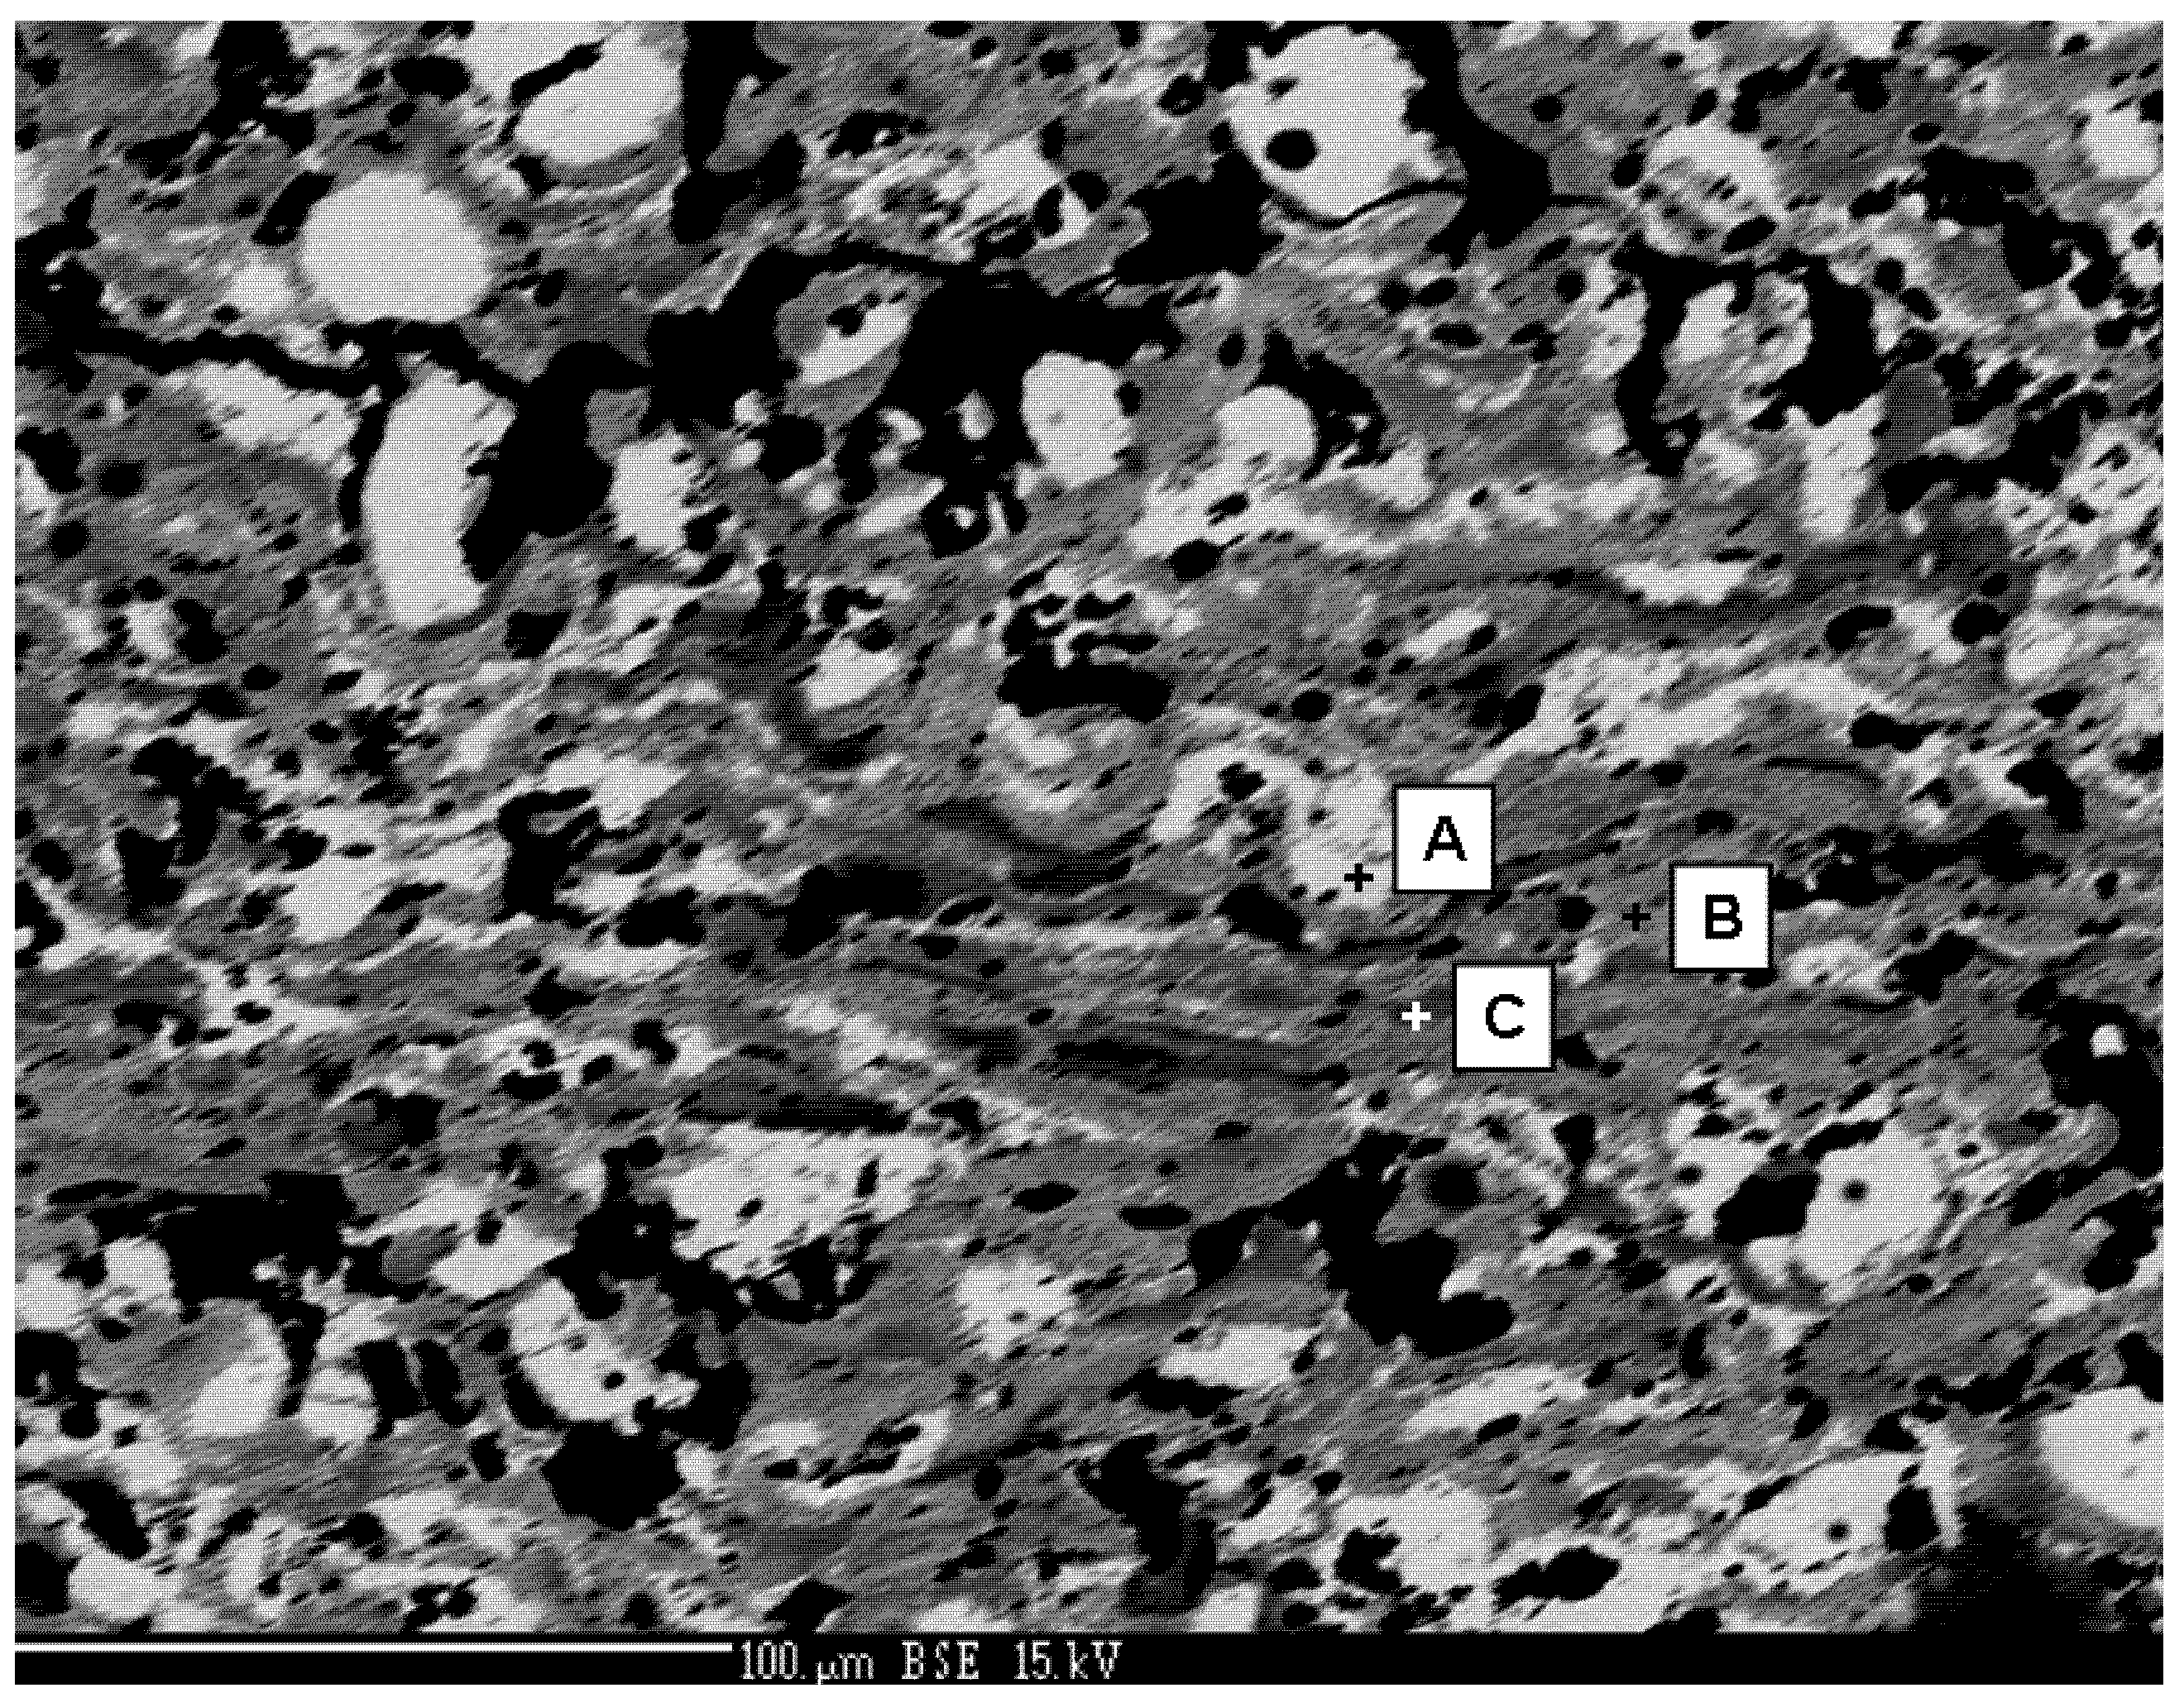
The chemical EDX analysis of the “phases” A, B, C indicated on the corresponding SEM-BE micrograph,
Figure 7, is shown in
Table 4.
Figure 7.
Polished cross section of the PZT coating; SEM-BE. Crosses with letters indicate “phases” from
Table 4.
Figure 7.
Polished cross section of the PZT coating; SEM-BE. Crosses with letters indicate “phases” from
Table 4.
Table 4.
Chemical analysis of the coating represented in
Figure 7.
Table 4.
Chemical analysis of the coating represented in Figure 7.
| Intensity [cps/eV] “Phase” | Pb | Zr | Ti |
|---|
| Light “phase”
–A | 27 | 11 | 4 |
| Medium “phase”–B | 18 | 17 | 5 |
| Dark “phase”
–C | 10 | 21 | 8 |
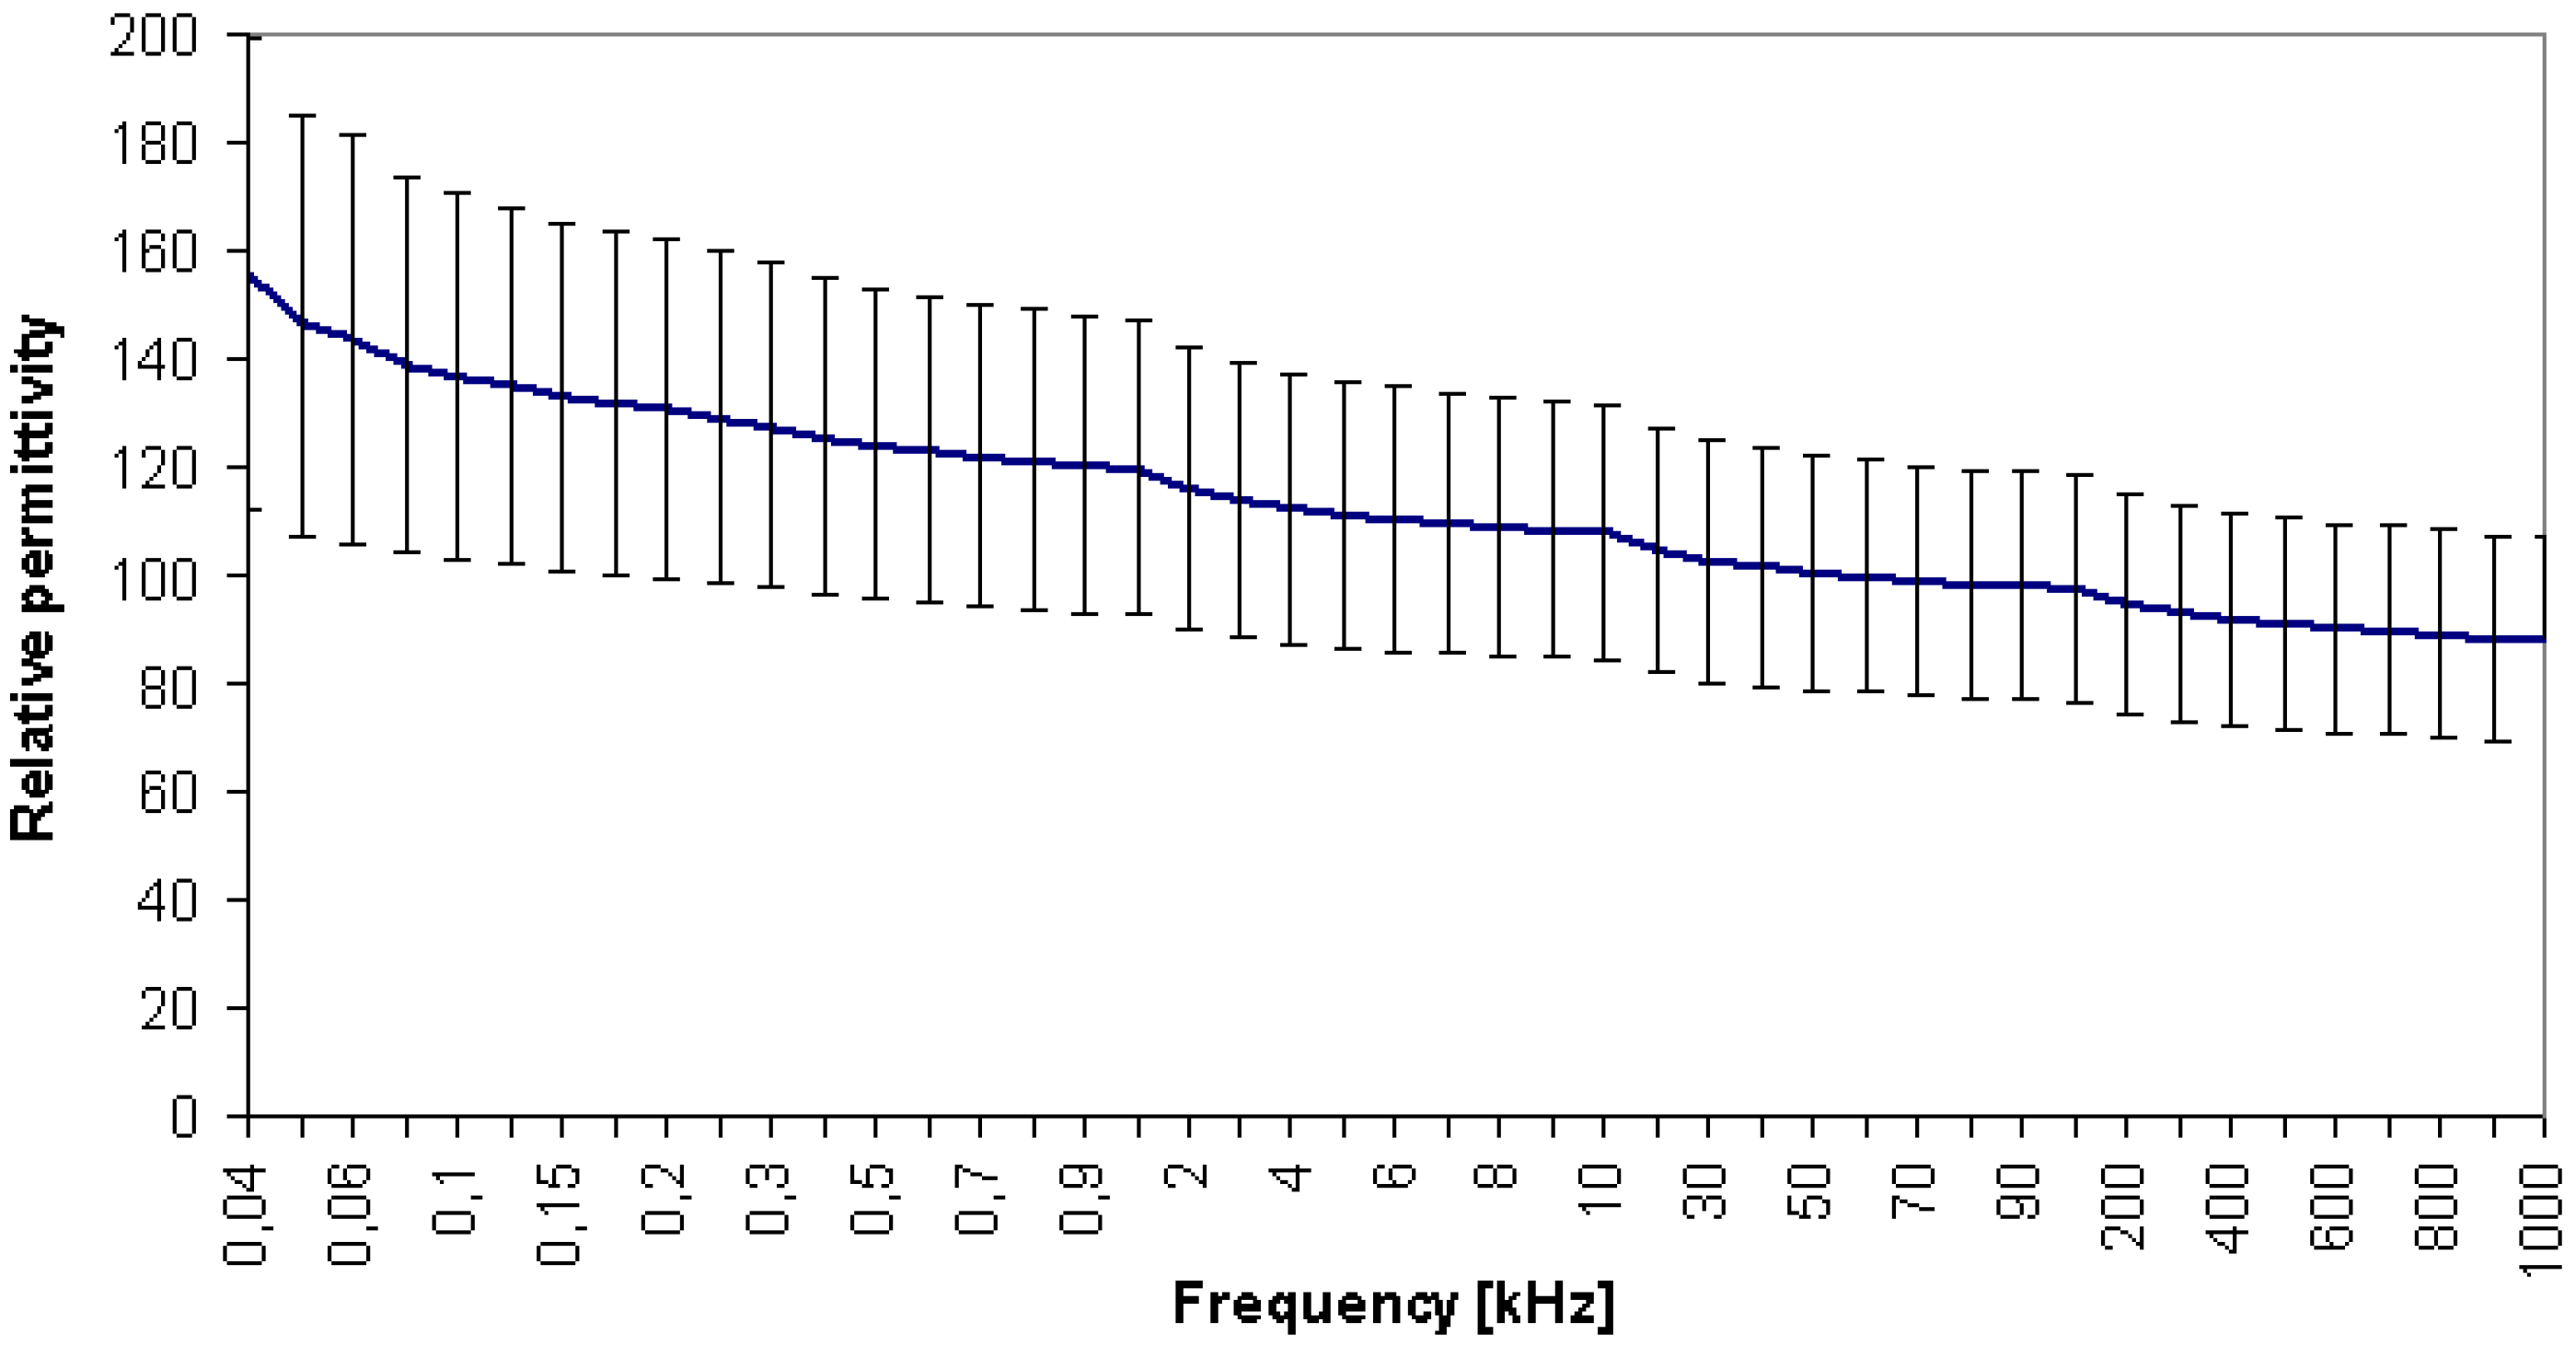
A dependence of the relative permittivity on frequency is displayed in
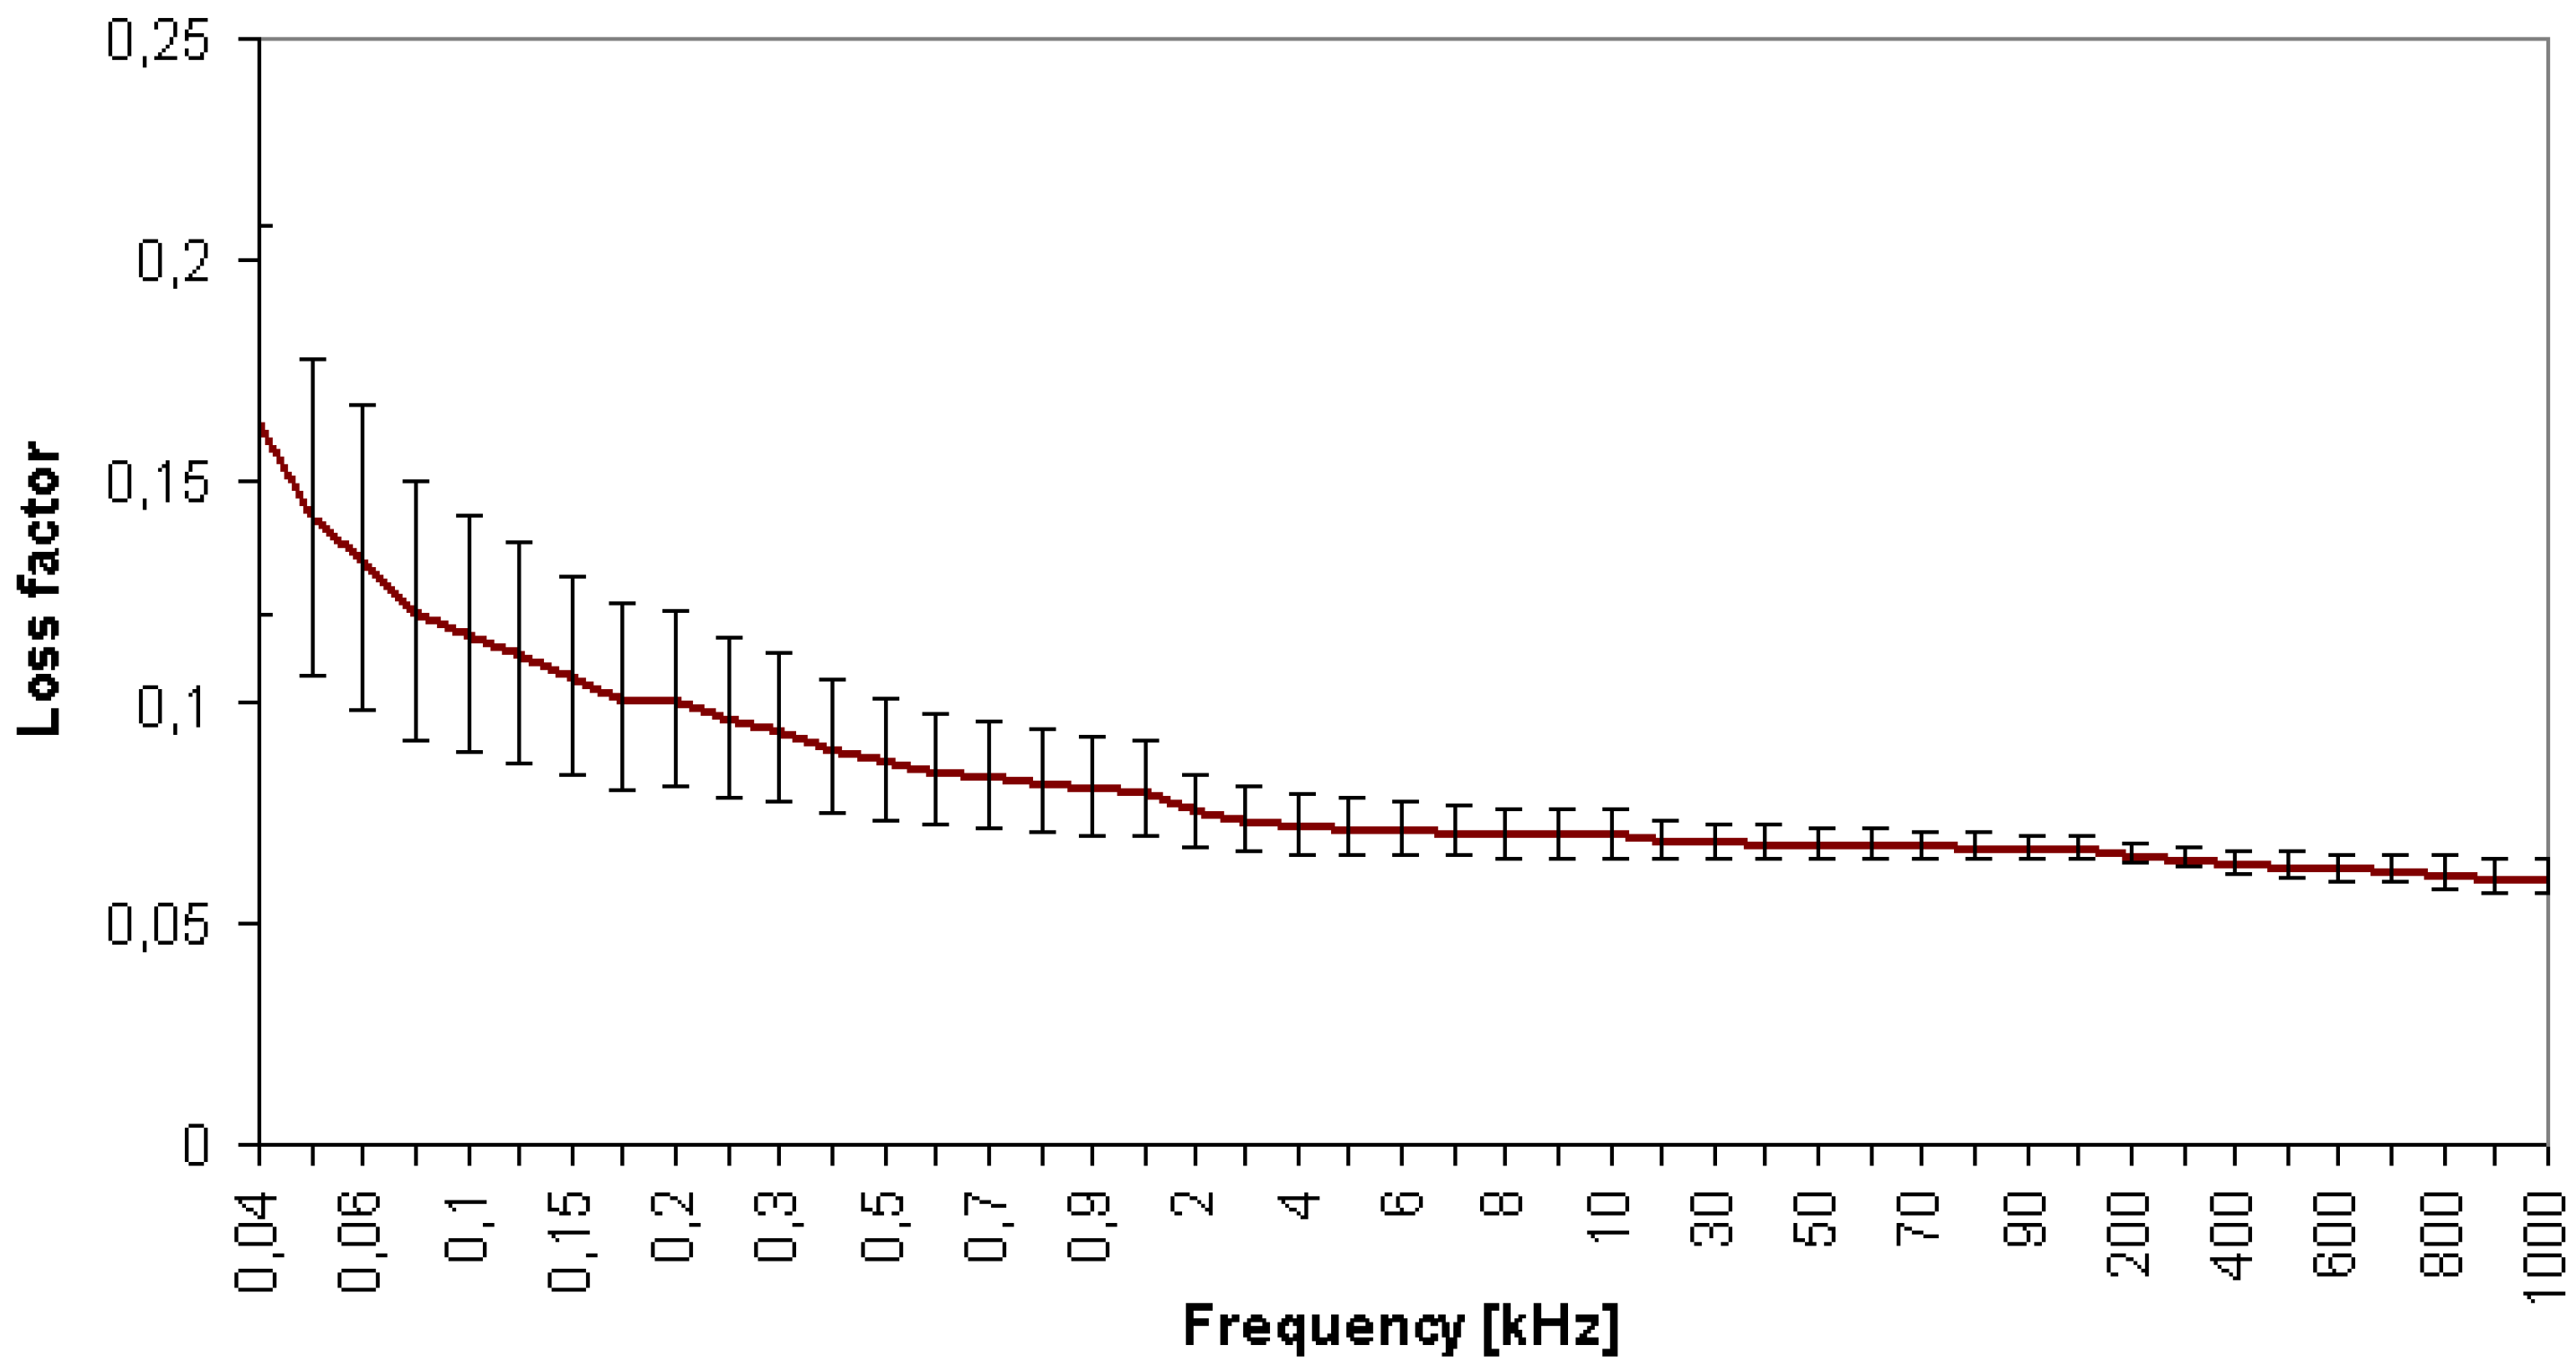
Figure 8 and the loss factor of the coatings is shown in
Figure 9.
Figure 8.
Dependence of the relative permittivity on frequency. Vertical bars indicate the standard deviation.
Figure 8.
Dependence of the relative permittivity on frequency. Vertical bars indicate the standard deviation.
Figure 9.
Dependence of the loss factor on frequency. Vertical bars indicate the standard deviation.
Figure 9.
Dependence of the loss factor on frequency. Vertical bars indicate the standard deviation.
The influence of annealing was studied by XRD,
Figure 3c. Similarly to the as-sprayed coating, tetragonal PbTiO
3 is the dominant phase with intensive {001}, {100}, {101}, {110} reflections observed at 25°, 26°, 38° and 48° in the two theta scale when Co-Kα radiation is used. Cubic ZrO
2.12 is the new detected phase arising probably from the rhombohedral PbZr
0.9Ti
0.1O
3 which is absent in the coating annealed at 750 °C.
4. Discussion
The coating surface
roughness,
Table 2, is a purely inherent feature of the coating and possible copying of the substrate surface due to low coating thickness could be excluded. Both graphite and aluminium, as poorly blasting-resistant materials, had relatively high roughness after blasting. Apparently, the hardest substrate is distinguished by the lowest roughness. The adhesion on Si wafers was ambivalent since it was acceptably good in some cases but at the same time, a certain degree of delamination was detected in several of the coatings.
The
porosity parameters are compared with those of a BaTiO
3 coating produced by atmospheric plasma spraying using a gas-stabilized plasma gun [
10]. The porosity as well as its standard deviation is higher in the case of PZT whereas the mean pore size (expressed as “equivalent diameter”) is comparable. The high porosity of PZT is partly responsible for its low microhardness. Porosity of plasma sprayed coatings is anisotropic [
11,
12], but likewise the presence of pressure during a cold consolidation of powder before sintering could be also responsible for the anisotropic porosity of certain bulk PZT parts [
13]. Such pores are predominantly aligned along the surface and represent a boundary between neighboring splats which affects relative permittivity [
14].
From
Figure 7 it can be said that the light Pb-rich “
phase” is concentrated typically in globular particles whose shape indicates incomplete melting in the plasma [
15]. This is in accordance with the low melting point of Pb-oxides which are missing in the darker domains where lamellar structure, typical for well melted particles, is seen.
Upon selecting bulk PZT with a controlled porosity variation [
7] as a reference material,
relative permittivity of about 220 for 15% porosity is to be observed at 1 kHz. A thick PZT film on a low-temperature co-fired ceramics is reported [
14] to have a relative permittivity of 220. In our experiment, the analyzed coatings have a relative permittivity of 120 ± 28 at a similar porosity level. According to [
16], the low relative permittivity of plasma sprayed PZT is predominantly governed by its porosity, which also holds true for our coatings. The pores could be considered as being filled by air and thus having a relative permittivity equal to one. The material is a combination of the permittivity of a dense bulk and the permittivity of air in pores. In the case of our coatings, this “dense bulk” is however not PZT but namely the other detected phases (
Table 1)–all of them having lower (but not exactly known) permittivity than PZT. Hence, the measured permittivity values are low.
It was observed that the
dielectric loss decreased as the frequency increased–the same trend is documented in the literature, e.g., from 100 Hz to 15 MHz [
17]. Moreover, the decrease is pronounced in the low frequency range below 1 kHz, being in accordance with [
18].
After annealing at 750 °C (the sample was on a Si substrate), PbZr0.9Ti0.1O3 decomposed and a new phase, ZrO2.12 was detected. Cubic ZrO2 was detected by XRD before and also after annealing. Silicon oxide is a product of the substrate oxidation.
After annealing of a free-standing body at 850 °C the sample consisted of PbZr
0.58Ti
0.42O
3, PbZr
0.9Ti
0.1O
3 and PbO phases. Also, the nearly morphotropic PZT phase (PbZr
0.58Ti
0.42O
3) was partly reconstituted. No products of a reaction between PZT components and the Si substrate were detected since the threshold temperature above 900 °C was not achieved [
2].


