Bioaccessibility and Cellular Uptake of β-Carotene Encapsulated in Model O/W Emulsions: Influence of Initial Droplet Size and Emulsifiers


Abstract
:
1. Introduction
2. Material and Methods
2.1. Materials
2.2. Emulsion Preparation
2.2.1. Preparation of BC-Loaded Emulsions with Different Droplet Sizes
2.2.2. Preparation of BC-Loaded Emulsions with Different Emulsifiers
2.2.3. Characterization of Droplet Size and Surface Charge
2.3. Rheological Analysis
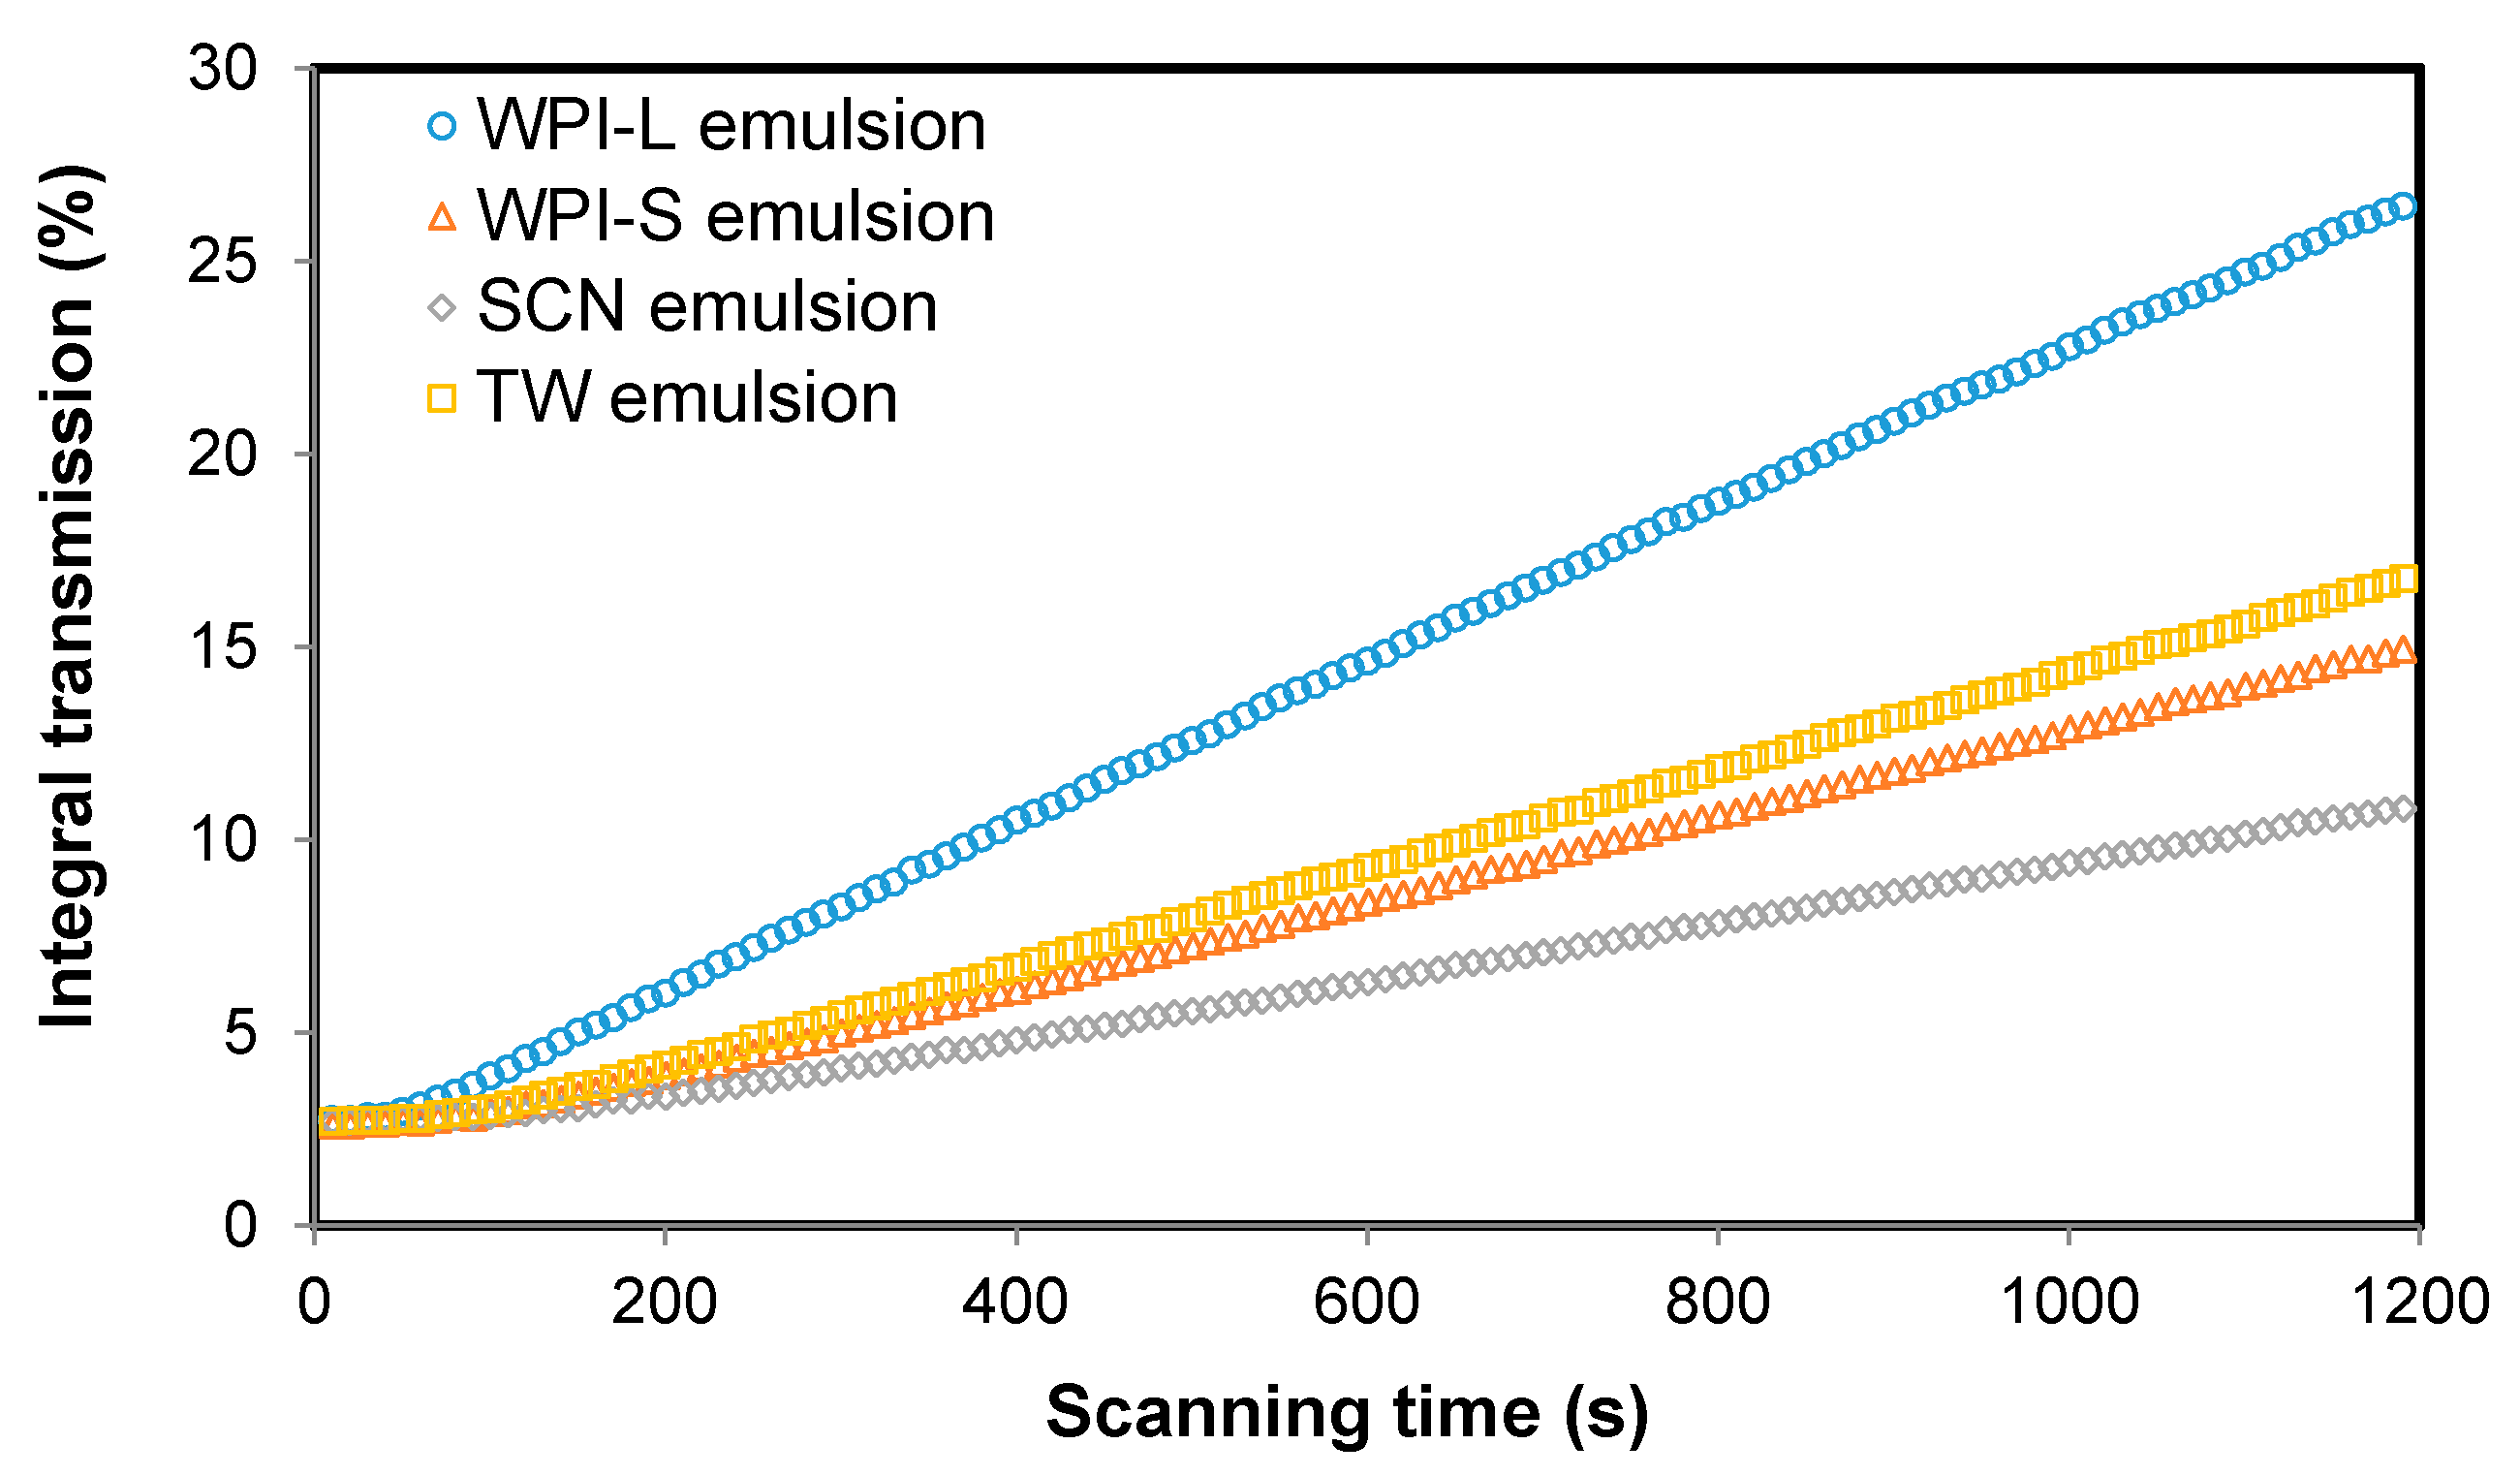
2.4. Creaming Stability
2.5. In Vitro Simulated GIT Digestion
2.6. In Vitro Bioaccessibility of BC
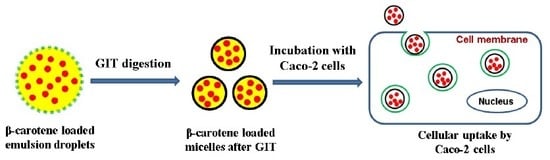
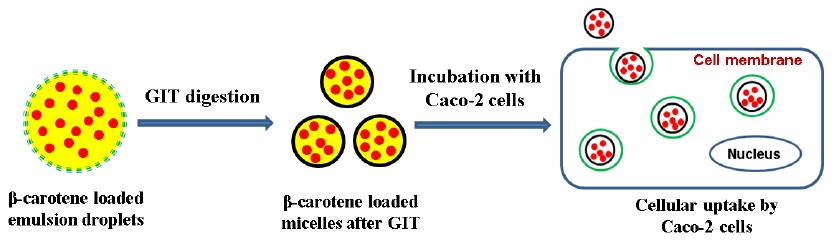
2.7. Cellular Uptake by Caco-2 Cells
2.8. Extraction of BC
2.9. HPLC Analysis of BC
2.10. Statistical Analysis
3. Results and Discussion
3.1. Characterization of Emulsions
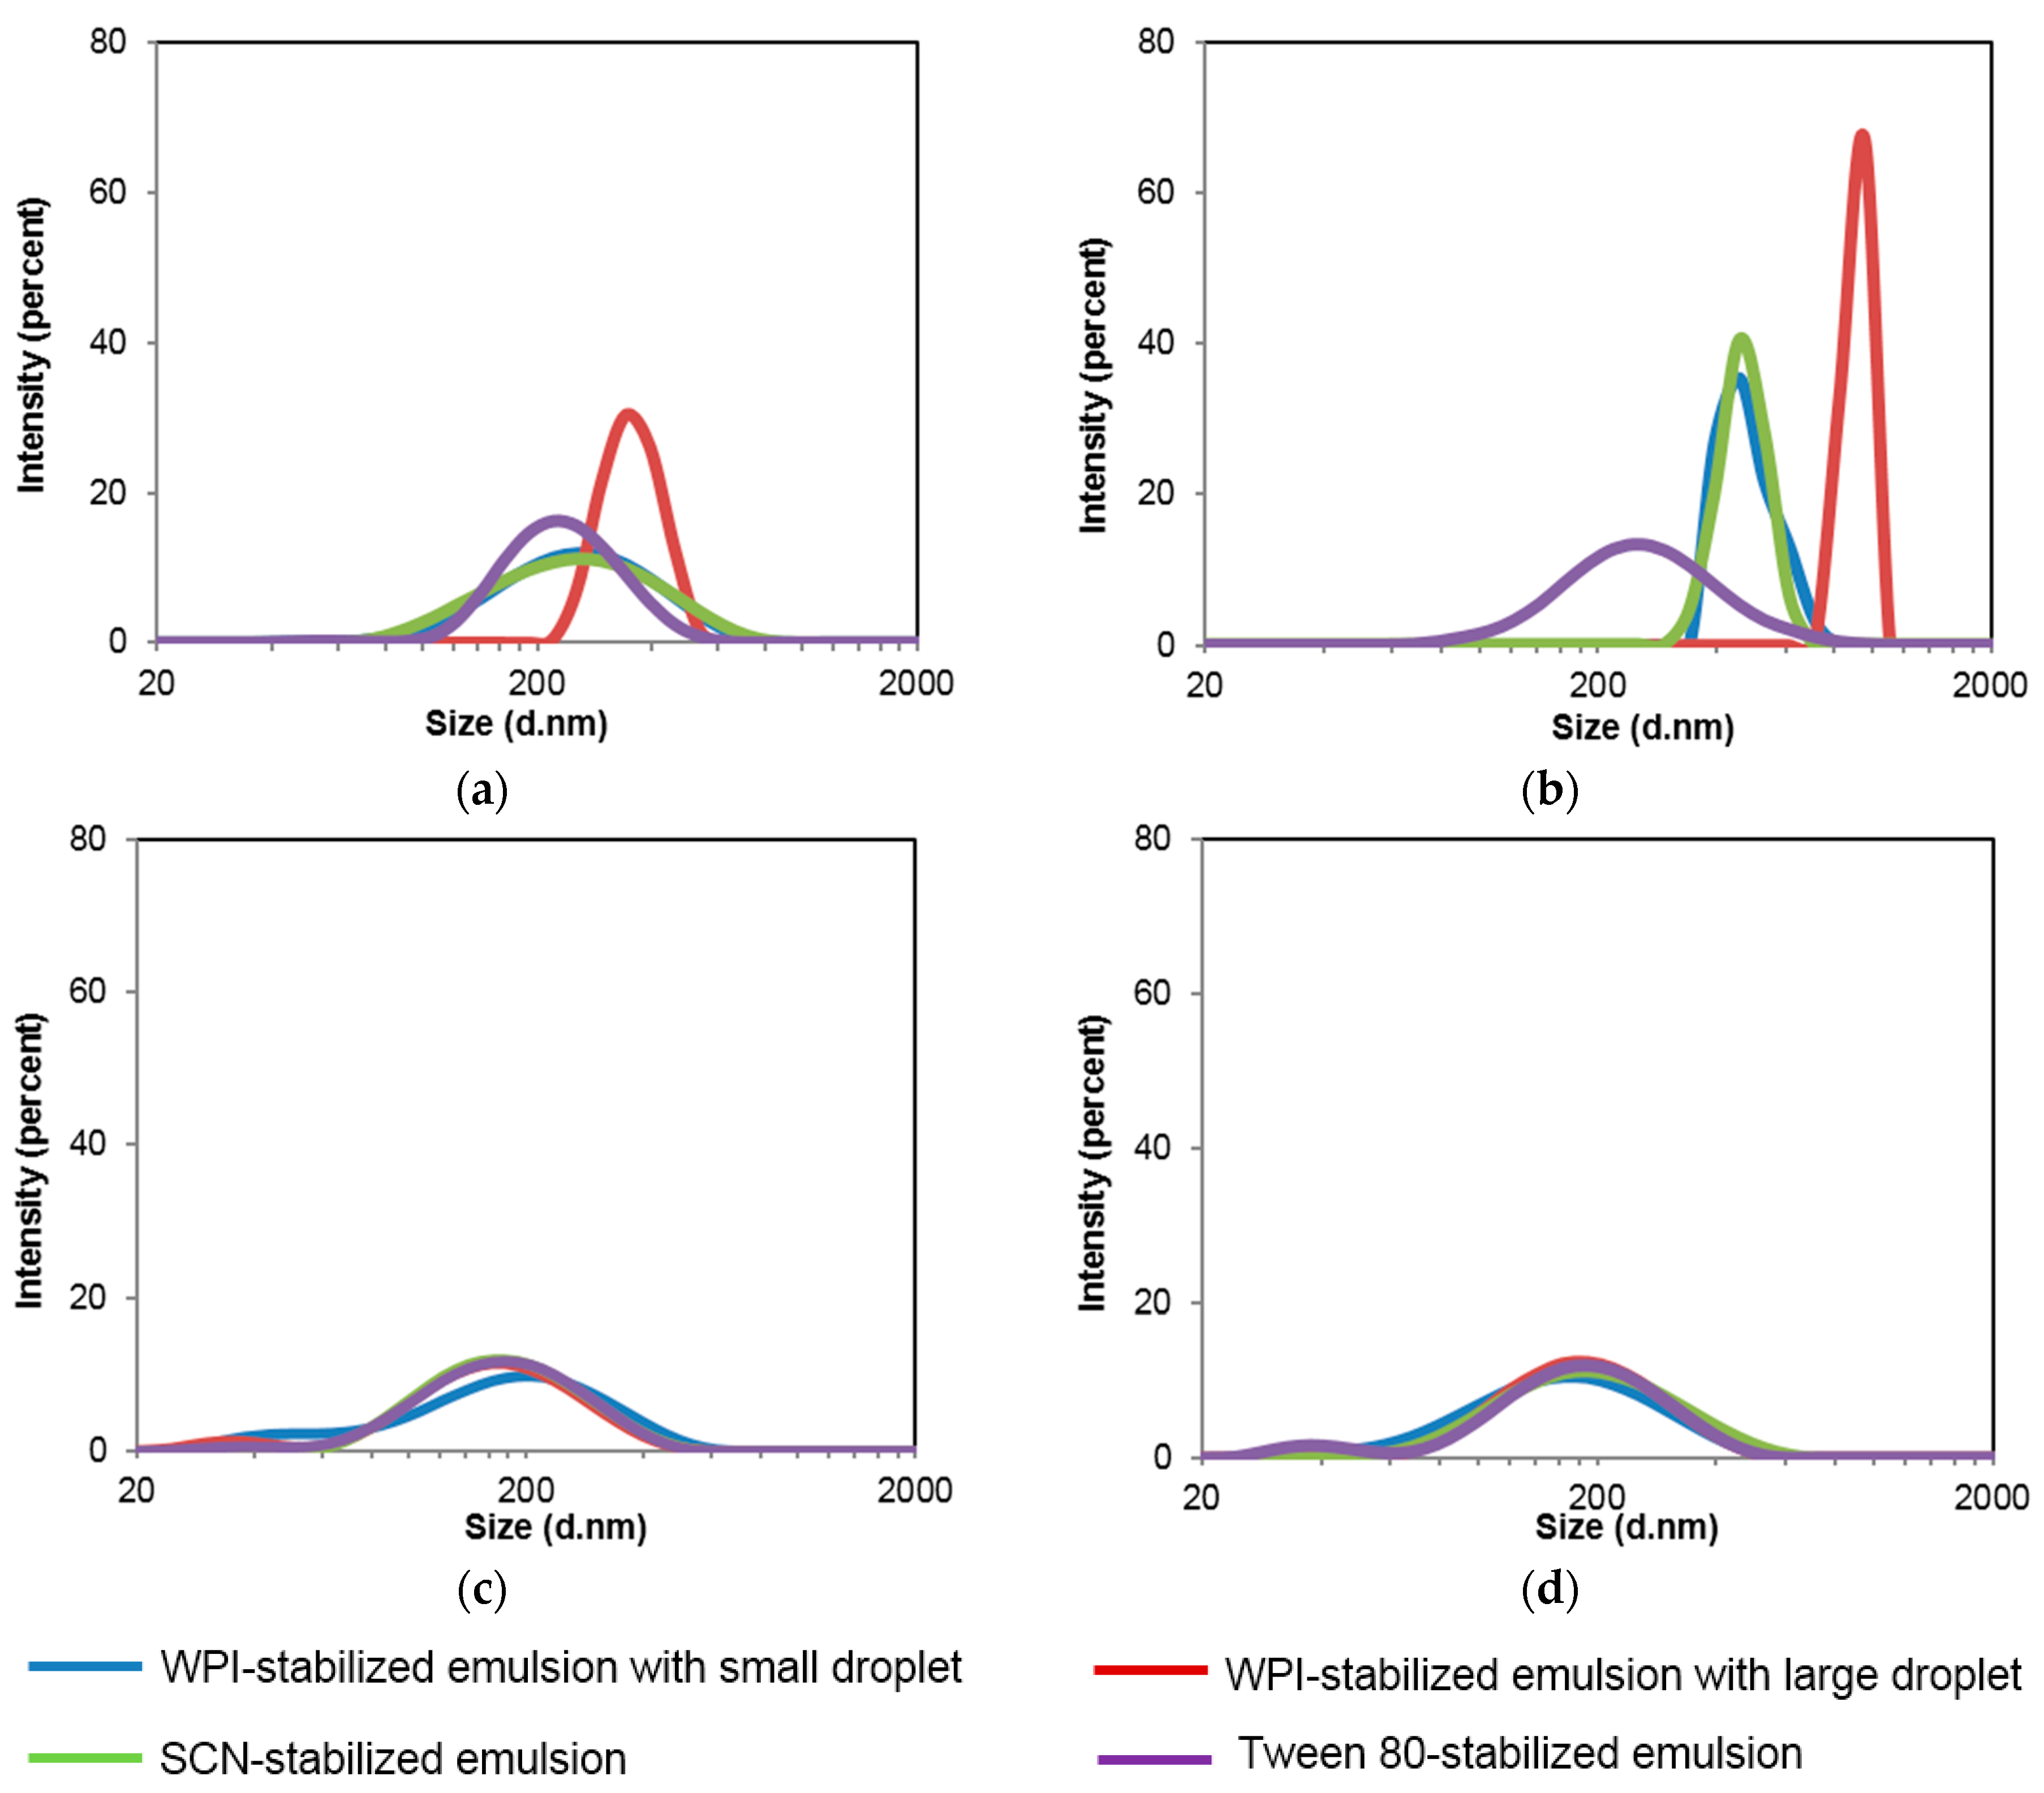
3.2. Characterization of Emulsions after Being Exposed to GIT Digestion
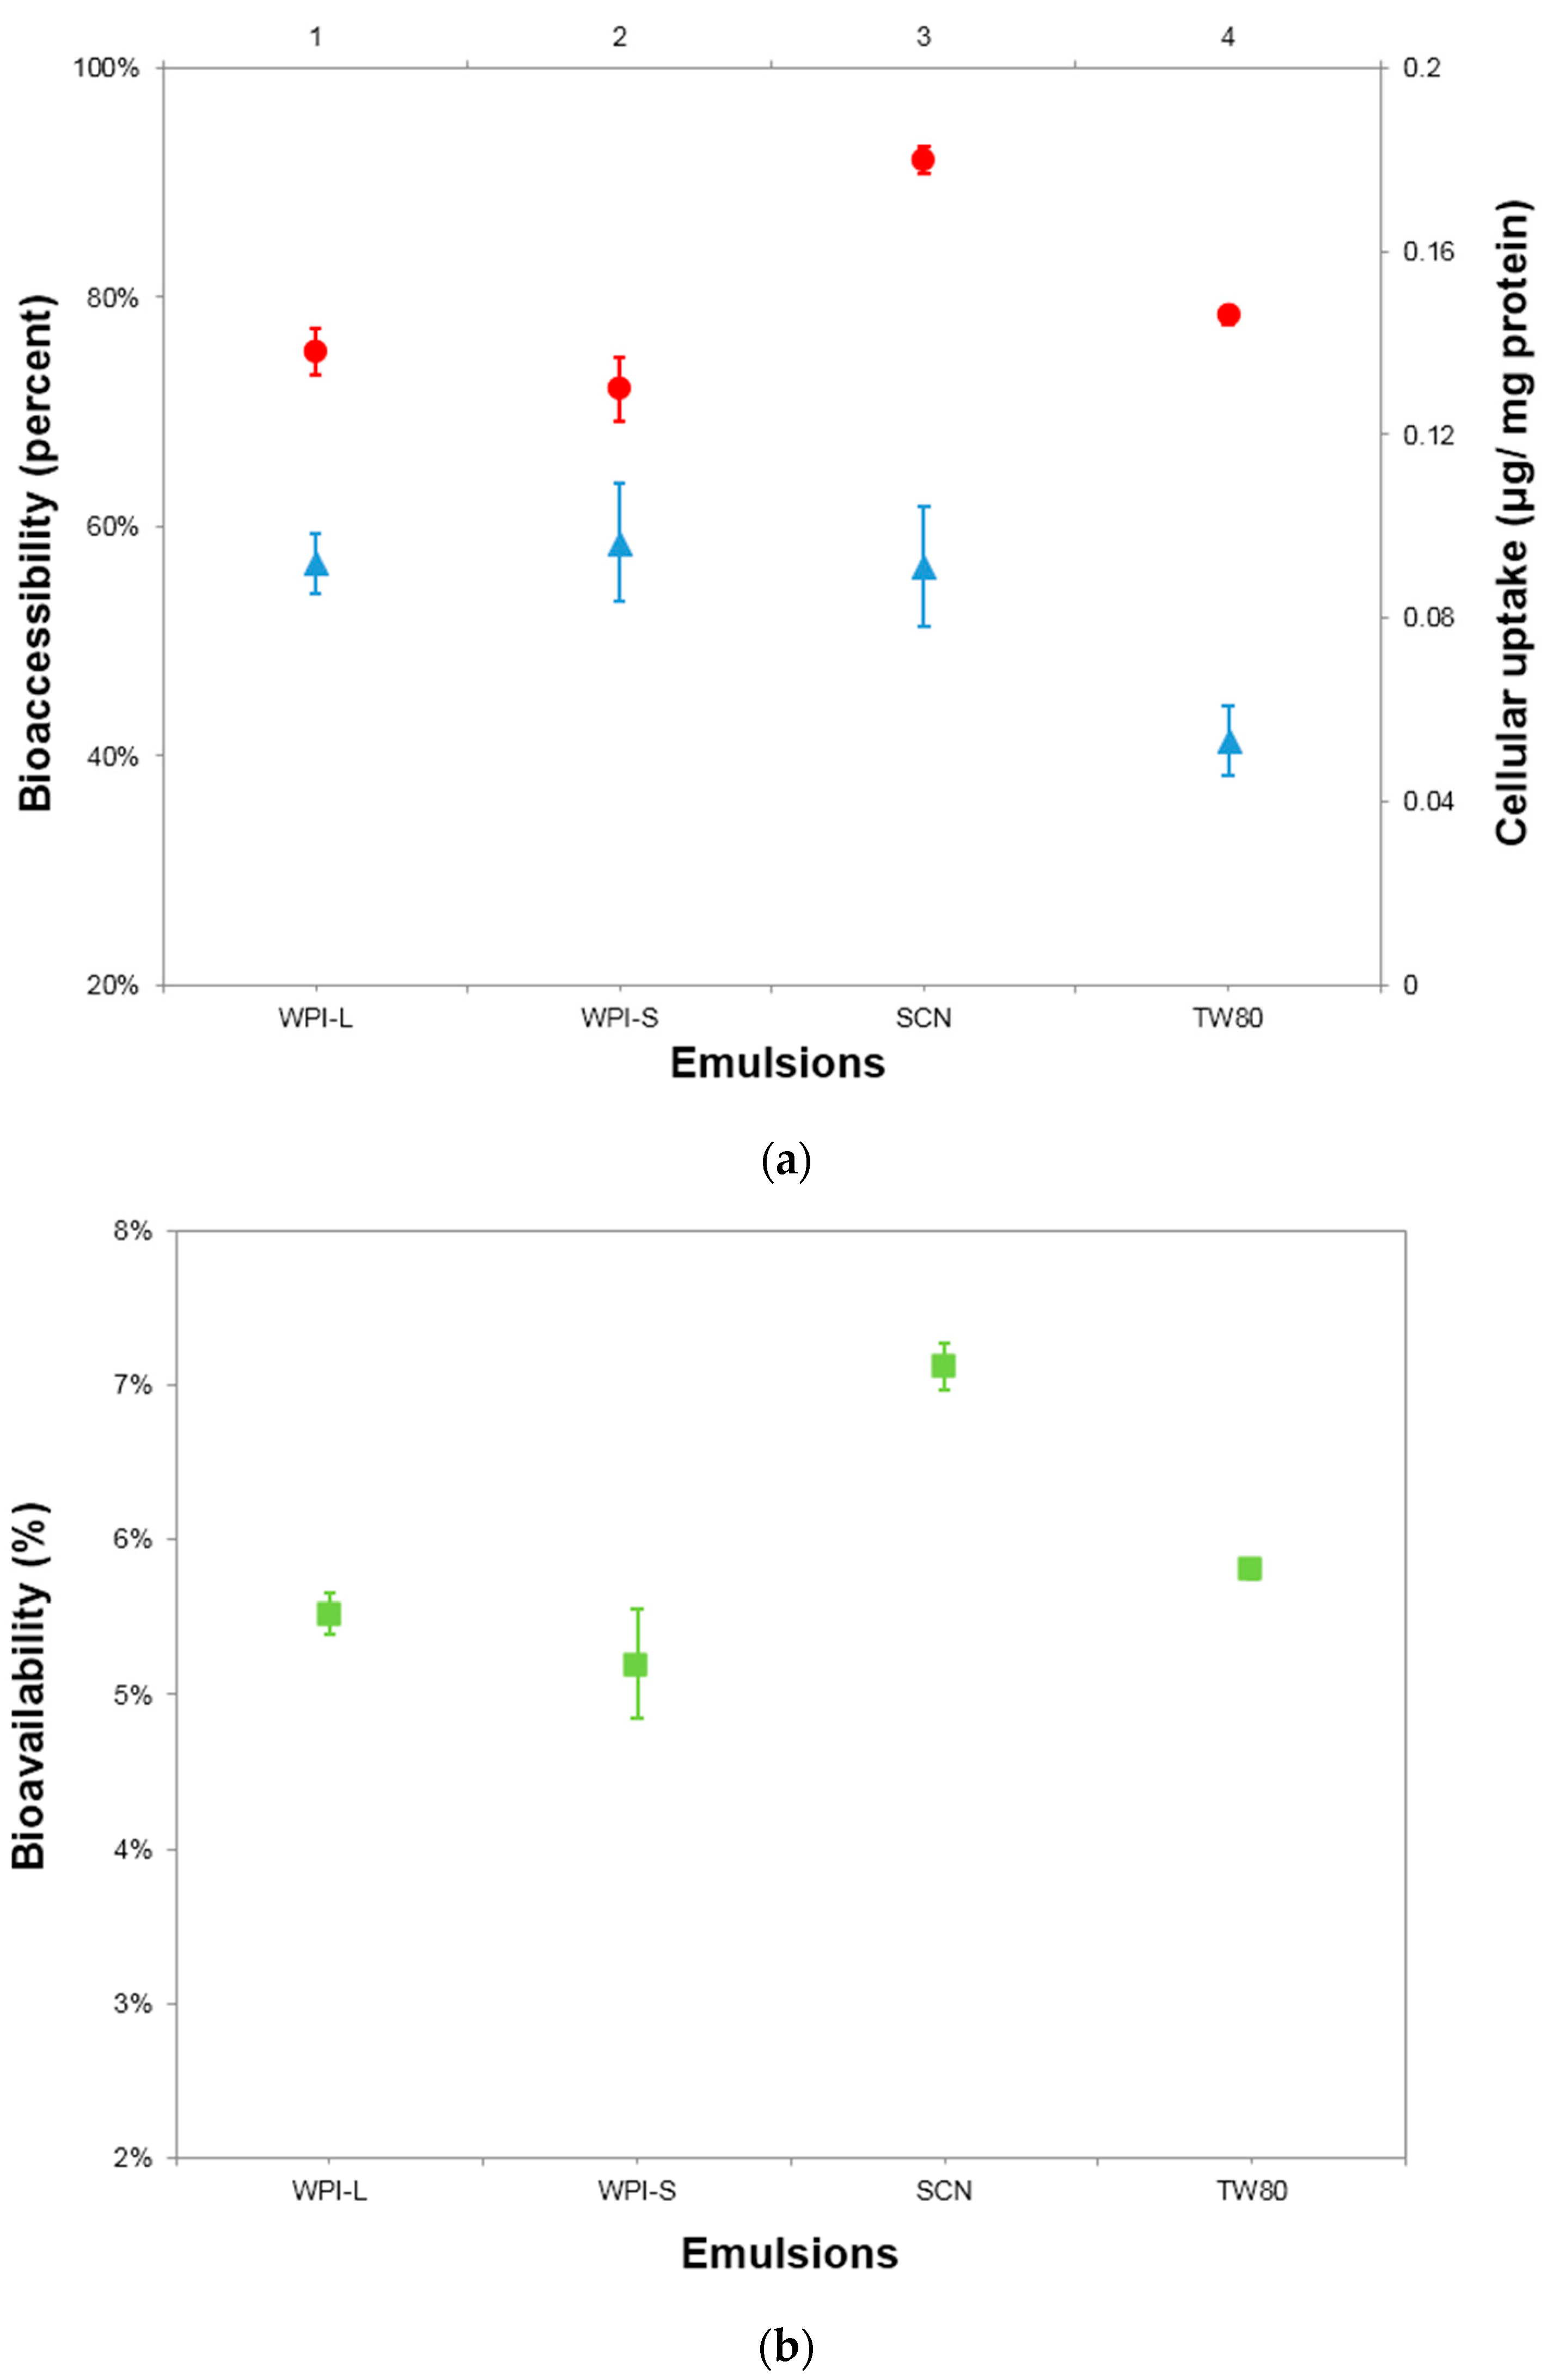
3.3. In Vitro Bioaccessibility of BC
3.4. Cellular Uptake of BC
4. Conclusions
Acknowledgments
Author Contributions
Conflicts of Interest
References
- Gerster, H. Anticarcinogenic effect of common carotenoids. Int. J. Vitam. Nutr. Res. 1993, 63, 93–121. [Google Scholar] [PubMed]
- Von Lintig, J. Colors with functions: Elucidating the biochemical and molecular basis of carotenoid metabolism. Annu. Rev. Nutr. 2010, 30, 35–56. [Google Scholar] [CrossRef] [PubMed]
- Qian, C.; Decker, E.A.; Xiao, H.; McClements, D.J. Physical and chemical stability of β-carotene-enriched nanoemulsions: Influence of pH, ionic strength, temperature, and emulsifier type. Food Chem. 2012, 132, 1221–1229. [Google Scholar] [CrossRef]
- Lu, W.; Kelly, A.L.; Miao, S. Emulsion-based encapsulation and delivery systems for polyphenols. Trends Food Sci. Technol. 2016, 47, 1–9. [Google Scholar] [CrossRef]
- McClements, D.J.; Decker, E.A.; Weiss, J. Emulsion-based delivery systems for lipophilic bioactive components. J. Food Sci. 2007, 72, R109–R124. [Google Scholar] [CrossRef] [PubMed]
- Pool, H.; Mendoza, S.; Xiao, H.; McClements, D.J. Encapsulation and release of hydrophobic bioactive components in nanoemulsion-based delivery systems: Impact of physical form on quercetin bioaccessibility. Food Funct. 2013, 4, 162–174. [Google Scholar] [CrossRef] [PubMed]
- Lu, W.; Kelly, A.L.; Miao, S. Improved Bioavailability of Encapsulated Bioactive Nutrients Delivered through Monoglyceride-Structured O/W Emulsions. J. Agric. Food Chem. 2017, 65, 3048–3055. [Google Scholar] [CrossRef] [PubMed]
- Hur, S.J.; Decker, E.A.; McClements, D.J. Influence of initial emulsifier type on microstructural changes occurring in emulsified lipids during in vitro digestion. Food Chem. 2009, 114, 253–262. [Google Scholar] [CrossRef]
- Hou, Z.; Liu, Y.; Lei, F.; Gao, Y. Investigation into the in vitro release properties of β-carotene in emulsions stabilized by different emulsifiers. LWT Food Sci. Technol. 2014, 59, 867–873. [Google Scholar] [CrossRef]
- Salvia-Trujillo, L.; Qian, C.; Martin-Belloso, O.; McClements, D.J. Influence of particle size on lipid digestion and beta-carotene bioaccessibility in emulsions and nanoemulsions. Food Chem. 2013, 141, 1472–1480. [Google Scholar] [CrossRef] [PubMed]
- Mao, Y.; Dubot, M.; Xiao, H.; McClements, D.J. Interfacial engineering using mixed protein systems: Emulsion-based delivery systems for encapsulation and stabilization of beta-carotene. J. Agric. Food Chem. 2013, 61, 5163–5169. [Google Scholar] [CrossRef] [PubMed]
- Qian, C.; Decker, E.A.; Xiao, H.; McClements, D.J. Nanoemulsion delivery systems: Influence of carrier oil on beta-carotene bioaccessibility. Food Chem. 2012, 135, 1440–1447. [Google Scholar] [CrossRef] [PubMed]
- Salvia-Trujillo, L.; Fumiaki, B.; Park, Y.; McClements, D.J. The influence of lipid droplet size on the oral bioavailability of vitamin D2 encapsulated in emulsions: An in vitro and in vivo study. Food Funct. 2017, 8, 767–777. [Google Scholar] [CrossRef] [PubMed]
- Mao, L.; O’Kennedy, B.T.; Roos, Y.H.; Hannon, J.A.; Miao, S. Effect of monoglyceride self-assembled structure on emulsion properties and subsequent flavor release. Food Res. In. 2012, 48, 233–240. [Google Scholar] [CrossRef]
- Gupta, A.; Eral, H.B.; Hatton, T.A.; Doyle, P.S. Nanoemulsions: Formation, properties and applications. Soft Matter 2016, 12, 2826–2841. [Google Scholar] [CrossRef] [PubMed]
- Choudhury, H.; Gorain, B.; Karmakar, S.; Biswas, E.; Dey, G.; Barik, R.; Mandal, M.; Pal, T.K. Improvement of cellular uptake, in vitro antitumor activity and sustained release profile with increased bioavailability from a nanoemulsion platform. Int.J. Pharm. 2014, 460, 131–143. [Google Scholar] [CrossRef] [PubMed]
- Sharma, S.; Sahni, J.K.; Ali, J.; Baboota, S. Effect of high-pressure homogenization on formulation of TPGS loaded nanoemulsion of rutin—Pharmacodynamic and antioxidant studies. Drug Deliv. 2015, 22, 541–551. [Google Scholar] [CrossRef] [PubMed]
- Shafiq, S.; Shakeel, F.; Talegaonkar, S.; Ahmad, F.J.; Khar, R.K.; Ali, M. Development and bioavailability assessment of ramipril nanoemulsion formulation. Eur. J. Pharm. Biopharm. 2007, 66, 227–243. [Google Scholar] [CrossRef] [PubMed]
- Lu, W.; Kelly, A.L.; Maguire, P.; Zhang, H.; Stanton, C.; Miao, S. Correlation of Emulsion Structure with Cellular Uptake Behavior of Encapsulated Bioactive Nutrients: Influence of Droplet Size and Interfacial Structure. J. Agric. Food Chem. 2016, 64, 8659–8666. [Google Scholar] [CrossRef] [PubMed]
- Mao, L.; Roos, Y.H.; O’Callaghan, D.J.; Miao, S. Volatile release from whey protein isolate-pectin multilayer stabilized emulsions: effect of pH, salt, and artificial salivas. J. Agric. Food Chem. 2013, 61, 6231–6239. [Google Scholar] [CrossRef] [PubMed]
- McClements, D.J. Food Emulsions: Principles, Practices, and Techniques, 3rd ed.; CRC Press: New York, NY, USA, 2015. [Google Scholar]
- Cho, H.T.; Salvia-Trujillo, L.; Kim, J.; Park, Y.; Xiao, H.; McClements, D.J. Droplet size and composition of nutraceutical nanoemulsions influences bioavailability of long chain fatty acids and Coenzyme Q10. Food Chem. 2014, 156, 117–122. [Google Scholar] [CrossRef] [PubMed]
- Plou, F.J.; Ferrer, M.; Nuero, O.M.; Calvo, M.V.; Alcalde, M.; Reyes, F.; Ballesteros, A. Analysis of Tween 80 as an esterase/lipase substrate for lipolytic activity assay. Biotechnol. Tech. 1998, 12, 183–186. [Google Scholar] [CrossRef]
- Livney, Y.D. Milk proteins as vehicles for bioactives. Curr. Opin. Colloid Interface Sci. 2010, 15, 73–83. [Google Scholar] [CrossRef]
- Joye, I.J.; Davidov-Pardo, G.; McClements, D.J. Nanotechnology for increased micronutrient bioavailability. Trends Food Sci. Technol. 2014, 40, 168–182. [Google Scholar] [CrossRef]


| Emulsions | Size (d nm) | Zeta Potential (mV) | Polydispersity Index (PdI) | Viscosity (mPa·s) | Creaming Index |
|---|---|---|---|---|---|
| WPI-L | 472 ± 20 a | −53.2 ± 1.7 a | 0.24 ± 0.07 a | 1.78 ± 0.02 b | 0.327 ± 0.007 a |
| WPI-S | 205 ± 4 b | −52.7 ± 0.6 a | 0.24 ± 0.03 a | 1.76 ± 0.02 b | 0.169 ± 0.003 c |
| SCN | 223 ± 12 b | −52.1 ± 0.7 a | 0.18 ± 0.02 b | 1.94 ± 0.02 a | 0.111 ± 0.002 d |
| TW | 227 ± 12 b | −25.1 ± 0.5 b | 0.22 ± 0.01 a | 1.72 ± 0.02 b | 0.193 ± 0.005 b |
| Emulsion | Droplet Size (d nm) | Zeta Potential (mV) | Polydispersity Index (PdI) | ||||||
|---|---|---|---|---|---|---|---|---|---|
| Mouse Phase | Gastric Phase | Intestinal Phase | Mouse Phase | Gastric Phase | Intestinal Phase | Mouse Phase | Gastric Phase | Intestinal Phase | |
| WPI-S | 224 ± 11 b | 774 ± 16 b | 148 ± 12 a | −51.7 ± 0.6 a | 17.6 ± 0.9 a | −64.3 ± 7.0 a | 0.20 ± 0.02 b | 0.71 ± 0.03 b | 0.38 ± 0.01 a |
| WPI-L | 471 ± 11 a | 1256 ± 242 a | 153 ± 9 a | −53.3 ± 1.6 a | 11.1 ± 0.5 b | 64.0 ± 0.4 a | 0.31 ± 0.09 a | 1.0 ± 0.00 a | 0.32 ± 0.04 a |
| SCN | 224 ± 13 b | 747 ± 20 b | 166 ± 8 a | −55.1 ± 0.4 a | 9.0 ± 0.5 b | −60.5 ± 3.3 a | 0.19 ± 0.00 b | 0.70 ± 0.07 b | 0.23 ± 0.00c |
| TW80 | 229 ± 6 b | 233 ± 8c | 157 ± 9 a | −14.3 ± 0.7 b | 0.51 ± 0.0c | −62.1 ± 1.0 a | 0.16 ± 0.04 b | 0.19 ± 0.01c | 0.29 ± 0.04 b |
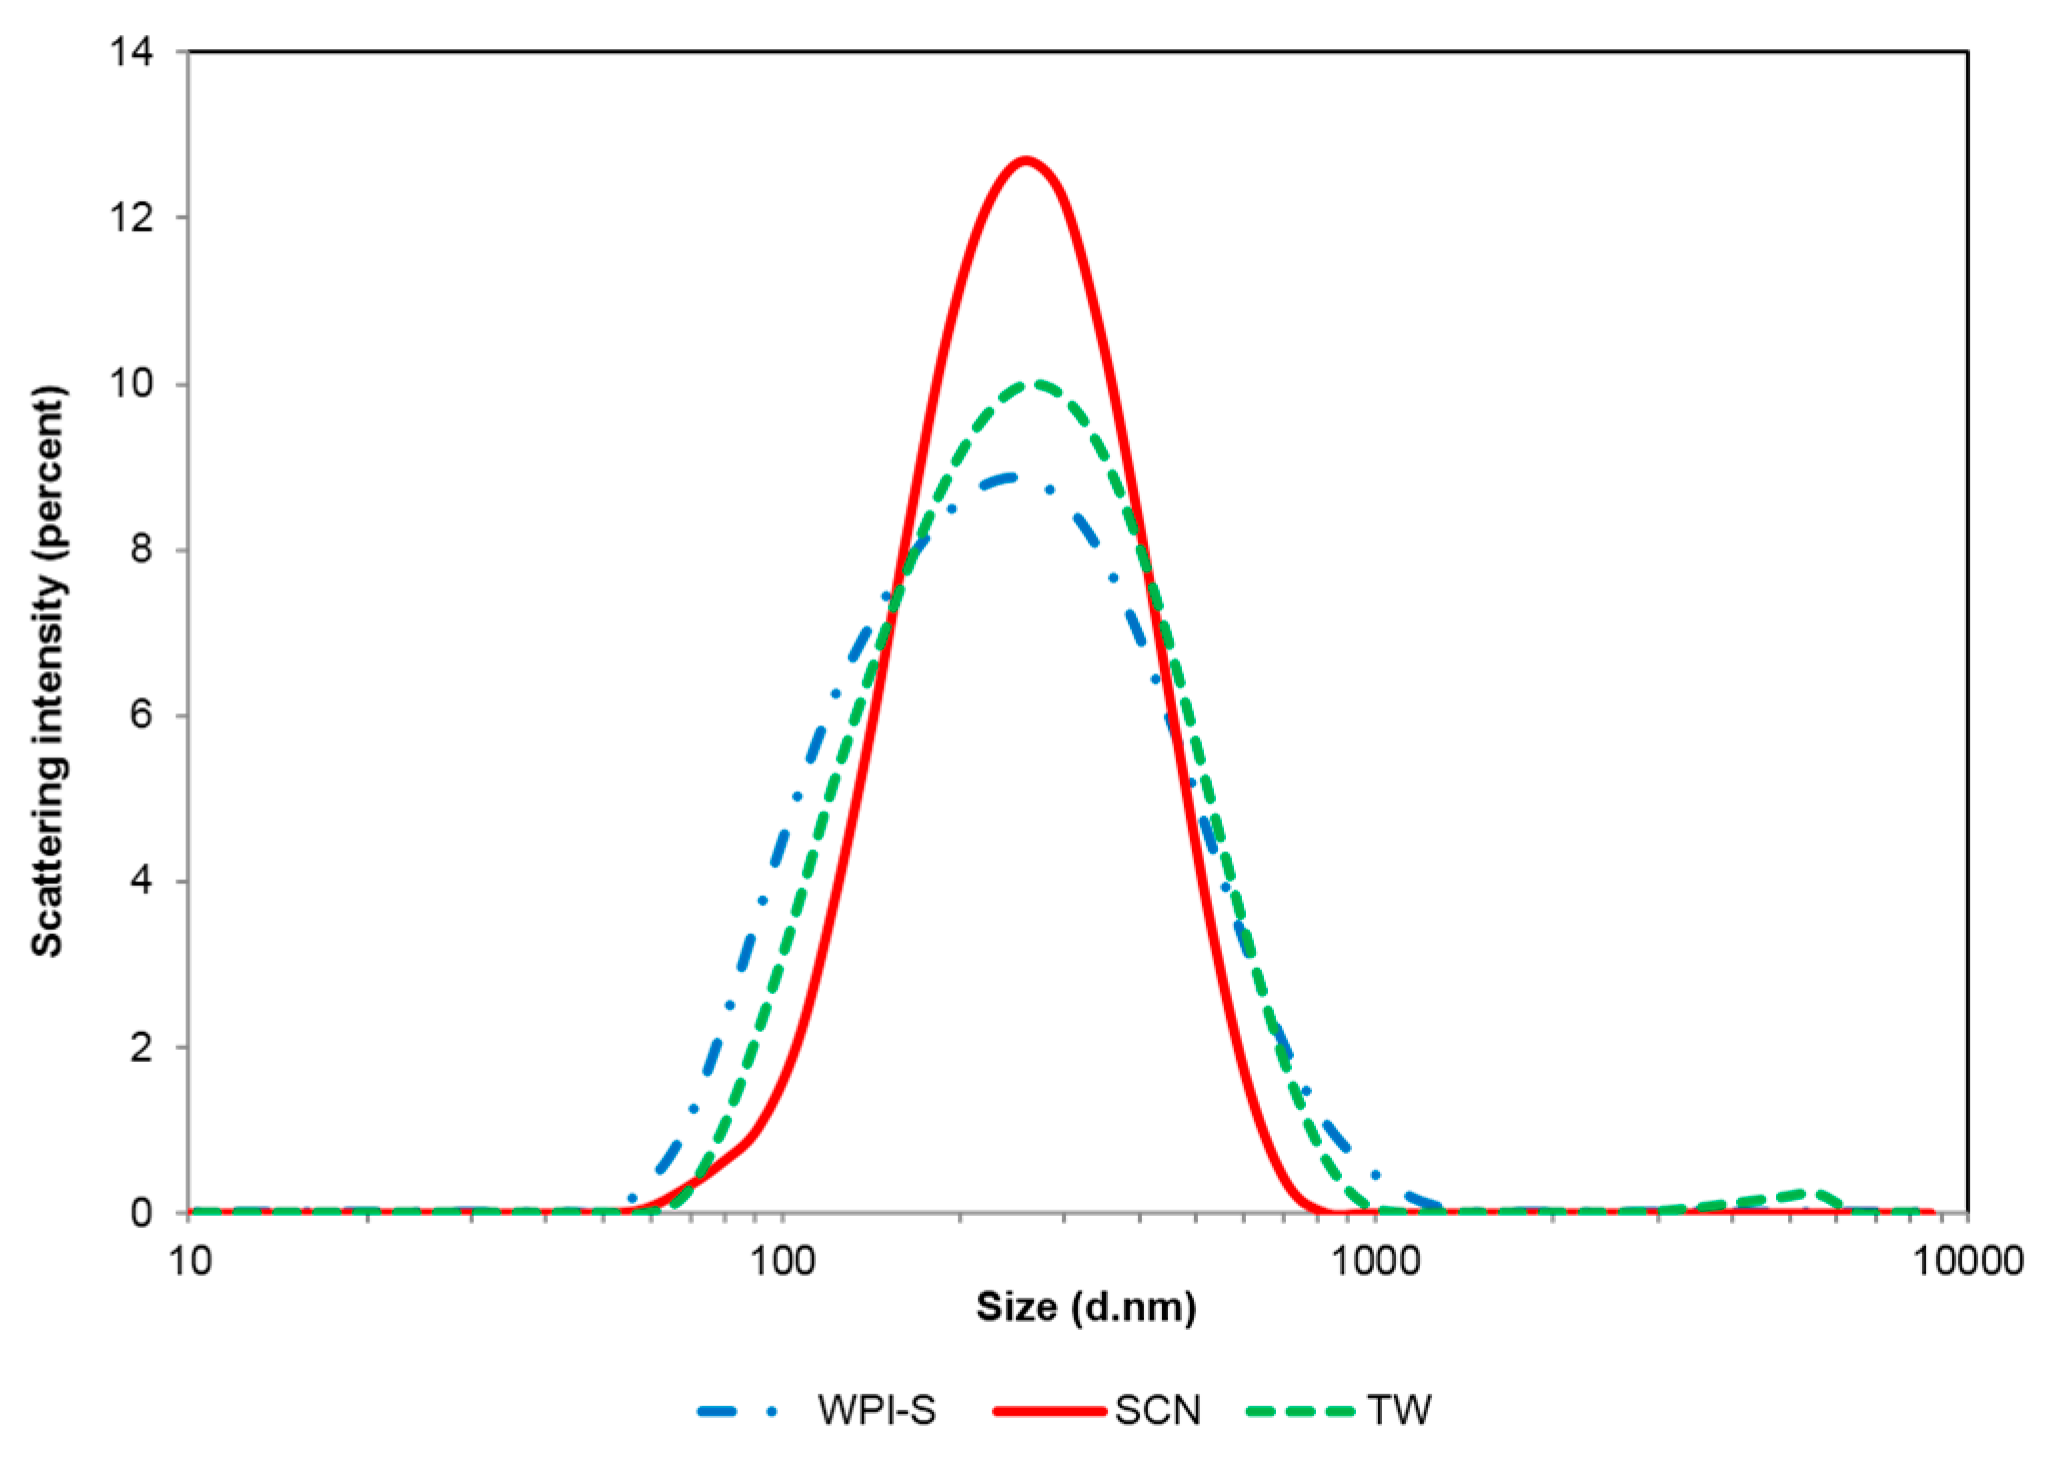
| Micelles | Size (d nm) | ZP (mV) |
|---|---|---|
| WPI-L | 158 ± 3 a | −65.0 ± 0.5 a |
| WPI-S | 142 ± 6 b | −64.2 ± 0.7 a |
| SCN | 160 ± 10 a | −61.1 ± 3.3 a |
| TW | 156 ± 7 a | −63.0 ± 1.0 a |
© 2017 by the authors. Licensee MDPI, Basel, Switzerland. This article is an open access article distributed under the terms and conditions of the Creative Commons Attribution (CC BY) license (http://creativecommons.org/licenses/by/4.0/).
Share and Cite
Lu, W.; Kelly, A.L.; Miao, S. Bioaccessibility and Cellular Uptake of β-Carotene Encapsulated in Model O/W Emulsions: Influence of Initial Droplet Size and Emulsifiers. Nanomaterials 2017, 7, 282. https://doi.org/10.3390/nano7090282
Lu W, Kelly AL, Miao S. Bioaccessibility and Cellular Uptake of β-Carotene Encapsulated in Model O/W Emulsions: Influence of Initial Droplet Size and Emulsifiers. Nanomaterials. 2017; 7(9):282. https://doi.org/10.3390/nano7090282
Chicago/Turabian StyleLu, Wei, Alan L. Kelly, and Song Miao. 2017. "Bioaccessibility and Cellular Uptake of β-Carotene Encapsulated in Model O/W Emulsions: Influence of Initial Droplet Size and Emulsifiers" Nanomaterials 7, no. 9: 282. https://doi.org/10.3390/nano7090282