
Structural Changes Induced in Grapevine (Vitis vinifera L.) DNA by Femtosecond IR Laser Pulses: A Surface-Enhanced Raman Spectroscopic Study

 ,
,
Abstract
:
1. Introduction
2. Materials and Methods
2.1. DNA Extraction
2.2. Surface-Enhanced Raman Spectroscopy
2.2.1. Preparation of DNA-Nanoparticle Complexes
2.2.2. Instrumentation
2.3. Femtosecond Laser System
2.4. UV-Vis Characterization of DNA-Silver Nanoparticle Complexes
2.5. Computational Details
3. Results and Discussion
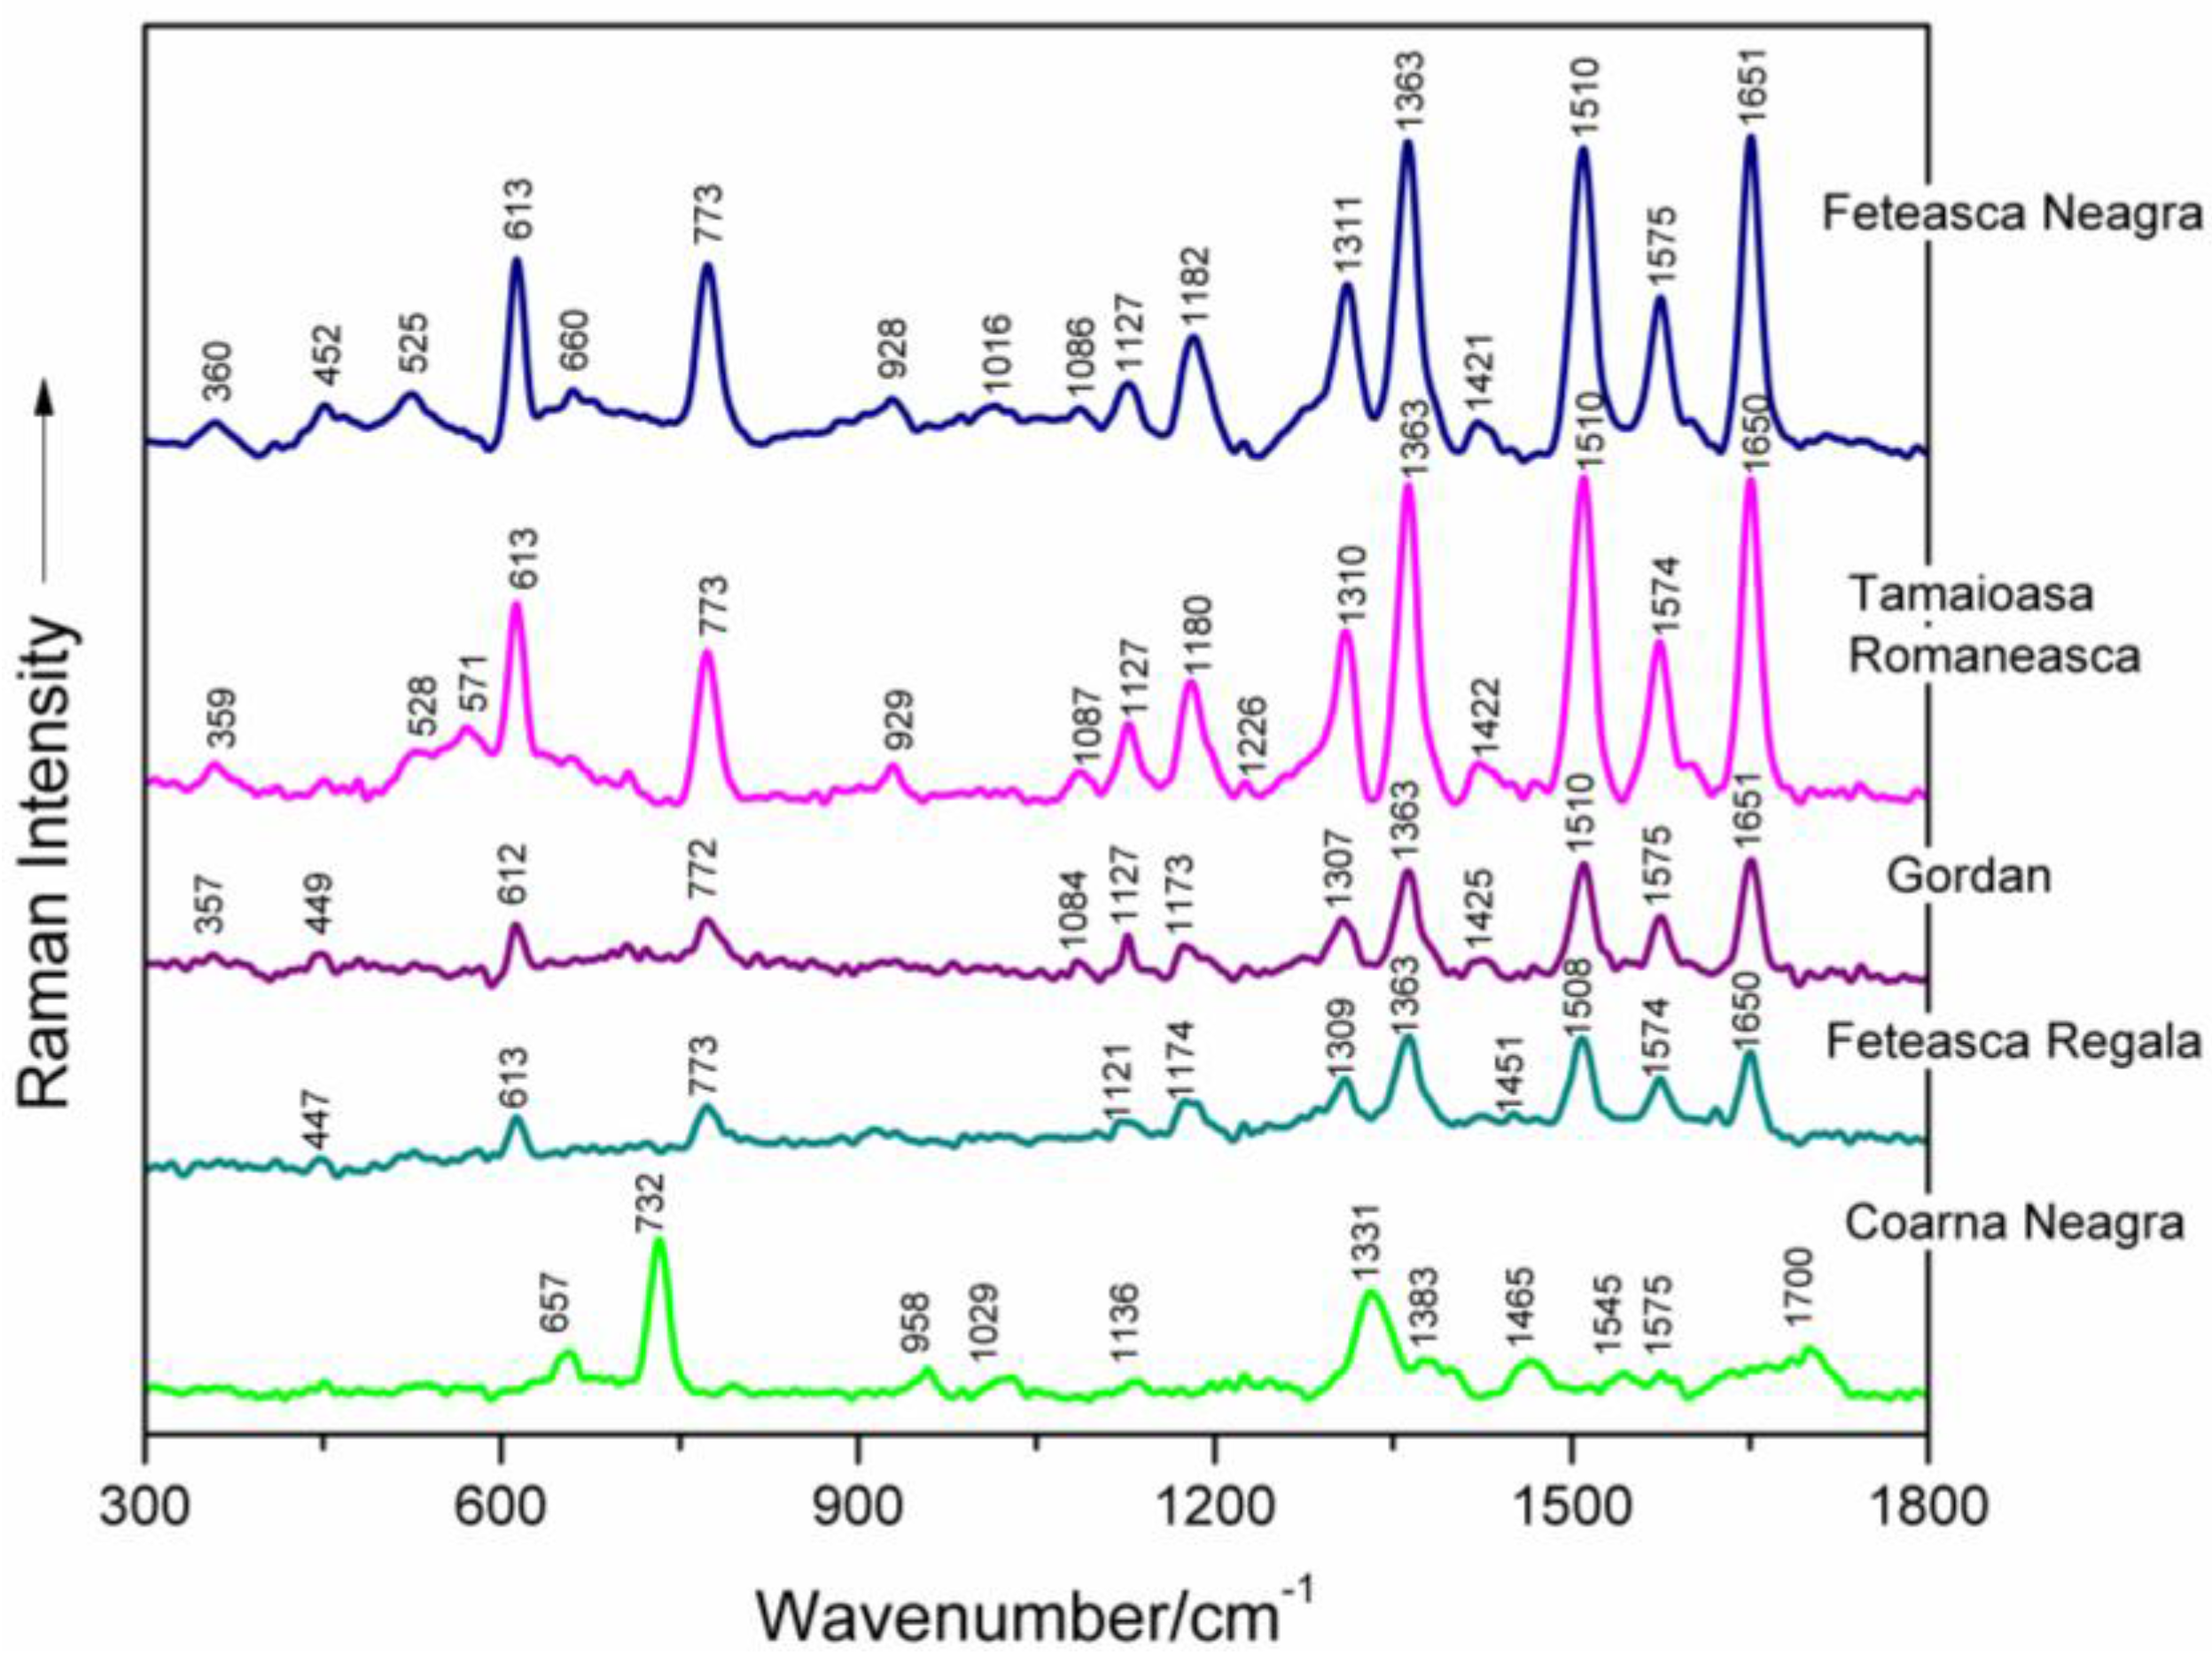
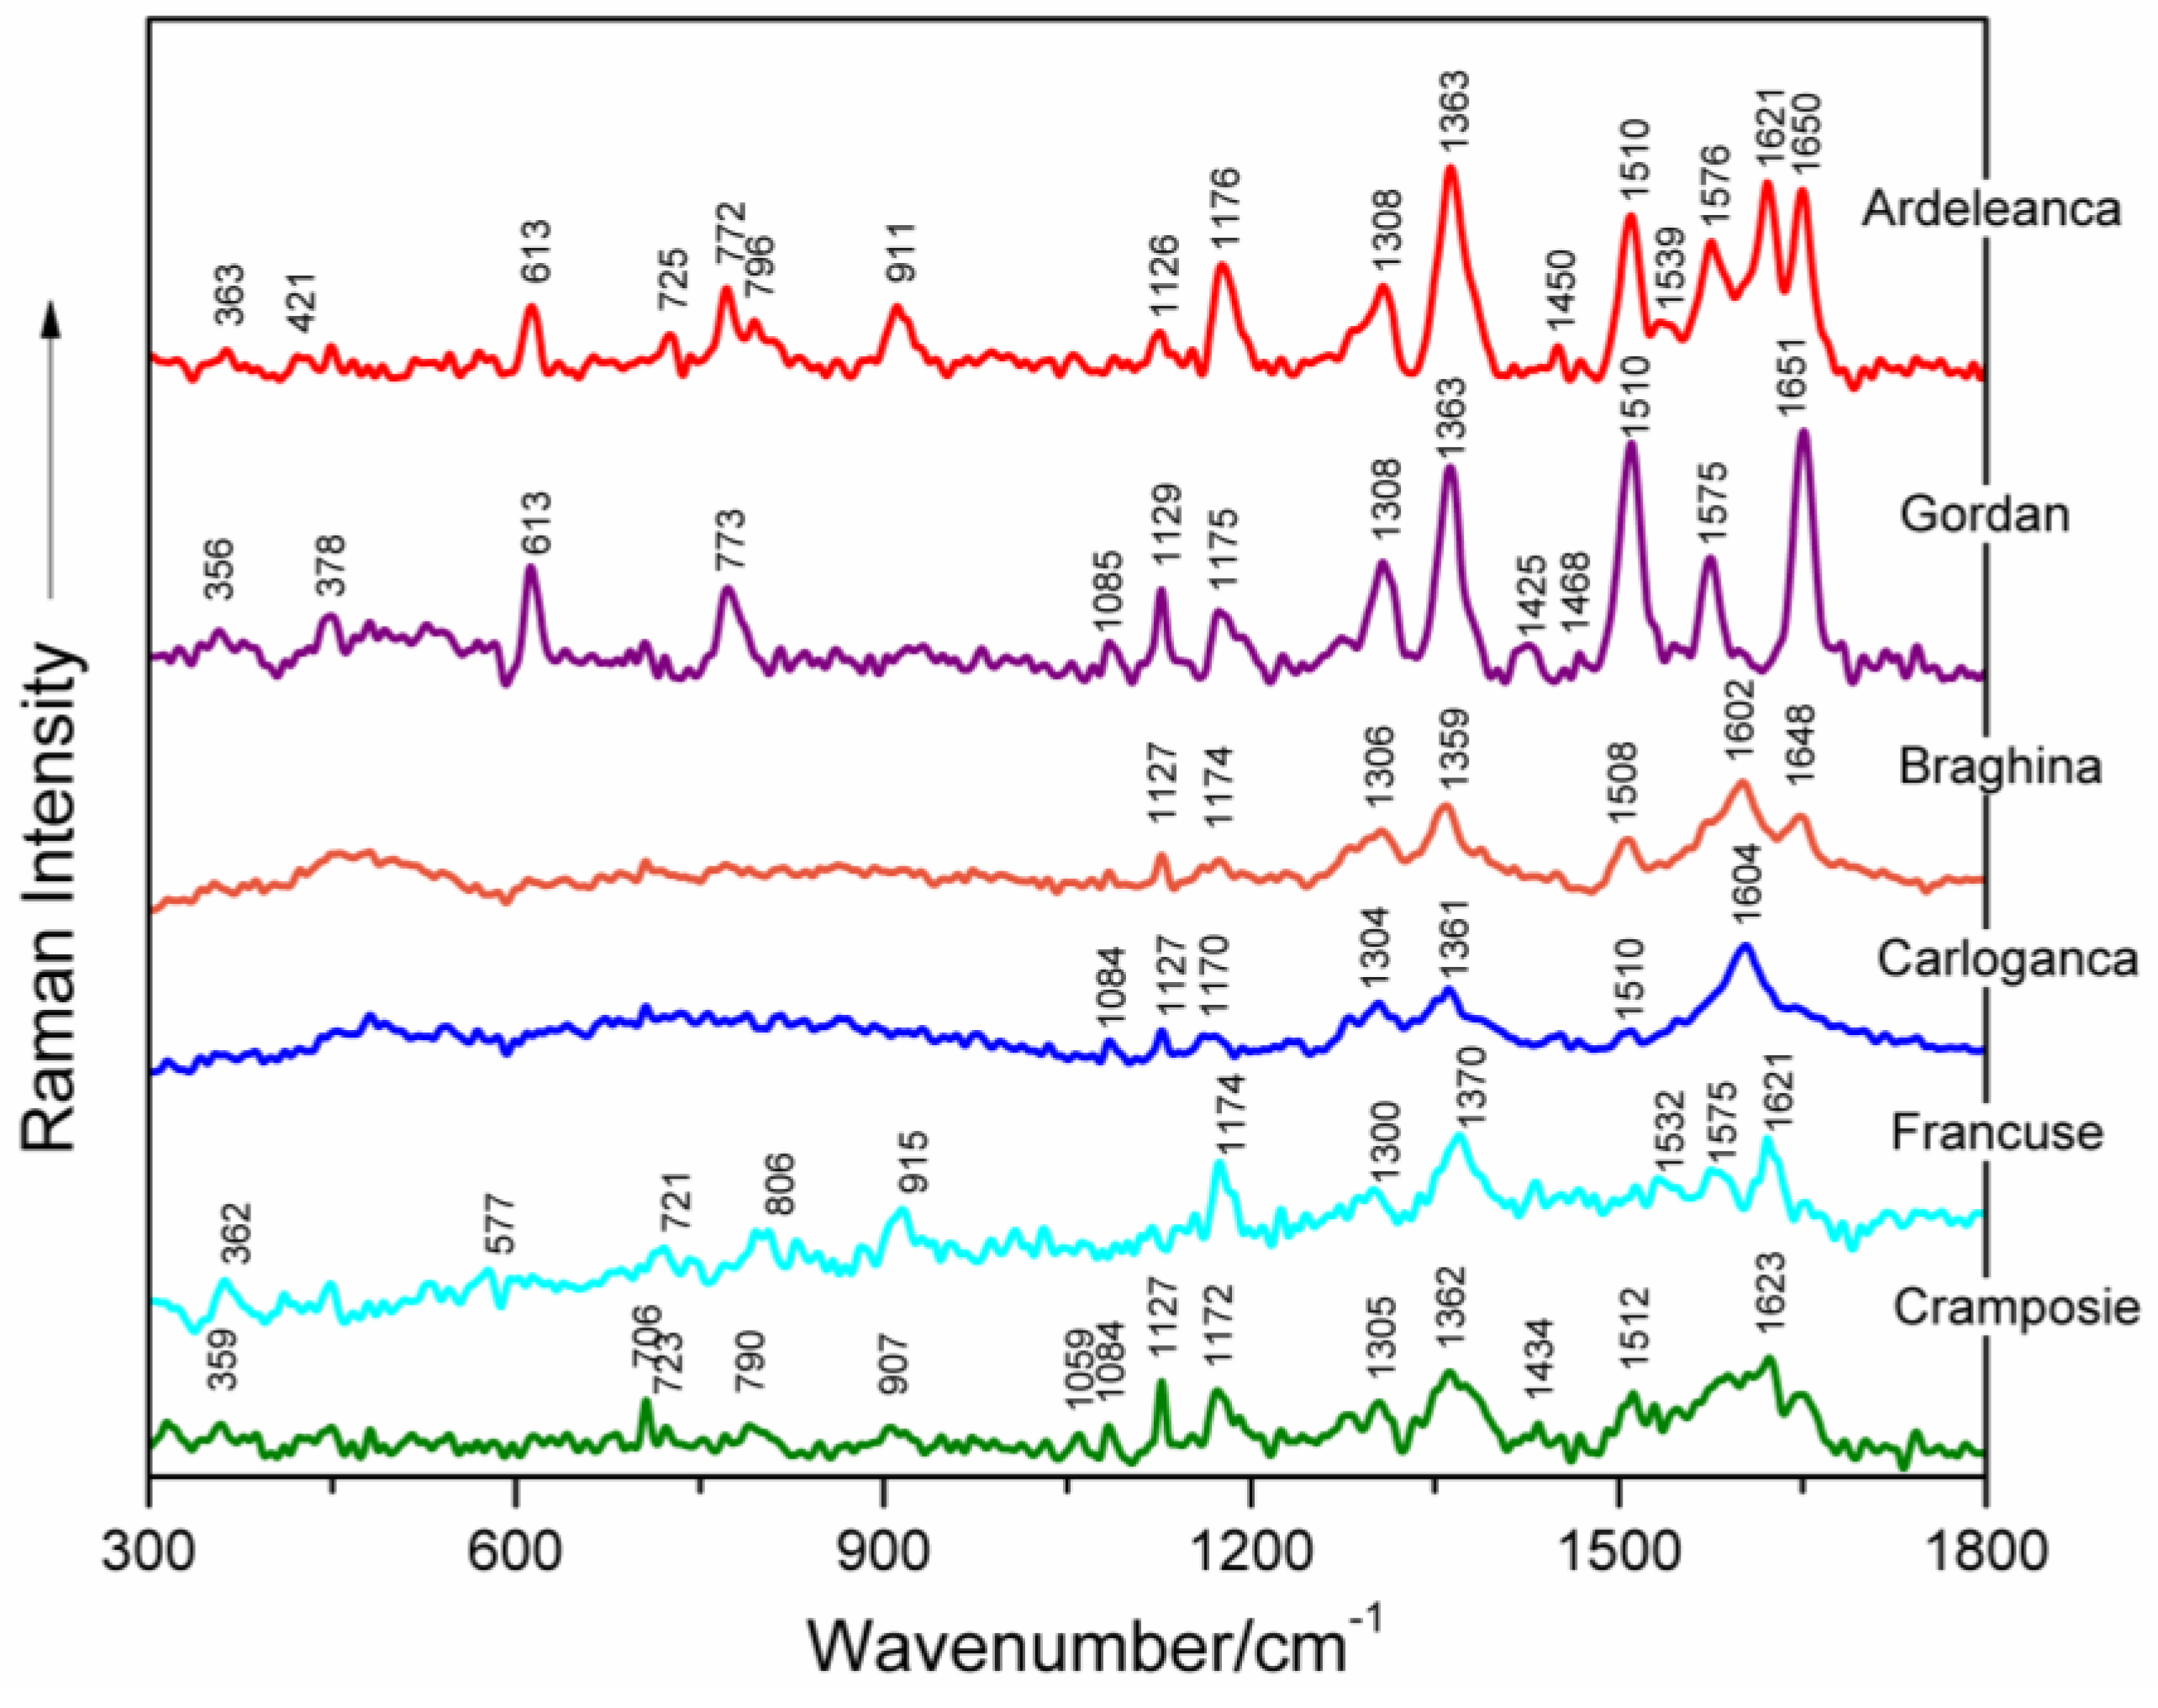
3.1. Surface-Enhanced Raman Spectroscopy of DNA Extracted from Grapevine Leaf Tissues
3.2. Effects of Femtosecond IR Laser Pulses on Genomic DNA Structure
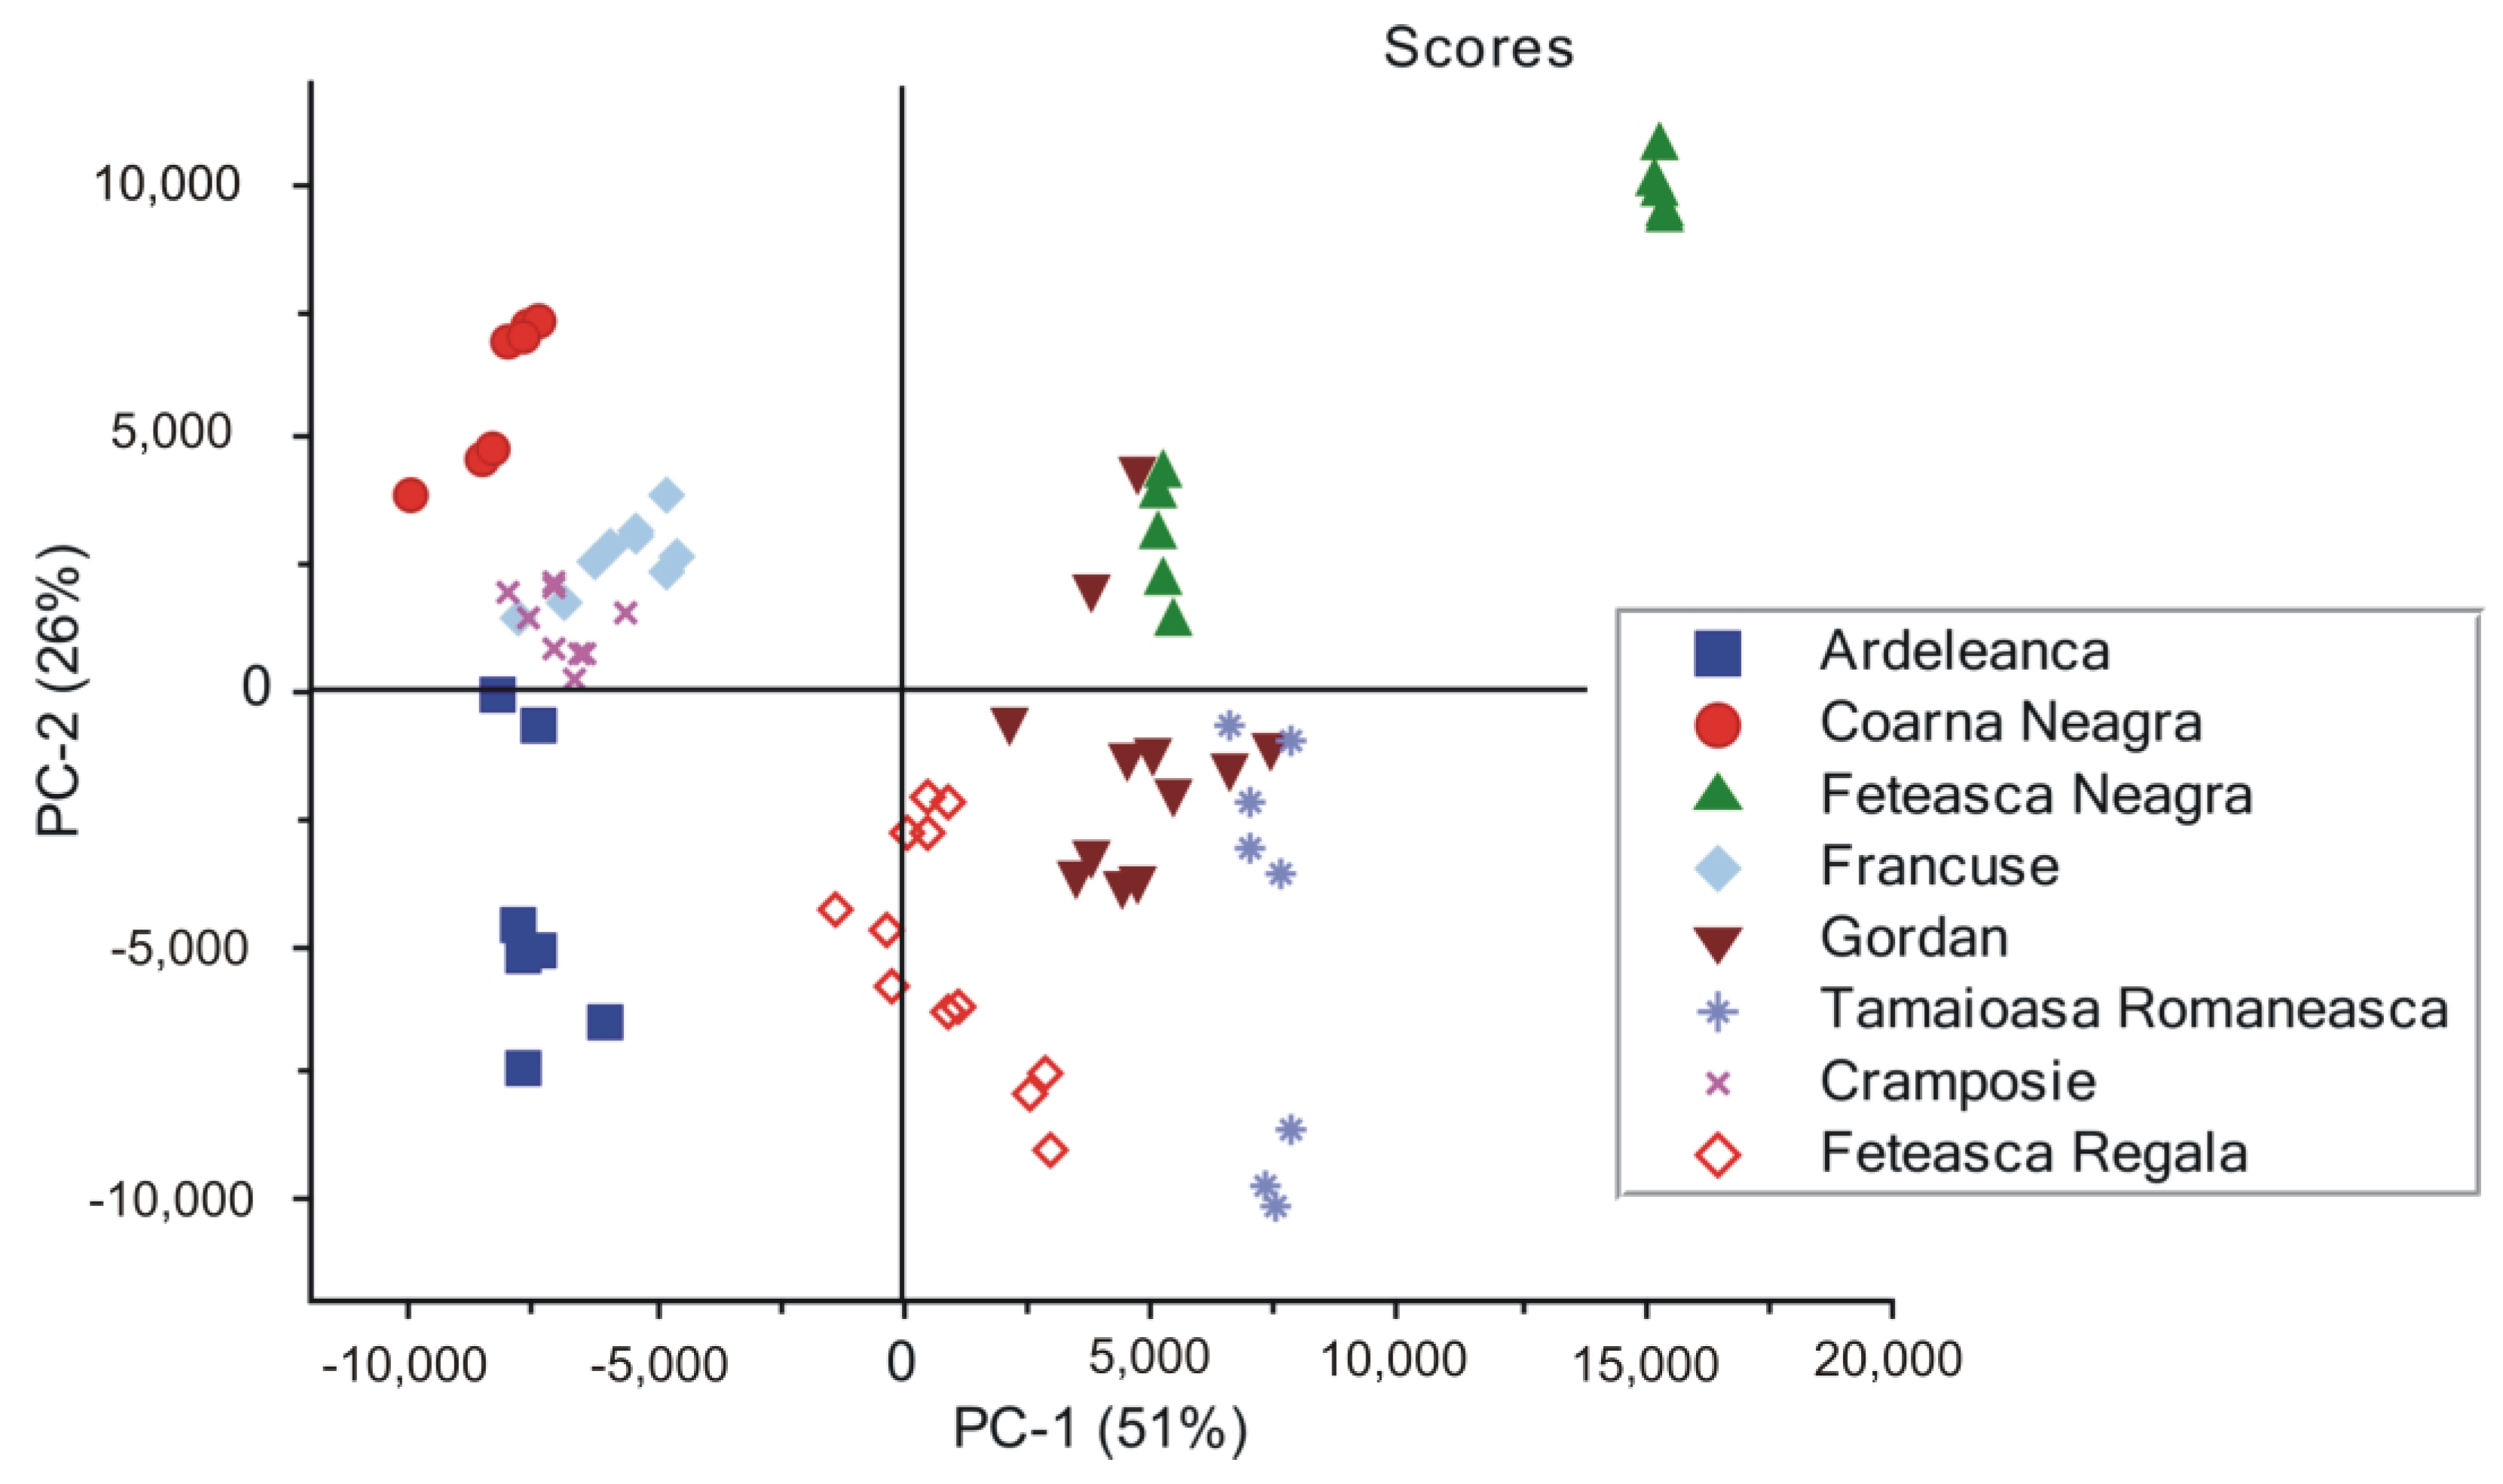
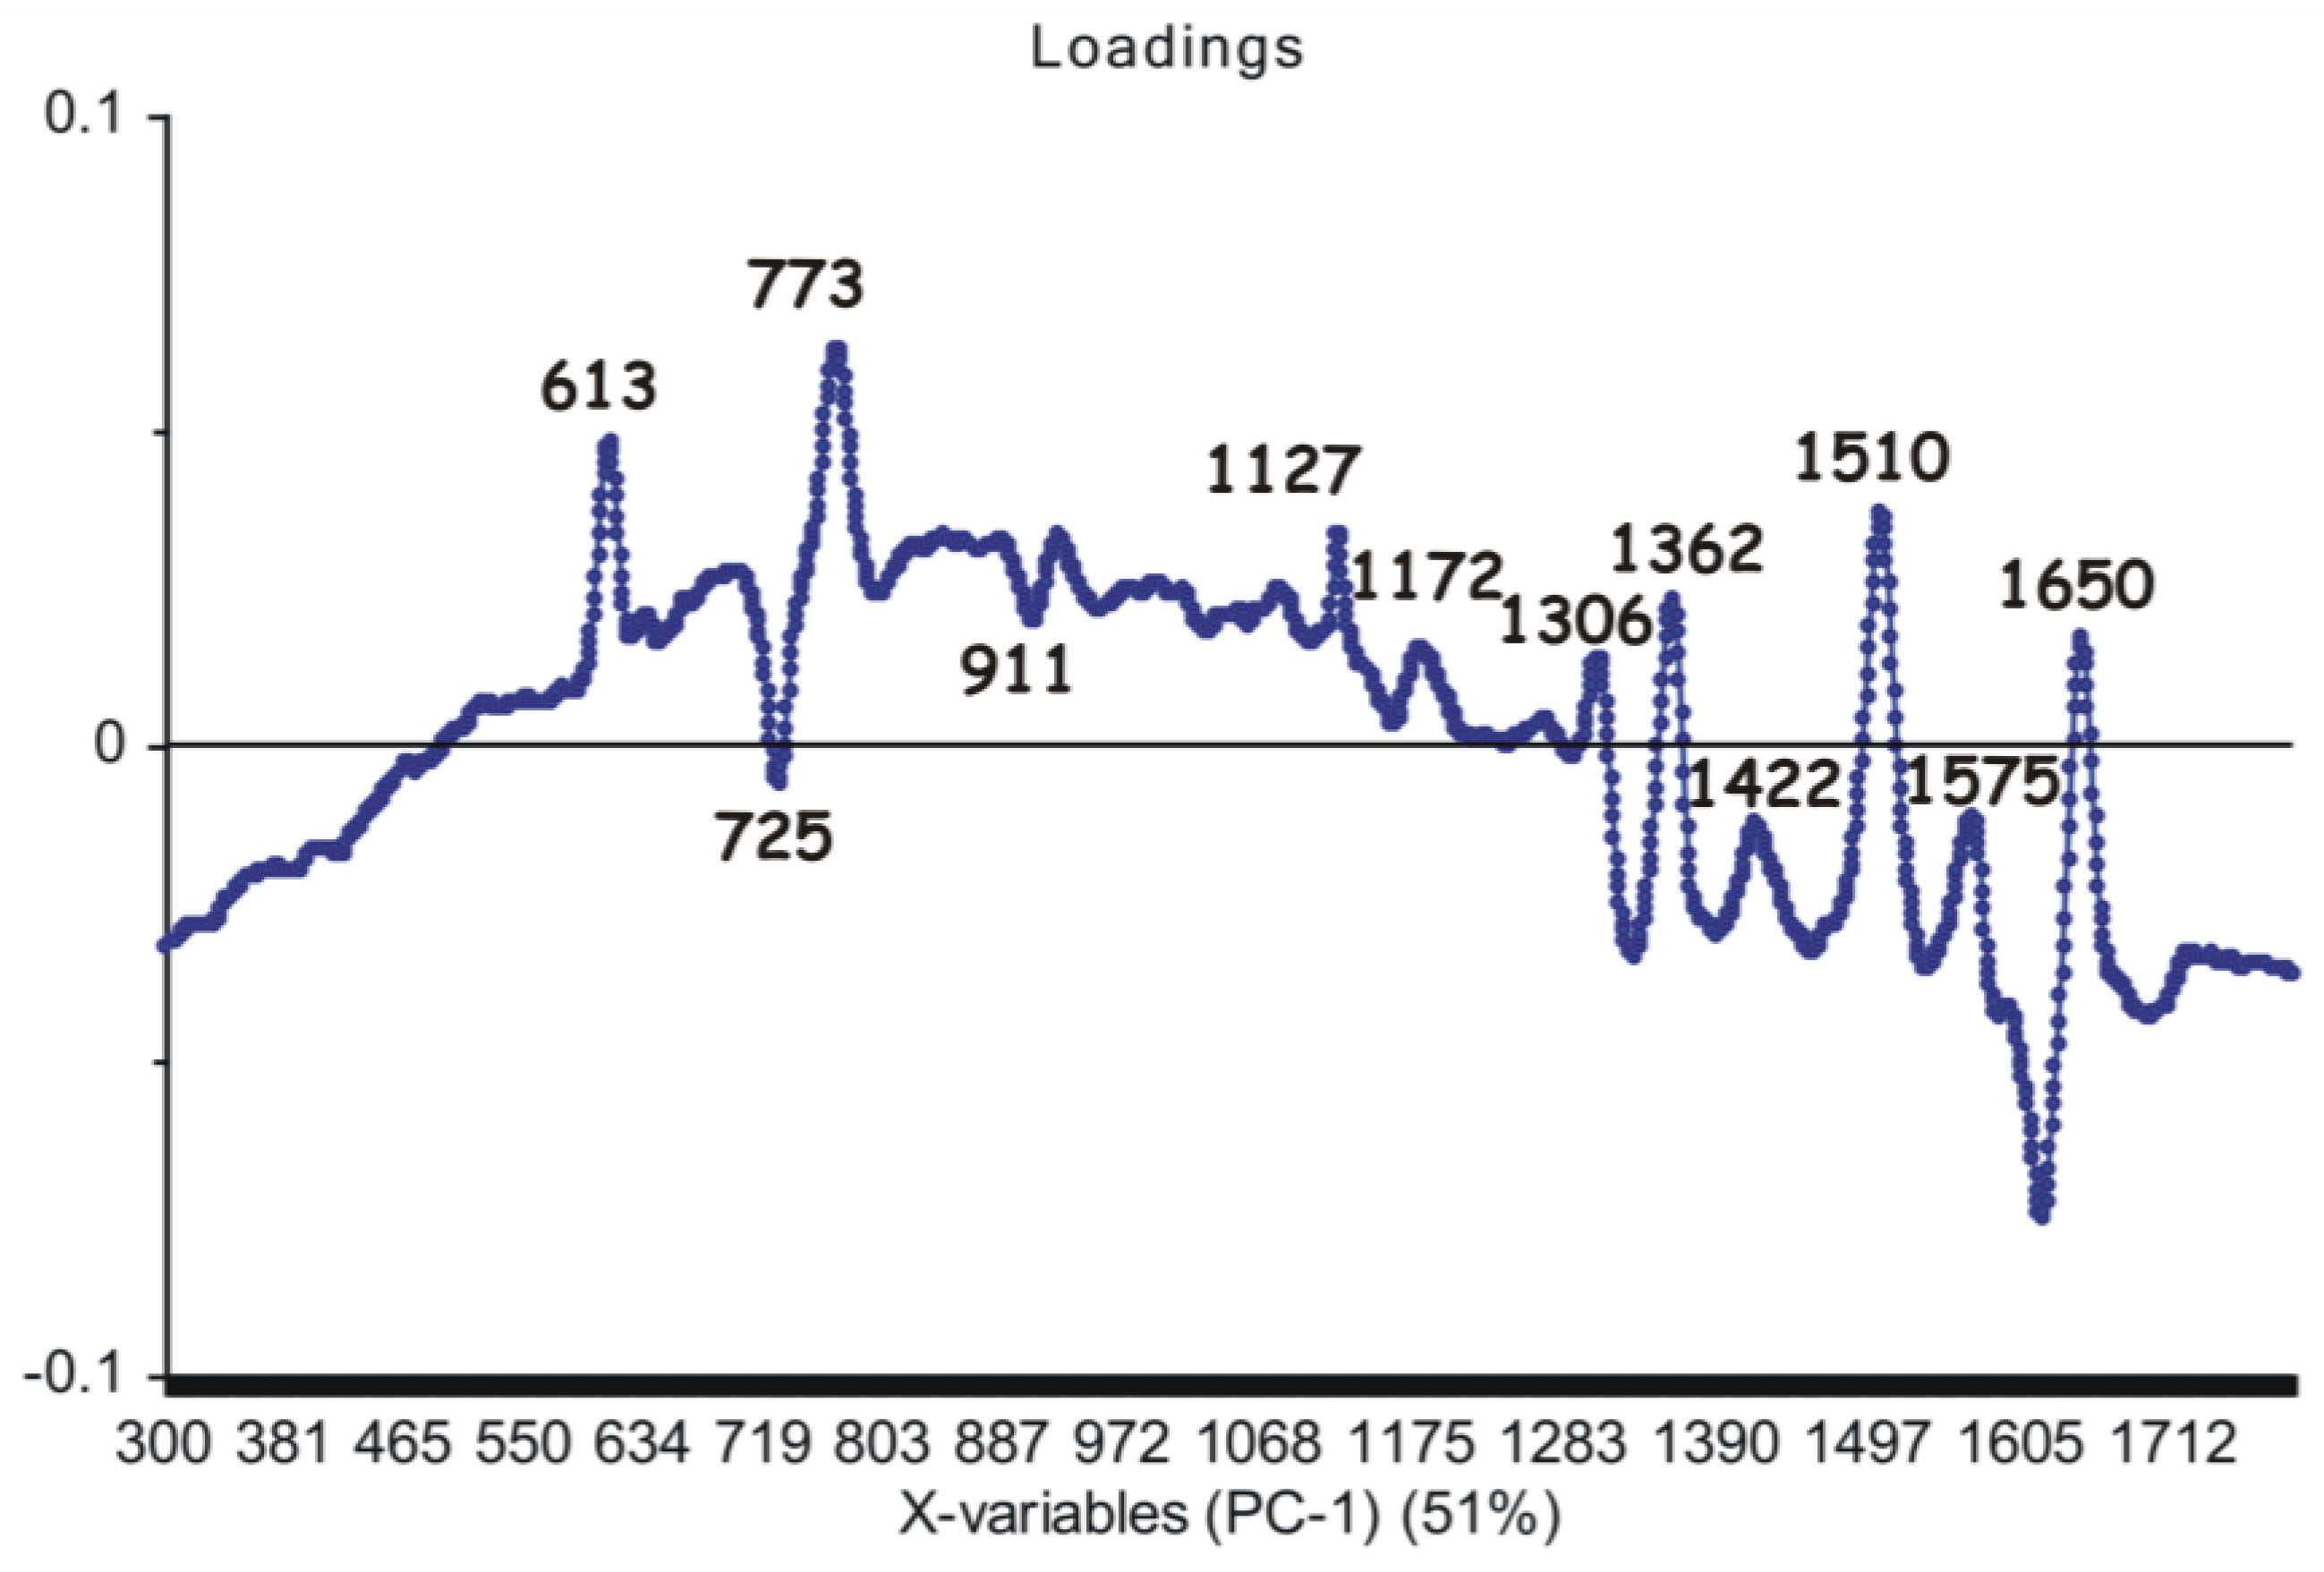
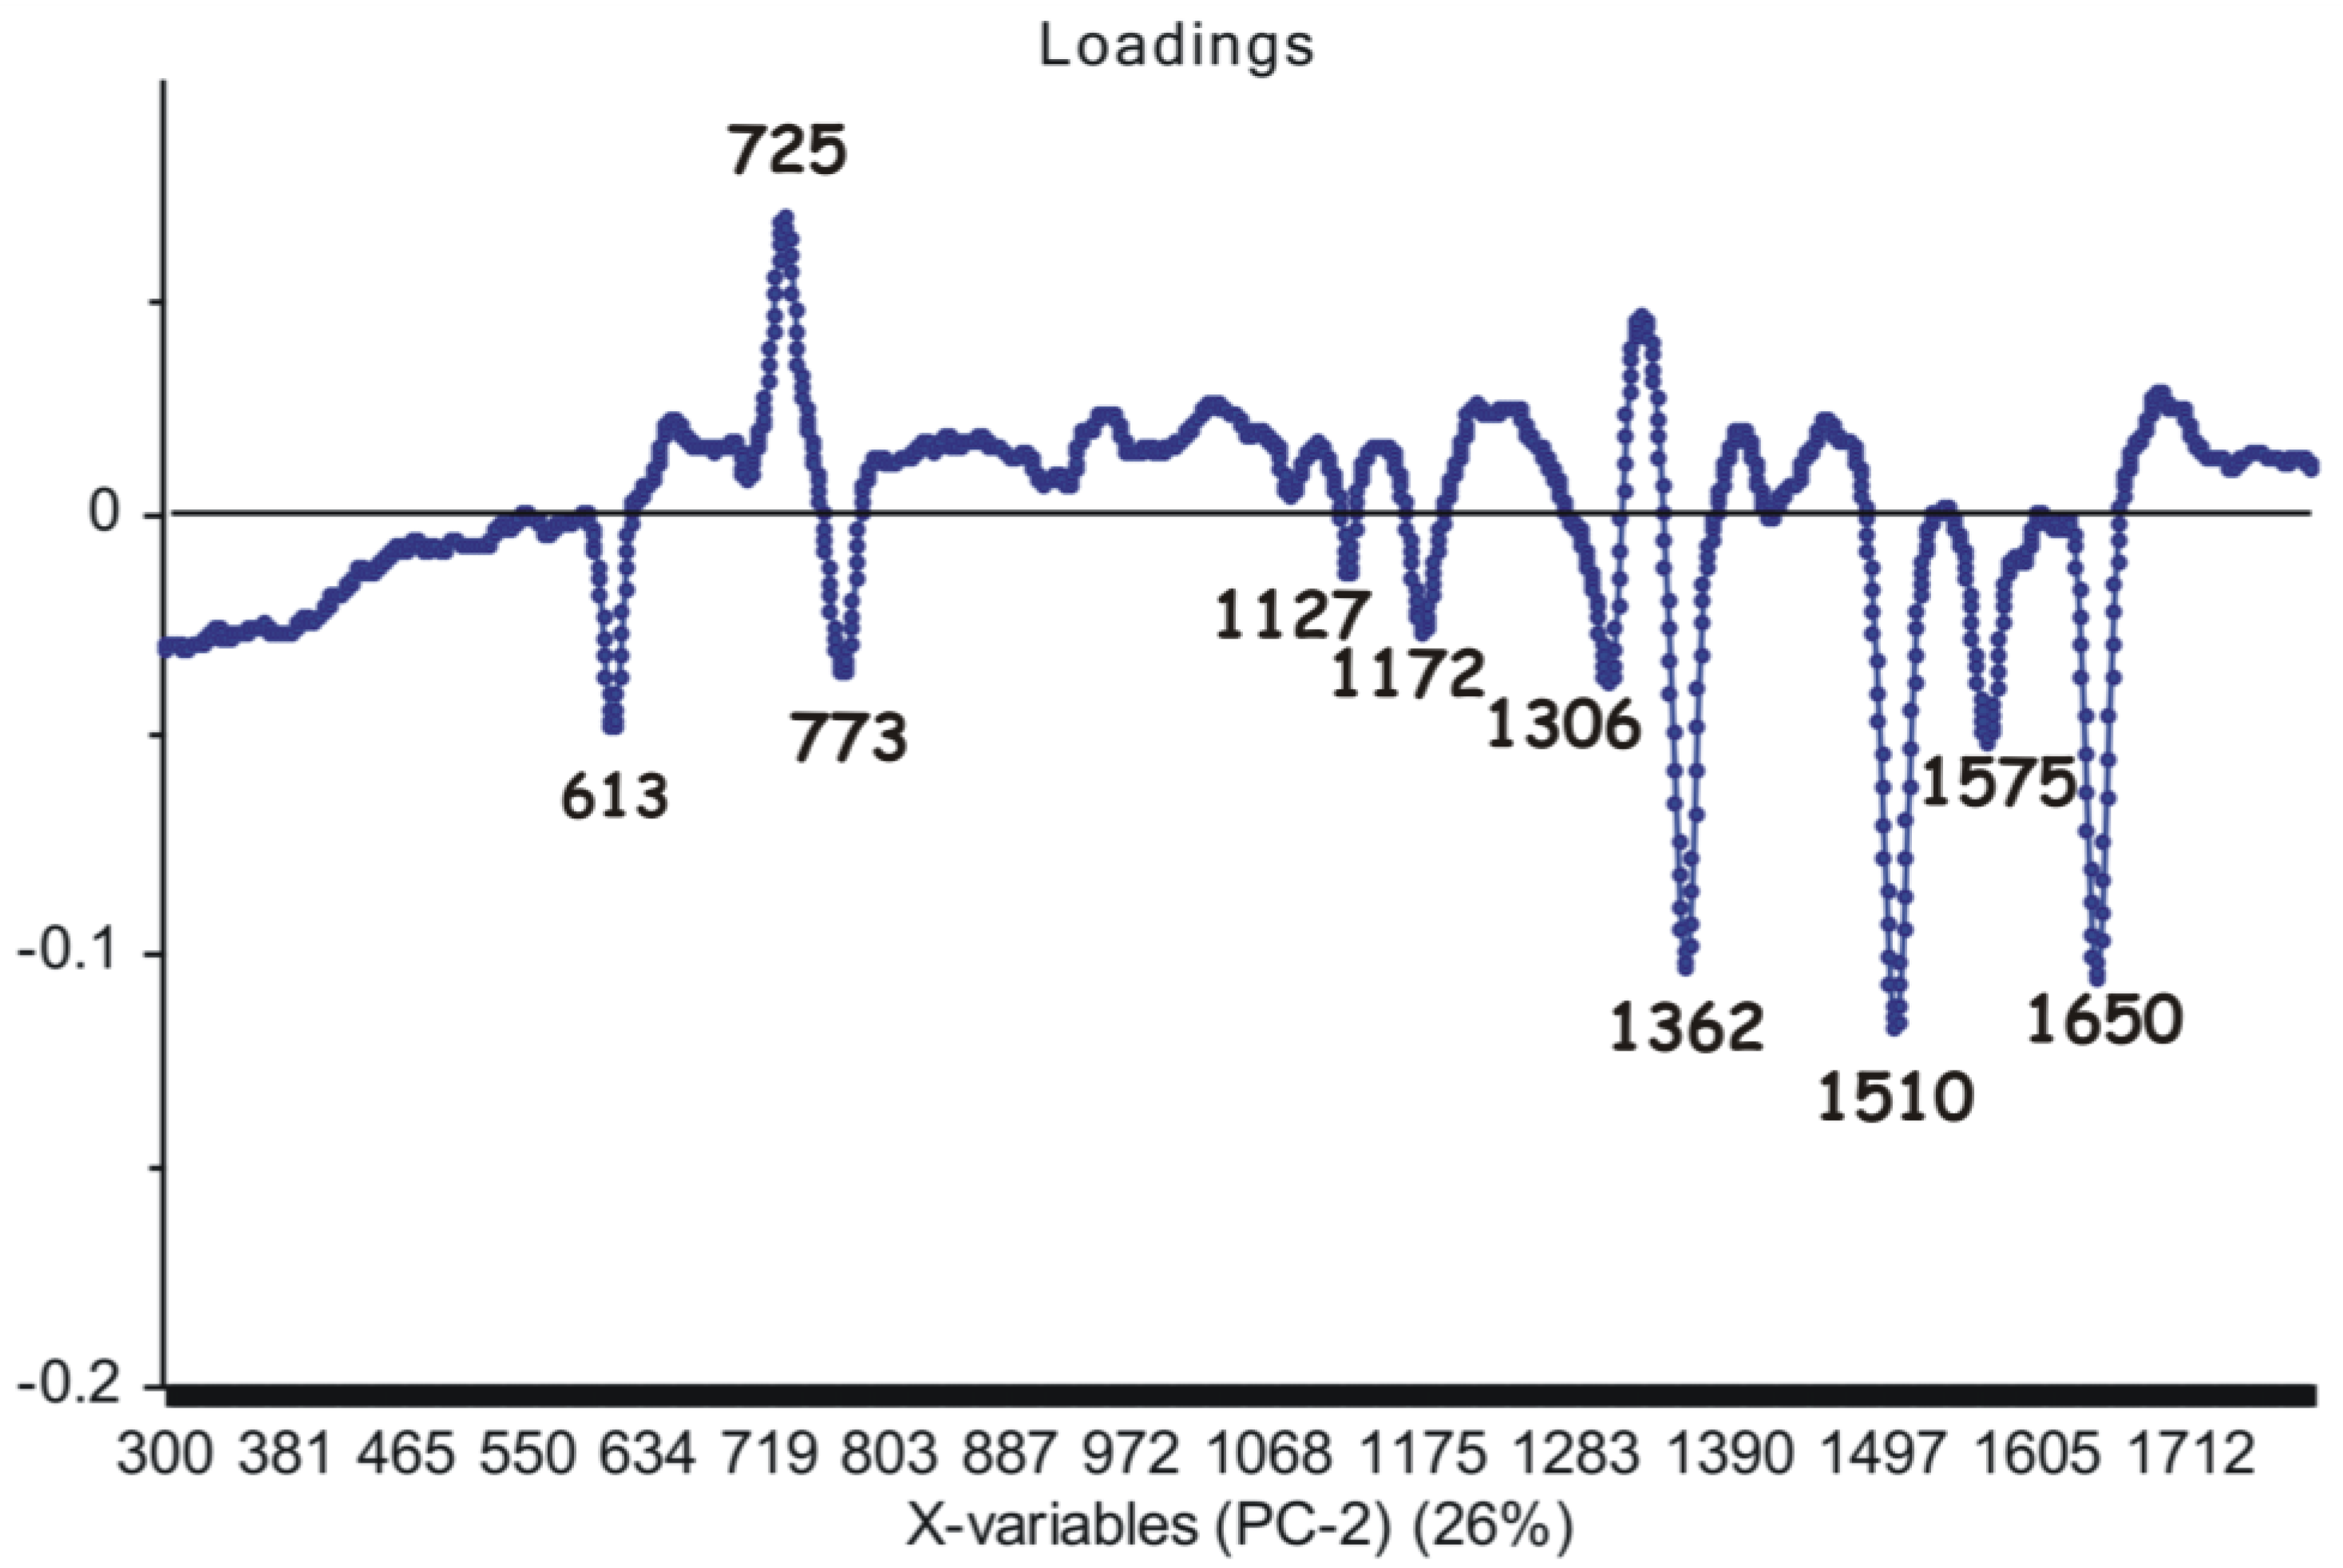
3.3. Principal Component Analysis on the SERS Spectra Recorded from Non-Irradiated Grapevine DNAs
4. Conclusions
Supplementary Materials
Acknowledgments
Author Contributions
Conflicts of Interest
References
- Tomas, M.; Blumhardt, P.; Deutzmann, A.; Schwarz, T.; Kromm, D.; Leitenstorfer, A.; Ferrando-May, E. Imaging of the DNA damage-induced dynamics of nuclear proteins via nonlinear photoperturbation. J. Biophoton. 2013, 6, 645–655. [Google Scholar] [CrossRef] [PubMed]
- Cho, S.-H.; Chang, W.-S.; Kim, J.-G.; Whang, K.-H.; Choi, K.-S.; Sohn, S.-H. In situ observation of photo-bleaching in human single living cell excited by a NIR femtosecond laser. Appl. Surf. Sci. 2008, 254, 3370–3375. [Google Scholar] [CrossRef]
- Russmann, C.; Stollhof, J.; Weiss, C.; Beigang, R.; Beato, M. Two wavelength femtosecond laser induced DNA-protein crosslinking. Nucleic Acids Res. 1998, 26, 3967–3970. [Google Scholar] [CrossRef] [PubMed]
- Mahajan, S.; Richardson, J.; Brown, T.; Bartlett, P.N. SERS-melting: A new method for discriminating mutations in DNA sequences. J. Am. Chem. Soc. 2008, 130, 15589–15601. [Google Scholar] [CrossRef] [PubMed]
- Fabris, L.; Dante, M.; Braun, G.; Lee, S.J.; Reich, N.O.; Moskovits, M.; Nguyen, T.-Q.; Bazan, G.C. A heterogeneous PNA-based SERS method for DNA detection. J. Am. Chem. Soc. 2007, 129, 6086–6087. [Google Scholar] [CrossRef] [PubMed]
- He, Y.; Su, S.; Xu, T.; Zhong, Y.; Zapien, J.A.; Li, J.; Fan, C.; Lee, S.-T. Silicon nanowires-based highly-efficient SERS-active platform for ultrasensitive DNA detection. Nano Today 2011, 6, 122–130. [Google Scholar] [CrossRef]
- Panikkanvalappil, S.R.; Mackey, M.A.; El-Sayed, M.A. Probing the unique dehydration-induced structural modifications in cancer cell DNA using surface-enhanced Raman spectroscopy. J. Am. Chem. Soc. 2013, 135, 4815–4821. [Google Scholar] [CrossRef] [PubMed]
- Muntean, C.M.; Leopold, N.; Tripon, C.; Coste, A.; Halmagyi, A. Surface-enhanced Raman spectroscopy of genomic DNA from in vitro grown tomato (Lycopersicon esculentum Mill.) cultivars before and after plant cryopreservation. Spectrochim. Acta A 2015, 144, 107–114. [Google Scholar] [CrossRef] [PubMed]
- Qiu, L.; Liu, P.; Zhao, L.; Wen, M.; Yang, H.; Fan, S.; Zhou, L. Analysis of plant genomic DNAs and the genetic relationship among plants by using surface-enhanced Raman spectroscopy. Vib. Spectrosc. 2014, 72, 134–141. [Google Scholar] [CrossRef]
- Muntean, C.M.; Leopold, N.; Halmagyi, A.; Valimareanu, S. Surface-enhanced Raman spectroscopy of genomic DNA from in vitro grown plant species. J. Raman Spectrosc. 2011, 42, 1925–1931. [Google Scholar] [CrossRef]
- Gout, E.; Bligny, R.; Douce, R. Regulation of intracellular pH values in higher-plant cells. Carbon-13 and phosphorus-31 nuclear-magnetic-resonance studies. J. Biol. Chem. 1992, 267, 13903–13909. [Google Scholar] [PubMed]
- Muntean, C.M.; Leopold, N.; Halmagyi, A.; Valimareanu, S. Surface-enhanced Raman spectroscopy of DNA from leaves of in vitro grown apple plants. J. Raman Spectrosc. 2011, 42, 844–850. [Google Scholar] [CrossRef]
- Muntean, C.M.; Leopold, N.; Halmagyi, A.; Valimareanu, S. Surface-enhanced Raman scattering assessment of DNA from leaf tissues adsorbed on silver colloidal nanoparticles. J. Raman Spectrosc. 2013, 44, 817–822. [Google Scholar] [CrossRef]
- Muntean, C.M.; Halmagyi, A.; Puia, M.D.; Pavel, I. FT-Raman signatures of genomic DNA from plant tissues. Spectrosc-Int. J. 2009, 23, 59–70. [Google Scholar] [CrossRef]
- Sun, L.; Song, Y.; Wang, L.; Guo, C.; Sun, Y.; Liu, Z.; Li, Z. Ethanol-induced formation of silver nanoparticle aggregates for highly active SERS substrates and application in DNA detection. J. Phys. Chem. C 2008, 112, 1415–1422. [Google Scholar] [CrossRef]
- Deng, H.; Bloomfield, V.A.; Benevides, J.M.; Thomas, G.J. Dependence of the Raman signature of genomic B-DNA on nucleotide base sequence. Biopolymers 1999, 50, 656–666. [Google Scholar] [CrossRef]
- Wu, C.-Y.; Lo, W.-Y.; Chiu, C.-R.; Yang, T.-S. Surface-enhanced Raman spectra of oligonucleotides induced by spermine. J. Raman Spectrosc. 2006, 37, 799–807. [Google Scholar] [CrossRef]
- Ke, W.; Zhou, D.; Wu, J.; Ji, K. Surface-enhanced Raman spectra of calf thymus DNA adsorbed on concentrated silver colloid. Appl. Spectrosc. 2005, 59, 418–423. [Google Scholar] [CrossRef] [PubMed]
- Sun, L.; Sun, Y.; Xu, F.; Zhang, Y.; Yang, T.; Guo, C.; Liu, Z.; Li, Z. Atomic force microscopy and surface-enhanced Raman scattering detection of DNA based on DNA–nanoparticle complexes. Nanotechnology 2009, 20. [Google Scholar] [CrossRef] [PubMed]
- Pagba, C.V.; Lane, S.M.; Wachsmann-Hogiu, S. Raman and surface-enhanced Raman spectroscopic studies of the 15-mer DNA thrombin-binding aptamer. J. Raman Spectrosc. 2010, 41, 241–247. [Google Scholar] [CrossRef]
- Treffer, R.; Lin, X.; Bailo, E.; Deckert-Gaudig, T.; Deckert, V. Distinction of Nucleobases—A Tip-Enhanced Raman Approach. Beilstein J. Nanotechnol. 2011, 2, 628–637. [Google Scholar] [CrossRef] [PubMed]
- Wartell, R.M.; Harrell, J.T. Characteristics and variations of B-type DNA conformations in solutions: A quantitative analysis of Raman band intensities of eight DNAs. Biochemistry-US 1986, 25, 2664–2671. [Google Scholar] [CrossRef]
- Ruiz-Chica, A.J.; Medina, M.A.; Sánchez-Jiménez, F.; Ramírez, F.J. On the interpretation of Raman spectra of 1-aminooxy-spermine/DNA complexes. Nucleic Acids Res. 2004, 32, 579–589. [Google Scholar] [CrossRef] [PubMed]
- Muntean, C.M.; Nalpantidis, K.; Feldmann, I.; Deckert, V. Zn2+-DNA interactions in aqueous systems: A Raman spectroscopic study. Spectrosc-Int. J. 2009, 23, 155–163. [Google Scholar] [CrossRef]
- Rajani, C.; Kincaid, J.R.; Petering, D.H. The presence of two modes of binding to calf thymus DNA by metal-free bleomycin: A low frequency Raman study. Biopolymers 1999, 52, 129–146. [Google Scholar] [CrossRef]
- Muntean, C.M.; Misselwitz, R.; Dostál, L.; Welfle, H. Mn2+–DNA interactions in aqueous systems: A Raman spectroscopic study. Spectroscopy 2006, 20, 29–35. [Google Scholar] [CrossRef]
- Dostál, L.; Misselwitz, R.; Welfle, H. Arc repressor−operator DNA interactions and contribution of Phe10 to binding specificity. Biochemistry-US 2005, 44, 8387–8396. [Google Scholar] [CrossRef] [PubMed]
- Thomas, G.J., Jr.; Benevides, J.M.; Duguid, J.; Bloomfield, V.A. Roles of cations in the structure, stability and condensation of DNA. In Fifth International Conference on the Spectroscopy of Biological Molecules; Theophanides, T., Anastassopoulou, J., Fotopoulos, N., Eds.; Springer: Dordrecht, The Netherlands, 1993; pp. 39–45. [Google Scholar]
- Puppels, G.J.; Otto, C.; Greve, J.; Robert-Nicoud, M.; Arndt-Jovin, D.J.; Jovin, T.M. Raman microspectroscopic study of low-pH-induced changes in DNA structure of polytene chromosomes. Biochemistry-US 1994, 33, 3386–3395. [Google Scholar] [CrossRef]
- Muntean, C.M.; Puppels, G.J.; Greve, J.; Segers-Nolten, G.M.J. Influence of Ca2+ cations on low pH-induced DNA structural transitions. Biopolymers 2002, 67, 282–284. [Google Scholar] [CrossRef] [PubMed]
- Thomas, G.J., Jr.; Benevides, J.M.; Overman, S.A.; Ueda, T.; Ushizawa, K.; Saitoh, M.; Tsuboi, M. Polarized Raman spectra of oriented fibers of A DNA and B DNA: Anisotropic and isotropic local Raman tensors of base and backbone vibrations. Biophys. J. 1995, 68, 1073–1088. [Google Scholar] [CrossRef]
- Muntean, C.M.; Puppels, G.J.; Greve, J.; Segers-Nolten, G.M.J.; Cinta-Pinzaru, S. Raman microspectroscopic study on low-pH-induced DNA structural transitions in the presence of magnesium ions. J. Raman Spectrosc. 2002, 33, 784–788. [Google Scholar] [CrossRef]
- Braun, C.S.; Jas, G.S.; Choosakoonkriang, S.; Koe, G.S.; Smith, J.G.; Middaugh, C.R. The structure of DNA within cationic lipid/DNA complexes. Biophys. J. 2003, 84, 1114–1123. [Google Scholar] [CrossRef]
- Guan, Y.; Wurrey, C.J.; Thomas, G.J., Jr. Vibrational analysis of nucleic acids. I. The phosphodiester group in dimethyl phosphate model compounds: (CH3O)2PO2−, (CD3O)2PO2−, and (13CH3O)2PO2. Biophys. J. 1994, 66, 225–235. [Google Scholar] [CrossRef]
- Duguid, J.; Bloomfield, V.A.; Benevides, J.; Thomas, G.J., Jr. Raman spectroscopy of DNA-metal complexes. I. Interactions and conformational effects of the divalent cations: Mg, Ca, Sr, Ba, Mn, Co, Ni, Cu, Pd, and Cd. Biophys. J. 1993, 65, 1916–1928. [Google Scholar] [CrossRef]
- Muntean, C.M.; Dostál, L.; Misselwitz, R.; Welfle, H. DNA structure at low pH values, in the presence of Mn2+ ions: A Raman study. J. Raman Spectrosc. 2005, 36, 1047–1051. [Google Scholar] [CrossRef]
- Tsuboi, M.; Benevides, J.M.; Thomas, G.J., Jr. The complex of ethidium bromide with genomic DNA: Structure analysis by polarized Raman spectroscopy. Biophys. J. 2007, 92, 928–934. [Google Scholar] [CrossRef] [PubMed]
- Neault, J.F.; Naoui, M.; Manfait, M.; Tajmir-Riahi, H.A. Aspirin-DNA interaction studied by FTIR and laser Raman difference spectroscopy. FEBS Lett. 1996, 382, 26–30. [Google Scholar] [CrossRef]
- De Gelder, J.; De Gussem, K.; Vandenabeele, P.; Moens, L. Reference database of Raman spectra of biological molecules. J. Raman Spectrosc. 2007, 38, 1133–1147. [Google Scholar] [CrossRef]
- Huser, T.; Orme, C.A.; Hollars, C.W.; Corzett, M.H.; Balhorn, R. Raman spectroscopy of DNA packaging in individual human sperm cells distinguishes normal from abnormal cells. J. Biophoton. 2009, 2, 322–332. [Google Scholar] [CrossRef] [PubMed]
- Xie, W.; Ye, Y.; Shen, A.; Zhou, L.; Lou, Z.; Wang, X.; Hu, J. Evaluation of DNA-targeted anti-cancer drugs by Raman spectroscopy. Vib. Spectrosc. 2008, 47, 119–123. [Google Scholar] [CrossRef]
- Willets, K. Surface-enhanced Raman scattering (SERS) for probing internal cellular structure and dynamics. Anal. Bioanal. Chem. 2009, 394, 85–94. [Google Scholar] [CrossRef] [PubMed]
- Jaunich, M.; Raje, S.; Kim, K.; Mitra, K.; Guo, Z. Bio-heat transfer analysis during short pulse laser irradiation of tissues. Int. J. Heat Mass Transfer 2008, 51, 5511–5521. [Google Scholar] [CrossRef]
- Mao, H.; Arias-Gonzalez, J.R.; Smith, S.B.; Tinoco, I., Jr.; Bustamante, C. Temperature control methods in a laser tweezers system. Biophys. J. 2005, 89, 1308–1316. [Google Scholar] [CrossRef] [PubMed]
- Hung, M.-S.; Kurosawa, O.; Washizu, M. Single DNA molecule denaturation using laser-induced heating. Mol. Cell. Probes 2012, 26, 107–112. [Google Scholar] [CrossRef] [PubMed]
- Miljanić, S.; Dijanošić, A.; Matić, I. Adsorption mechanisms of RNA mononucleotides on silver nanoparticles. Spectrochim. Acta A 2015, 137, 1357–1362. [Google Scholar] [CrossRef] [PubMed]
- Mircescu, N.; Zhou, H.; Leopold, N.; Chiş, V.; Ivleva, N.; Niessner, R.; Wieser, A.; Haisch, C. Towards a receptor-free immobilization and SERS detection of urinary tract infections causative pathogens. Anal. Bioanal. Chem. 2014, 406, 3051–3058. [Google Scholar] [CrossRef] [PubMed]
- Heraud, P.; Wood, B.R.; Beardall, J.; McNaughton, D. Effects of pre-processing of Raman spectra on in vivo classification of nutrient status of microalgal cells. J. Chemometr. 2006, 20, 193–197. [Google Scholar] [CrossRef]


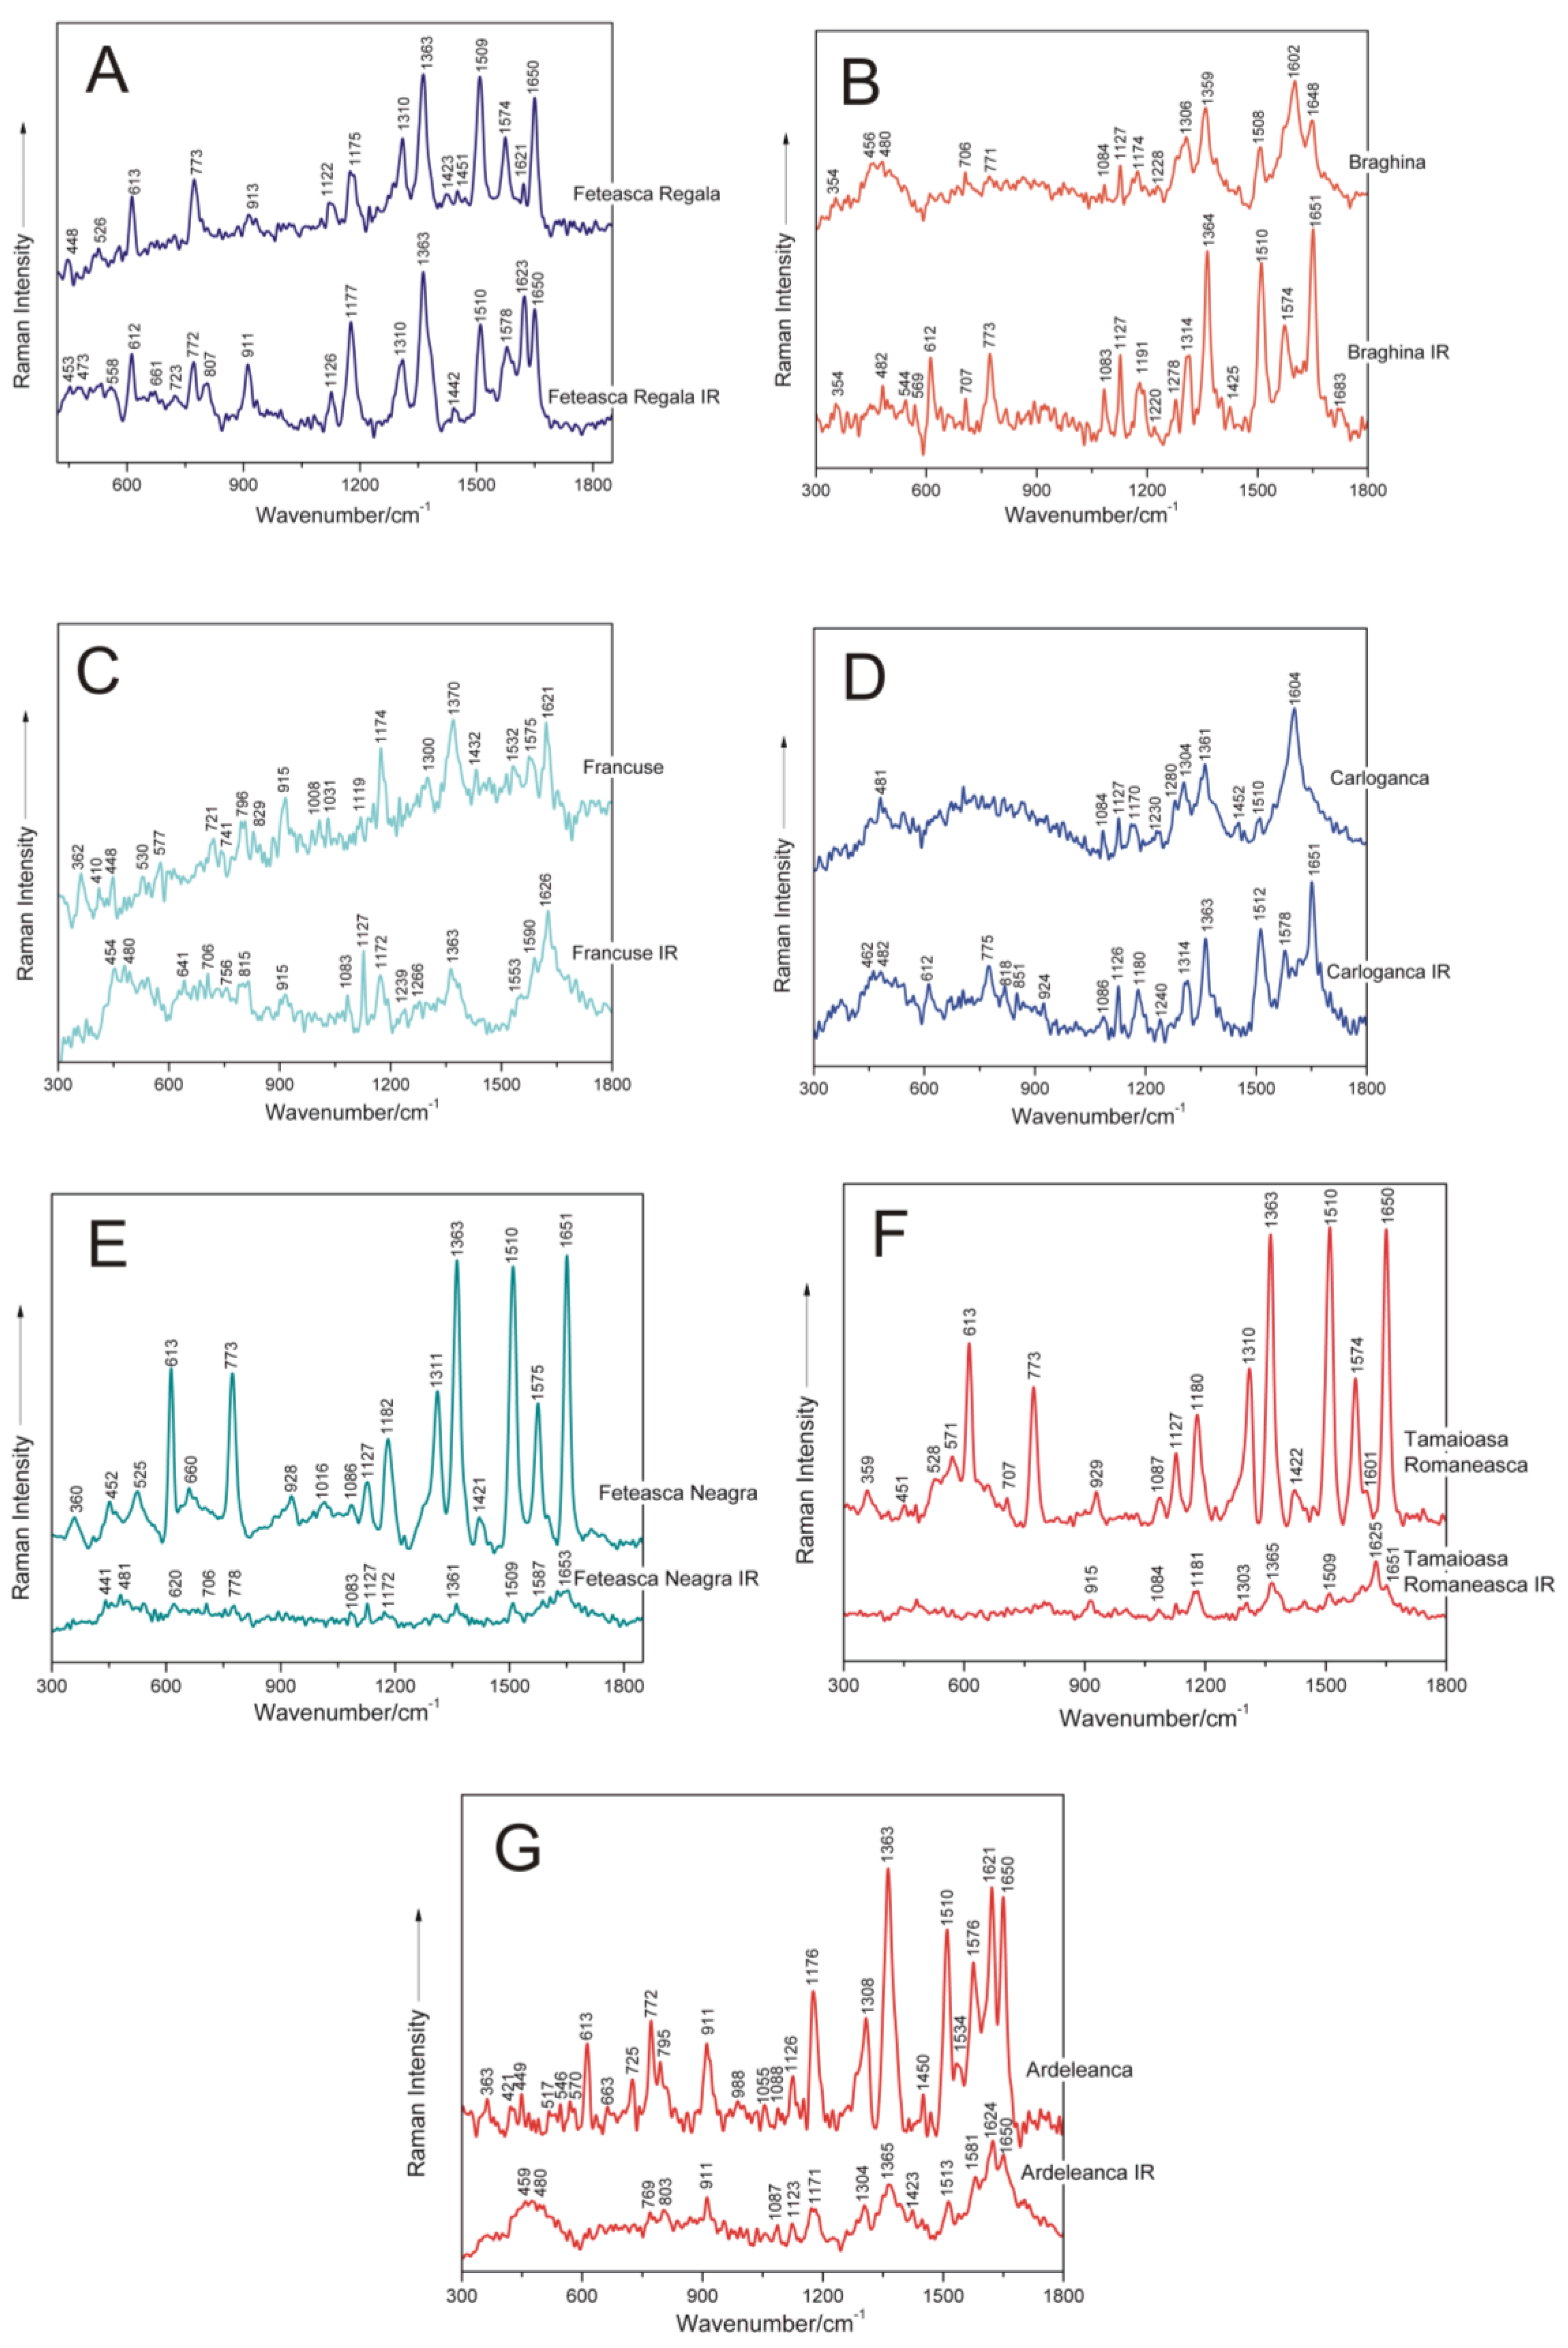
| Feteasca Neagra | Tamaioasa Romaneasca | Gordan | Feteasca Regala | Coarna Neagra | Ardeleanca | Braghina | Carloganca | Francuse | Cramposie | Tentative Assignment a |
|---|---|---|---|---|---|---|---|---|---|---|
| 360 m | 359 w | 356 vw | 363 w | 354 w | 362 m | 359 vw | dG, dT, dA str | |||
| 378 w | 421 vw | 410 w | str dG, dT, dA | |||||||
| 452 m | 451 vw | 448 w | 449 w | 456 w | 448 m | str deoxyribose | ||||
| 480 w | 481 w | str deoxyribose | ||||||||
| 525 m | 528 w | 526 w | 517 vw | 530 w | dC/dT (ring def) | |||||
| 571 w | 570 w | 577 w | dA (C2–H, N9–H wagging) | |||||||
| 613 s | 613 s | 613 m | 613 m | 613 m | deoxyribose (C3′-endo-anti) | |||||
| 660 w | 657 w | 663 w | dG (ring breathing) | |||||||
| 707 vw | 706 w | 706 w | dA (ring breathing) | |||||||
| 732 s | 725 m | 721 w | 723 vw | dA (ring breathing) | ||||||
| 741 vw | dT (ring breathing) | |||||||||
| 773 s | 773 s | 773 m | 773 m | 772 m | 771 vw | dC, C2′-endo-anti | ||||
| 795 m | 796 m | 790 w | bk 5′C–O–P–O–C3′ sym str | |||||||
| 829 w | deoxyribose C2′-endo | |||||||||
| 928 w | 929 w | 913 w | 911 m | 915 m | 907 w | deoxyribose | ||||
| 958 w | dA/dC/dG (NH2 rk) | |||||||||
| 1016 vw | 988 vw | 1008 w | dT (out-of-plane NH2 wagging) | |||||||
| 1029 vw | 1055 vw | 1031 w | 1059 w | dA (N- deoxyribose str) | ||||||
| 1086 w | 1087 w | 1085 vw | 1088 vw | 1084 vw | 1084 w | 1084 w | bk PO2− sym str | |||
| 1127 m | 1127 m | 1129 m | 1122 w | 1136 vw | 1126 m | 1127 m | 1127 m | 1119 vw | 1127 m | dA (C8–N9 str, N9–H, C8–H def) |
| 1182 s | 1180 m | 1175 m | 1175 m | 1176 s | 1174 w | 1170 m | 1174 s | 1172 m | dA, dG (C5–C6 str) | |
| 1228 w | 1230 w | dT (in-plane ring - CH3 str) | ||||||||
| 1280 sh | dC (C–NH2 str + ring str) | |||||||||
| 1311 s | 1310 s | 1308 m | 1310 m | 1308 s | 1306 m | 1304 m | 1300 m | 1305 m | dA, dG (C–N str (Im)) | |
| 1331 m | dA, dG (ring mode) | |||||||||
| 1363 vs | 1363 vs | 1363 s | 1363 vs | 1383 w | 1363 vs | 1359 s | 1361 m | 1370 s | 1362 m | dT, dA, dG (C–N str (Py)) |
| 1421 w | 1422 m | 1425 w | 1423 vw | 1432 w | 1434 vw | Deoxyribose C2′H2 scissoring | ||||
| 1468 vw | 1451 vw | 1465 w | 1450 w | 1452 w | Deoxyribose CH2 | |||||
| 1510 vs | 1510 vs | 1510 vs | 1509 vs | 1510 vs | 1508 m | 1510 w | 1512 w | dA (NH2 def) | ||
| 1545 vw | 1534 m | 1532 w | dT (in-plane ring str) | |||||||
| 1575 s | 1574 s | 1575 m | 1574 m | 1575 vw | 1576 m | 1575 m | dG, dA (C2=N3 of guanine) | |||
| 1601 sh | 1621 w | 1621 s | 1602 s | 1604 s | 1621 s | 1623 m | dA, dG, dC (NH2 def) | |||
| 1651 vs | 1650 vs | 1651 vs | 1650 s | 1650 s | 1648 m | dT, δ(H2O) (C=O str, C=C str) | ||||
| 1700 w | dG (C–O), C–C |
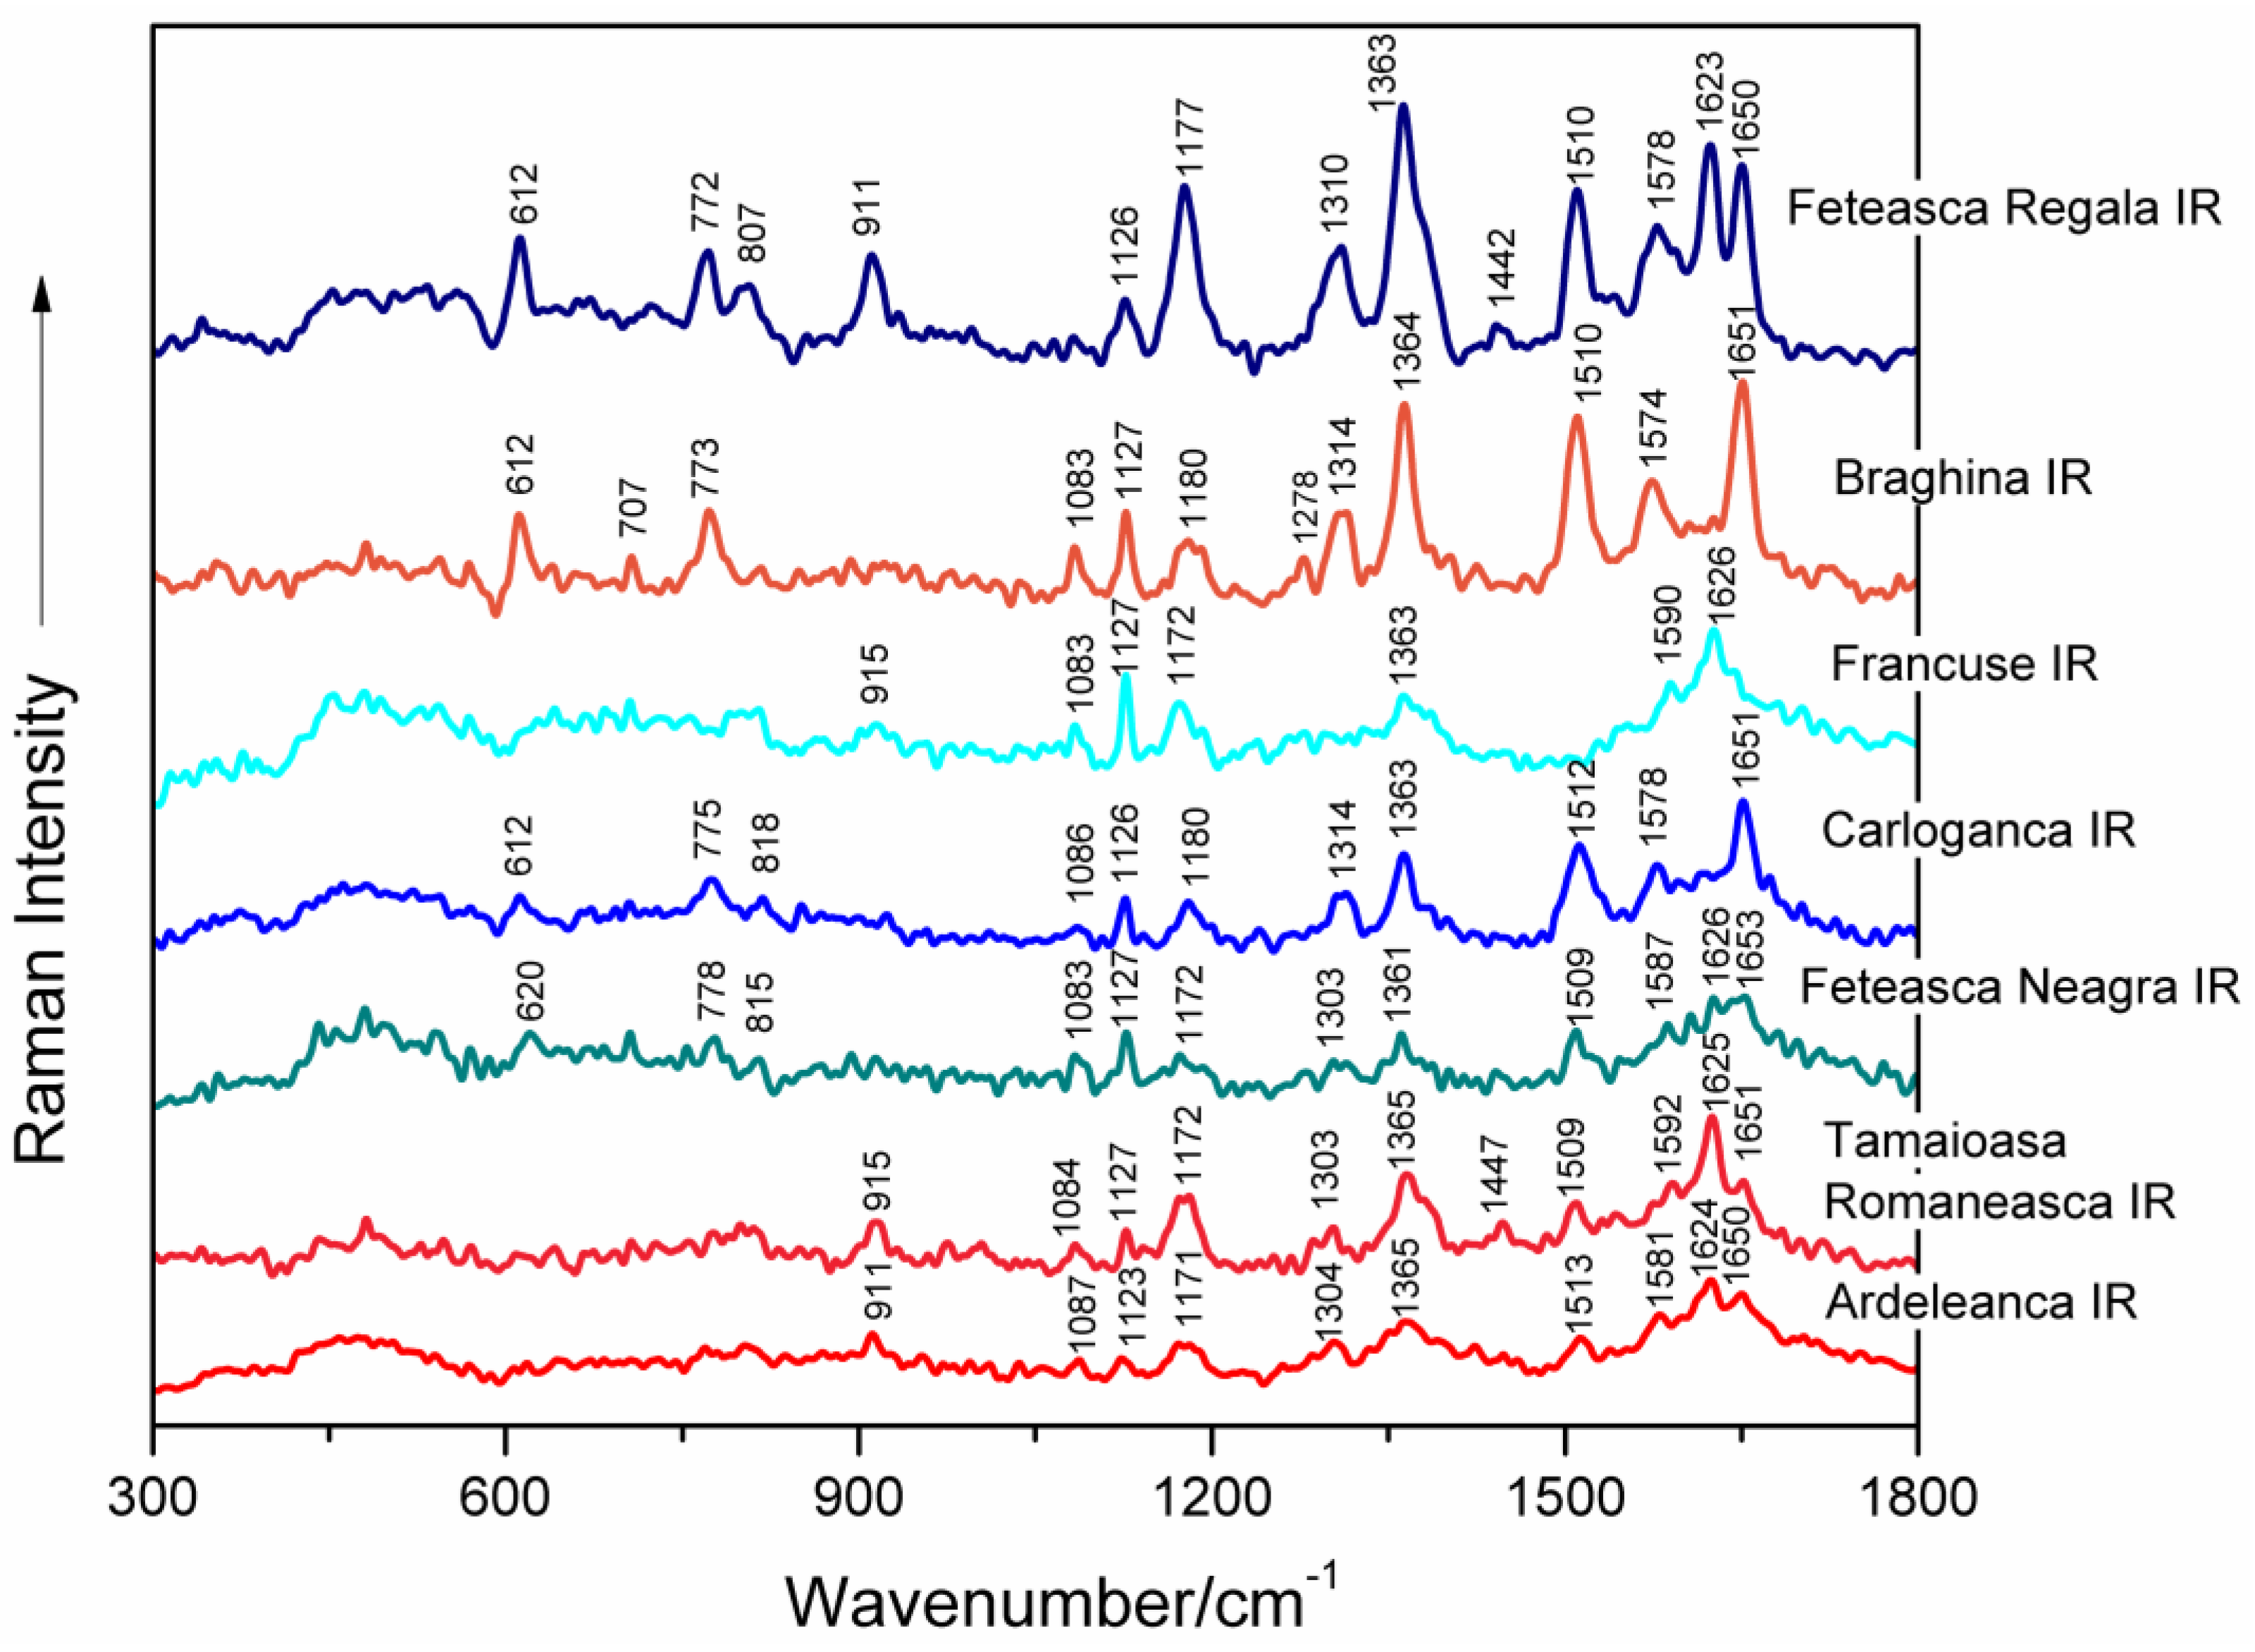
| Feteasca Regala IR | Braghina IR | Francuse IR | Carloganca IR | Feteasca Neagra IR | Tamaioasa Romaneasca IR | Ardeleanca IR | Tentative Assignment a |
|---|---|---|---|---|---|---|---|
| 354 w | dG, dT, dA str | ||||||
| 453 w | 454 m | 462 m | 441 w | 459 m | str deoxyribose | ||
| 473 w | 482 w | 480 m | 482 m | 481 w | 480 m | str deoxyribose | |
| 544 w | dC/dT (ring def) | ||||||
| 558 w | 569 w | dA (C2–H, N9–H wagging) | |||||
| 612 m | 612 m | 612 m | 620 w | Deoxyribose (C3′-endo-anti) | |||
| 661 w | 641 w | dG (ring breathing) | |||||
| 723 w | 707 w | 706 w | 706 w | dA (ring breathing) | |||
| 756 vw | dT (ring breathing) | ||||||
| 772 m | 773 m | 775 m | 778 w | 769 w | dC, C2′-endo-anti | ||
| 807 w | 815 w | 818 w | 803 w | bk 5′C–O–P–O–C3′ sym str | |||
| 851 w | deoxyribose C3′-endo | ||||||
| 911 m | 915 w | 924 w | 915 w | 911 m | Deoxyribose | ||
| 1083 m | 1083 w | 1086 w | 1083 w | 1084 w | 1087 w | bk PO2− sym str | |
| 1126 m | 1127 m | 1127 s | 1126 m | 1127 w | 1123 w | dA (C8–N9 str, N9–H, C8–H def) | |
| 1177 s | 1191 m | 1172 m | 1180 m | 1172 w | 1181 m | 1171 m | dA, dG (C5–C6 str) |
| 1220 vw | 1239 vw | 1240 w | dT (ring str), dA, dC, dG (C8–N9 str) | ||||
| 1278 w | 1266 w | dC (C-NH2 str + ring str) | |||||
| 1310 m | 1314 m | 1314 m | 1303 w | 1304 m | dA, dG (C–N str (Im)) | ||
| 1363 vs | 1364 vs | 1363 m | 1363 s | 1361 w | 1365 m | 1365 m | dT, dA, dG (C–N str (Py)) |
| 1425 w | 1423 w | Deoxyribose C2′H2 scissoring | |||||
| 1442 w | Deoxyribose CH2 | ||||||
| 1510 s | 1510 s | 1512 s | 1509 w | 1509 w | 1513 m | dA (NH2 def) | |
| 1553 sh | dT (in-plane ring str) | ||||||
| 1578 m | 1574 m | 1590 m | 1578 m | 1587 vw | 1581 m | dG, dA (C2=N3 of guanine) | |
| 1623 s | 1626 s | 1625 s | 1624 s | dA, dG, dC (NH2 def) | |||
| 1650 s | 1651 vs | 1651 s | 1653 w | 1651 w | 1650 s | dT, δ(H2O) (C=O str, C=C str) | |
| 1683 vw | dA (NH2 scissoring) |
| Grapevine Varieties DNA (cm−1) | Shift (cm−1) | Grapevine varieties IR Irradiated DNA (cm−1) | Tentative Assignments a |
|---|---|---|---|
| Feteasca Regala | Feteasca Regala IR | ||
| 1423 | +19 | 1442 | Deoxyribose C2′H2 scissoring |
| Braghina | Braghina IR | ||
| 1174 | +17 | 1191 | dA, dG (C5–C6 str) |
| 1228 | −8 | 1220 | dT (in-plane ring –CH3 str) |
| 1306 | +8 | 1314 | dA, dG (C–N str (Im)) |
| 1602 | −28 | 1574 | dA, dG, dC (NH2 def) |
| Francuse | Francuse IR | ||
| 721 | −15 | 706 | dA (ring breathing) |
| 741 | +15 | 756 | dT (ring breathing) |
| 796 | +19 | 815 | bk 5′C–O–P–O–C3′ sym str |
| 1119 | +8 | 1127 | dA (C8–N9 str, N9–H, C8–H def) |
| 1532 | +21 | 1553 | dT (in-plane ring str) |
| 1575 | +15 | 1590 | dG, dA (C2=N3 of guanine) |
| Carloganca | Carloganca IR | ||
| 1170 | +10 | 1180 | dA, dG (C5–C6 str) |
| 1230 | +10 | 1240 | dT (in-plane ring –CH3 str) |
| 1304 | +10 | 1314 | dA, dG (C–N str (Im)) |
| 1604 | −26 | 1578 | dA, dG, dC (NH2 def) |
| Feteasca Neagra | Feteasca Neagra IR | ||
| 452 | −11 | 441 | str deoxyribose |
| 1182 | −10 | 1172 | dA, dG (C5–C6 str) |
| 1575 | +12 | 1587 | dG, dA (C2=N3 of guanine) |
| Tamaioasa Romaneasca | Tamaioasa Romaneasca IR | ||
| 929 | −14 | 915 | Deoxyribose |
| 1601 | +24 | 1625 | dA, dG, dC (NH2 def) |
| Ardeleanca | Ardeleanca IR | ||
| 449 | +10 | 459 | str deoxyribose |
| 795 | +8 | 803 | bk 5′C–O–P–O–C3′ sym str |
| 1450 | −27 | 1423 | Deoxyribose CH2 |
© 2016 by the authors; licensee MDPI, Basel, Switzerland. This article is an open access article distributed under the terms and conditions of the Creative Commons Attribution (CC-BY) license (http://creativecommons.org/licenses/by/4.0/).
Share and Cite
Dina, N.E.; Muntean, C.M.; Leopold, N.; Fălămaș, A.; Halmagyi, A.; Coste, A. Structural Changes Induced in Grapevine (Vitis vinifera L.) DNA by Femtosecond IR Laser Pulses: A Surface-Enhanced Raman Spectroscopic Study. Nanomaterials 2016, 6, 96. https://doi.org/10.3390/nano6060096
Dina NE, Muntean CM, Leopold N, Fălămaș A, Halmagyi A, Coste A. Structural Changes Induced in Grapevine (Vitis vinifera L.) DNA by Femtosecond IR Laser Pulses: A Surface-Enhanced Raman Spectroscopic Study. Nanomaterials. 2016; 6(6):96. https://doi.org/10.3390/nano6060096
Chicago/Turabian StyleDina, Nicoleta E., Cristina M. Muntean, Nicolae Leopold, Alexandra Fălămaș, Adela Halmagyi, and Ana Coste. 2016. "Structural Changes Induced in Grapevine (Vitis vinifera L.) DNA by Femtosecond IR Laser Pulses: A Surface-Enhanced Raman Spectroscopic Study" Nanomaterials 6, no. 6: 96. https://doi.org/10.3390/nano6060096