
Graphene Oxide Bionanocomposite Coatings with High Oxygen Barrier Properties

 ,
, 
Abstract
:
1. Introduction
2. Results
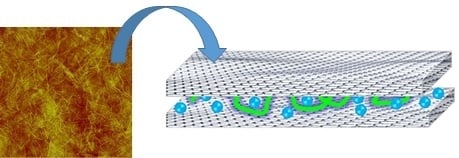
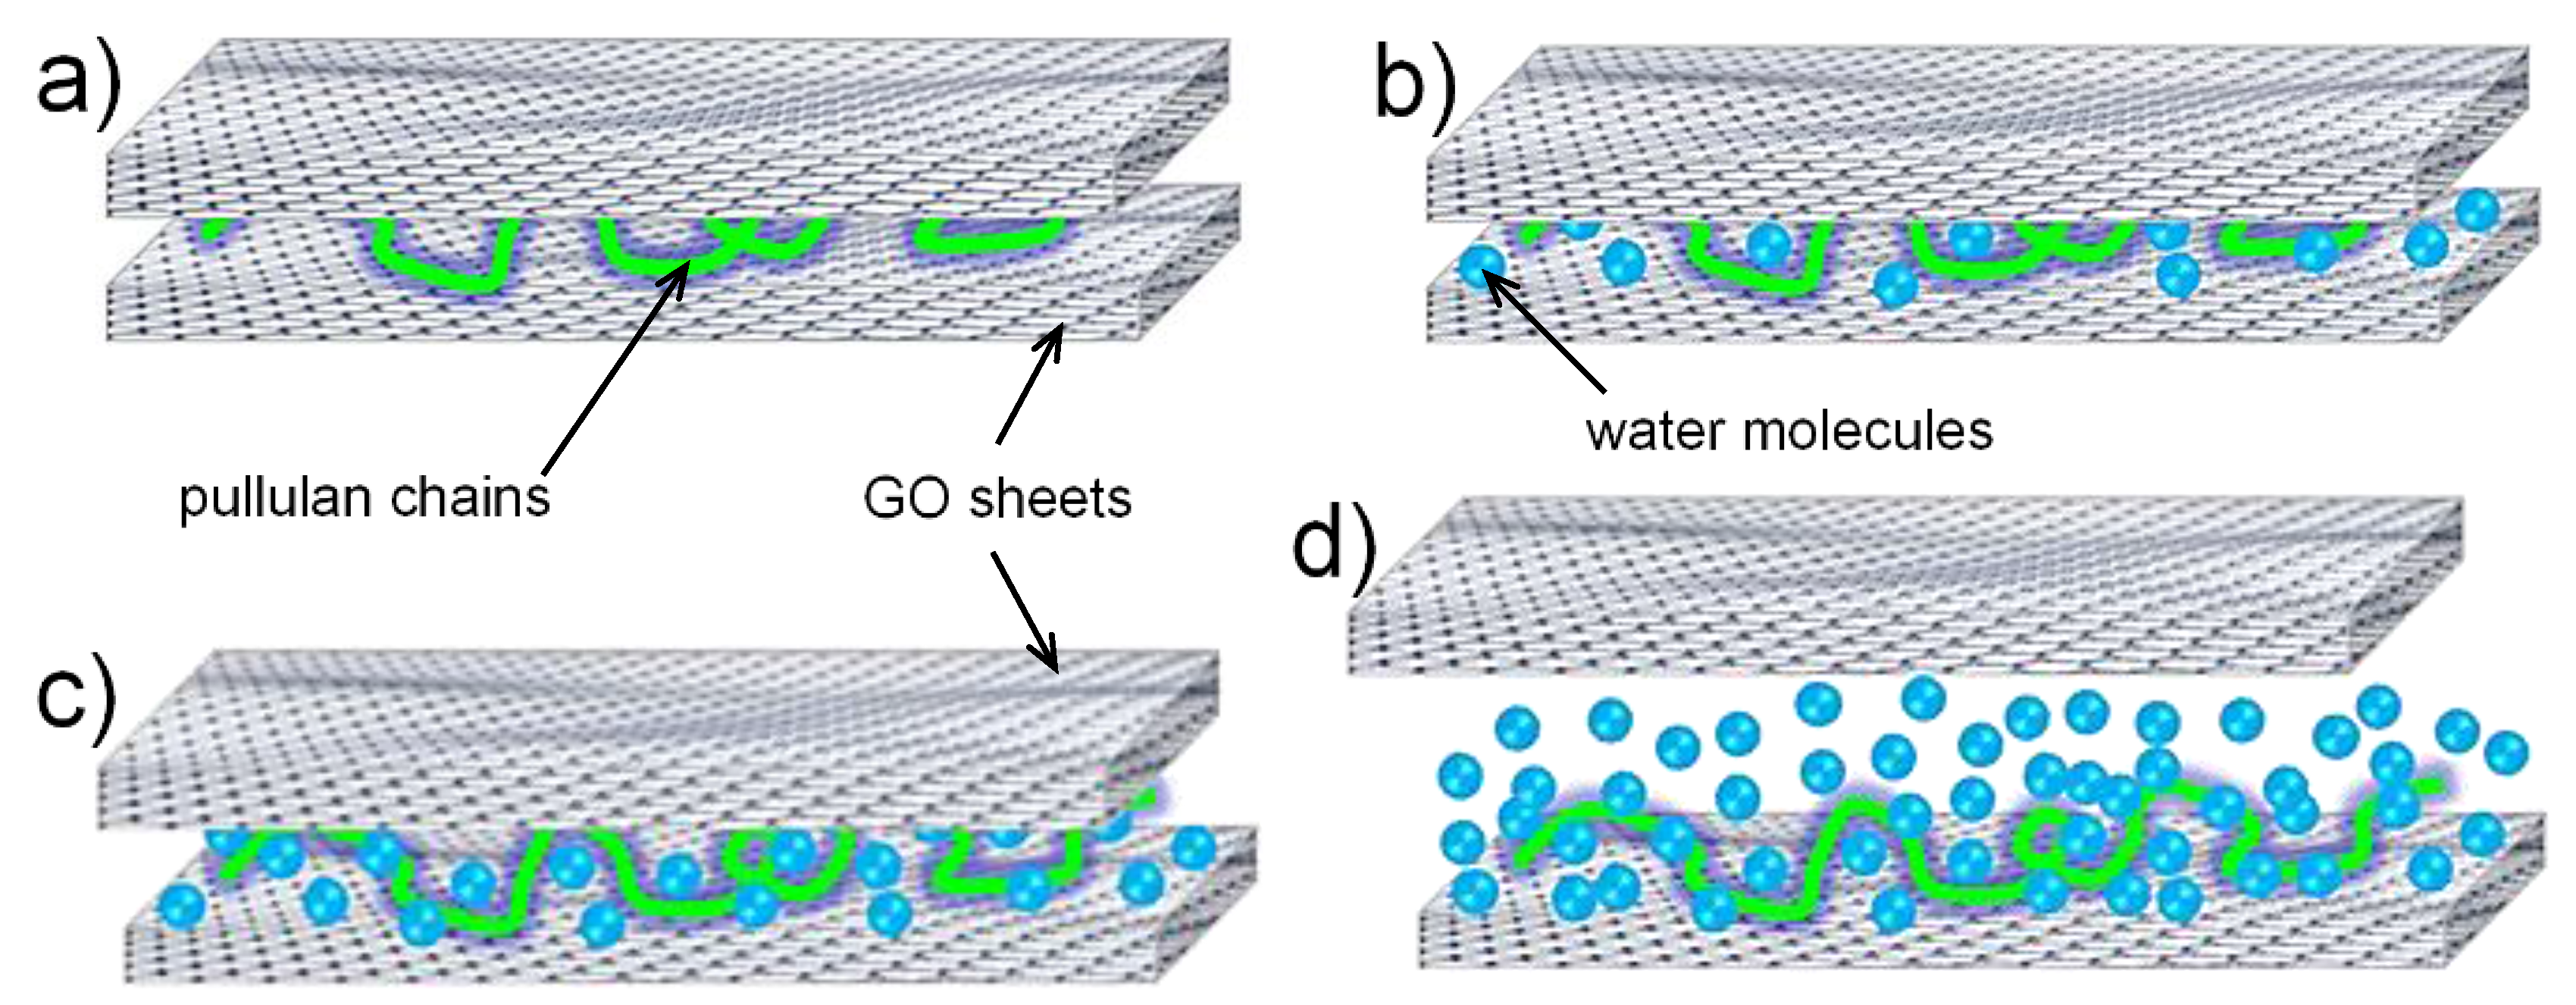
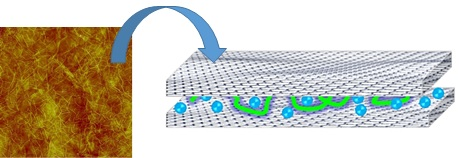
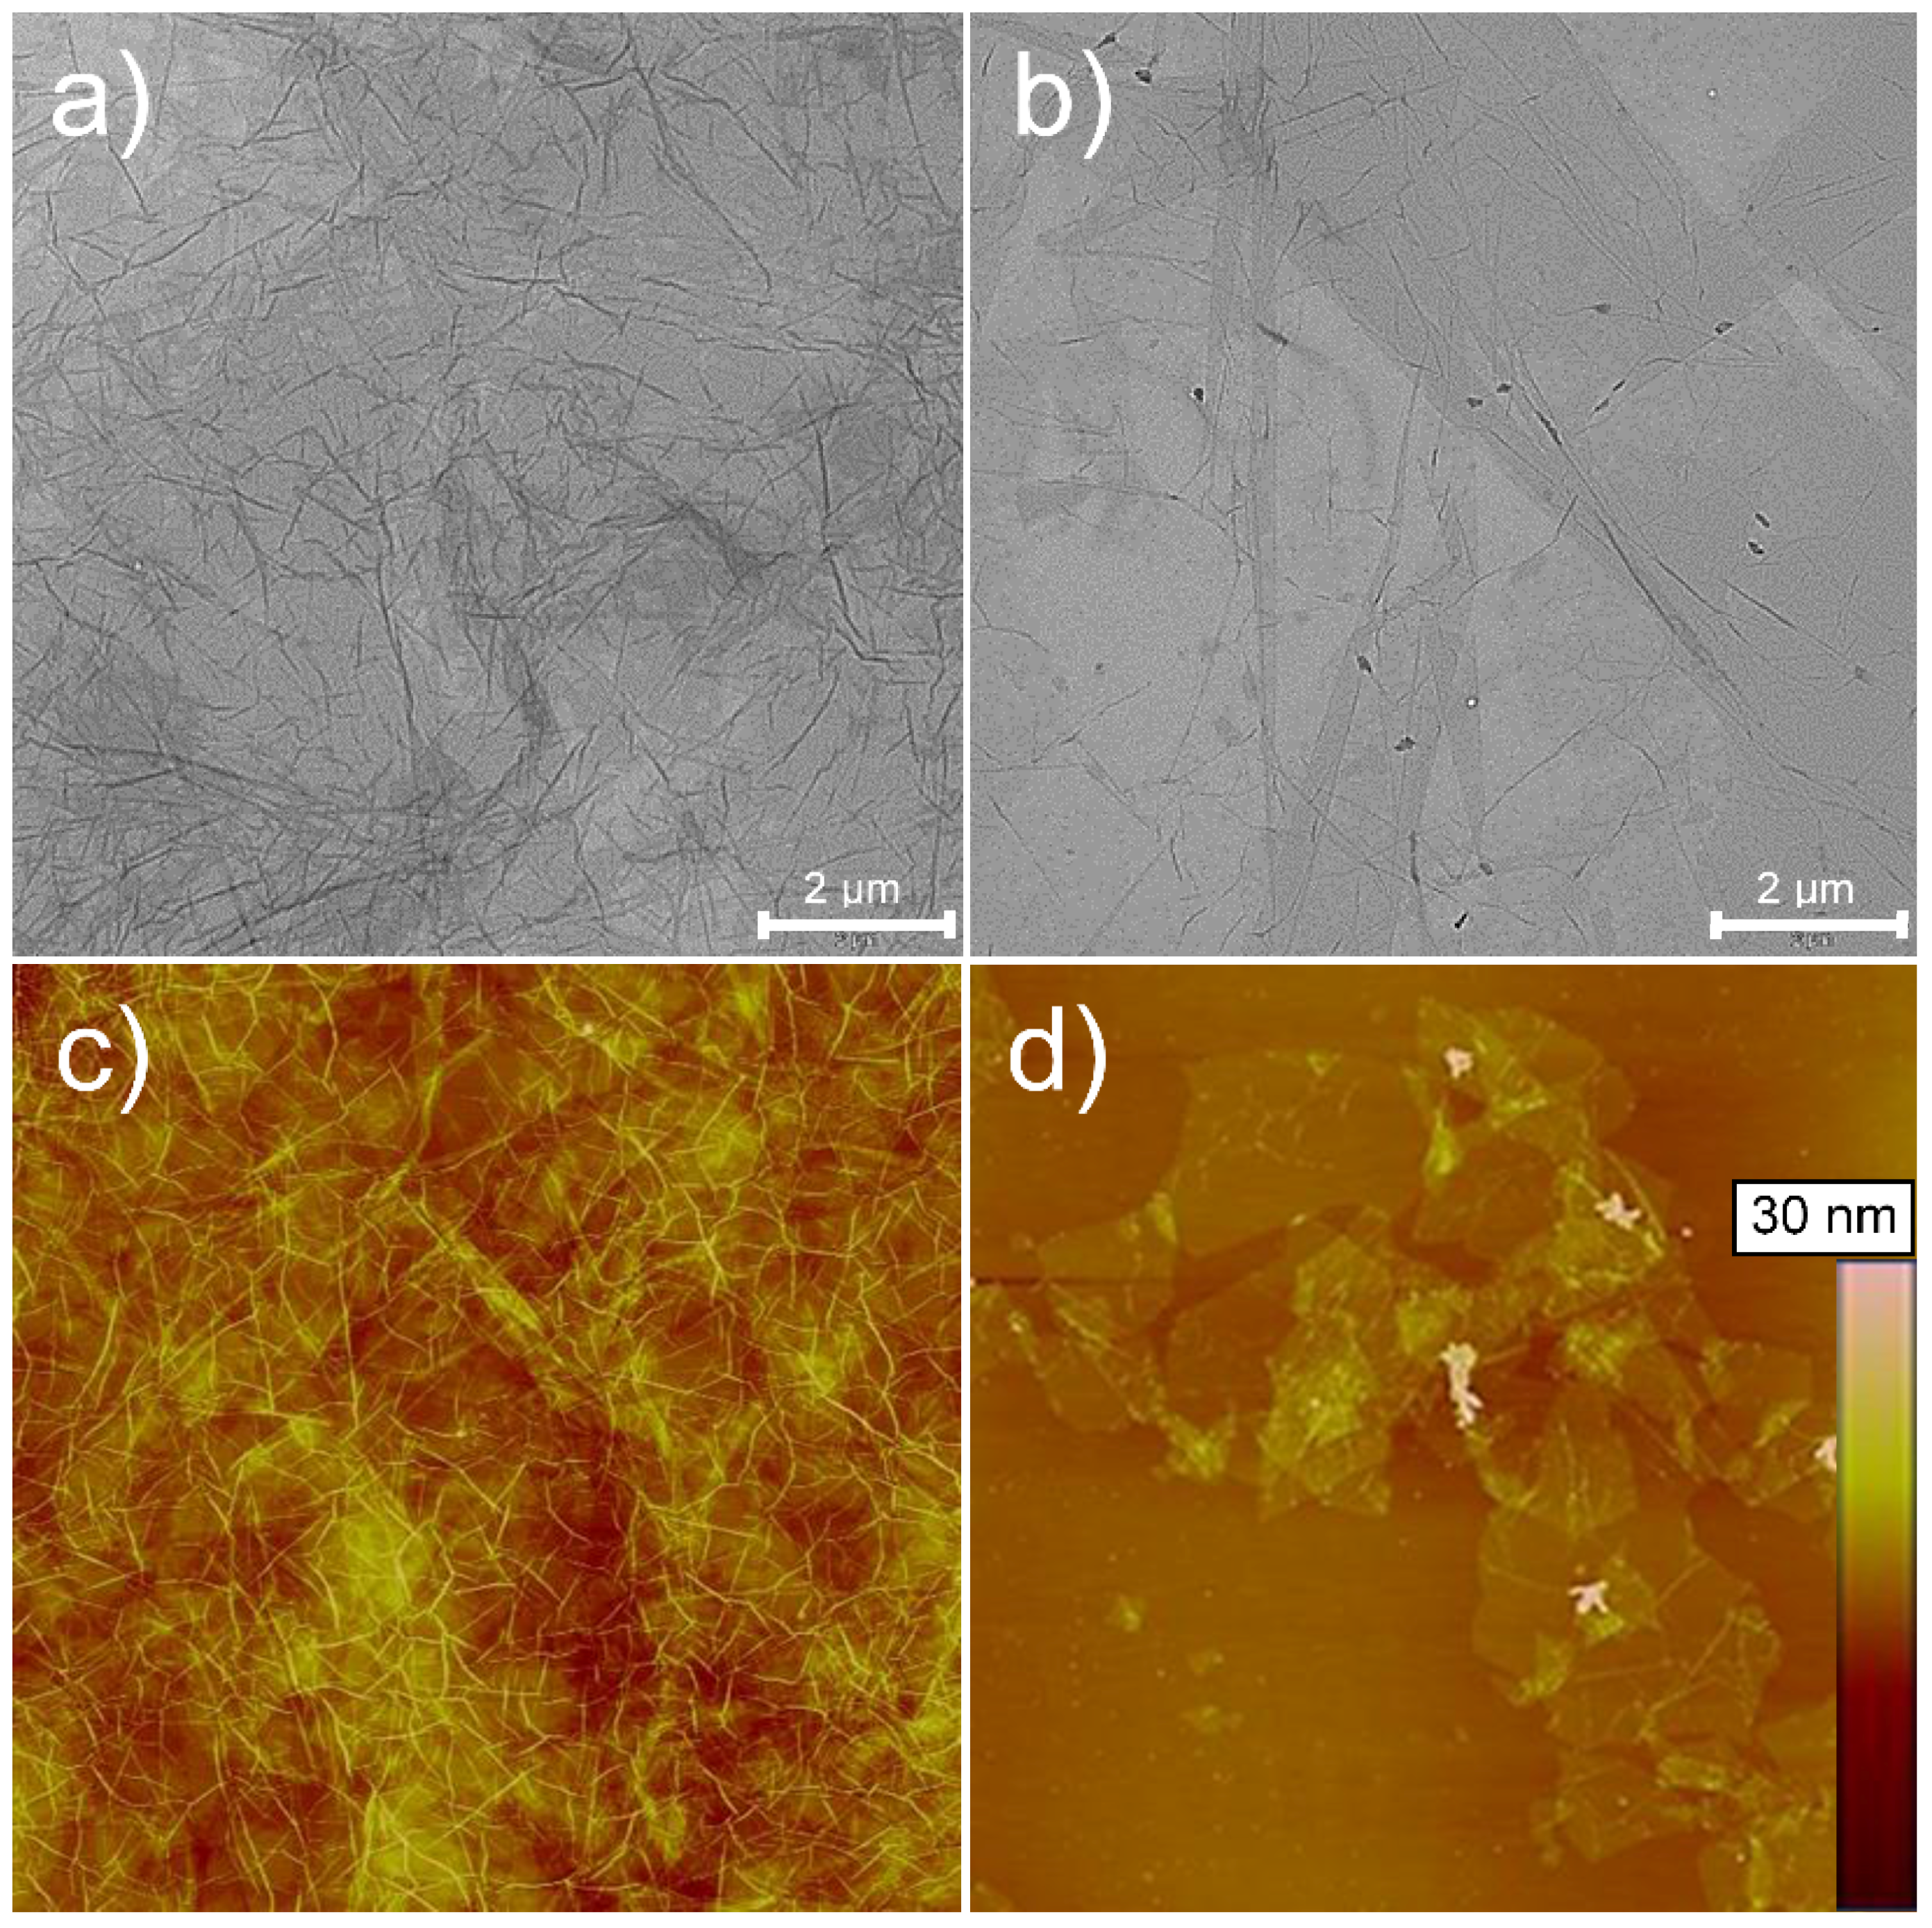
2.1. Morphological Characterization of GO
2.2. Thickness and Oxygen Barrier Performance
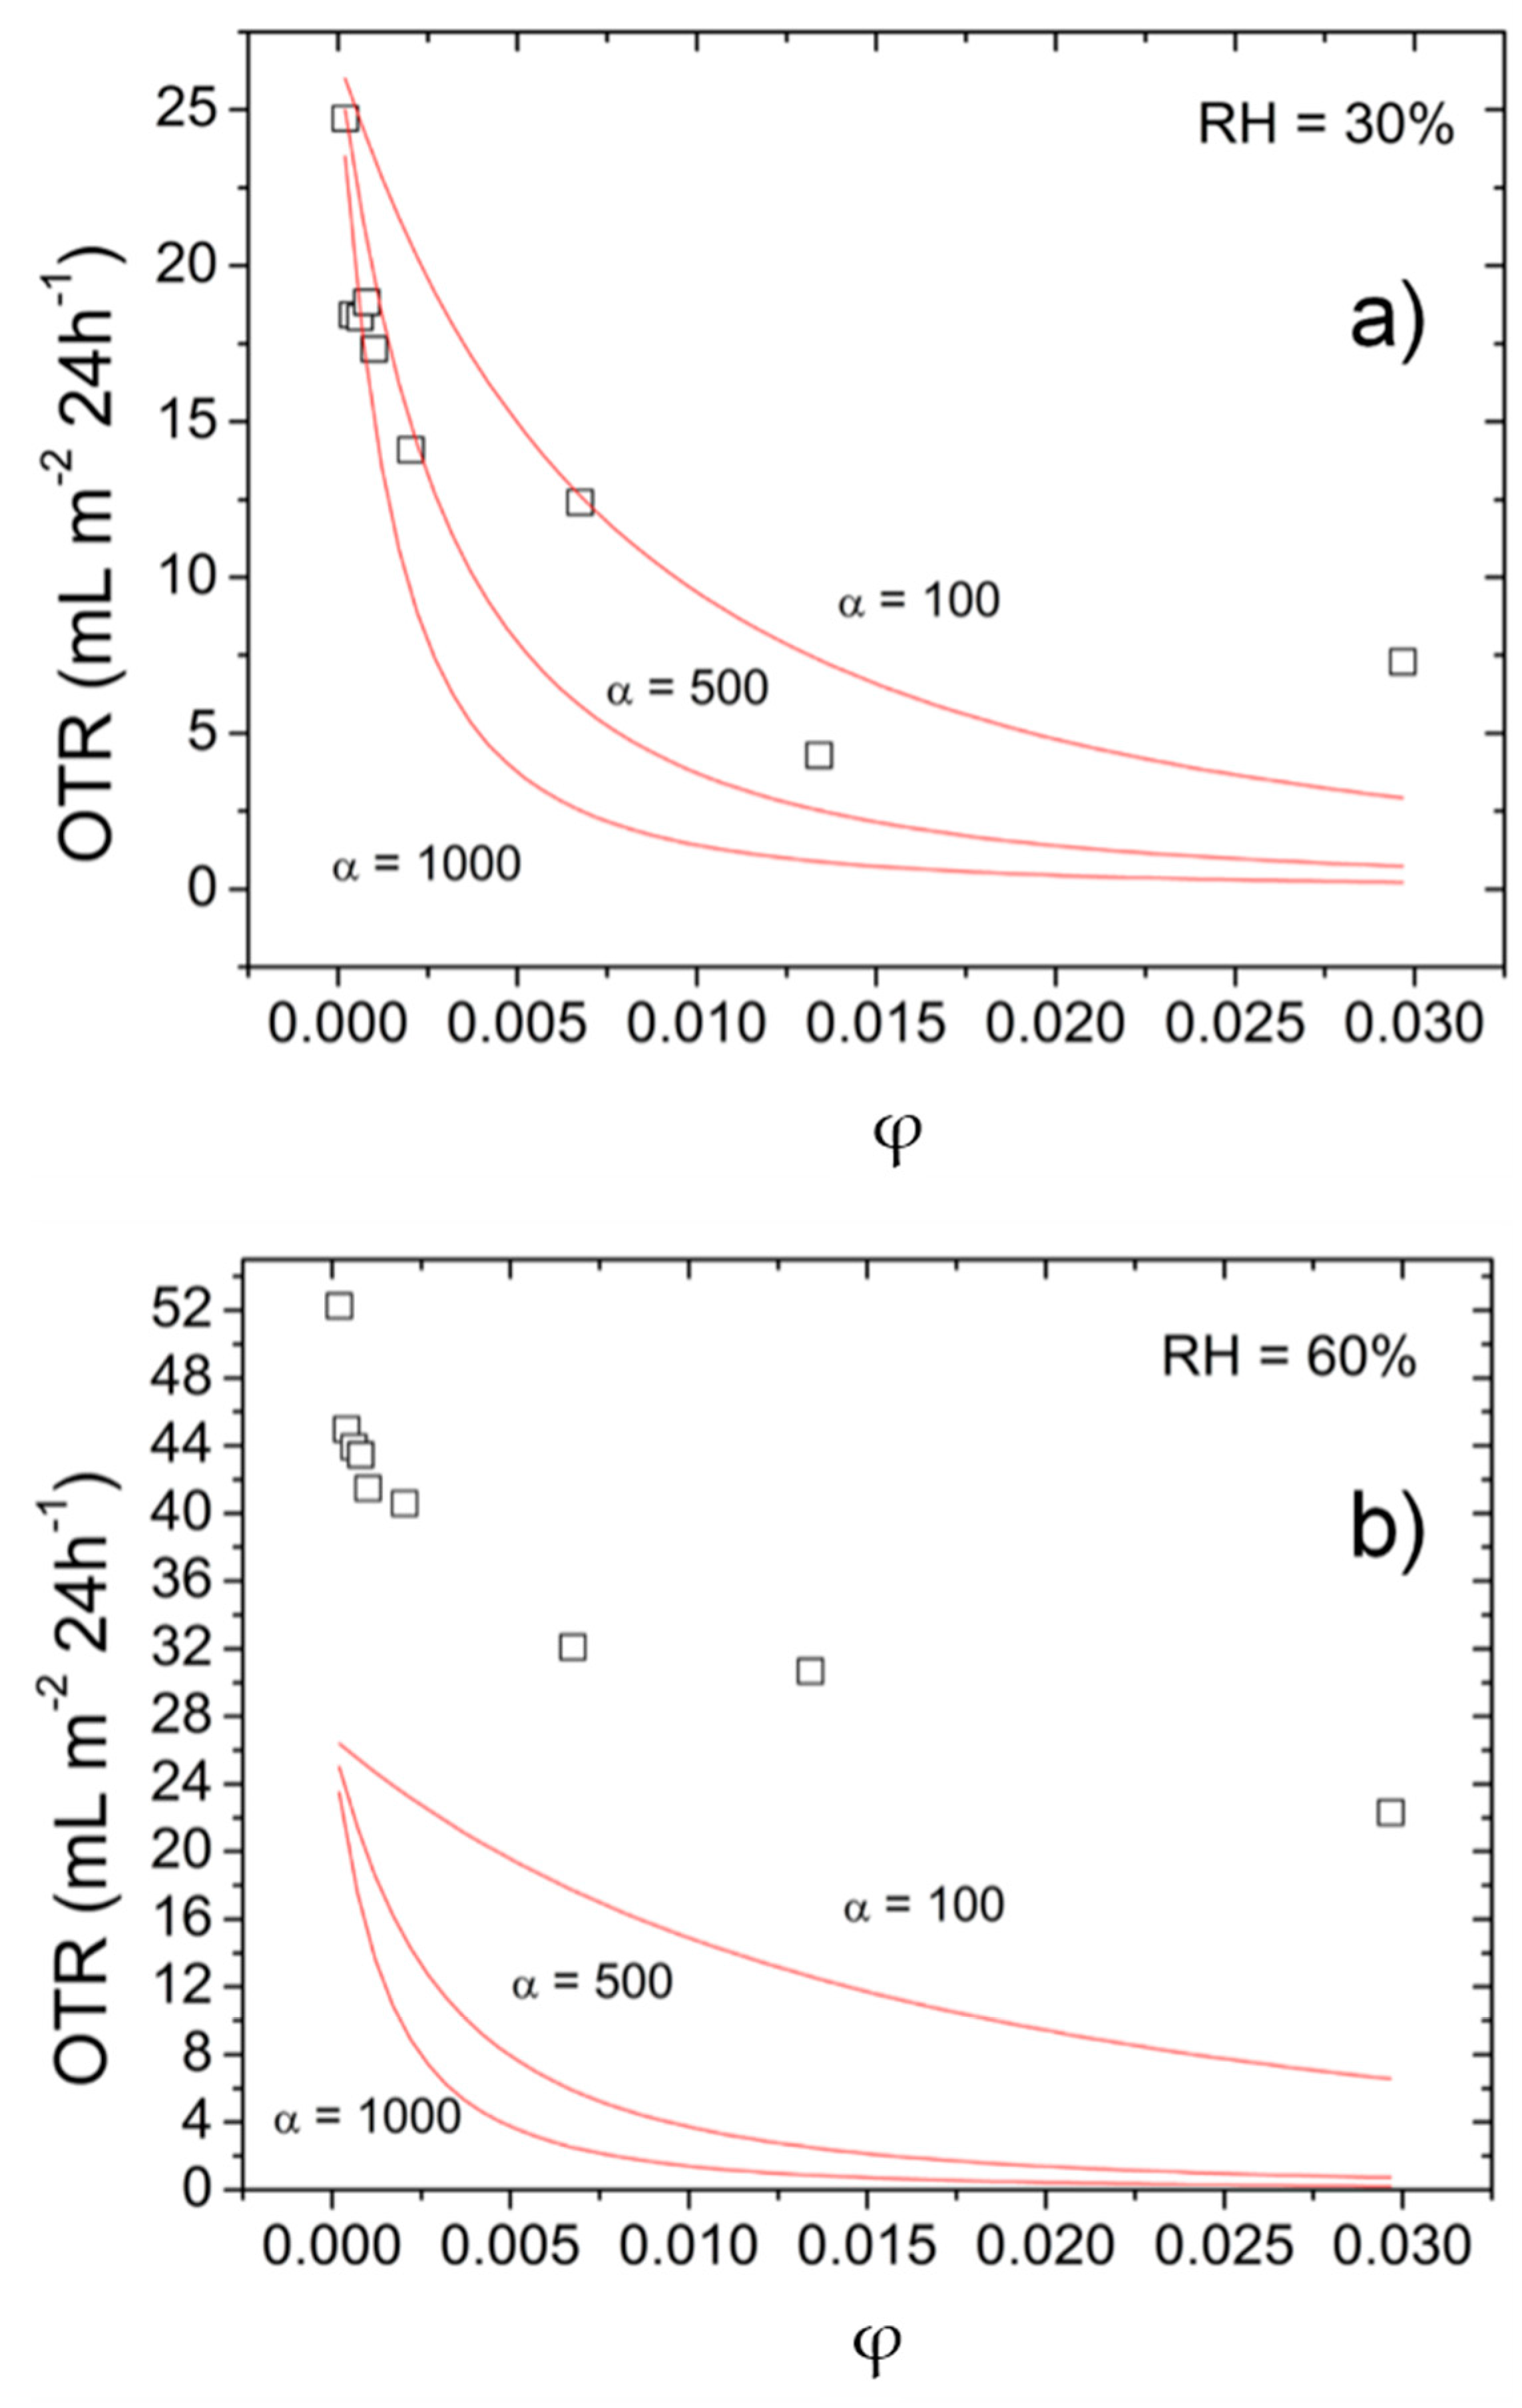
2.3. Modelling of OTR Data
2.4. Haze
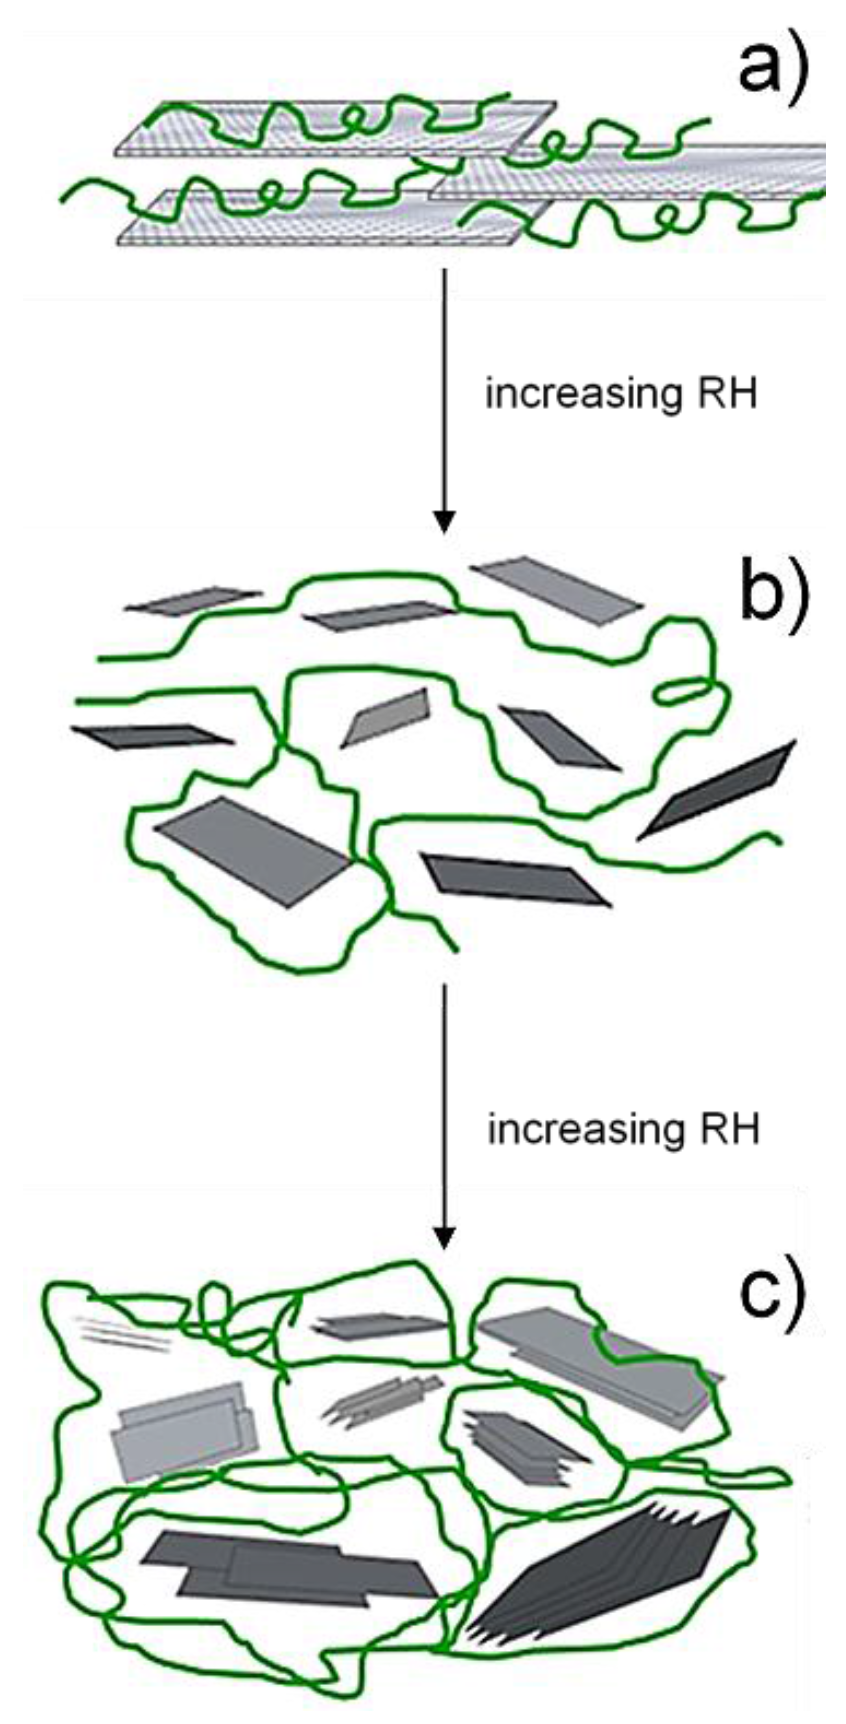
3. Discussion
4. Materials and Methods
4.1. Raw Materials and Reagents
4.2. Bionanocomposite Coatings Preparation
4.3. Analyses
Acknowledgments
Author Contributions
Conflicts of Interest
References
- Sanchez, C.; de A. A. Soler-Illia, G.J.; Ribot, F.; Lalot, T.; Mayer, C.R.; Cabuil, V. Designed hybrid organic–inorganic nanocomposites from functional nanobuilding blocks. Chem. Mater. 2001, 13, 3061–3083. [Google Scholar] [CrossRef]
- International Organization for Standardization. Nanotechnologies—Vocabulary—Part 2: Nano-Objects; ISO: Geneva, Switzerland, 2015. [Google Scholar]
- Brune, H.; Ernst, H.; Grunwald, A.; Grünwald, W.; Hofmann, H.; Krug, H.; Janich, P.; Mayor, M.; Rathgeber, W.; Schmid, G.; et al. Nanotechnology: Assessment and Perspectives; Springer: Berlin, Germany, 2006; p. 63. [Google Scholar]
- Dainelli, D.; Gontard, N.; Spyropoulos, D.; Zondervan-van den Beuken, E.; Tobback, P. Active and intelligent food packaging: Legal aspects and safety concerns. EFSA Forum 2008, 19, S103–S112. [Google Scholar] [CrossRef]
- Ghaani, M.; Cozzolino, C.A.; Castelli, G.; Farris, S. An overview of the intelligent packaging technologies in the food sector. Trends Food Sci. Technol. 2016, 51, 1–11. [Google Scholar] [CrossRef]
- Wang, Y.; Wei, H.; Lu, Y.; Wei, S.; Wujcik, E.K.; Guo, Z. Multifunctional carbon nanostructures for advanced energy storage applications. Nanomaterials 2015, 5, 755–777. [Google Scholar] [CrossRef]
- Uysal Unalan, I.; Cerri, G.; Marcuzzo, E.; Cozzolino, C.A.; Farris, S. Nanocomposite films and coatings using inorganic nanobuilding blocks (NBB): Current applications and future opportunities in the food packaging sector. RSC Adv. 2014, 4, 29393–29428. [Google Scholar] [CrossRef]
- Bunch, J.S.; Verbridge, S.S.; Alden, J.S.; van der Zande, A.M.; Parpia, J.M.; Craighead, H.G.; McEuen, P.L. Impermeable atomic membranes from graphene sheets. Nano Lett. 2008, 8, 2458–2462. [Google Scholar] [CrossRef] [PubMed]
- Leenaerts, O.; Partoens, B.; Peeters, F. Graphene: A perfect nanoballoon. Appl. Phys. Lett. 2008, 93, 193107–193110. [Google Scholar] [CrossRef]
- Qin, X.; Meng, Q.; Feng, Y.; Gao, Y. Graphene with line defect as a membrane for gas separation: Design via a first-principles modeling. Surf. Sci. 2012, 607, 153–158. [Google Scholar] [CrossRef]
- Blankenburg, S.; Bieri, M.; Fasel, R.; Müllen, K.; Pignedoli, C.A.; Passerone, D. Porous graphene as an atmospheric nanofilter. Small 2010, 6, 2266–2271. [Google Scholar] [CrossRef] [PubMed]
- Schrier, J.J. Helium separation using porous graphene membranes. Phys. Chem. Lett. 2010, 1, 2284–2287. [Google Scholar] [CrossRef]
- Yoo, B.M.; Shin, H.J.; Yoon, H.W.; Park, H.B. Graphene and graphene oxide and their uses in barrier polymers. J. Appl. Polym. Sci. 2014, 131, 39628–39650. [Google Scholar] [CrossRef]
- Farris, S.; Uysal Unalan, I.; Introzzi, L.; Fuentes-Alventosa, J.M.; Cozzolino, C.A. Pullulan-Based films and coatings for food packaging: present applications, emerging opportunities, and future challenges. J. Appl. Polym. Sci. 2014, 131, 40539–40550. [Google Scholar] [CrossRef]
- Utracki, L.A.; Sepehr, M.; Boccaleri, E. Synthetic, layered nanoparticles for polymeric nanocomposites (PNCs). Polym. Adv. Technol. 2007, 18, 1–37. [Google Scholar] [CrossRef]
- Huang, H.D.; Ren, P.G.; Xu, J.Z.; Xu, L.; Zhong, G.J.; Hsiao, B.S.; Li, Z.M. Improved barrier properties of poly(lactic acid) with randomly dispersed graphene oxide nanosheets. J. Membr. Sci. 2014, 464, 110–118. [Google Scholar] [CrossRef]
- Auras, R.; Harte, B.; Selke, S. Effect of water on the oxygen barrier properties of poly(ethylene terephthalate) and polylactide films. J. Appl. Polym. Sci. 2004, 92, 1790–1803. [Google Scholar] [CrossRef]
- Hu, Y.S.; Mehta, S.; Schiraldi, D.A.; Hiltner, A.; Baer, E. Effect of water sorption on oxygen-barrier properties of aromatic polyamides. J. Polym. Sci. Polym. Phys. 2005, 43, 1365–1381. [Google Scholar] [CrossRef]
- Salame, M. Barrier polymers. In The Wiley Encyclopedia of Packaging Technology, 1st ed.; Bakker, M., Ed.; John Wiley and Sons Inc.: New York, NY, USA, 1986; pp. 51–52. [Google Scholar]
- Brown, W.E. Vinyldene chloride copolymers. In The Wiley Encyclopedia of Packaging Technology, 1st ed.; Bakker, M., Ed.; John Wiley and Sons Inc.: New York, NY, USA, 1986; p. 694. [Google Scholar]
- Fuentes-Alventosa, J.M.; Introzzi, L.; Santo, N.; Cerri, G.; Brundu, A.; Farris, S. Self-Assembled nanostructured biohybrid coatings by an integrated ‘sol-gel/intercalation’ approach. RSC Adv. 2013, 3, 25086–25096. [Google Scholar] [CrossRef]
- Lape, N.K.; Nuxoll, E.N.; Cussler, E.L. Polydisperse flakes in barrier films. J. Membr. Sci. 2004, 236, 29–37. [Google Scholar] [CrossRef]
- DeRocher, J.P.; Gettelfinger, B.T.; Wang, J.; Nuxoll, E.E.; Cussler, E. Barrier membranes with different sizes of aligned flakes. J. Membr. Sci. 2005, 254, 21–30. [Google Scholar] [CrossRef]
- Introzzi, L.; Blomfeldt, T.O.; Trabattoni, S.; Tavazzi, S.; Santo, N.; Schiraldi, A.; Piergiovanni, L.; Farris, S. Ultrasoundassisted pullulan/montmorillonite bionanocomposite coating with high oxygen barrier properties. Langmuir 2012, 28, 11206–11214. [Google Scholar] [CrossRef] [PubMed]
- Svagan, A.J.; Åkesson, A.; Cárdenas, M.; Bulut, S.; Knudsen, J.C.; Risbo, J.; Plackett, D. Transparent films based on pla and montmorillonite with tunable oxygen barrier properties. Biomacromolecules 2012, 13, 397–405. [Google Scholar] [CrossRef] [PubMed]
- Kurek, M.; Guinault, A.; Voilley, A.; Galić, K.; Debeaufort, F. Effect of relative humidity on carvacrol release and permeation properties of chitosan based films and coatings. Food Chem. 2014, 144, 9–17. [Google Scholar] [CrossRef] [PubMed]
- Farris, S.; Introzzi, L.; Fuentes-Alventosa, J.M.; Santo, N.; Rocca, R.; Piergiovanni, L. Self-assembled pullulan–silica oxygen barrier hybrid coatings for food packaging applications. J. Agric. Food Chem. 2012, 60, 782–790. [Google Scholar] [CrossRef] [PubMed]
- Cozzolino, C.A.; Cerri, G.; Brundu, A.; Farris, S. Microfibrillated cellulose (MFC): Pullulan bionanocomposite films. Cellulose 2014, 21, 4323–4335. [Google Scholar] [CrossRef]
- Xiao, Q.; Tong, Q.; Zhou, Y.; Deng, F. Rheological properties of pullulan–sodium alginate based solutions during film formation. Carbohydr. Polym. 2015, 130, 49–56. [Google Scholar] [CrossRef] [PubMed]
- Brown, W.E. Plastics in Food Packaging: Properties, Design and Fabrication; Dekker: New York, NY, USA, 1992; pp. 200–202. [Google Scholar]
- Lui, C.W.; Clarkson, M.; Nicholls, R.W. An approximation for spectral extinction of atmospheric aerosols. J. Quant. Spectrosc. Radiat. Transf. 1996, 55, 519–531. [Google Scholar] [CrossRef]
- Tilley, R.J.D. Colour and the Optical Properties of Materials, 2nd ed.; Wiley: Hoboken, NJ, USA, 2008; p. 42. [Google Scholar]


| Filler Content | l (µm) | OTR (mL•m−2•24 h−1) | Haze (%) | ||||
|---|---|---|---|---|---|---|---|
| wt % | ϕ † | 0% RH | 30% RH | 60% RH | 90% RH | ||
| Uncoated PET | - | 12.00 ± 0.08 c | 129.23 ± 2.6 a | 120.67 ± 0.9 a | 115.10 ± 2.76 a | 107.47 ± 0.74 a | 2.72 ± 0.08 abc |
| PET/pullulan | - | 12.75 ± 0.07 ab | 5.99 ± 0.02 b | 26.74 ± 0.29 b | 45.80 ± 2.65 c | 100.73 ± 3.23 c | 2.63 ± 0.22 abc |
| 0.02 | 0.00020 | 12.63 ± 0.00 b | 0.99 ± 0.03 c | 24.72 ± 2.13 b | 52.26 ± 0.64 b | 107.36 ± 0.57 ab | 2.49 ± 0.1 c |
| 0.04 | 0.00041 | 12.67 ± 0.05 b | N.D. | 18.43 ± 2.00 c | 44.96 ± 2.87 cd | 100.93 ± 4.17 c | 2.74 ± 0.02 ab |
| 0.06 | 0.00061 | 12.72 ± 0.00 ab | N.D. | 18.34 ± 0.98 c | 43.92 ± 0.15 cd | 101.69 ± 1.00 abc | 2.70 ± 0.13 abc |
| 0.08 | 0.00081 | 12.84 ± 0.16 ab | N.D. | 18.82±1.16 c | 43.46 ± 1.76 cd | 101.62 ± 3.19 abc | 2.57 ± 0.11 bc |
| 0.1 | 0.00102 | 12.77 ± 0.05 ab | N.D. | 17.32 ± 0.42 cd | 41.48 ± 2.77 cd | 101.55 ± 0.71 bc | 2.87 ± 0.04 a |
| 0.2 | 0.00203 | 12.78 ± 0.05 ab | N.D. | 14.09 ± 1.35 de | 40.57 ± 2.88 d | 99.71 ± 1.83 c | 2.57 ± 0.01 bc |
| 0.5 | 0.00675 | 12.88 ± 0.00 a | N.D. | 12.40 ± 3.56 e | 32.08 ± 2.41 e | 99.10 ± 0.10 c | 2.78 ± 0.05 ab |
| 1 | 0.01341 | 12.79 ± 0.10 ab | N.D. | 4.30 ± 1.19 f | 30.66 ± 2.72 e | 100.04 ± 4.73 c | 2.81 ± 0.12 a |
| 1.5 | 0.02967 | 12.80 ± 0.10 ab | N.D. | 7.28 ± 0.98 f | 22.31 ± 0.65 f | 103.44 ± 3.62 abc | 3.26 ± 0.31 e |
© 2016 by the authors; licensee MDPI, Basel, Switzerland. This article is an open access article distributed under the terms and conditions of the Creative Commons Attribution (CC-BY) license (http://creativecommons.org/licenses/by/4.0/).
Share and Cite
Uysal Unalan, I.; Boyacı, D.; Ghaani, M.; Trabattoni, S.; Farris, S. Graphene Oxide Bionanocomposite Coatings with High Oxygen Barrier Properties. Nanomaterials 2016, 6, 244. https://doi.org/10.3390/nano6120244
Uysal Unalan I, Boyacı D, Ghaani M, Trabattoni S, Farris S. Graphene Oxide Bionanocomposite Coatings with High Oxygen Barrier Properties. Nanomaterials. 2016; 6(12):244. https://doi.org/10.3390/nano6120244
Chicago/Turabian StyleUysal Unalan, Ilke, Derya Boyacı, Masoud Ghaani, Silvia Trabattoni, and Stefano Farris. 2016. "Graphene Oxide Bionanocomposite Coatings with High Oxygen Barrier Properties" Nanomaterials 6, no. 12: 244. https://doi.org/10.3390/nano6120244
APA StyleUysal Unalan, I., Boyacı, D., Ghaani, M., Trabattoni, S., & Farris, S. (2016). Graphene Oxide Bionanocomposite Coatings with High Oxygen Barrier Properties. Nanomaterials, 6(12), 244. https://doi.org/10.3390/nano6120244