2.2. Effect of Catalyst Concentration
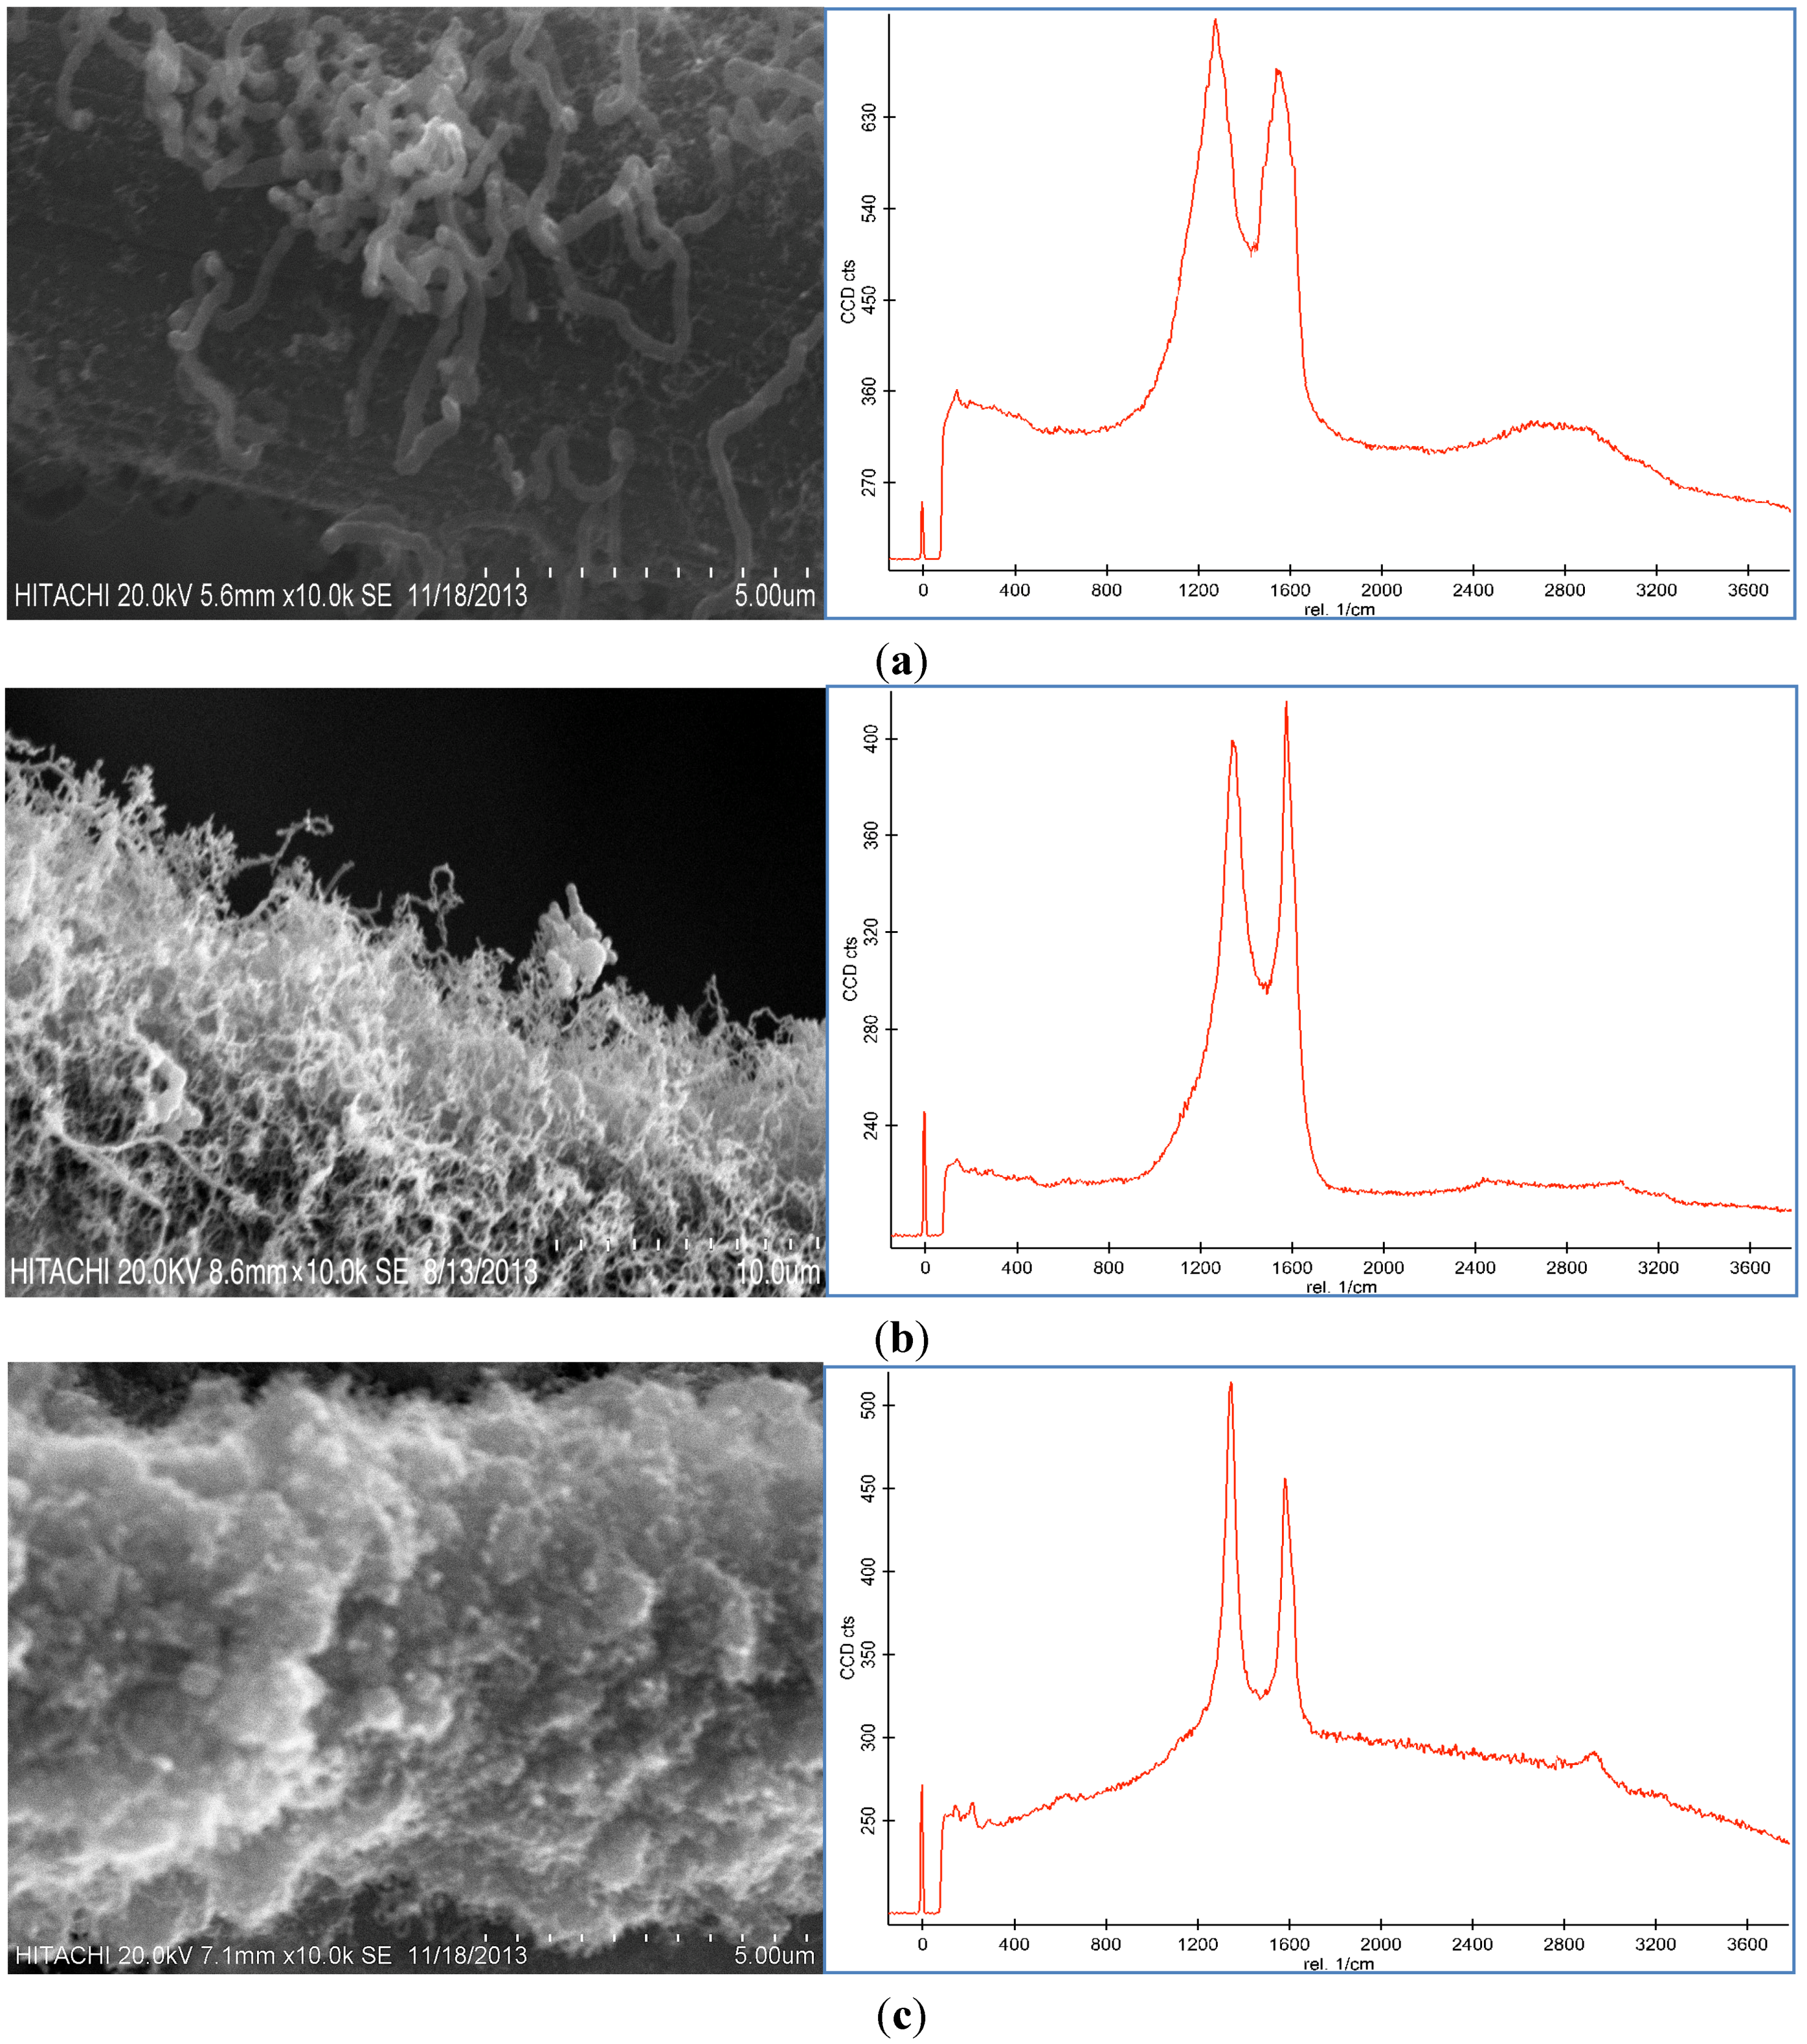
Representative SEM images and Raman spectroscopy graphs of different forms of the CNF coated CF are shown in
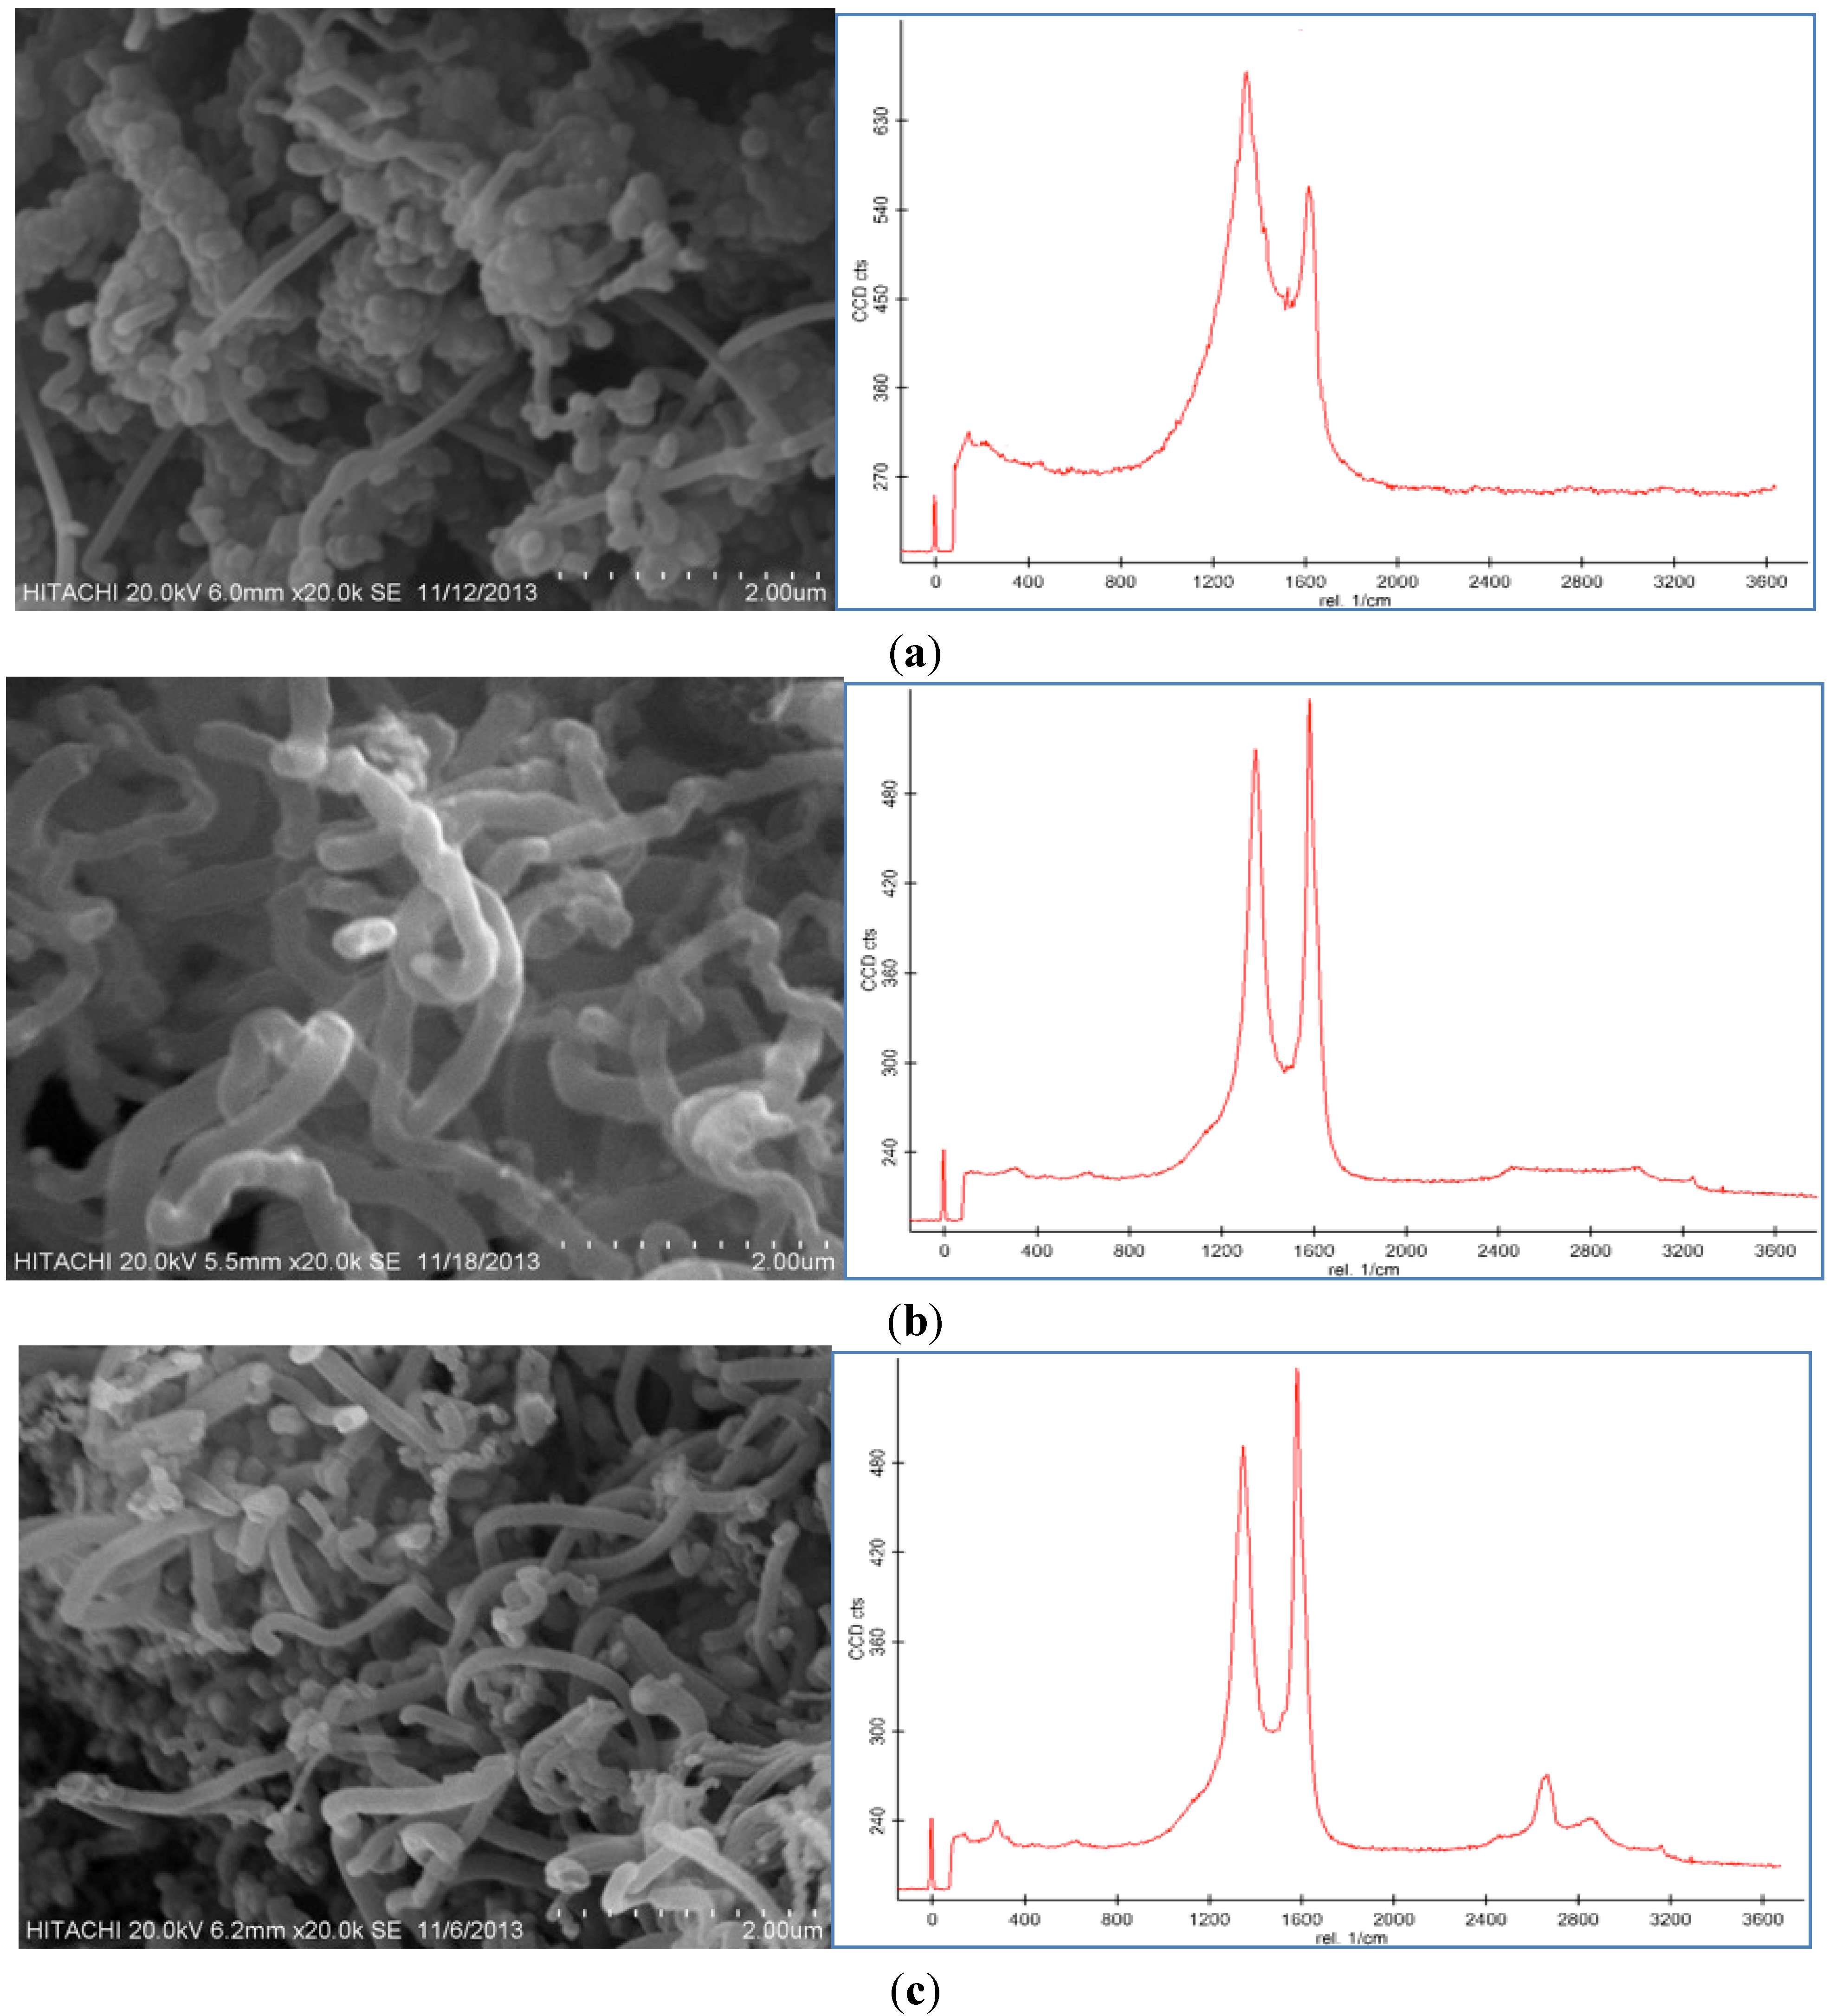
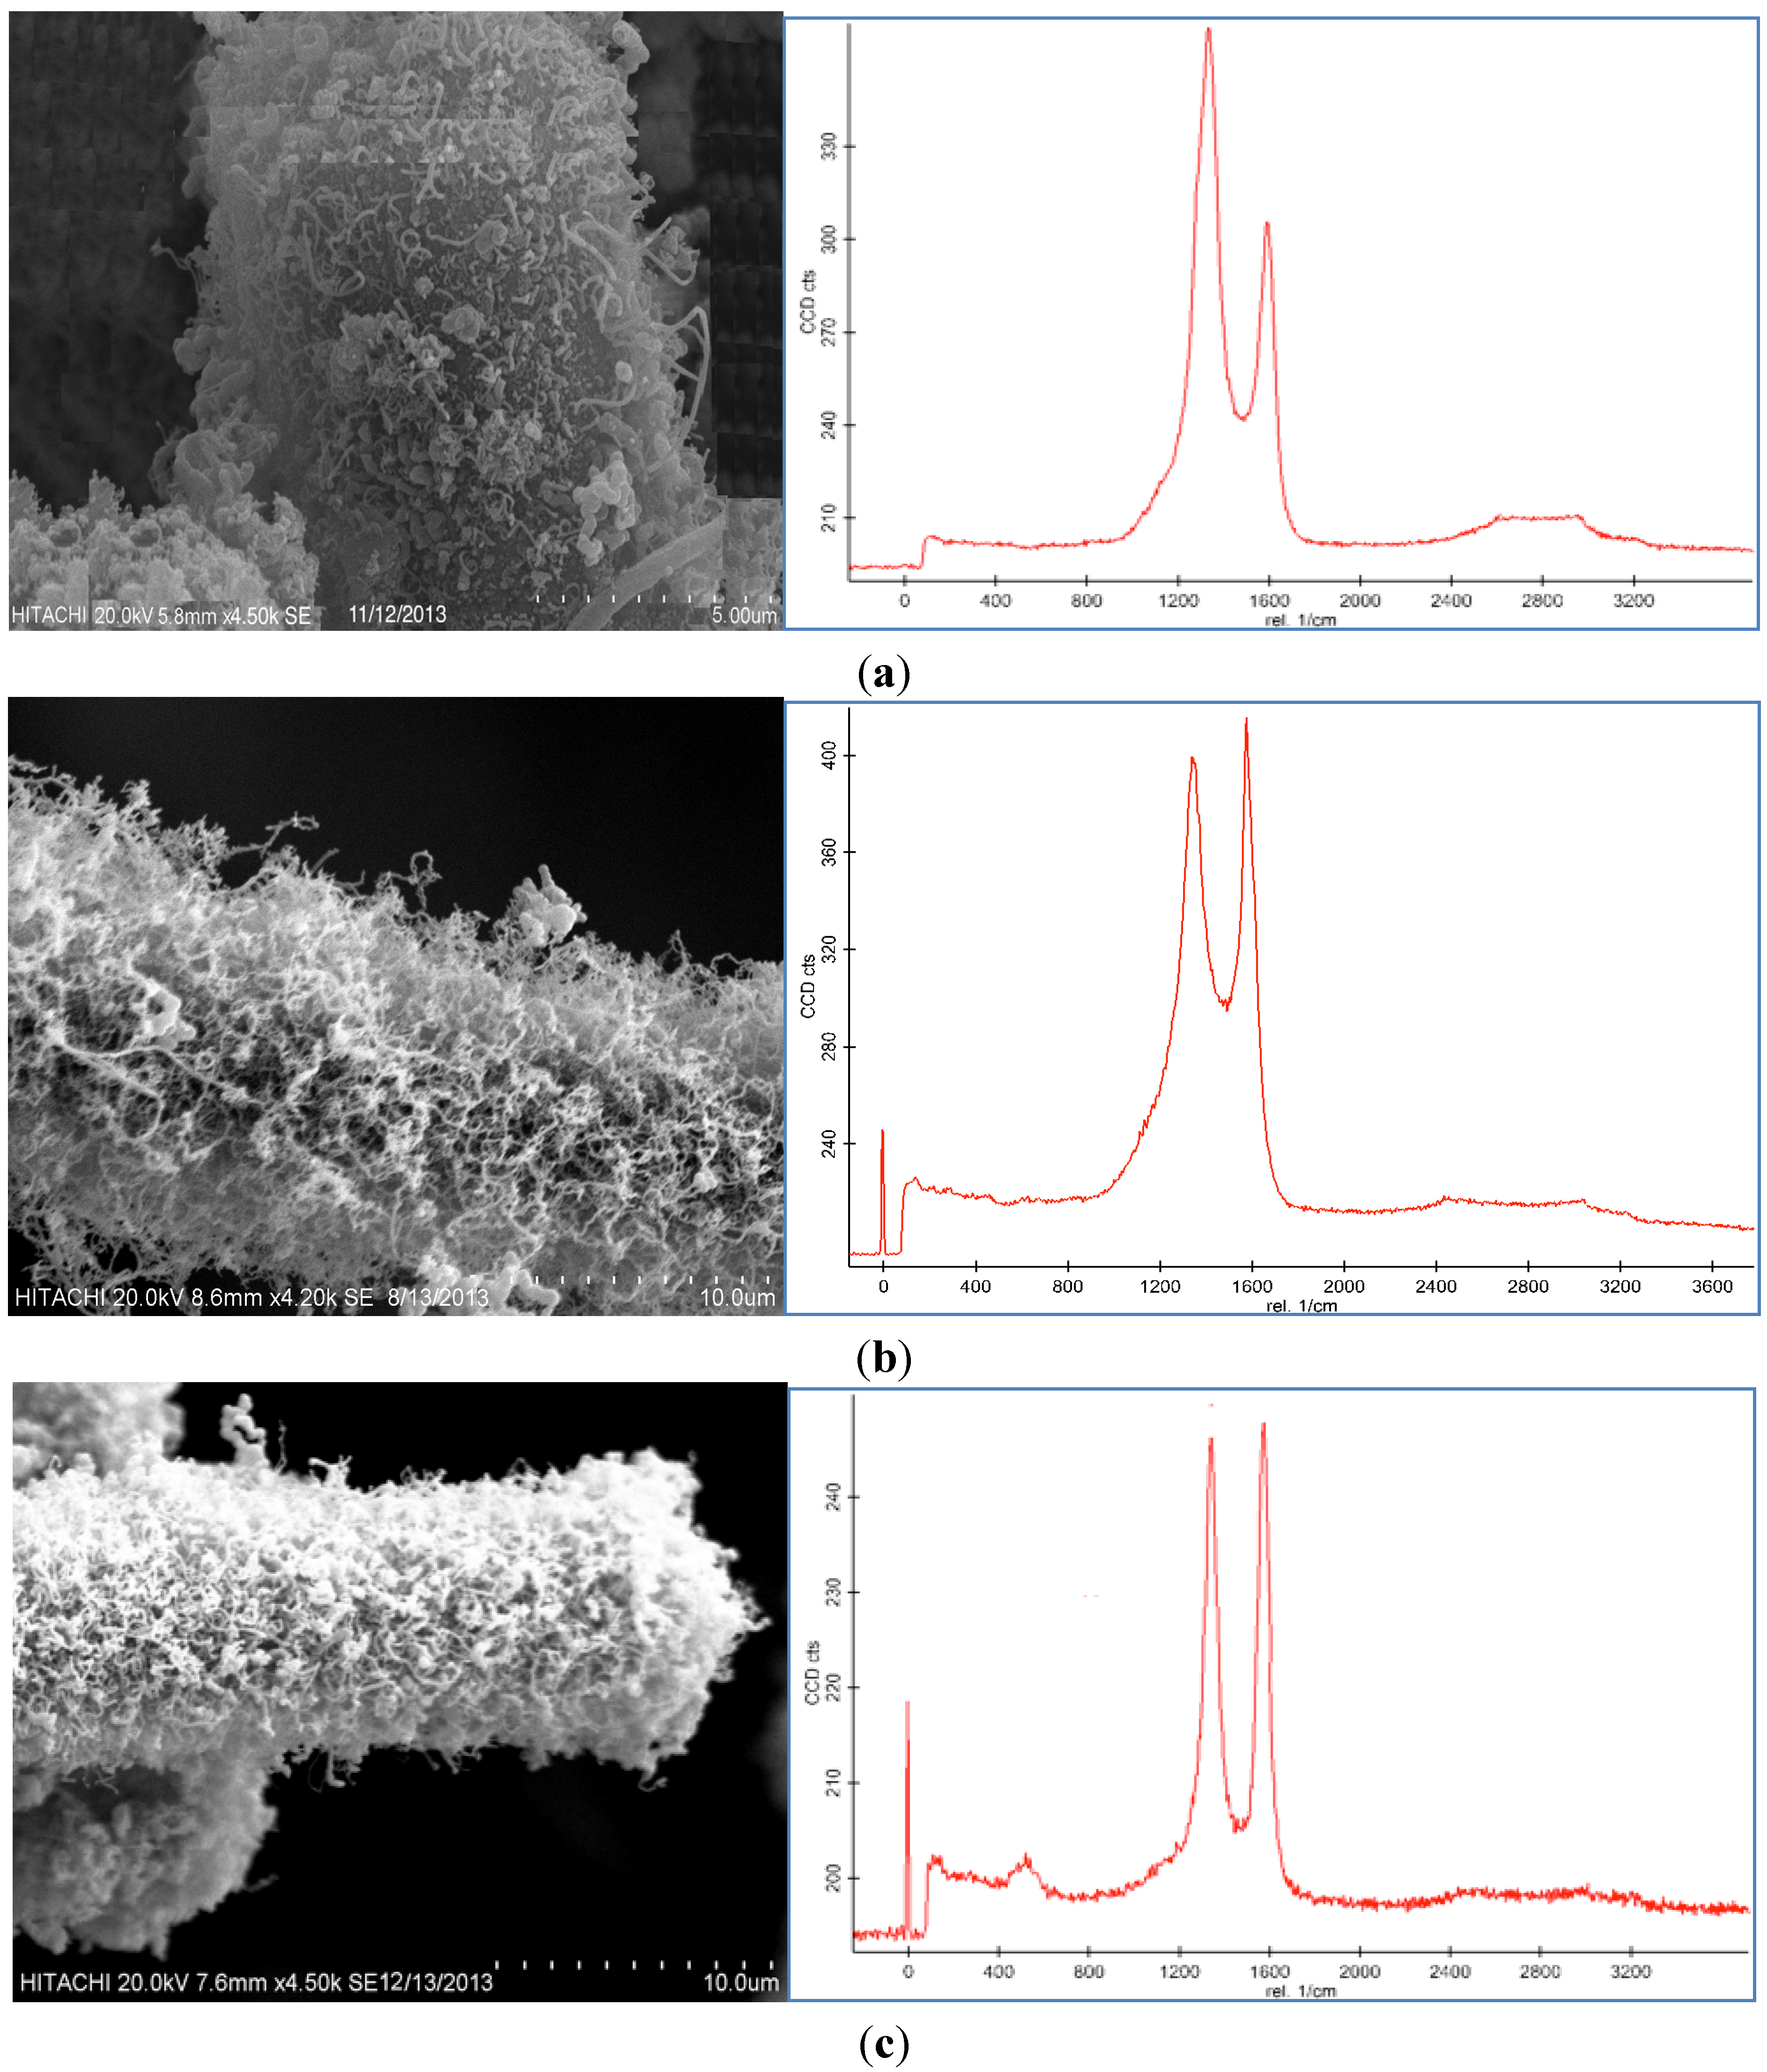
Figure 2a–c, and reveal different agglomerations of CNF with different catalyst concentrations. To analyze the effect of the catalyst concentration (50 mM, 100 mM, and 150 mM), reaction temperature at 550 °C, reaction time 30 min, and flow rate of acetylene 50 sccm were fixed and catalyst concentrations were varied.
Figure 2.
SEM images and Raman spectra of different agglomerations of grown carbon nanofibers (CNFs) on carbon fiber (CF) at (a) 50 mM, (b) 100 mM, and (c) 150 mM catalyst concentrations at 550 °C for 30 min run time under 50 sccm acetylene flow rate.
Figure 2.
SEM images and Raman spectra of different agglomerations of grown carbon nanofibers (CNFs) on carbon fiber (CF) at (a) 50 mM, (b) 100 mM, and (c) 150 mM catalyst concentrations at 550 °C for 30 min run time under 50 sccm acetylene flow rate.
Based on the SEM images, it was seen that the optimum catalyst concentration was 100 mM as that led not only to high density but also separated the fibers of the CNFs. Using the lower amount of catalyst concentration (100 mM) caused defective growth or insufficient density of the CNF whereas for the greater amounts, it led to thick and loose layers of CNFs on the CF. The Raman Spectra shows two large peaks at 1350 cm
−1 and 1590 cm
−1, which were assigned to the D peak from the amorphous carbon structure, and the G peak from the graphitic structures of carbon, respectively [
28]. Based on the Raman spectra of the CF it was found that by growing the CNF on the CF surface the graphitization is improved because of the increase of G peak and decrease of D peak. According to the Raman graphs of CF-CNF, it is found that at the 50 mM catalyst concentration, the graph is too wide, which is related to a deficiency of uniform coating of the catalyst layer on the CF surface. At the 150 mM catalyst concentration, the presence of a great number of amorphous carbon structures can be confirmed by the high peak of D. The Raman spectra in
Figure 2b illustrate a high graphitization degree of the resultant CNF in comparison with the others.
The BET surface area, thickness, yield of CNFs and activities of the different catalyst concentration on the CF for the CNF growth are presented in
Table 1. According to the results from the BET analysis and SEM images, the surface area and thickness of the CF-CNF increased by increasing the catalyst concentration. Increasing the catalyst amount led to an increase in the surface area, thickness, and yield until the formation of the amorphous carbon was established. Consequently, the presence of amorphous carbon at 150 mM as reported in the Raman spectrum concurs with the defects in the surface area. The activity and performance of three catalytic samples (0.5 g CF) in the carbon nanofiber production using CVD are summarized in
Table 1.
Table 1 indicates that the surface area, thickness, carbon deposition efficiency (CDE) and catalytic activity for the 150 mM catalyst concentration are the highest but
Figure 2c shows that the morphology and graphitization of the resulting CF-CNF is otherwise.
To achieve the optimum parameters, not only the yield and thickness but also the structure and morphology of the CNF are significant. Hence, by increasing the catalyst concentration from 50 mM to 100 mM, the graphitization increases (increased G peak) and the CNF covers the CF surface, completely, and also the yield and thickness consequently increase. On the other hand, by increasing the catalyst concentration to 150 mM, the yield and thickness increase but the presence of amorphous carbon is proven (decreased G peak) that reveals the impurity resulting. Therefore, the 100 mM was selected as an optimum catalyst concentration. Subsequently, based on the structure and morphology, the 100 mM was selected as the optimum concentration with acceptable CDE% and catalyst activity. On the other hand, the outer thickness of CNF on the CF was looser than the inner layer; so by increasing the thickness, the stability of the CNF layer decreased.
Table 1.
Surface area, thickness, and yield of carbon fiber-carbon nanofiber (CF-CNF) and activities of the different catalyst concentration at 550 °C for 30 min under 50 sccm acetylene flow rate.
Table 1.
Surface area, thickness, and yield of carbon fiber-carbon nanofiber (CF-CNF) and activities of the different catalyst concentration at 550 °C for 30 min under 50 sccm acetylene flow rate.
| Catalyst Conc. (mM) | Surface Area (m2/g) | Thickness of Carbon Nanofiber (CNF) (nm) | Yield (%) | Catalyst Activity (g/g) |
|---|
| 50 | 1.36 | 1500 | 7 | 0.65 |
| 100 | 2.31 | 4000 | 24 | 1.6 |
| 150 | 2.52 | 4500 | 30 | 1.81 |
2.3. Effect of Reaction Temperature
Three different experiments at various temperatures were performed keeping other parameters including the catalyst concentration of 100 mM, reaction time 30 min, and flow rate of acetylene 50 sccm fixed while the reaction temperature was varied between 450 °C and 650 °C. As can be seen in
Figure 3, CNFs were formed on the CF surface at these temperatures. The reaction temperature of the thermal CVD method had a dramatic effect on the CNF growth as shown in
Figure 3. It was found that the temperature influenced the morphology and graphitization of the carbon nanoparticles. Based on the Raman spectra, the D peak and G peak at 450 °C were broad, which was possibly due to the presence of amorphous carbon on the CF surface. The D peak was also higher than the G peak. By increasing the temperature, the graphitization of the resulting nanoparticles increased because of the CNF growth (
Figure 3b). The Raman spectra in
Figure 3c illustrate that the resultant carbon nanoparticle formed at 550 °C exhibited a high degree of graphitization which indicated the presence of carbon nanotubes (CNTs). Therefore, 550 °C was selected as the optimum temperature to grow CNFs of high quality and purity.
Figure 3.
SEM images and Raman spectra of grown CNF by use of 100 mM catalyst concentration for 30 min under 50 sccm acetylene flow rate at (a) 450 °C, (b) 550 °C, and (c) 650 °C.
Figure 3.
SEM images and Raman spectra of grown CNF by use of 100 mM catalyst concentration for 30 min under 50 sccm acetylene flow rate at (a) 450 °C, (b) 550 °C, and (c) 650 °C.
Because of the low activity of the catalyst at 450 °C, amorphous carbon formed on the CF, which caused defective structures of the CNFs on the CF (
Figure 3a) and decreased the surface area of the CF-CNF (see
Table 2). However, by increasing the temperature, the surface area, thickness, and yield of the CF-CNF increased. The highest surface area was obtained at 650 °C, which resulted in the growth of not only CNFs but also CNTs. Besides this, the results indicated that the C
2H
2 conversion and carbon yield also increased with increasing reaction temperature. The thickness of the grown CNFs increased slightly by increasing the temperature.
Table 2.
Surface area and yield of resulting CF-CNF at different growth temperature by use of 100 mM catalyst concentration for 30 min under 50 sccm acetylene flow rate.
Table 2.
Surface area and yield of resulting CF-CNF at different growth temperature by use of 100 mM catalyst concentration for 30 min under 50 sccm acetylene flow rate.
| Temperature (°C) | BET Surface Area (m2/g) | Thickness of CNF (nm) | Yield (%) |
|---|
| 450 | 1.88 | 3500 | 13.4 |
| 550 | 2.31 | 4000 | 24 |
| 650 | 3.16 | 4700 | 32.8 |
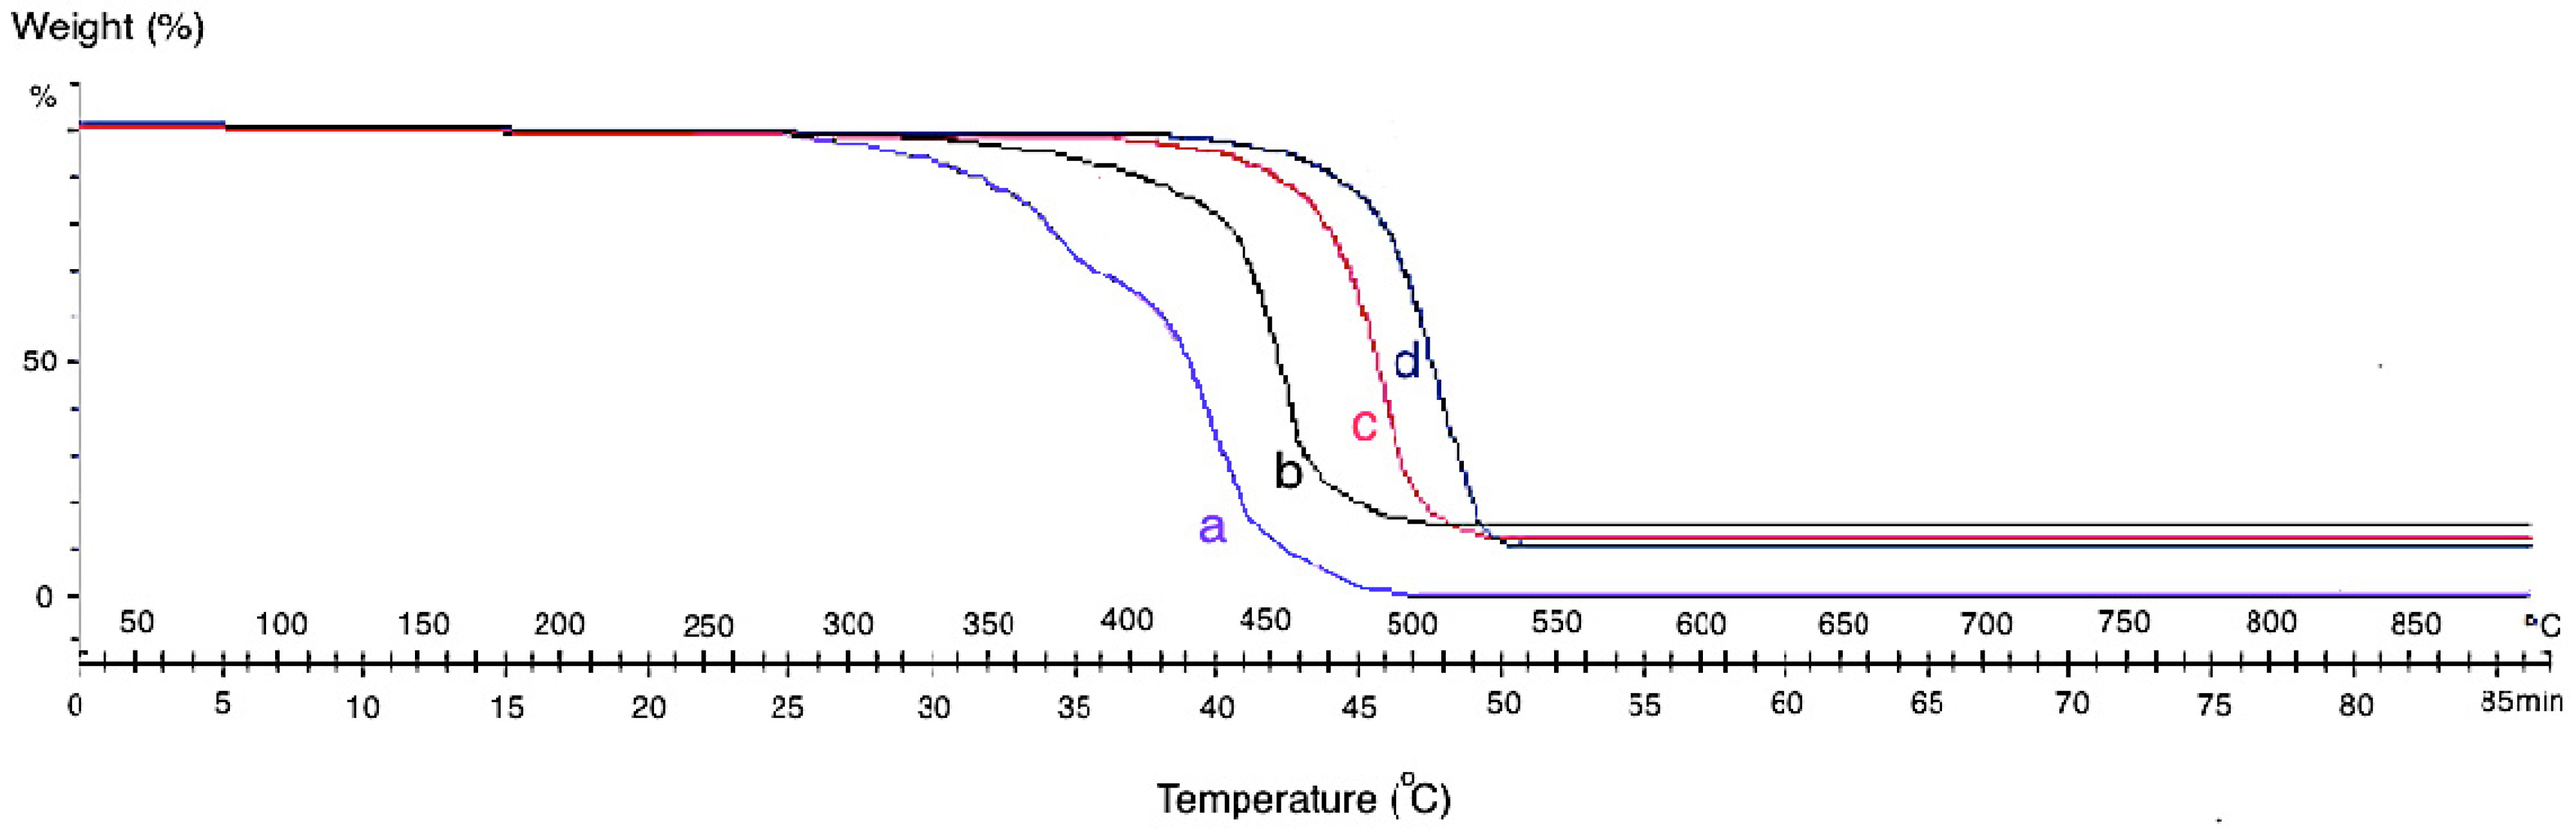
The themogravimetric analysis (TGA) of the neat CF and grown CF-CNF at different temperatures is presented in
Figure 4. The TGA curve of CF shows that the pyrolytic reactions lead to weight loss starting at about 300 °C for neat CF. By growing CNF on the CF surface, the thermal resistance of the product increases due to the strong structure of the grown CNFs which cause adsorption at the higher temperature.
Since the formation of CNFs on the CF at low temperature was defective so, the formed carbon atoms on the catalyst surface adsorbed the heat only at the low temperature. Therefore, by increasing the reaction temperature, the formation of CNFs was completed and led to the bulk diffusion of absorbed temperature from the adsorbed surface to the growth surface. At 650 °C, significant CNFs and CNTs were already observed. This was due to the aggregation of the catalyst particles and degradation of the carbon source at a higher reaction temperature. However, as it was shown in the SEM images, the best temperature for growing CNFs is 550 °C with a uniform structure, high CDE%, and acceptable thermal stability. The presence of amorphous carbon at 450 °C leads to mass loss sooner than at other temperatures.
Figure 4.
Themogravimetric analysis (TGA) analysis of (a) neat CF and CF-CNF at (b) 450 °C, (c) 550 °C, and (d) 650 °C.
Figure 4.
Themogravimetric analysis (TGA) analysis of (a) neat CF and CF-CNF at (b) 450 °C, (c) 550 °C, and (d) 650 °C.
2.4. Effect of Reaction Time
Growth time is an alternative parameter, which acts as an important role in dictating the morphology of CNFs.
Figure 5a,b displays the SEM images and Raman spectroscopy graphs of the CNF with different growth times (10 and 50 min) by use of the 100 mM catalyst concentration at the 550 °C reaction temperature under a 50 sccm acetylene flow rate. It was observed that different trends occurred at different run times.
Figure 5.
SEM images and Raman Spectrum of CNF morphologies at (a) 10 min, (b) 30 min, and (c) 50 min using 100 mM acid concentration at 550 °C under 50 sccm acetylene flow rate.
Figure 5.
SEM images and Raman Spectrum of CNF morphologies at (a) 10 min, (b) 30 min, and (c) 50 min using 100 mM acid concentration at 550 °C under 50 sccm acetylene flow rate.
According to the SEM micrographs, the synthesis of the CNF at 10 min was too fast to support the proper thickness of the CNF. Therefore, at this run time, CNFs with short fibers were achieved because of the uncompleted formation of the CNFs. Moreover, impurities, such as carbon nanoparticles, amorphous carbon and catalyst particles, were proved from the Raman graph at this run time. The D peak is higher than the G peak and also both are too broad, which affirms the presence of impurities in the sample.
The SEM images of the CNFs at 50 min show an almost similar morphology to the CNF grown at 30 min. The highest thickness and yield of the CNF were obtained at 50 min, however, a relatively thick and high yield CNF was formed at 30 min. The ratio of the G peak to the D peak (
IG/
ID) of the Raman graph in
Figure 5b in comparison with
Figure 5c implies high graphitization, low amount of amorphous carbon and complete coating of the CNF on the CF surface. At 50 min the intensity of the D peak is similar to the G peak that shows the presence of amorphous carbon and impurity in the product.
The BET surface areas of the different resulting CF-CNFs were calculated from the N
2 adsorption/desorption isotherms.
Table 3 summarizes the data at various stages of preparation. After growing carbon nanofibers on the CF, the surface area increased. The presence of the CNFs with a high BET surface ensures the resulting CF-CNFs have a high surface area. By increasing the growth time to 30 min, the thickness and amount of CNFs on the CF surface was increased, which caused the increase in the overall surface area. Extending the reaction time further to 50 min slowed down the rate of increase in the surface area because of the deactivation of the catalyst particles [
29].
Moreover,
Table 3 also shows that the yield (CDE%) increased with the reaction time. Running the reaction for 10 min was too short to activate the catalyst particles and to form CNFs to cover the CF completely. Both the CDE% and catalyst activity increased sharply at 30 min. Similarly, extending the reaction time to 50 min only demonstrated a marginal improvement in the CDE% and catalyst activity.
Table 3.
Effect of growth time on CNF growth by use of 100 mM catalyst concentration at 550 °C under 50 sccm acetylene flow rate (on 0.5 g CF/catalyst, 0.075 g metal weight).
Table 3.
Effect of growth time on CNF growth by use of 100 mM catalyst concentration at 550 °C under 50 sccm acetylene flow rate (on 0.5 g CF/catalyst, 0.075 g metal weight).
| Time (min) | BET Surface Area (m2/g) | Thickness of CNF (nm) | Yield (%) |
|---|
| 10 | 1.42 | 2100 | 11.6 |
| 30 | 2.31 | 4000 | 24 |
| 50 | 2.61 | 4100 | 26.2 |
2.5. Effect of Hydrocarbon Flow Rate
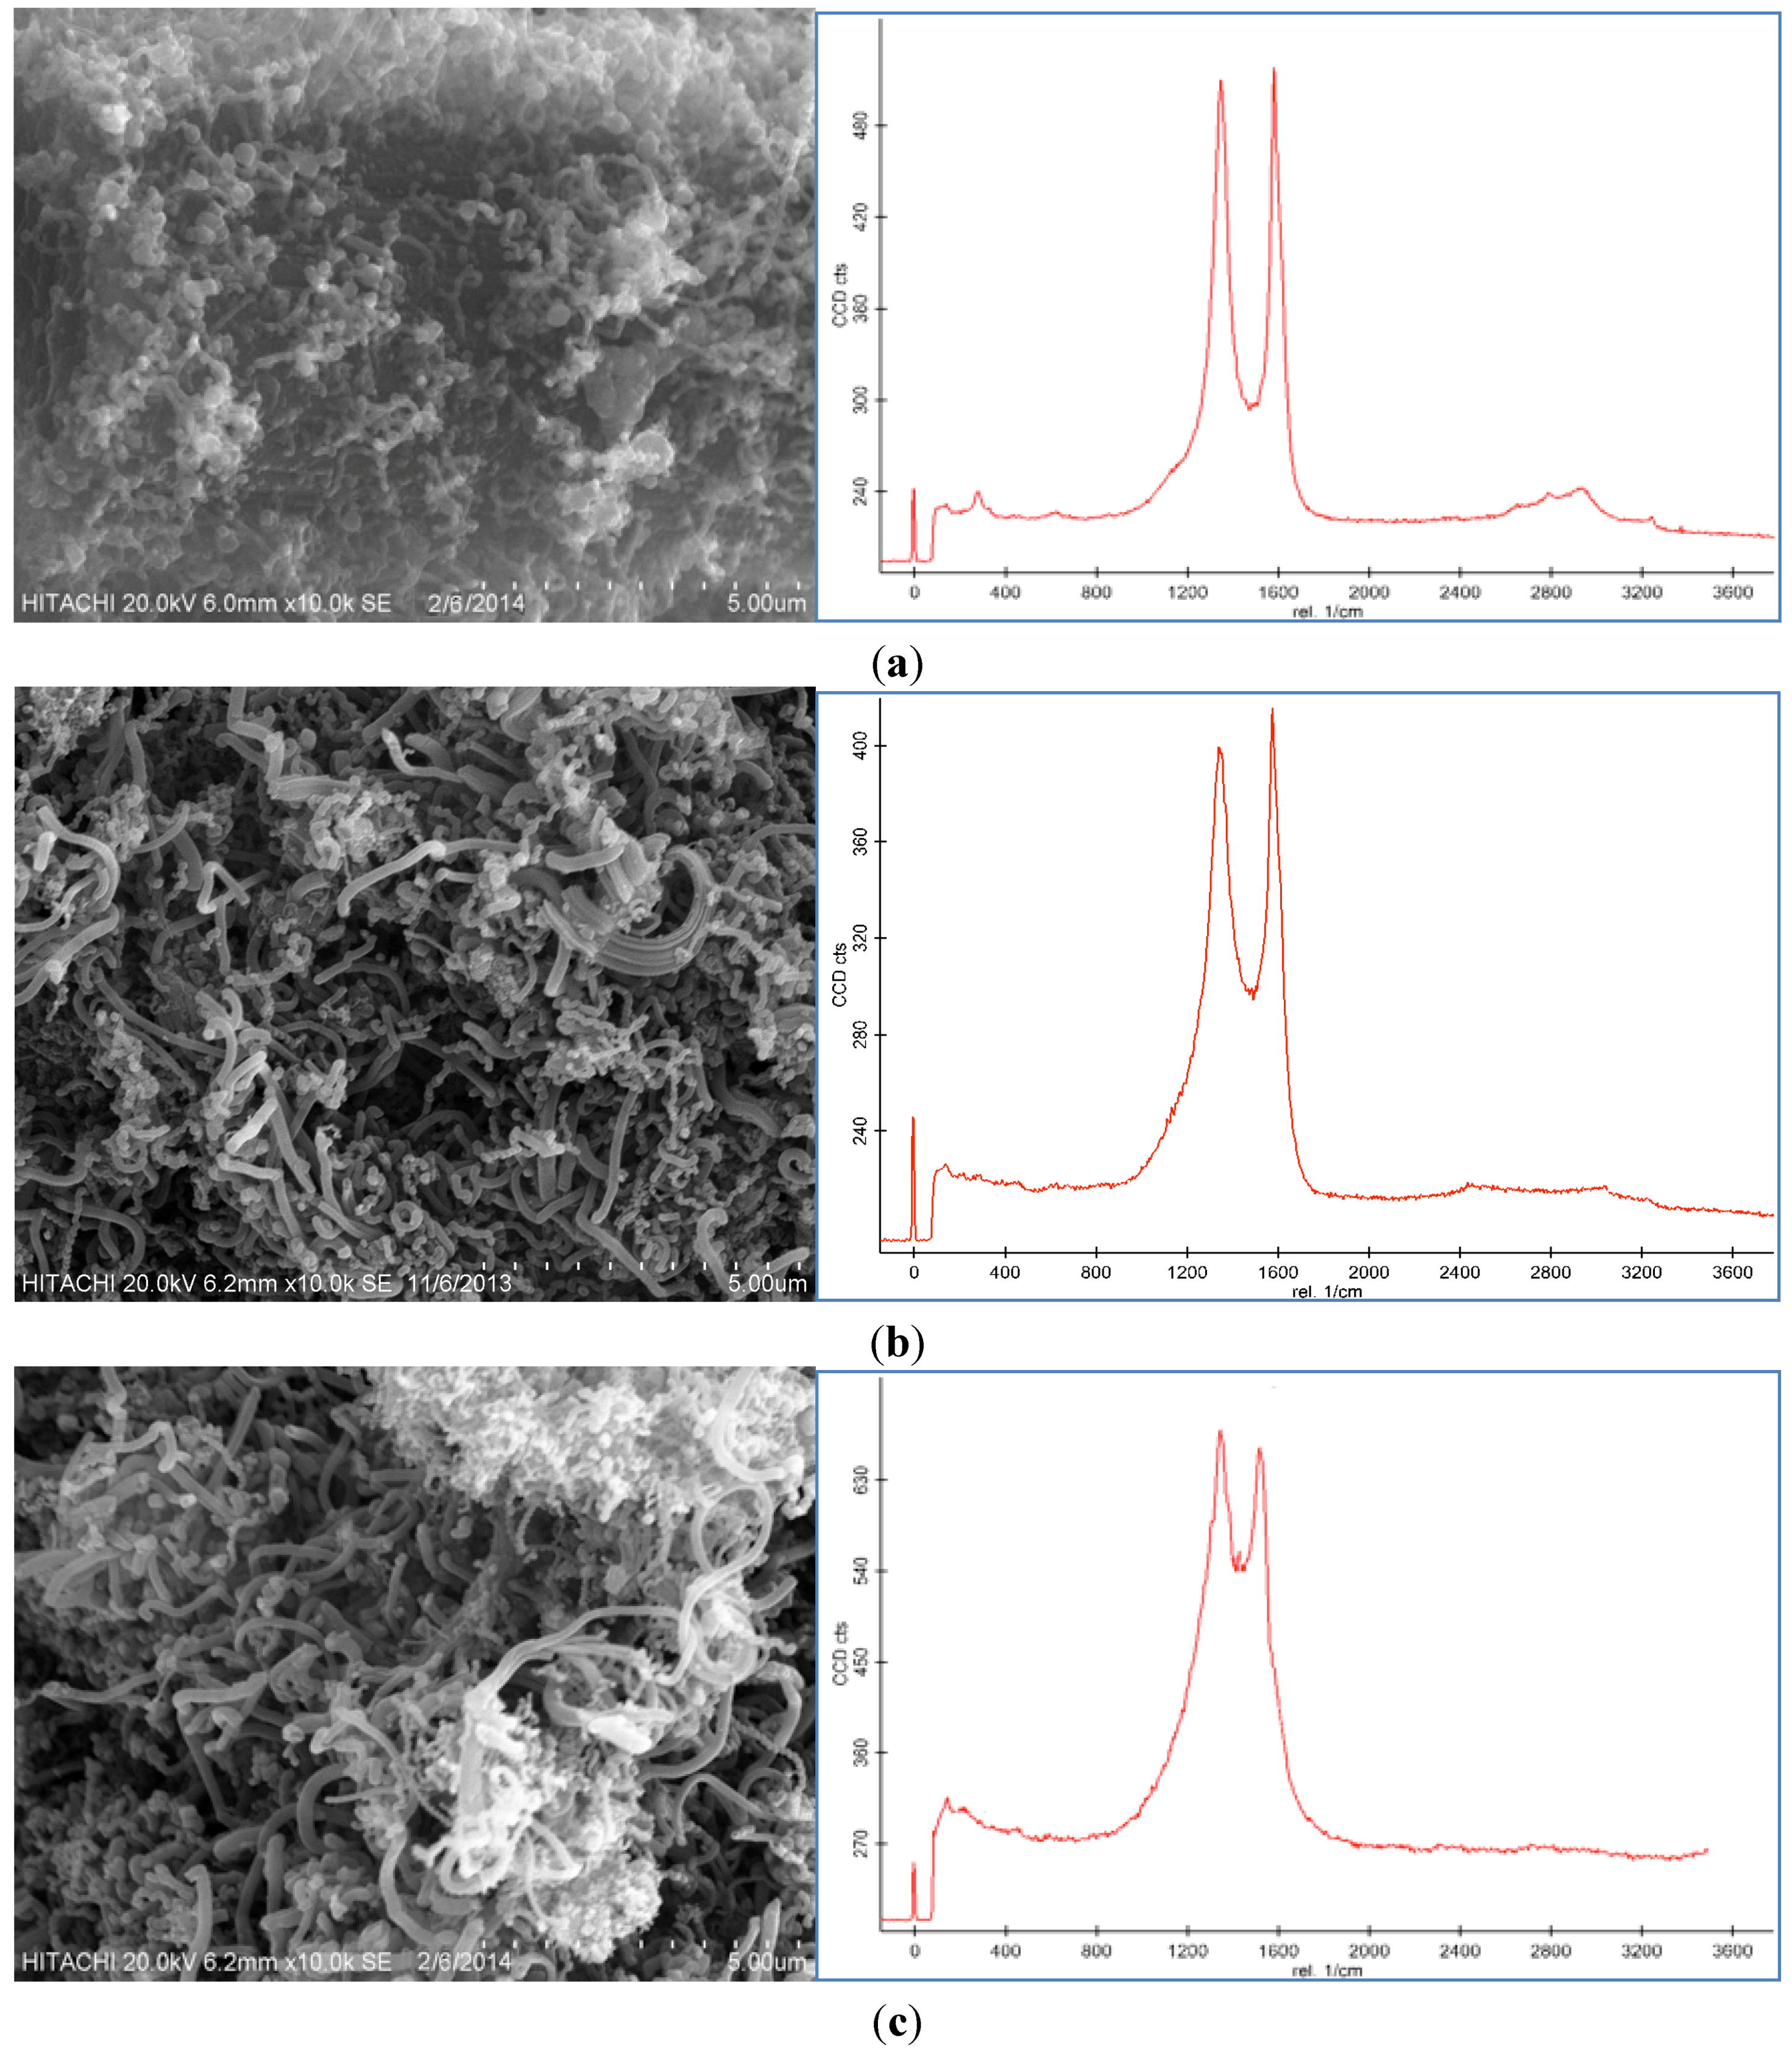
Different flow rates led to different structures of the carbon nanofibers; so by changing the carbon source flow rate, the optimum form of CNFs was obtained. The other parameters, such as reaction time (30 min), reaction temperature (550 °C) and catalyst concentration (100 mM) were fixed and the flow rate of the acetylene was altered for 25, 50, and 100 sccm. As can be seen in
Figure 6a–c, CNFs were grown on the CF surface, respectively.
The concentration of acetylene influenced significantly the characteristic of the CNFs synthesized by CVD. At 25 sccm, the grown CNFs were in uncompleted fiber form and by increasing the flow rate of the acetylene to 50 sccm, the synthesized CNFs had more regular diameters. The CNFs also had lower amounts of amorphous carbon at the 50 sccm hydrocarbon flow rate than those synthesized at the high flow rate (100 sccm).
At the high acetylene flow rate (100 sccm), the carbon nanoparticles covered all the surface of the CNFs to form a compact coating. During the synthesis of the CNFs, the amorphous carbon nanoparticles nucleated on the external wall of the nanoparticles. The combination of the CNF with the coated amorphous carbon particles led to a broader and longer D peak than the G peak in the Raman spectra.
Consequently, the concentration of acetylene provided another way to control the morphology and graphitization of the synthesized nanoparticles. At a low acetylene flow rate, the acetylene concentration was not sufficient for the synthesis to take place, thus the G peak in the Raman spectra, which was related to the graphitization of the product, was shorter. Thereafter, by increasing the concentration of the hydrocarbon to 50 sccm, the G peak was sharper and longer than the D peak, which revealed the enhanced graphitization and complete formation of the CNFs.
Table 4 lists the BET surface area, thickness, and yield results for the samples. The CF-CNF (50 sccm) had the highest surface area and thickness, implying that it could produce uniform forms of CNFs on the CF. Hence, by changing the flow rate of the carbon source (acetylene) on the CF surface, the surface area and thickness of the resulting CF-CNF changed, 50 sccm > 100 sccm > 25 sccm. In addition, the yield of the CNFs was also affected by the acetylene flow rate.
Table 4 reveals that the yield of the CNF increased with increasing the carbon source flow rate. Approximately 0.093 g of CNF was produced when the acetylene flow rate was set at 25 sccm, and 0.12 g and 0.144 g CNF were produced at 50 sccm and 100 sccm of the acetylene flow rate, respectively. However, the amount of soot rose immediately as the carbon source flow rate was increased.
Figure 6.
SEM images and Raman spectroscopy of carbon nanofiber on CF by use of 100 mM catalyst concentration at 550 °C for 30 min at (a) 25 sccm, (b) 50 sccm, and (c) 100 sccm flow rate of C2H2.
Figure 6.
SEM images and Raman spectroscopy of carbon nanofiber on CF by use of 100 mM catalyst concentration at 550 °C for 30 min at (a) 25 sccm, (b) 50 sccm, and (c) 100 sccm flow rate of C2H2.
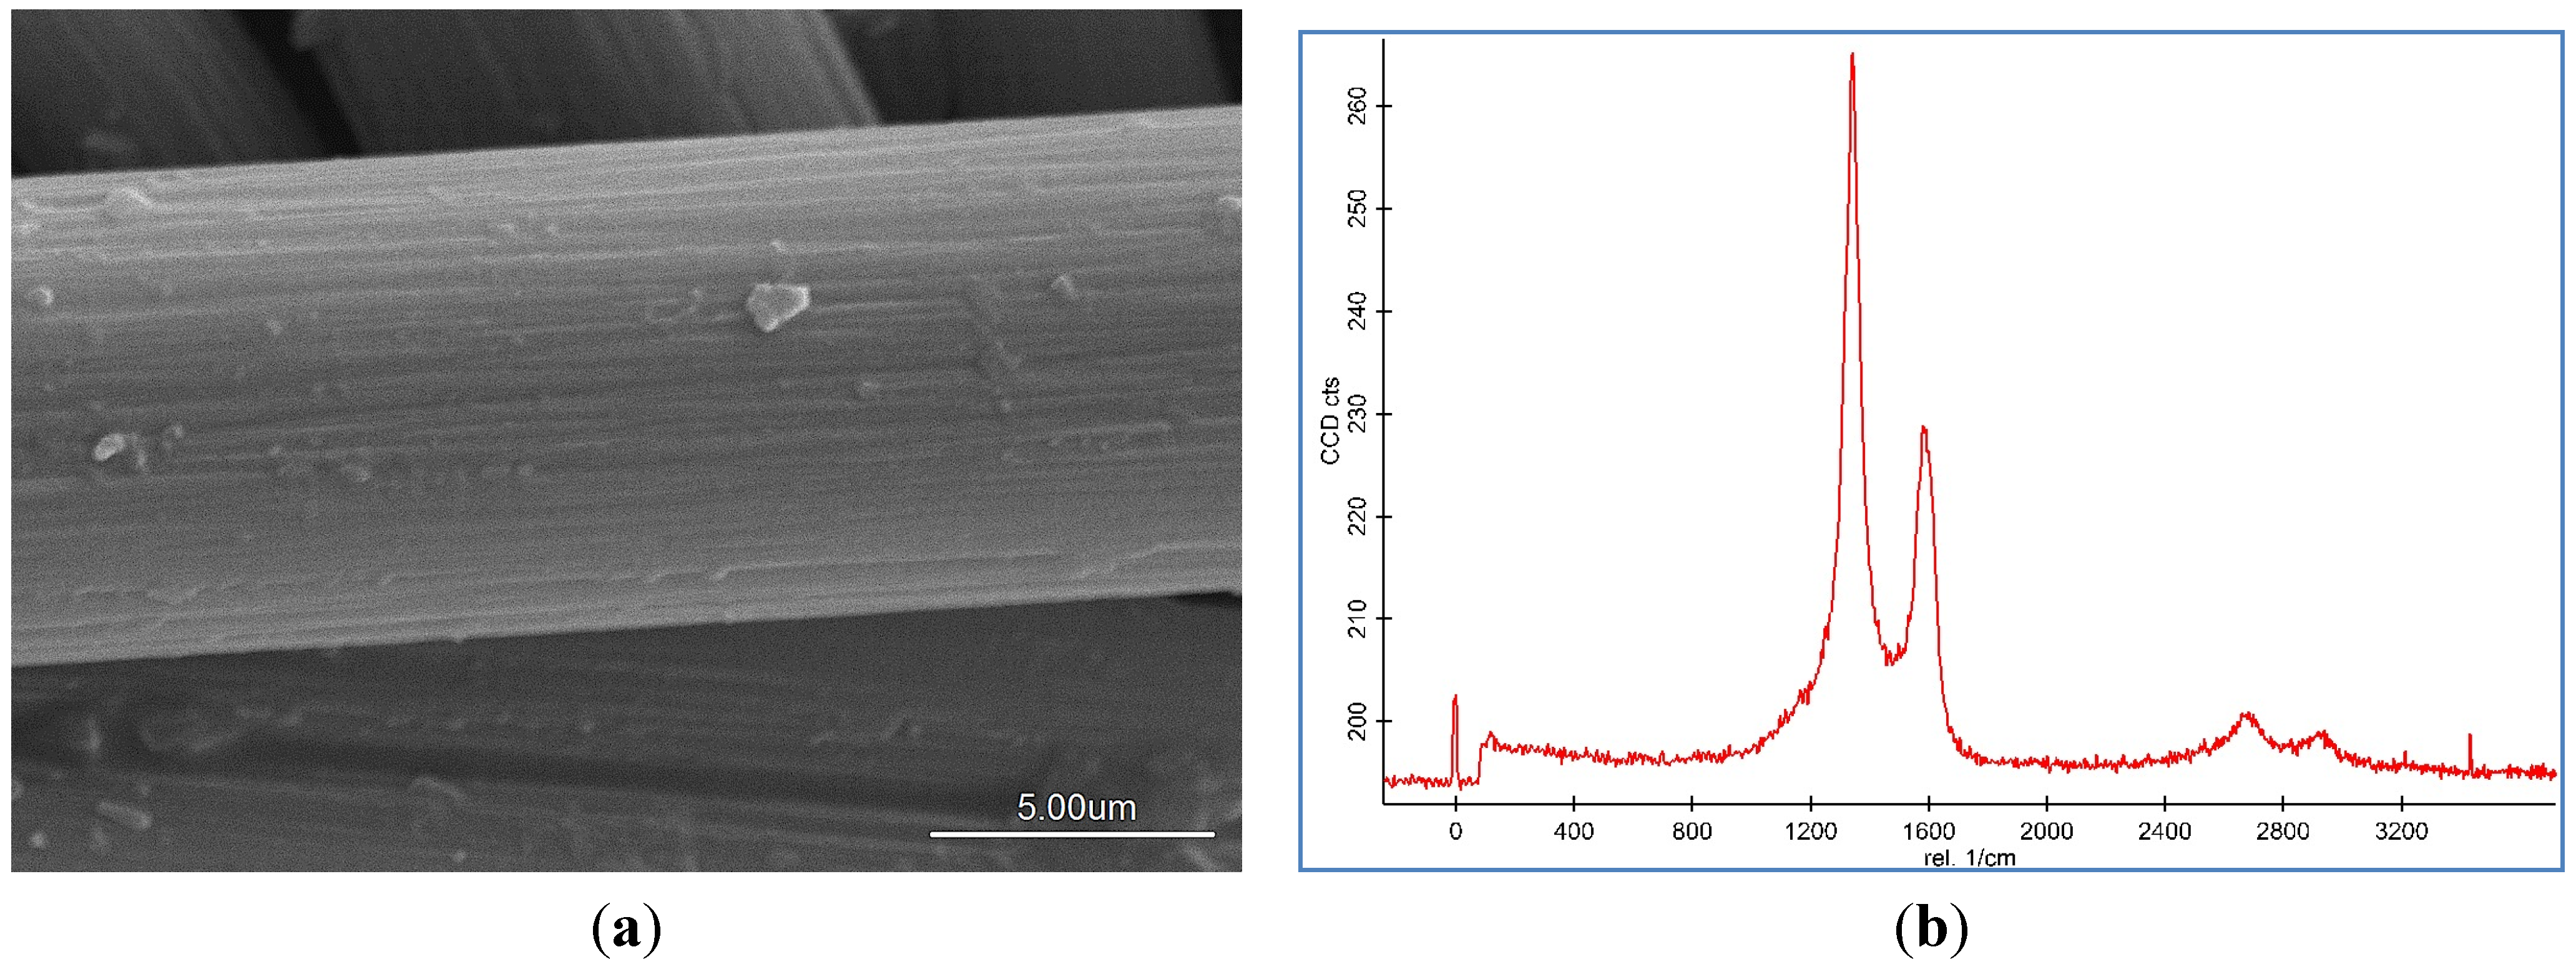
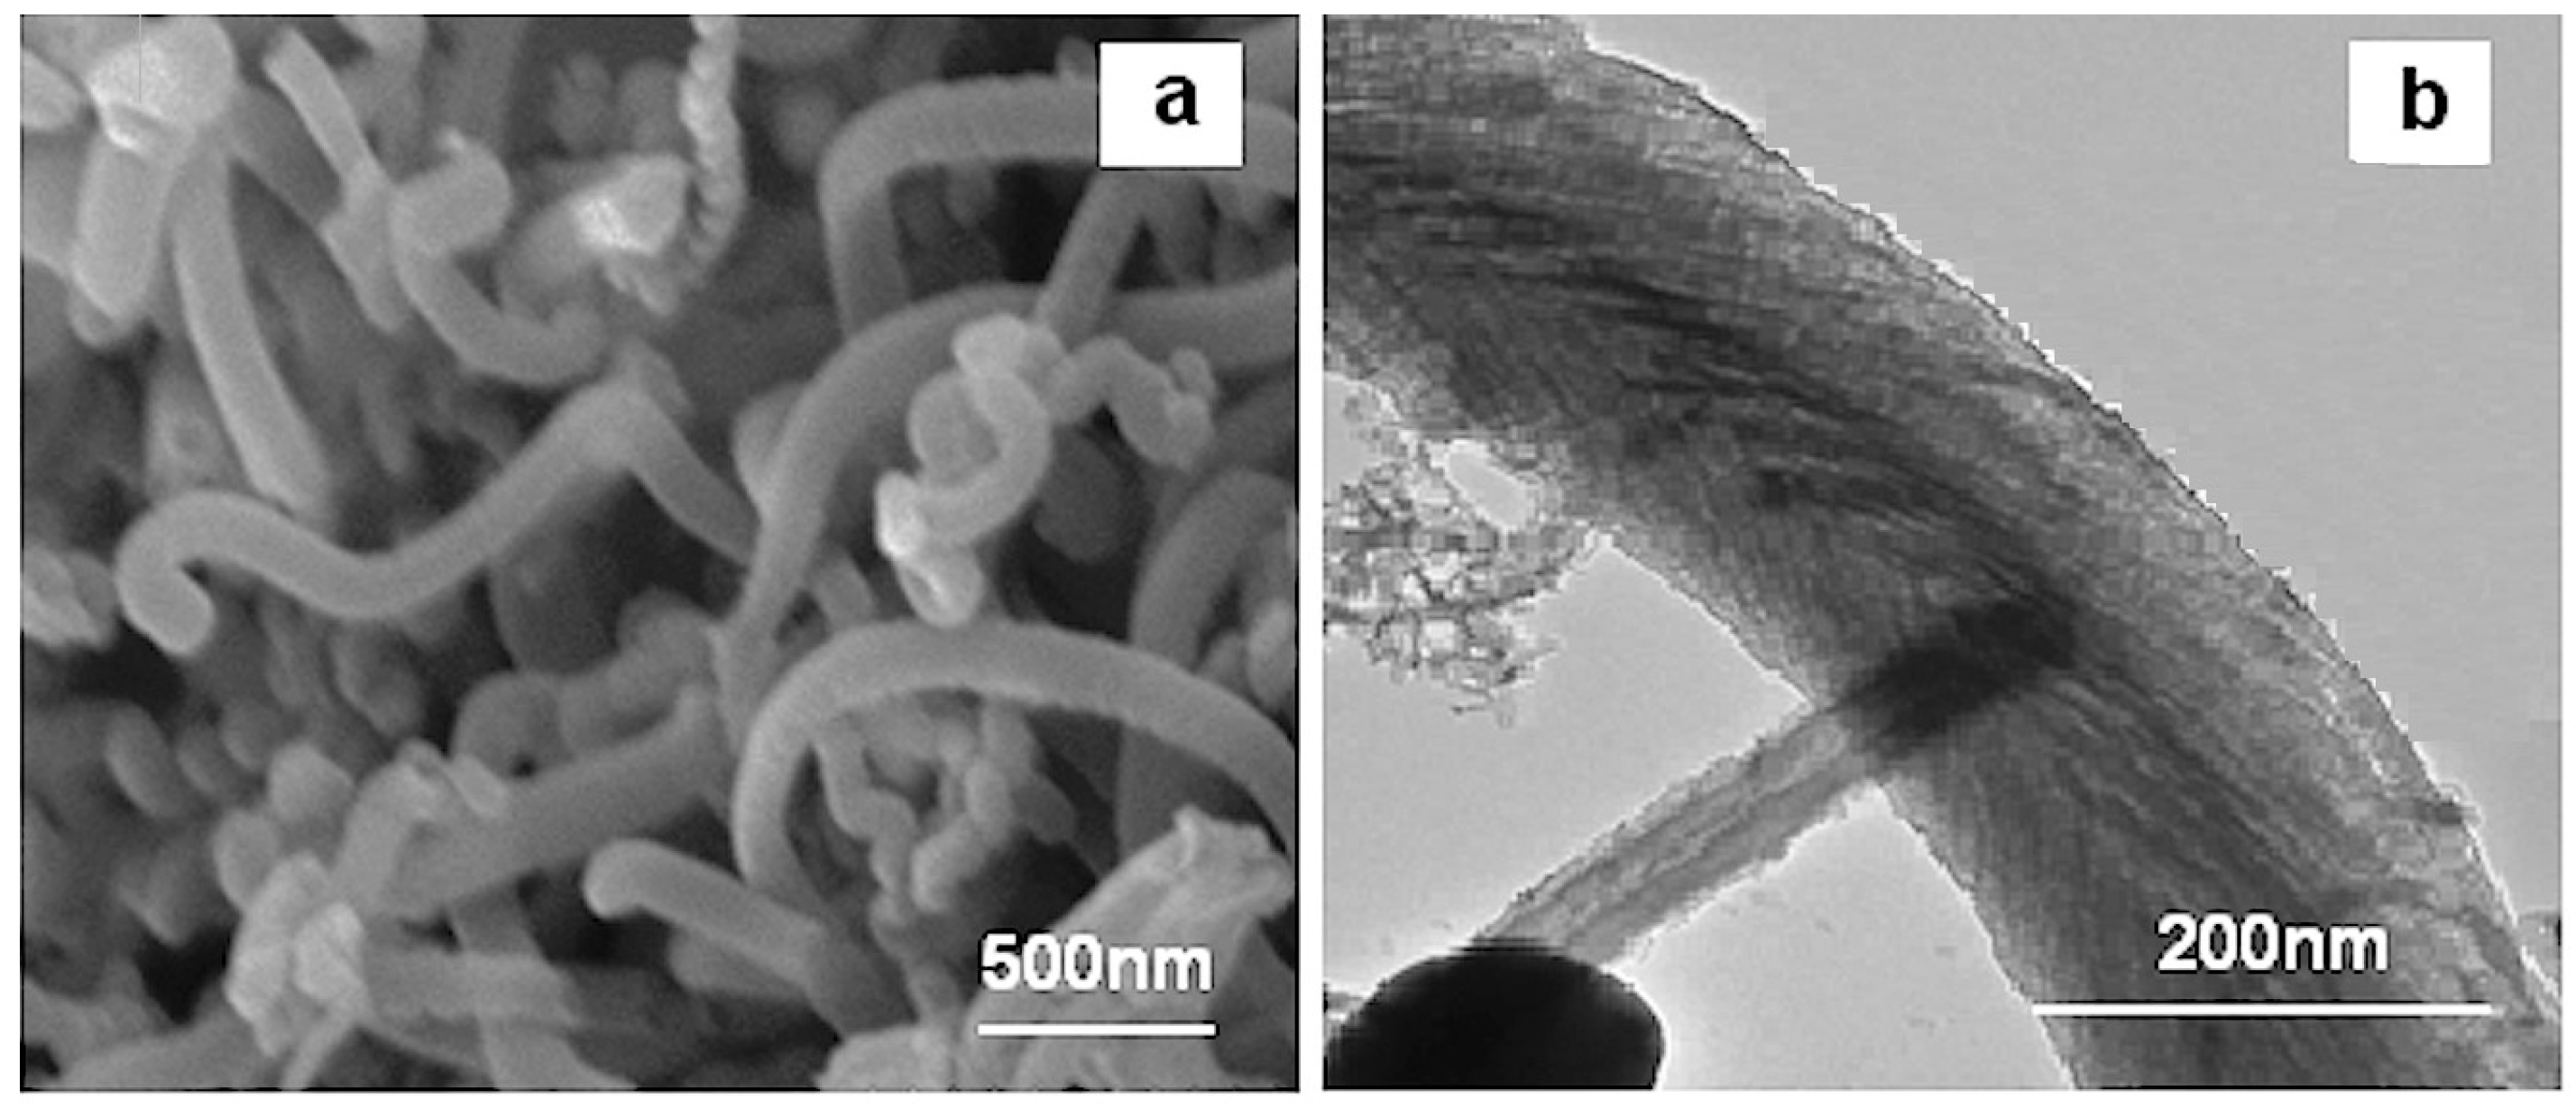
In conclusion, the optimum growth of the CNFs on the CF were obtained by using the 100 mM catalyst concentration and 50 sccm acetylene flow rate in the CVD method at 550 °C for 30 min. The morphology of the optimum CNF was analyzed by SEM and Transmission electron microscopy (TEM) which is presented in
Figure 7a,b, respectively. As observed from these images, the CNFs consisted of fibers with diameters of about 100–250 nm.
Table 4.
Effect of hydrocarbon flow rate on CNF growth by use of 100 mM catalyst concentration under 550 °C for 30 min (on 0.5 g CF).
Table 4.
Effect of hydrocarbon flow rate on CNF growth by use of 100 mM catalyst concentration under 550 °C for 30 min (on 0.5 g CF).
| Flow Rate (sccm) | BET Surface Area (m2/g) | Thickness of CNF (nm) | Yield (%) |
|---|
| 25 | 1.37 | 1800 | 18.6 |
| 50 | 2.31 | 4000 | 24 |
| 100 | 2.12 | 3800 | 28.8 |
Figure 7.
(a) SEM and (b) transmission electron microscopy (TEM) micrographs of optimum CNF.
Figure 7.
(a) SEM and (b) transmission electron microscopy (TEM) micrographs of optimum CNF.
In summary, the result shows that the thickness, surface area, and yield of the samples increased as the catalyst concentration, reaction temperature, CNF growth time and hydrocarbon flow rate increased. On the other hand, a higher thickness made a looser layer of CNF, which detached from the CF surface easily, and this claim could be proved by the analysis of the mechanical test of this filler in the polymer matrix. Therefore, in order to find an optimum thickness, surface area, and amount of CNF on the CF, mechanical tests should be carried out and analyzed.
One of the scopes of this research is related to improving, the polymer composite using CNF-coated CF. An important factor in achieving this scope of the study is having the proper thickness, surface area and also amount of uniform CNFs on the CF.
2.6. Mechanical Properties
CNFs and CFs with high aspect ratios, low weight and high tensile strength are expected to be used as nanofillers in the polymers to prepare the composites due to their special properties (e.g., CNFs’ Young’s modulus = 500 GPa and CFs’ = 231 GPa) [
30,
31,
32]. The optimum form of the CNF coated CF causes not only an improvement in the fiber-matrix tensile properties but also has synergic effects as a reinforcing factor.
In
Table 5, the influences of the different thicknesses of the CNF including low thickness (CNF
L), medium thickness (CNF
M) and high thickness (CNF
H) on the surface area and also in the polymer composites on the tensile stress and tensile modulus of the composites were analyzed. The improvement of the tensile stress of the CF-CNF
H/PP composite compared to the CF-CNF
L/PP composite confirms the significant enhancement in the mechanical properties of the CF-CNF
H/PP composite.
Table 5.
Tensile data for different thickness of CNF in CF-CNF/PP composite.
Table 5.
Tensile data for different thickness of CNF in CF-CNF/PP composite.
| Sample No. | Thickness (nm) | Surface Area (m2/g) | Tensile Stress (MPa) | Tensile Modulus (GPa) |
|---|
| CF-CNFL/PP | 1500–2100 | 1.36–1.42 | 21.9–22.2 | 0.65–0.68 |
| CF-CNFM/PP | 3500–4000 | 1.88–2.31 | 22.7–23.1 | 0.70–0.73 |
| CF-CNFH/PP | 4100–4700 | 2.61–3.16 | 23.9– 24.8 | 0.75–0.79 |
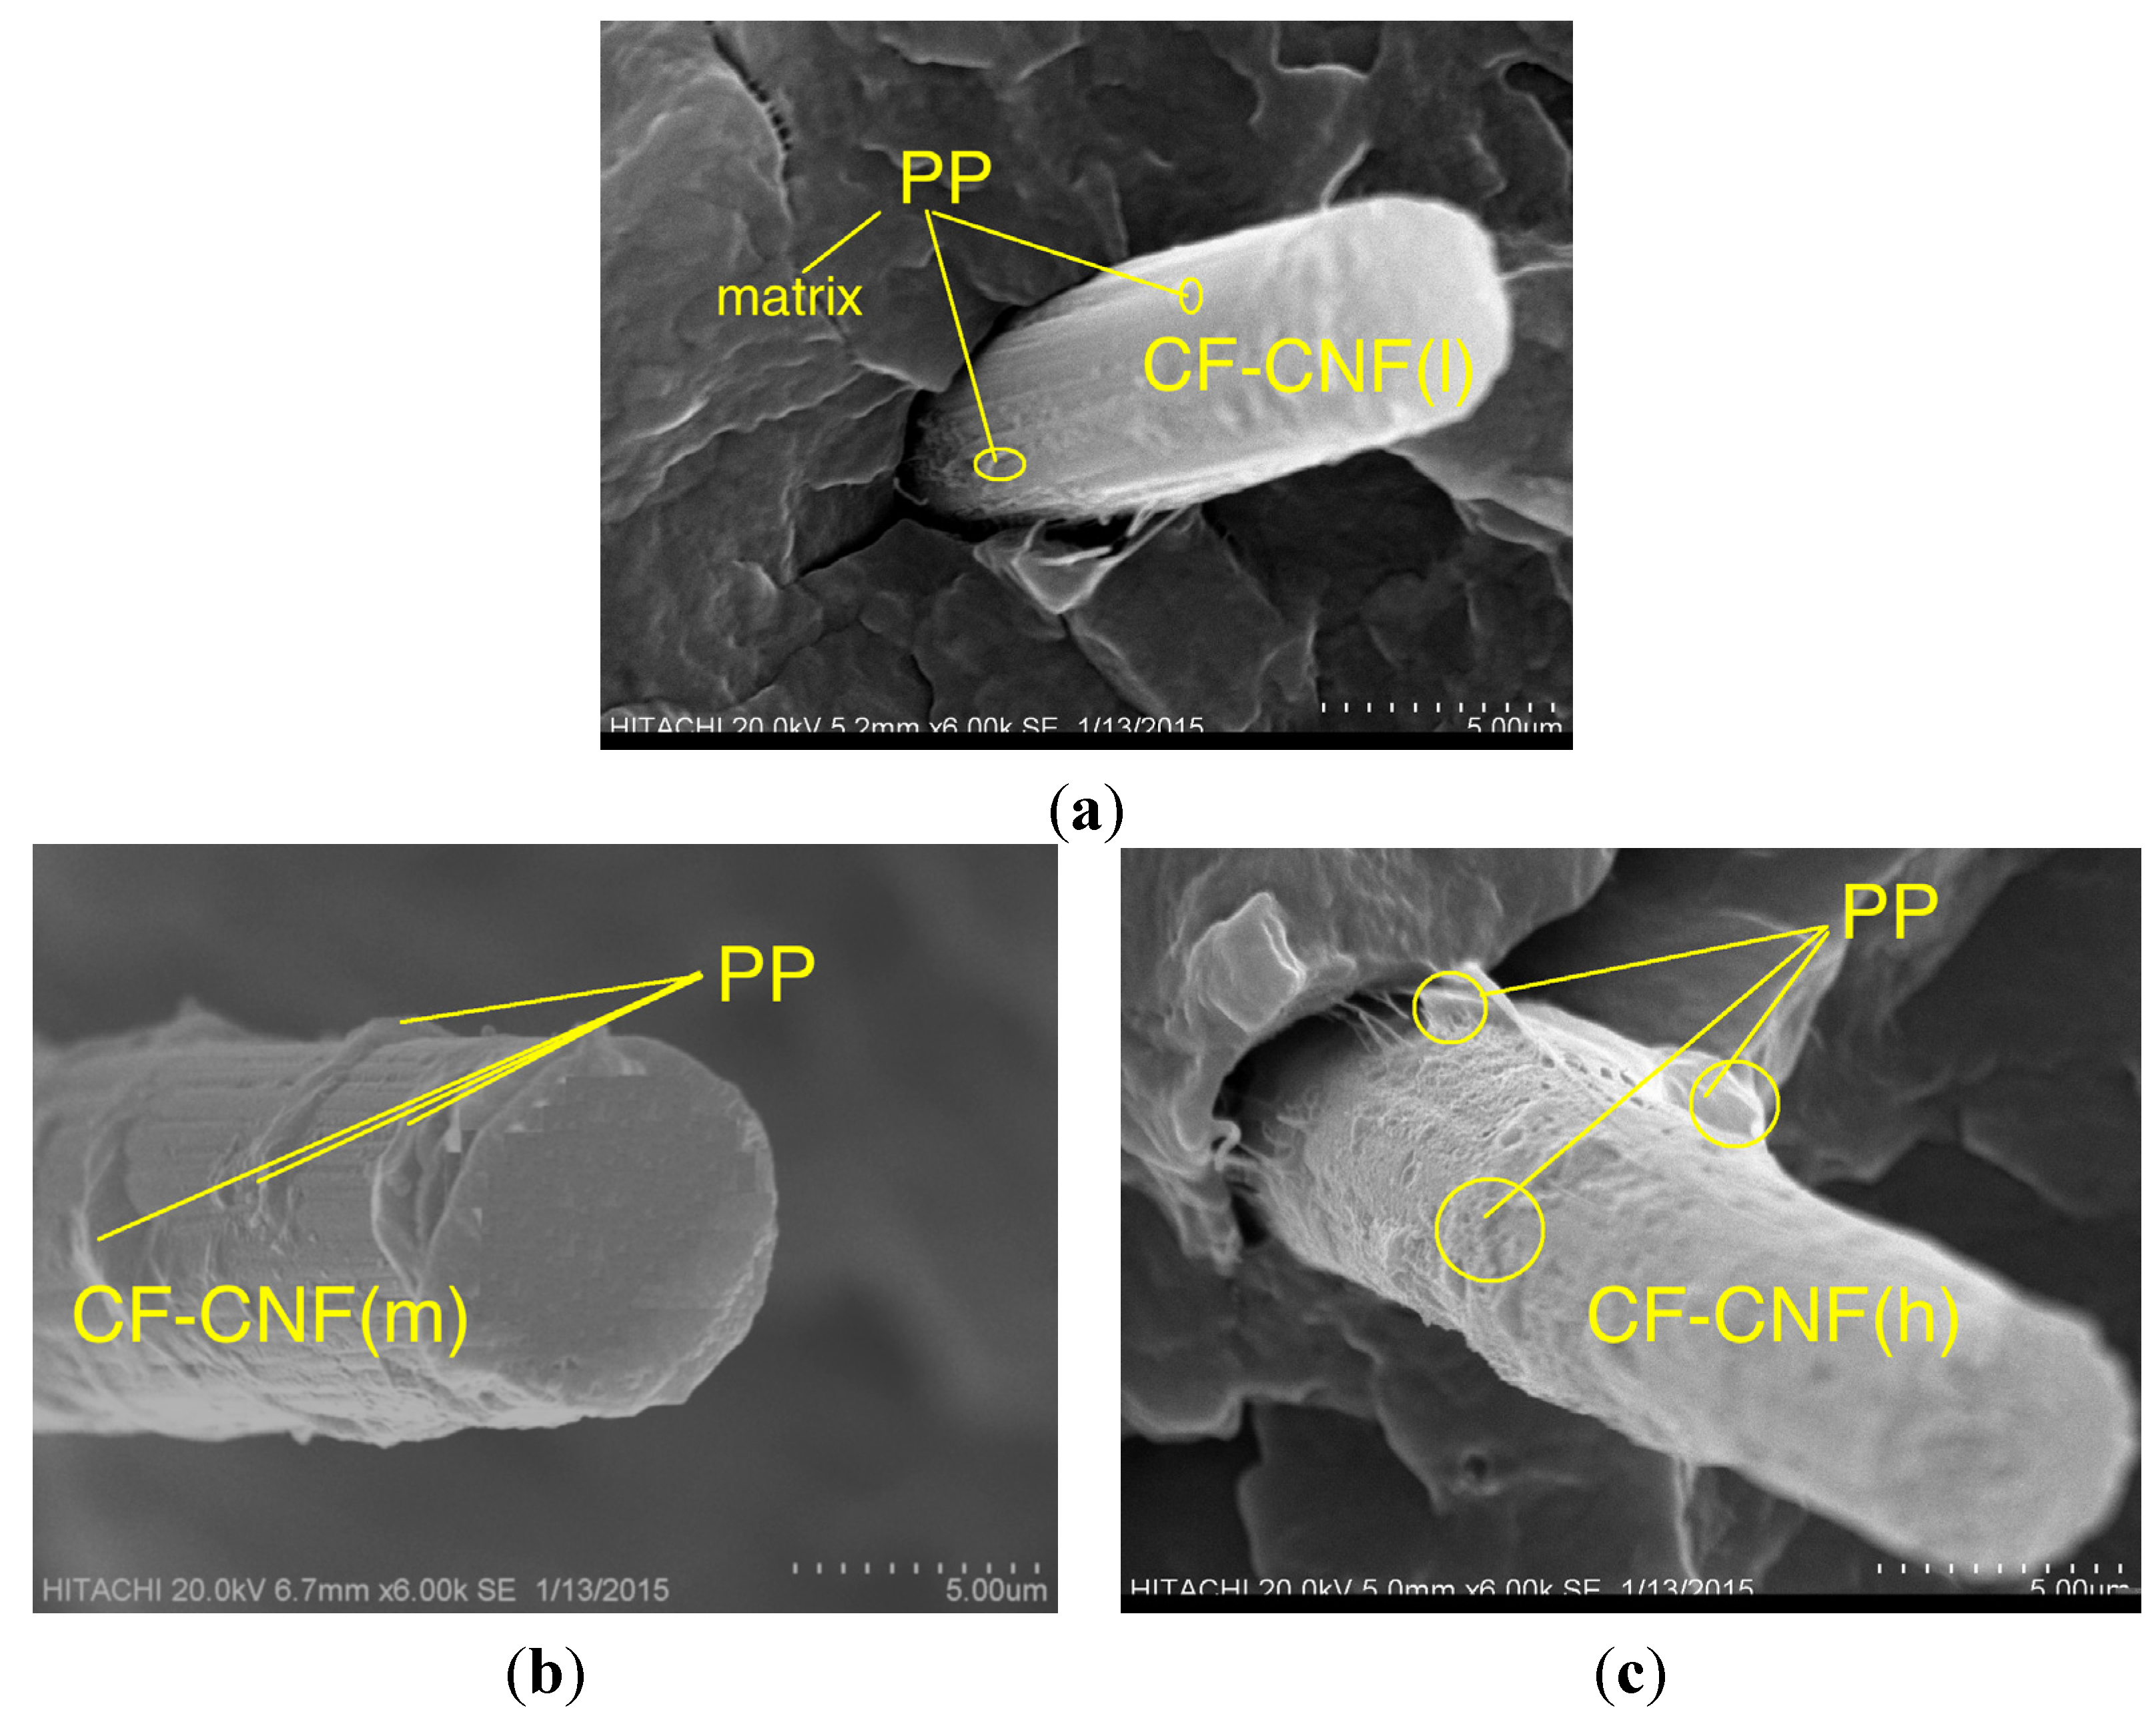
Regarding the comparison of the composite stiffness fabricated with the different thicknesses and surface areas of the CNF, it reveals an improvement in the tensile modulus and stress of the CF-CNF
H/PP composite. The reduction of the tensile stress and Young’s modulus of the composite was related to the defective flow of the matrix around the thin CNF layer on the CF in the polymer matrix which led to the decrease of the interfacial properties and it being easily pulled out of the CF from the polymer matrix [
30]. Similarly, the strength of the CF-CNF
H/PP composite was higher than the CF-CNF
L/PP composite because of the high stress transfer between the CNF
H and the matrix [
33]. Such a phenomenon can be observed from the tensile tests of different forms of the CF-CNF composites.
The relationship between the mechanical properties of the composites and the reinforcement fillers has been systematically investigated. Mathematical models were used to predict the mechanical properties of the different composites. The Halpin–Tsai (HT) Equation (1) is an accepted and extensively adopted model to calculate the stiffness of fiber/polymer composites [
27]. The HT model correlated the stiffness of the composites with the tensile modulus of the matrix and the reinforcement as well as their volume contents and geometries. This model was implemented to predict the tensile modulus of the composites with unidirectional or randomly distributed fibers.
In this calculation, different thicknesses of the CNF layers were assumed as fillers with random distributions in the polypropylene matrix. By thinking about the incorporation of the three types of reinforcements (CNF
L, CNF
M, and CNF
H) within the matrix, the HT equations were modified according to the following equation (Equation (1)) [
34]:
where
Ec was the modulus of the composite,
Ef was the Young’s modulus of the filler,
Vf was the filling content of the filler,
Em was the Young’s modulus of the polymer matrix, and
Vm was the filling content of the polymer matrix.
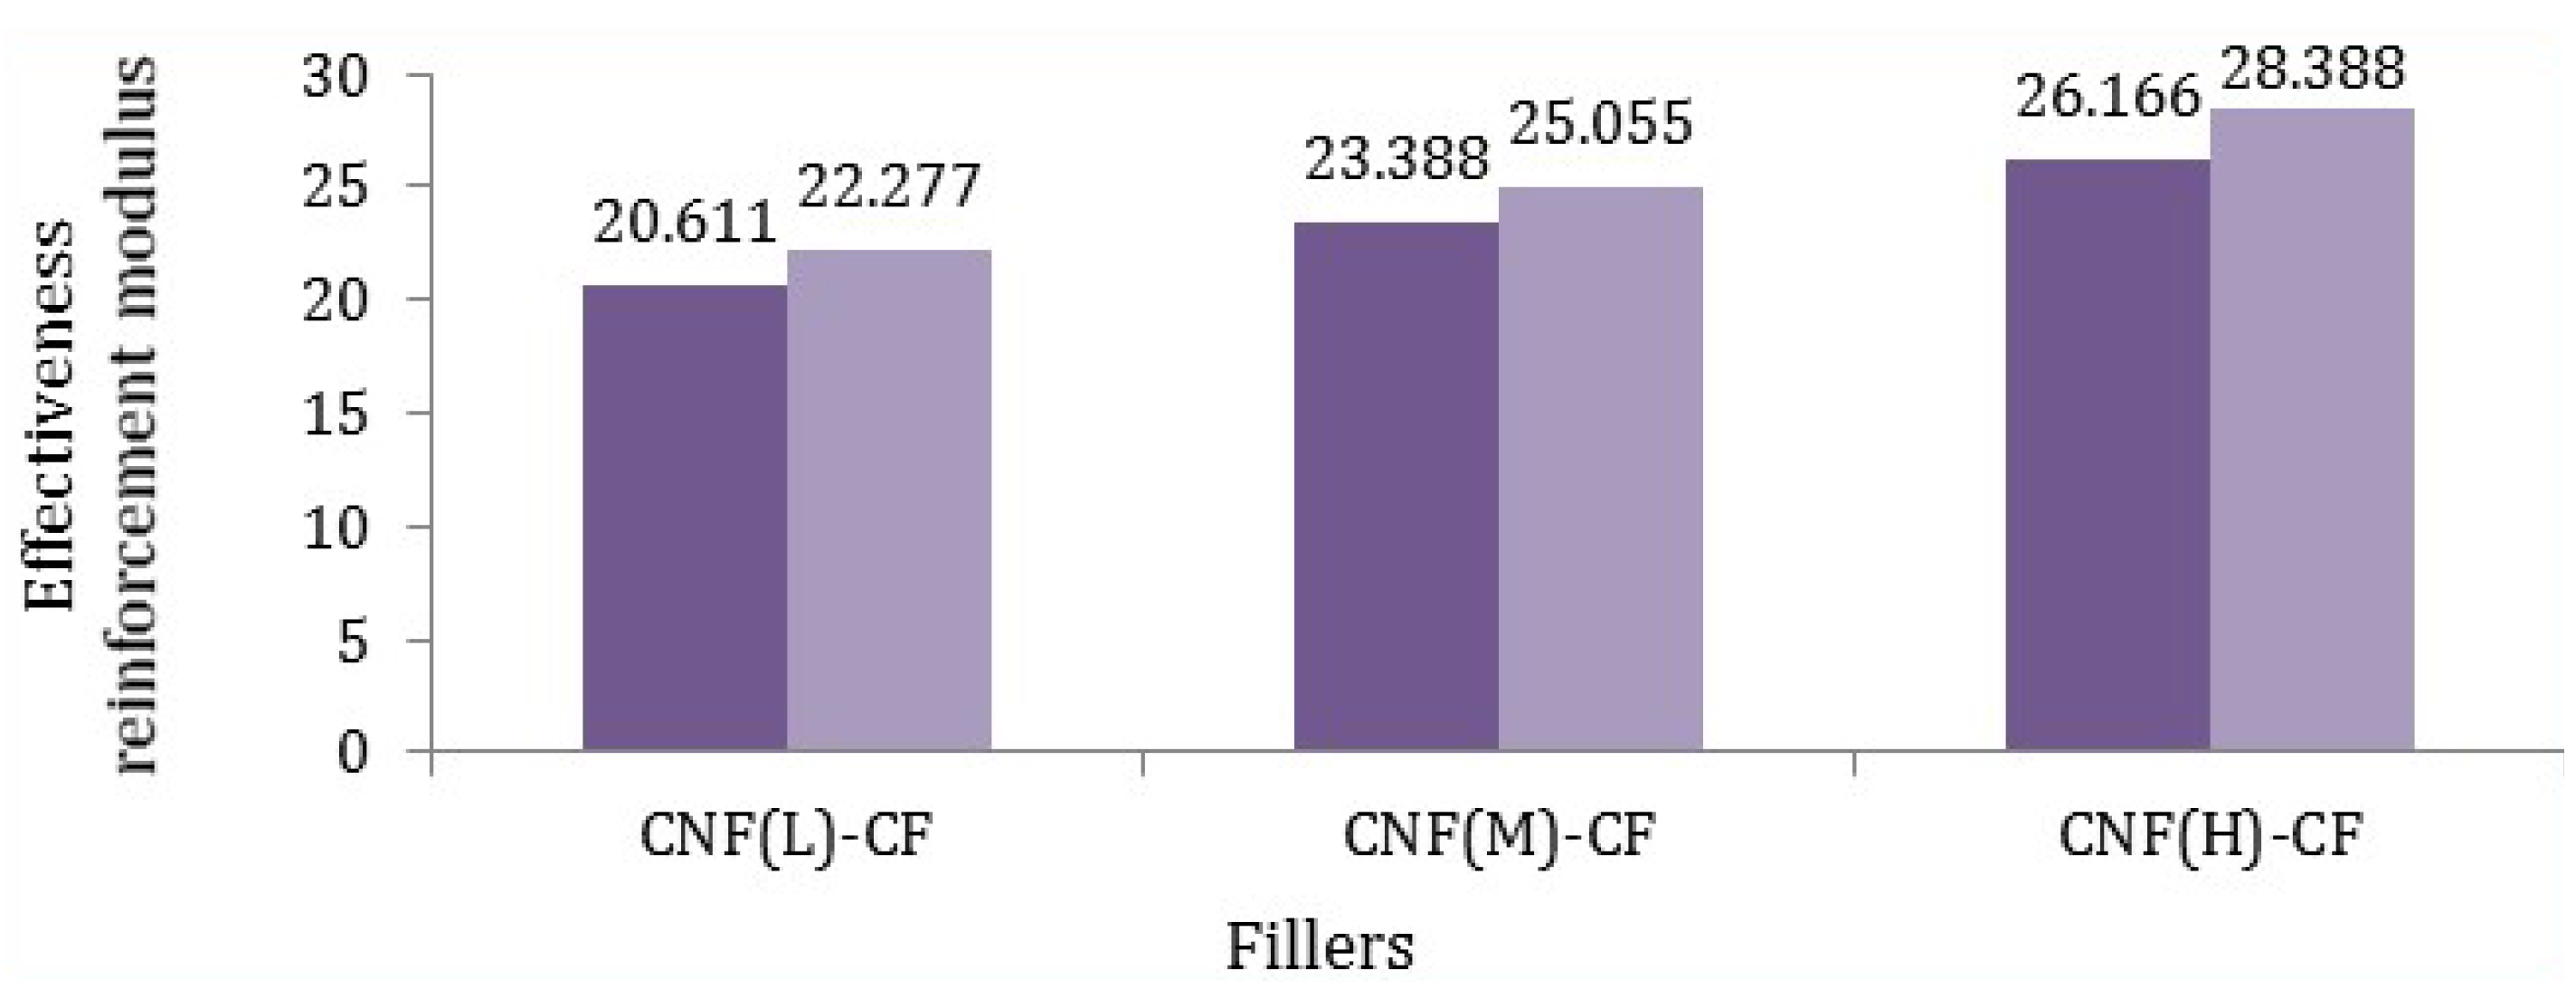
Afterwards, the effective reinforcement modulus of the fillers (Equation (2)) was obtained as follows:
Based on Equation (2), the Young’s modulus of various fillers was calculated and is reported in
Figure 8, where
Ec was obtained from
Table 5,
Em was about 0.47 GPa,
Vf was 5%, and
Vm was 95%.
Figure 8.
Effective reinforcement modulus of different fillers in polypropylene matrix (dark purple states minimum amount and light purple reveals maximum amount).
Figure 8.
Effective reinforcement modulus of different fillers in polypropylene matrix (dark purple states minimum amount and light purple reveals maximum amount).
According to
Figure 8, it was found that the modulus of fibers (CF-CNF
H) was the highest. Such a meaningful difference was related to not only the uniform and excellent coating of the CNF on the CF but also the maximum surface area of the CNF. By comparing the Young’s modulus of fibers, it can be calculated that the reaction time and catalyst concentration have the main roles rather than temperature and hydrocarbon flow rate, which was verified by comparing the tensile modulus of the different CNF-CFs. Consequently, the mathematical calculations confirm the experimental results of the tensile modulus of fillers.


