


Impact of Ukrainian Refugees on the COVID-19 Pandemic Dynamics after 24 February 2022

1
Institute of Hydromechanics, National Academy of Sciences of Ukraine, UA-03680 Kyiv, Ukraine
2
Zeeman Institute and Mathematics Institute, University of Warwick, Coventry CV4 7AL, UK
*
Author to whom correspondence should be addressed.
Computation 2024, 12(4), 70; https://doi.org/10.3390/computation12040070
Submission received: 6 January 2024
/
Revised: 16 February 2024
/
Accepted: 22 February 2024
/
Published: 3 April 2024
(This article belongs to the Special Issue Artificial Intelligence Applications in Public Health)
Abstract
:The full-scale invasion of Ukraine caused an unprecedented number of refugees after 24 February 2022. To estimate the influence of this humanitarian disaster on the COVID-19 pandemic dynamics, the smoothed daily numbers of cases in Ukraine, the UK, Poland, Germany, the Republic of Moldova, and in the whole world were calculated and compared with values predicted by the generalized SIR model. In March 2022, the increase in the smoothed number of new cases in the UK, Germany, and worldwide was visible. A simple formula to estimate the effective reproduction number based on the smoothed accumulated numbers of cases is proposed. The results of calculations agree with the figures presented by John Hopkins University and demonstrate a short-term growth in the reproduction number in the UK, Poland, Germany, Moldova, and worldwide in March 2022.
1. Introduction
The full-scale invasion in Ukraine has caused a real humanitarian catastrophe, the scale of which deserves appropriate assessment and punishment. As of 23 March 2022, more than 3.5 million Ukrainians have been forced to flee their homes and seek refuge abroad [1]. Such mass migration could potentially lead to a significant increase in the daily numbers of new COVID-19 cases [2,3] and in the reproduction rates. The daily numbers of new cases show random variation [4] and need some smoothing to reveal trends. In particular, 7-day average values obtained with the use of the current day figure and numbers registered on the previous 6 days were calculated and reported in the COVID-19 Data Repository by the Center for Systems Science and Engineering (CSSE) at Johns Hopkins University (JHU) [4] for all countries and regions. In this study, we will smooth the accumulated numbers reported by JHU with the use of the method proposed in [5,6] and will try to reveal the corresponding trends in the UK, Poland, Germany, the Republic of Moldova, and the world after 24 February 2022.
An increase in the daily numbers of new cases can be expected in countries that had lower percentages of infectious persons (in comparison with Ukraine) before 24 February 2022. The number of people spreading the SARS-CoV-2 infection in the entire population I(t) is unknown (it differs from the numbers of cases registered during some period of time t or from the numbers of active cases). Nevertheless, it is possible to estimate the function I(t) with the use of the generalized Susceptible-Infectious-Removed (SIR) model [5] or other mathematical simulations, taking into account that model parameters can be different during different pandemic waves. In this study, we will use the results of SIR simulations for the 14th epidemic wave in Ukraine [6], 7th global pandemic wave [6], 4th wave in Poland [7], and 5th wave in Germany [7]. To calculate the optimal values of the model parameters, the accumulated numbers of cases registered in periods from 22 January to 4 February 2022 (for Ukraine and the world [6]) and from 22 November to 5 December 2021 (for Poland and Germany) were used. Unfortunately, only the first COVID-19 pandemic waves in the UK and Moldova were simulated with the use of the SIR model, and corresponding results are not suitable to analyze the situation in 2022.
The effective reproduction number Rt(t) shows the average number of people infected by one person, [8,9,10,11,12,13,14,15] and may increase due to the mass migration. In this study, we will use the theoretical SIR estimations of Rt(t) and propose some new simple formulae. The results of calculations will be compared with Rt(t) values available in [4].
2. Data, Generalized SIR Model, and Smoothing Procedure
We will use the data set containing the accumulated numbers of laboratory-confirmed COVID-19 cases Vj in Ukraine, the UK, Poland, Germany, the Republic of Moldova, and the whole world from the COVID-19 Data Repository, operated by the Center for Systems Science and Engineering (CSSE) at Johns Hopkins University (JHU) [4] (see Supplementary Tables S1–S6). It should be noted that the JHU figures for Ukraine [4] are approximately 3% higher than the values reported by Ukrainian national sources [16,17]. National statistical data for Germany, the UK, Poland and Moldova can be found in [18,19,20,21,22,23,24,25,26]. For this reason, all data sets used for calculations are available for inspection (see Supplementary Tables S1–S6). The corresponding time points tj (measured in days) are shown in Tables S1–S6 for the period of November 2021 to April 2022. JHU periodically updates its data sets for previous time points [4]. Here, we will use the JHU file corresponding to 13 April 2022 (numbers of COVID-19 cases accumulated in the UK correspond to the version available on 13 July 2022). It must be noted that the data sets presented in Tables S2 and S4 are slightly different from the previous versions used in [7]. The reproduction numbers will be shown according to the JHU data sets available on 9 September 2022.
The generalized SIR model relates the numbers of susceptible S(t), infectious I(t), and removed persons R(t) versus time t for a particular epidemic wave i, [5]
Compartment S(t) includes people who are sensitive to the pathogen and not protected. Compartment I(t) includes people who spread the infection; it is not the number of known active cases, since people can be ill but isolated and unable to spread the infection. R(t) includes people who no longer spread the infection; this number is the sum of isolated, recovered, dead, and infected people who left the region under consideration. Parameters and are supposed to be constant for every epidemic wave, i.e., for the time periods . The dimension of these parameters is [time]−1. In particular, if time is measured in days, parameters and are measured in [day]−1.
Values of αi show how quickly susceptible people become infected (see (1)). The parameter ρi characterizes the patient removal rate (according to Equation (3)). The inverse values are the estimations of the average time of spreading infection or the generation time [14] during the i-th epidemic wave
Summarizing Equations (1)–(3) yields zero value of the derivative . Then, the sum:
must be constant for every epidemic wave. We consider the value Ni to be an unknown parameter of the SIR model corresponding to the i-th wave, which must be estimated by observations. There is no need to assume that this constant equals the known volume of population and to reduce the problem to a two-dimensional one. Many researchers use this additional unrealistic condition, which means that before the outbreak, all people are susceptible. However, many people are protected by their immunity, distance, lockdowns, etc. In particular, estimates of the initial number of susceptible people (before the outbreak) for the first COVID-19 epidemic wave in China yielded values between 91 and 138 thousand, (0.006–0.01% of the population), [5].
The initial conditions for the set of Equations (3)–(5) at the beginning of every epidemic wave can be written as follows
The exact solution of the set of non-linear differential Equations (1)–(3) can be obtained using the function
corresponding to the number of victims or the cumulative numbers of cases over time t, which has the following form [5]
Thus, for every set of parameters and a fixed value of , integral (9) can be calculated and a corresponding moment of time can be determined from (8). The S(t), I(t), and R(t) values can be calculated with the use of the following equations [5]
The derivative dV/dt yields the estimate of the average daily number of new cases.
Different procedures for parameter identification can be found in [5], but all use the accumulated numbers of cases Vi registered during some period of time (usually 14 days). Some examples of optimal values of parameters and other characteristics of four different epidemic waves are presented in Table 1.
Since daily numbers of new cases show random variation and are characterized by some weekly periodicity, the smoothed characteristics will be used (see [5])
To estimate the smoothed numbers of new daily cases DVi, the numerical derivatives of the smoothed values (10) will be used, as in [5]:
3. Effective Reproduction Number
The effective reproduction number Rt(t) shows the average number of people infected by one person, [8,9,10,11,12,13,14]. For the COVID-19 pandemic, Robert Koch Institute (RKI) recommends using a generation time of 4 days and calculating the reproduction number as “the ratio of new infections in two consecutive time periods, each consisting of 4 days”, [9]. In terms of the accumulated numbers of cases Vj, the RKI formula can be written as follows,
The mean UK household generation time was estimated as 3.2 days for the Delta variant and 4.5 days for the Alpha variant [14]. The values of τi (see Equation (4)) calculated in [5,6,7] for different waves of the COVID-19 pandemic can be also used to estimate the reproduction rates in different countries. In particular, during the first epidemic wave in the UK, τ1 was estimated as 3.03 [5]. The information about serial intervals (the periods between symptom onset in infector–infectee pairs, [14,15]) can also be useful for estimations of the reproduction numbers. Thus, Formula (12) can be generalized as follows:
where corresponds to the values from Formula (4), generation time or serial intervals, calculated in [14,15]. To minimize the influence of random variation in daily numbers of cases, the smoothed values (according to Formula (10)) are recommended. Smoothed values, and , can be calculated using a linear (or other) interpolation of numbers.
The generalized SIR model and corresponding identification procedures of its parameters allow estimating the reproduction numbers with the use of the following formula, [5]
where i corresponds to the number of the epidemic wave. For successful SIR simulations, it is enough to have information about the accumulated numbers of cases over a 14-day period [5,6,7]. Thus, the reproduction number can be calculated with the use of this number of observations. Calculations with the use of Formula (13) need approximately the same volume of information.
The Kalman filter was used in [11] to reduce random pulsations in the daily numbers of cases. Corresponding reproduction rates are calculated and listed by JHU [4] for almost every country and region. For the summer COVID-19 epidemic wave in Japan, a good agreement between the method proposed in [11] and calculations with the use of Equation (14) was demonstrated in [5]. In this study, we will compare the corresponding Rt(t) values (version of JHU file available on 9 September 2022) for Ukraine, the UK, Poland, Germany, Moldova, and the whole world with the results of calculations based on Formulae (12)–(14).
4. Results and Discussion
The optimal values of parameters of the generalized SIR model and other characteristics of the 14th pandemic wave in Ukraine [6], the 4th wave in Poland [7], the 5th wave in Germany [7], and the 7th wave in the whole world [6] are listed in Table 1. Corresponding SIR curves are shown in Figure 1 and Figure 2. The laboratory-confirmed accumulated numbers of COVID-19 cases Vj (Tables S1–S6) are shown by “stars” and “circles” (data used for SIR simulations). “Crosses” represent the averaged daily numbers of new COVID-19 cases calculated with the use of the Vj values and Equations (10) and (11).
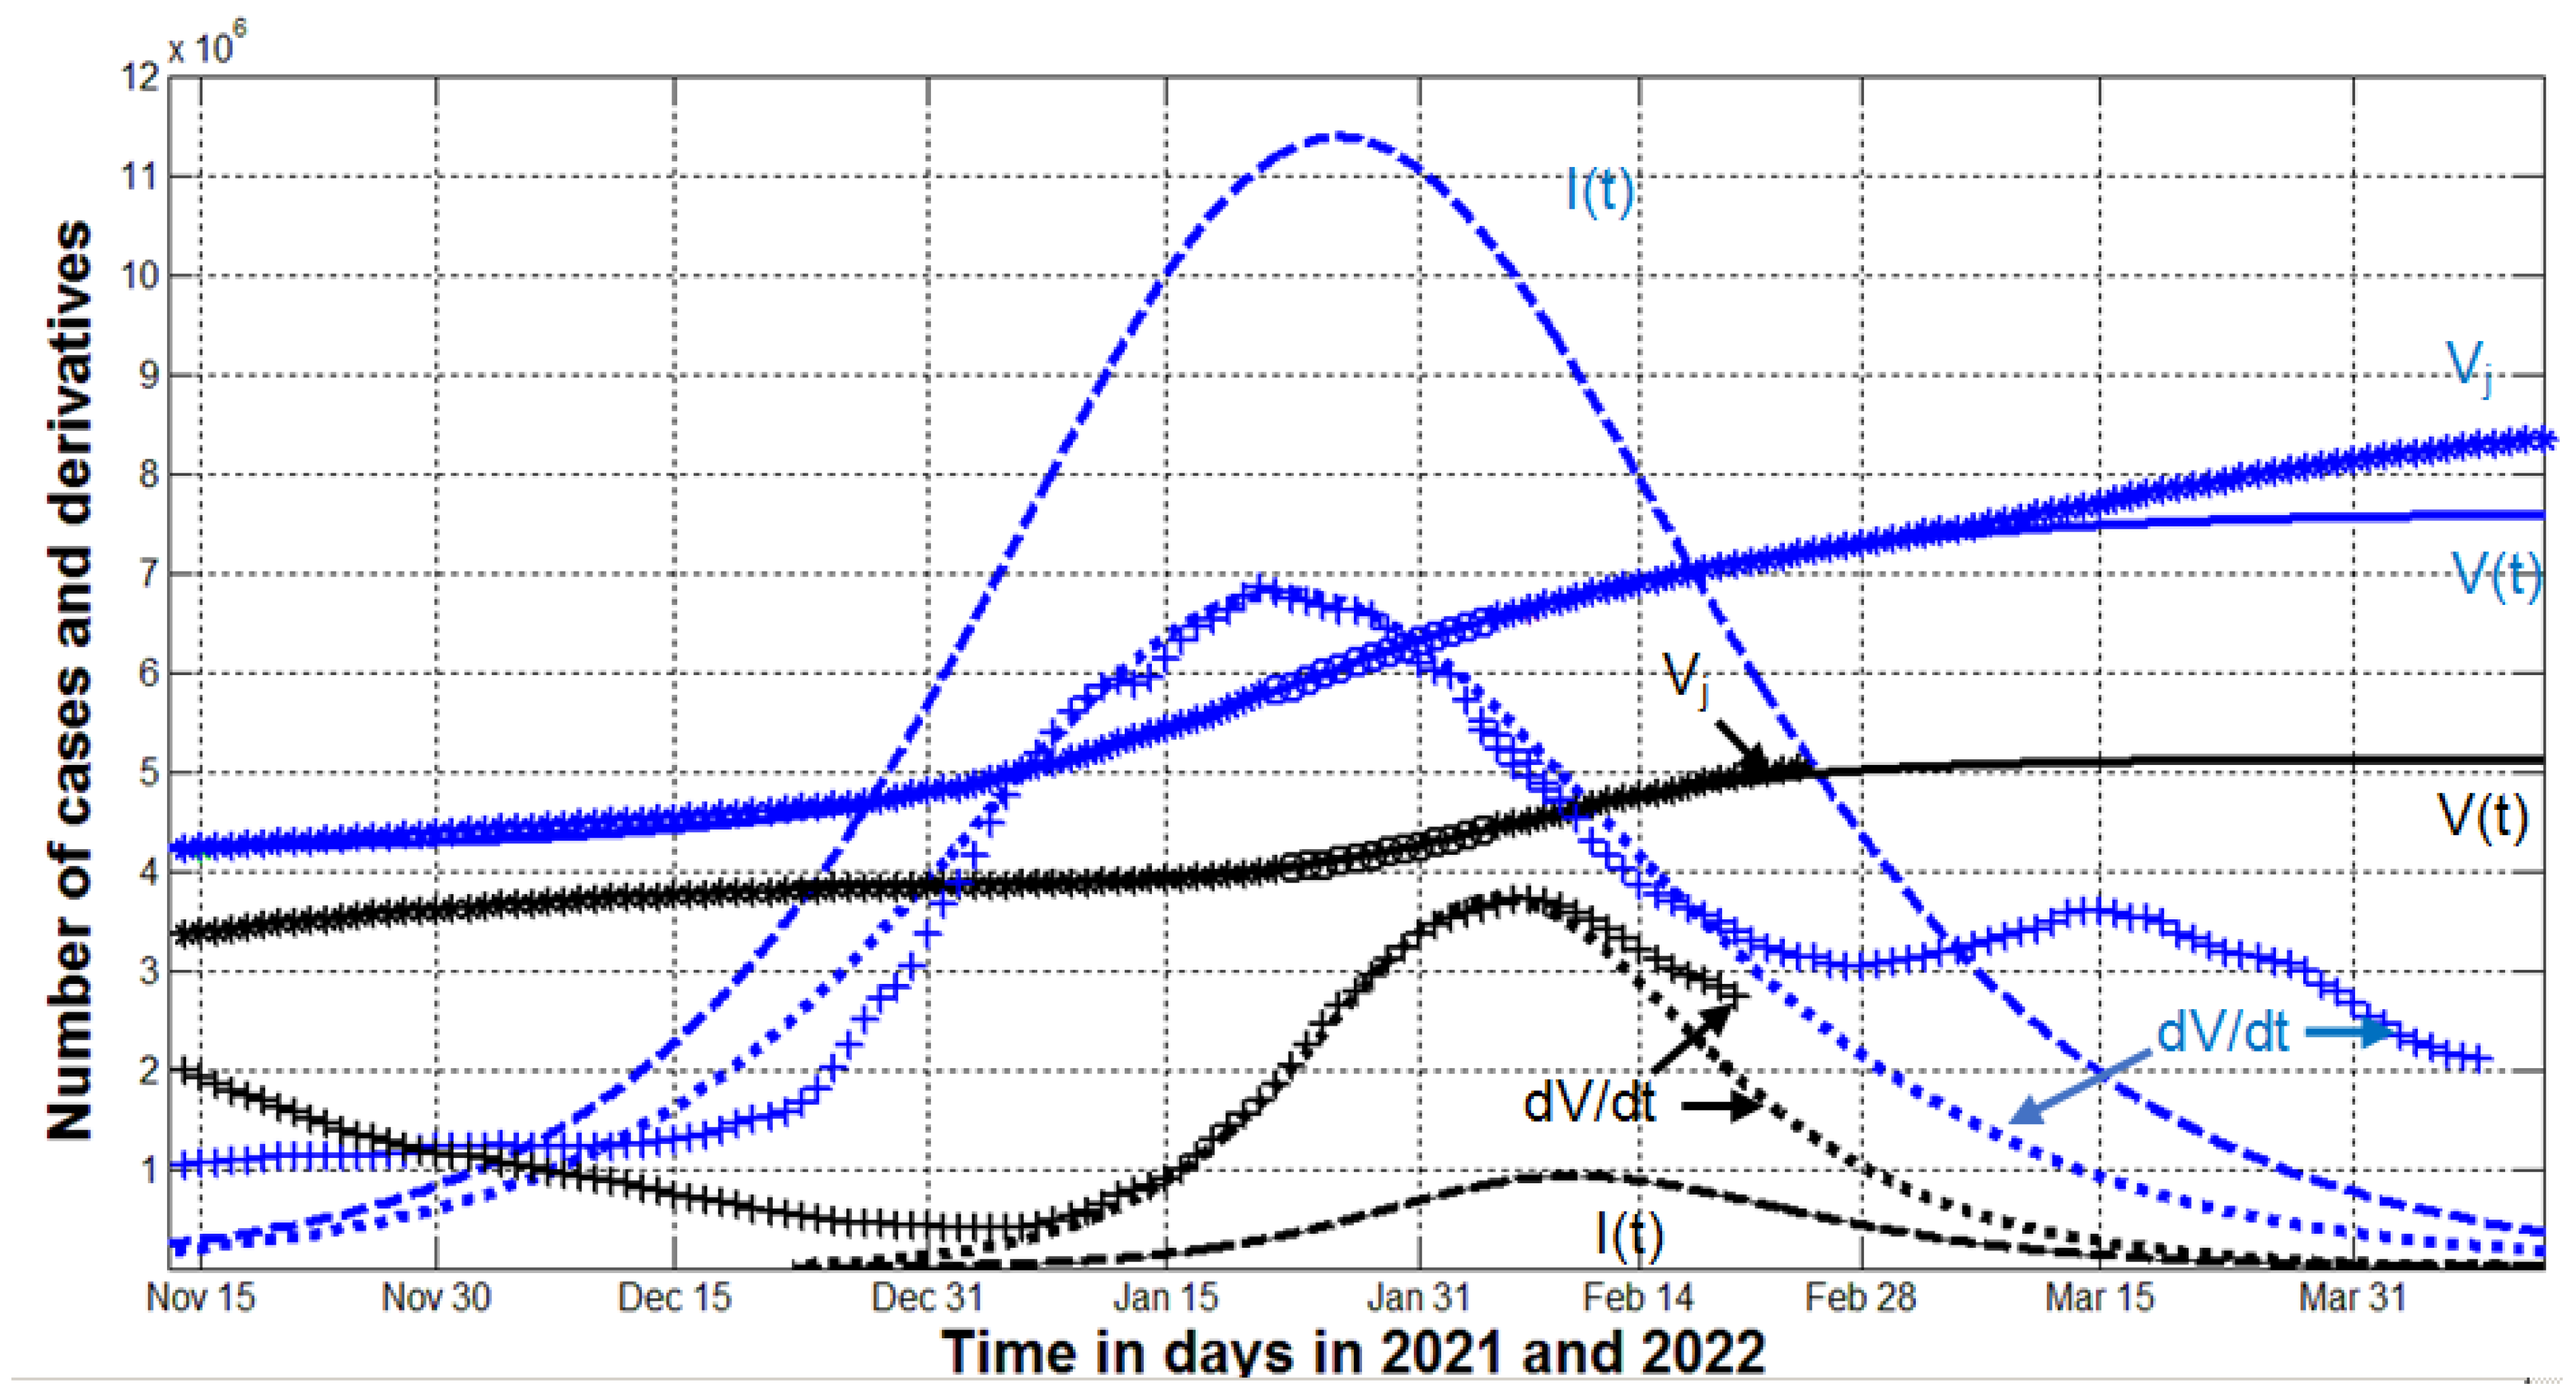
“Stars” and “crosses” in Figure 1 illustrate that before the full-scale invasion, which started on 24 February 2022, the accumulated number of cases (“stars”) and the averaged daily numbers of new cases (“crosses”) followed the corresponding theoretical solid and dotted lines. In March 2022, the real global dynamics started to deviate from the theoretical blue solid and dotted curves. In particular, the saturation level of the 7th pandemic wave = 456,268,762 (see the last column of Table 1) was exceeded. The increase in the global daily numbers of new cases (see blue “crosses”) in March 2022 can be explained by the mass migration from Ukraine. As of 23 March 2022, more than 3.5 million Ukrainians were forced to flee abroad [1].
To estimate the possible impact of this humanitarian disaster, let us calculate the probability of meeting an infectious person in Ukraine with the use of the following simple formula, [5]
where Npop is the size of the population. As of 24 February 2022, the number of people spreading the infection I(t) was around 100,000 in Ukraine and 5 million in the whole world (see dashed lines in Figure 1). Since before the war, the population of Ukraine was 178 times less than the global figure, but the probability of meeting an infected person in Ukraine was 3.6 times higher (according to Equation (15)). This means that forced mass emigration of Ukrainians could cause an increase in the number of new cases in the world. Blue “crosses” in Figure 1 illustrate this fact. It is worth noting that after 15 March 2022, the growth stopped, which can be explained by a decrease in the flow of refugees.
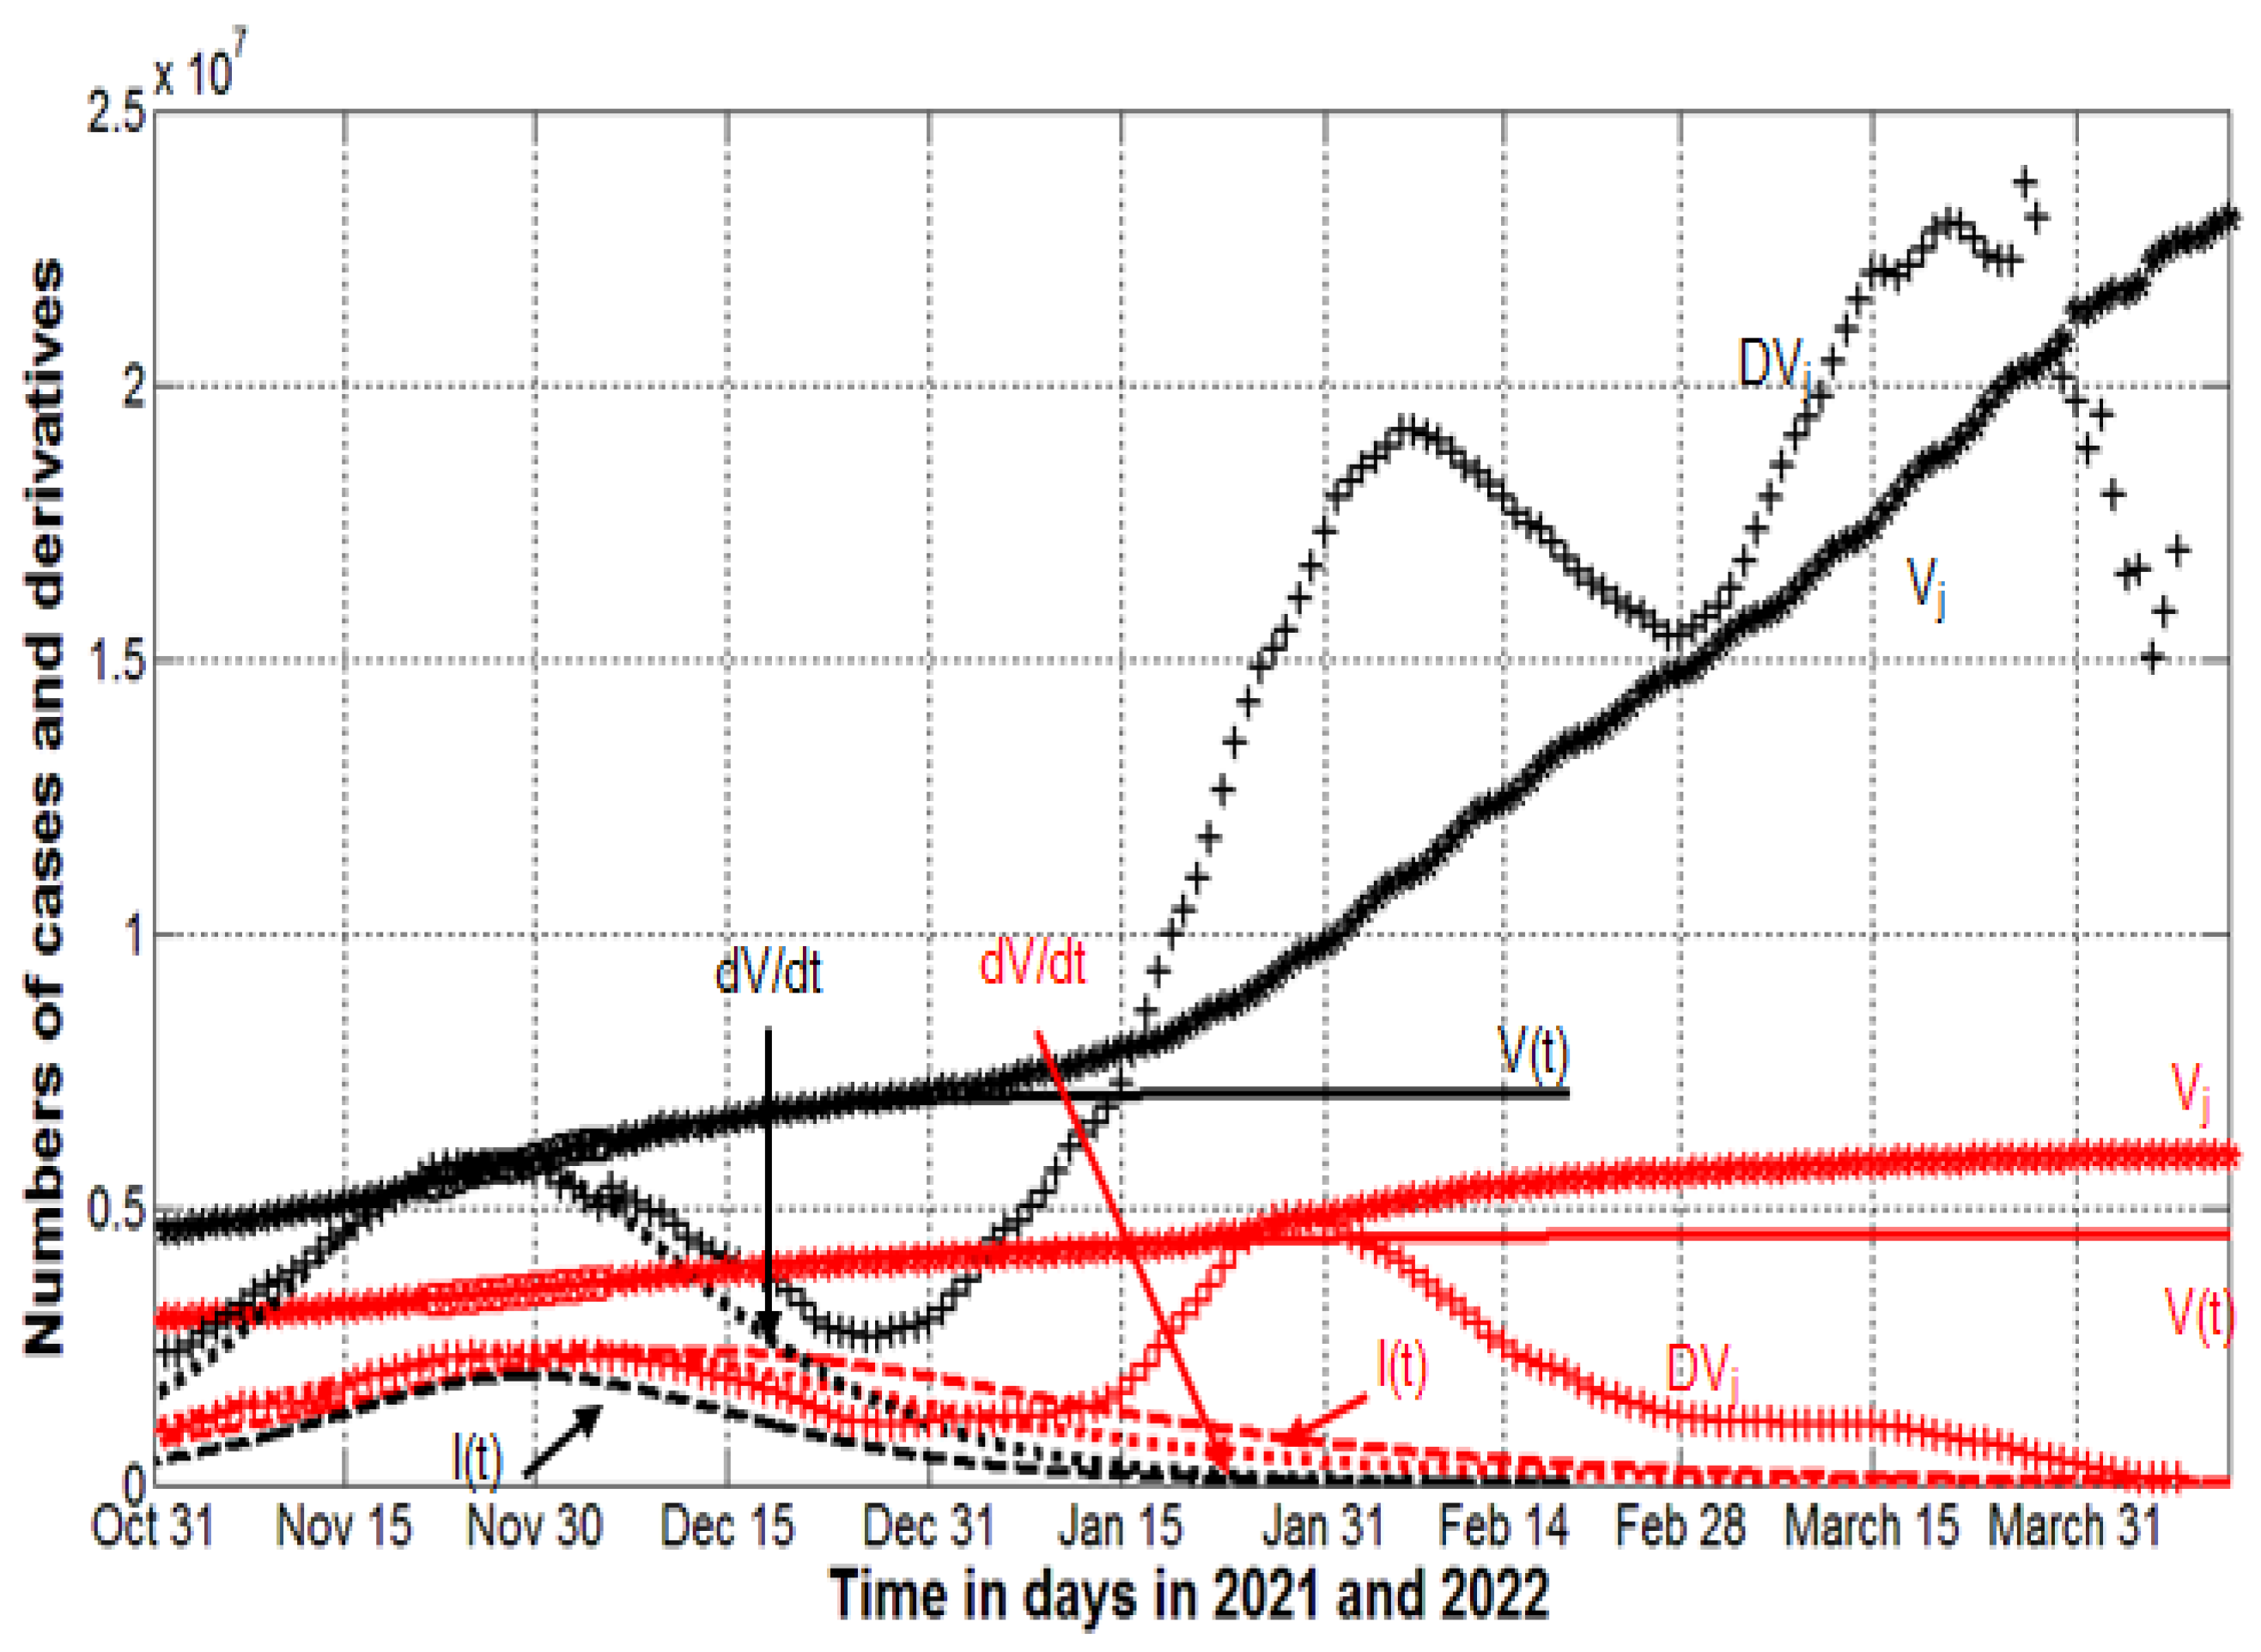
Let us consider the situation in Poland, which has accepted more than 2 million Ukrainian refugees [1]. In March 2022, the decline in the number of new cases slowed down and stopped decreasing (see red “crosses” in Figure 2). The relatively small impact on the Polish epidemic dynamics can be explained by the approximately same probability of meeting an infectious Polish and Ukrainian person.
Unfortunately, we have results of SIR simulations only for the 4th wave in Poland (shown by red lines in Figure 2, [7]). In January 2022, a new Omicron wave started in this country and the daily numbers of new cases (red “crosses” in Figure 2) became much higher than the theoretical estimation for the previous wave (the red dotted line). The maximum values of I(t) were approximately 200,000 both for Ukraine and Poland (see the black dashed line in Figure 1 and the red dashed line in Figure 2). Since the populations of these countries are also similar, we can expect the values for the probabilities of meeting an infectious person to be similar as well (according to Equation (15)). Thus, the huge number of Ukrainian refugees did not significantly change the epidemic dynamics in Poland.
In early 2022, when a new powerful epidemic wave began in Germany, the number infected in this country was about four times less than in Poland (compare black and red dashed lines in Figure 2). Taking into account the difference in population size, one can expect the probability of meeting an infectious person to be about eight times less in Germany. Therefore, refugees from Ukraine could significantly increase the number of new cases in Germany in March 2022. Black “crosses” in Figure 2 illustrate this fact.
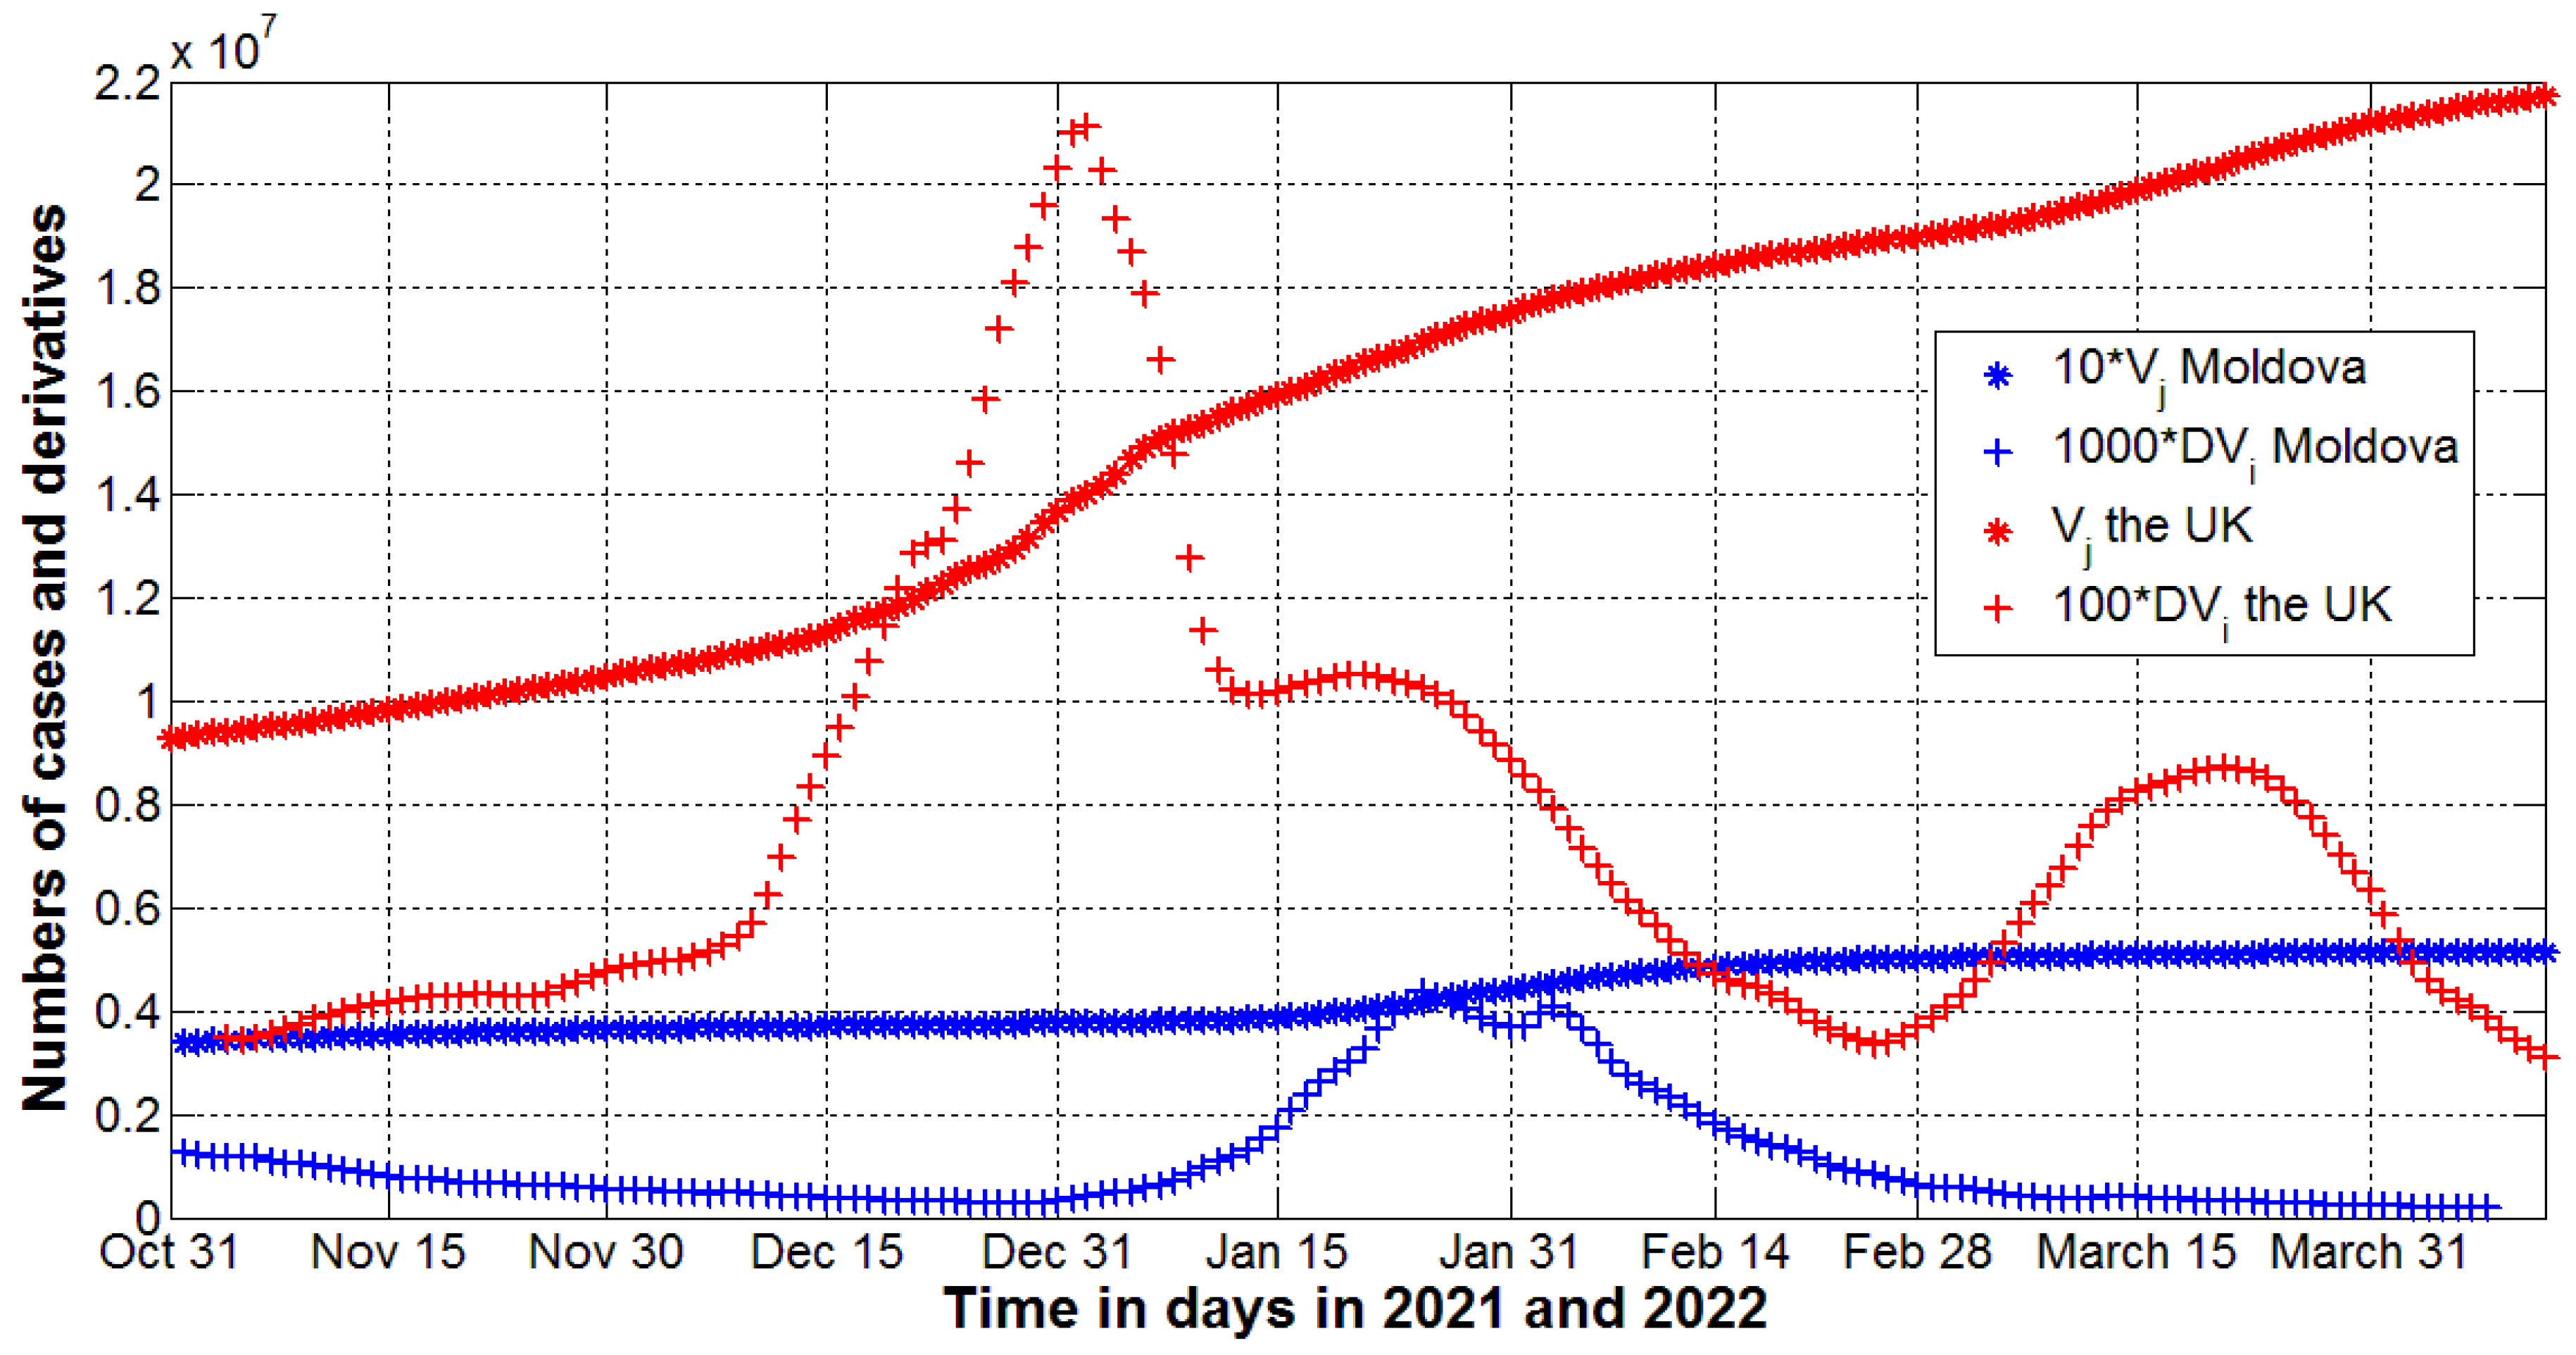
Figure 3 illustrates the COVID-19 pandemic dynamics in the UK and the Republic of Moldova. We can see almost no increase in the numbers of new cases in Moldova (blue “crosses”) after 24 February 2022. Only some stabilization in the decreasing trend is visible in March 2022. This probably relates to the similar characteristics of the pandemic dynamics in Ukraine and Moldova (as in the case of Poland). In the UK, the increase in the averaged daily numbers of new cases DVi (see Equation (11)) is visible after 24 February 2022 (red “crosses”).
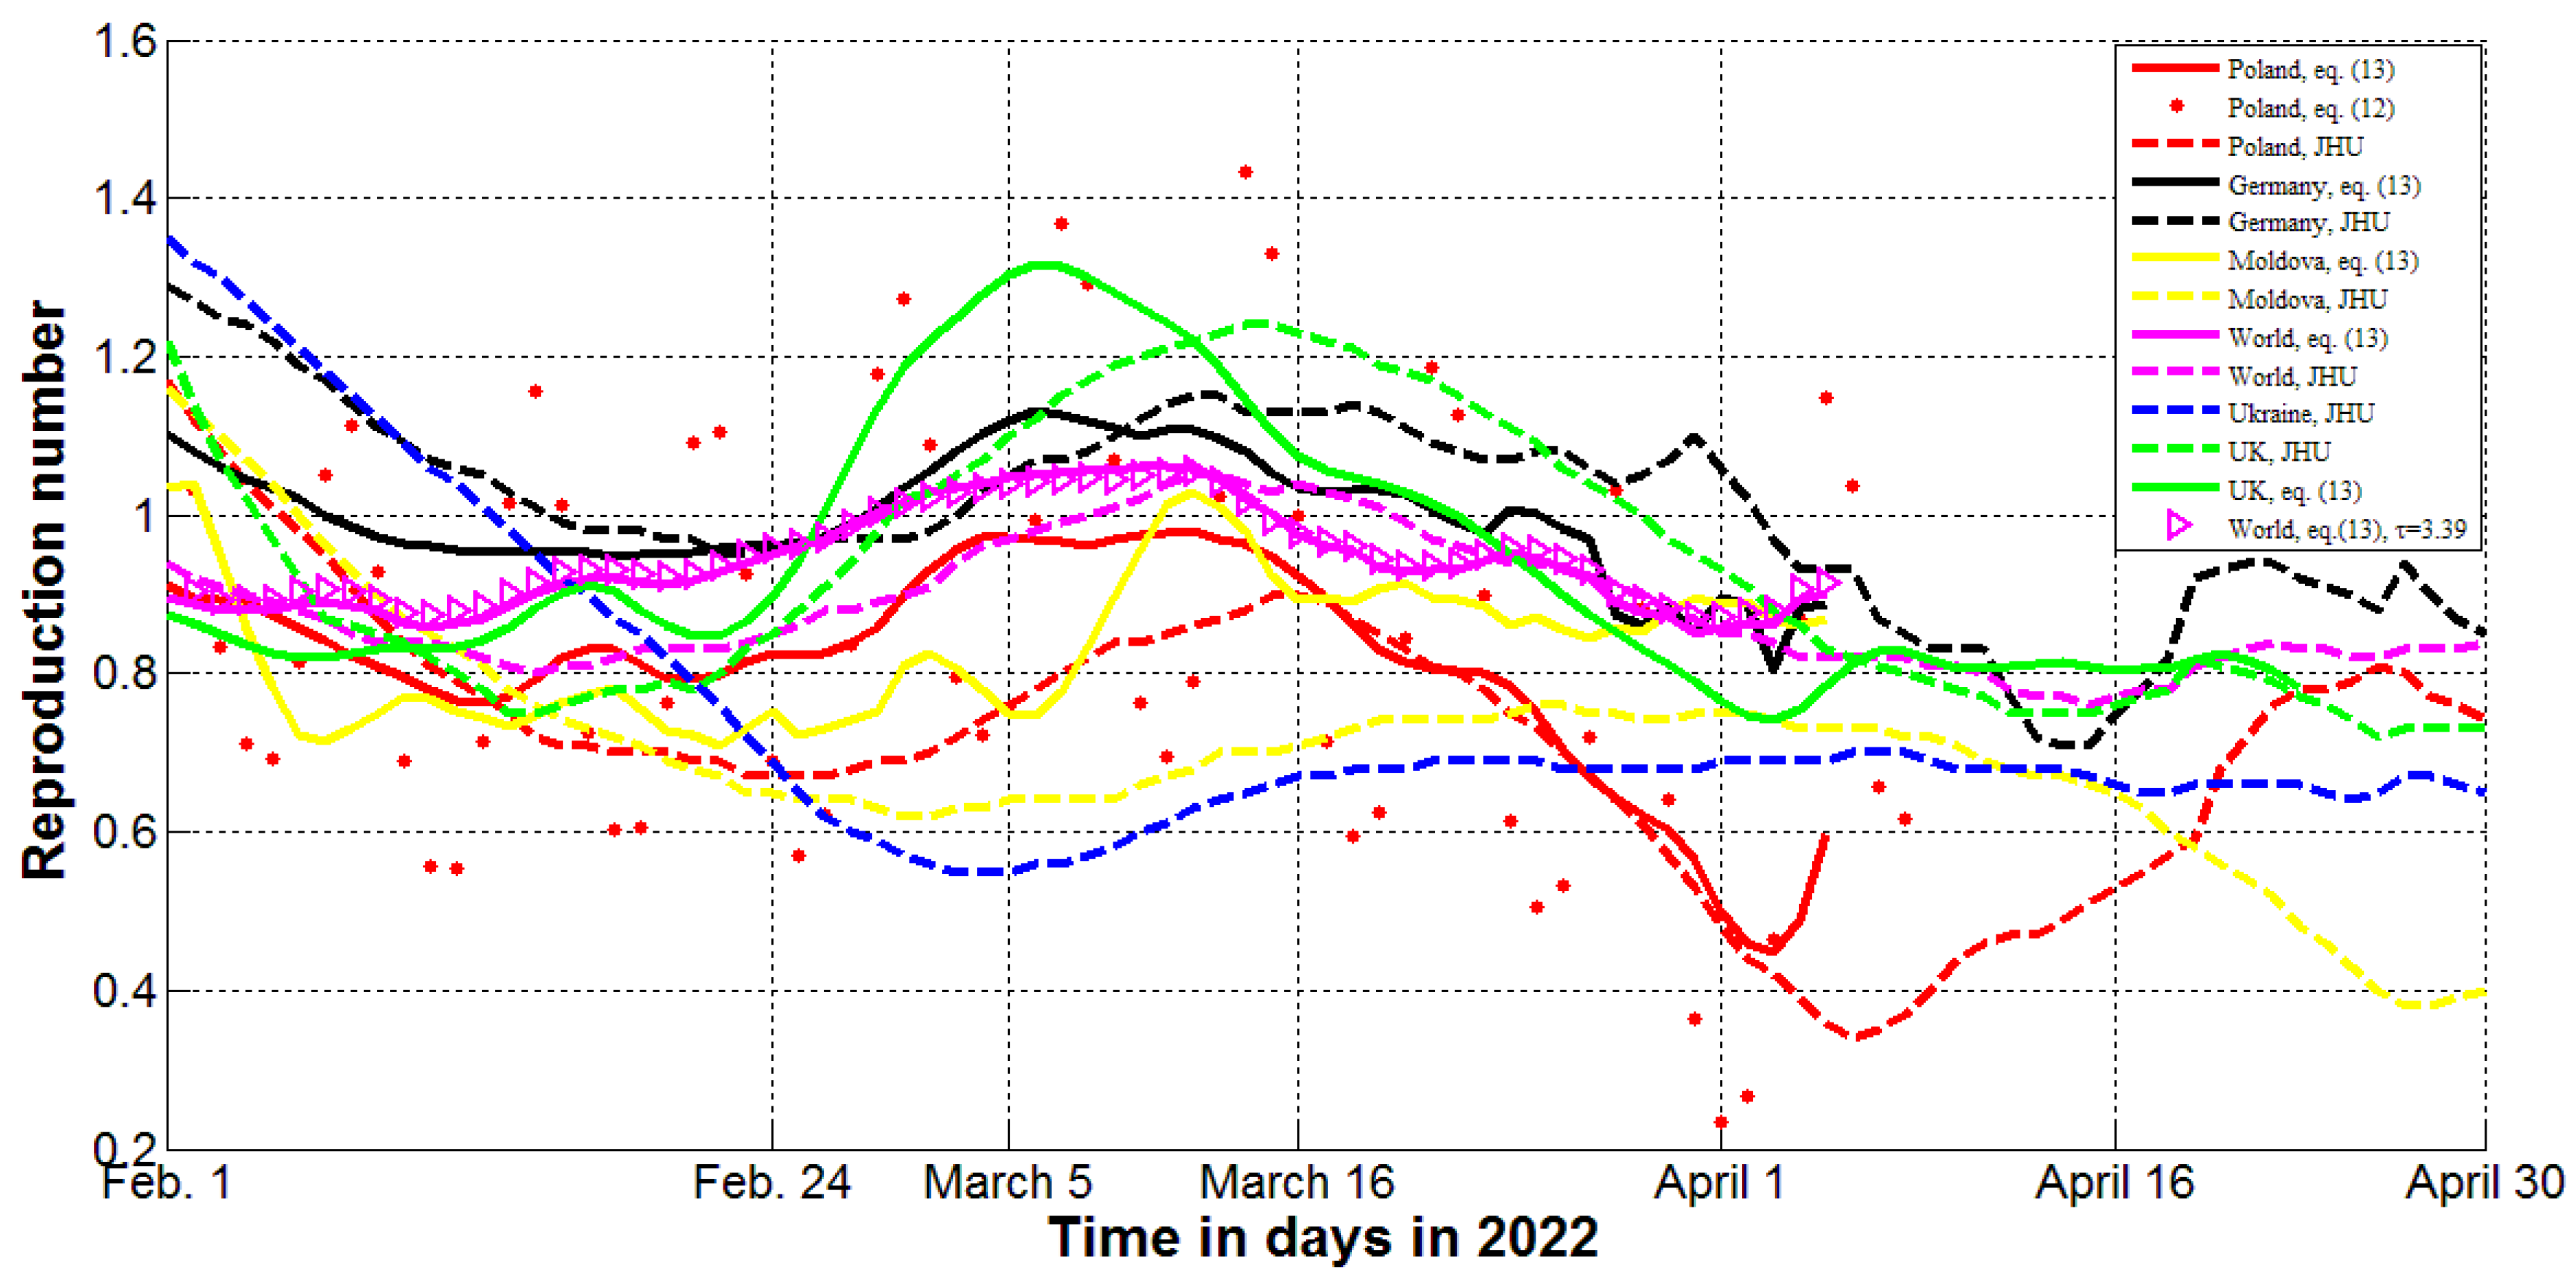
Figure 4 represents the dependences Rt(t) for different countries and in the whole world. Solid lines represent the results of calculations with the use of Equation (13). The value = 4 days was used in all cases (according to recommendations of RKI, [9]). We have also used the value = 3.3872977636047 (see last column in Table 1) and linear interpolation of smoothed accumulated numbers of cases (Equation (10)) to calculate the global reproduction rate according to Formula (13). Magenta “triangles” represent the results, which are close to the magenta solid line representing the case = 4. Red “dots” illustrate the results of calculations for Poland with the use of Formula (12). It can be seen that the use of unsmoothed accumulated numbers of cases in (12) leads to very random values of the reproduction number. Equation (12) yields similar results for other countries and the whole world (not shown in Figure 4). The dashed lines in Figure 4 represent the JHU data sets for the reproduction rate. The results of calculations with the use of Formula (13) are rather close to the JHU values.
Equations (1) and (14) show that the reproduction number decreases monotonically during a fixed epidemic wave. For example, as of 22 January 2022, the corresponding values were 1.56 for Ukraine and 1.03 for the world (parameters listed in Table 1 and Formula (14) allow these figures to be calculated, since ). Without changing the epidemic parameters, as of 30 April 2022, these values should monotonically approach 0.52 for Ukraine and 0.79 for the world (since ). The blue line in Figure 4 demonstrates slight deviation from the values calculated for Ukraine. Magenta lines show that the global reproduction number increased after 24 February 2022 and was higher than the critical value of 1.0 in March 2022. The increasing trends in Poland, Germany, the UK, and Moldova are also visible. The red, black, green and yellow lines in Figure 4 show that only in Poland has the reproduction rate not achieved the critical value of 1.0 in March 2022. Thus, the changes in COVID-19 pandemic dynamics are evident and could be caused by the huge numbers of Ukrainian refuges.
5. Conclusions
Smoothed values of the accumulated numbers of cases were used to estimate the average daily numbers of new COVID-19 cases and the effective reproduction numbers for Ukraine, the UK, Poland, Germany, Moldova, and the whole world in February, March, and April of 2022. The registered numbers of cases were compared with ones predicted by the generalized SIR model for the previous epidemic waves in Ukraine, Poland, Germany, and the world. Simple formulae to estimate the effective reproduction number were proposed. The results of calculations agree with the figures presented by John Hopkins University. In March 2022, the increasing trends in the reproduction numbers and averaged number of new cases are visible. The biggest pandemic dynamic disturbances were observed in the UK and Germany, where, in February 2022, the probability of meeting an infectious person was probably much lower than in Ukraine.
It would be useful to consider the COVID-19 pandemic dynamics in other countries with high and low numbers of Ukrainian refugees in order to analyze changes after 24 February 2022 and to develop a compensation mechanism.
Supplementary Materials
The following supporting information can be downloaded at: https://www.mdpi.com/article/10.3390/computation12040070/s1. Table S1: Cumulative numbers of laboratory-confirmed COVID-19 cases in Ukraine for the period of 1 November 2021 to 24 February 2022 according to JHU report on 13 April 2022 [4]. Table S2: Cumulative numbers of laboratory-confirmed COVID-19 cases in the world for the period of 1 November 2021 to 12 April 2022 according to JHU report on 13 April 2022, [4]. Table S3: Cumulative numbers of laboratory-confirmed COVID-19 cases in Poland for the period of 1 November 2021 to 12 April 2022 according to JHU report on 13 April 2022, [4]. Table S4: Cumulative numbers of laboratory-confirmed COVID-19 cases in Germany for the period of 1 November 2021 to 12 April 2022 according to JHU report on 13 April 2022, [4]. Table S5: Cumulative numbers of laboratory-confirmed COVID-19 cases in the Republic of Moldova for the period of 1 November 2021 to 12 April 2022 according to JHU report on 13 April 2022, [4]. Table S6: Cumulative numbers of laboratory-confirmed Covid-19 cases in the UK for the period of 1 November 2021 to 30 April 2022 according to JHU report on 11 December 2023, [4].
Author Contributions
Conceptualization, I.N. and P.B.; methodology, I.N.; software, I.N.; validation, P.B.; formal analysis, P.B.; investigation, I.N.; resources, P.B.; data curation, P.B.; writing—original draft preparation, I.N.; writing—review and editing, P.B.; visualization, I.N. and P.B.; supervision, I.N.; project administration, P.B.; funding acquisition, I.N. All authors have read and agreed to the published version of the manuscript.
Funding
The study was supported by INI-LMS Solidarity Programme at the University of Warwick, UK.
Data Availability Statement
The autors have used the COVID-19 datasets. COVID-19 Data Repository by the Center for Systems Science and Engineering (CSSE) at Johns Hopkins University (JHU). Available online: https://github.com/owid/covid-19-data/tree/master/public/data (accessed on 20 February 2024).
Acknowledgments
The authors are grateful to Robin Thompson, Matt Keeling, and Oleksii Rodionov for their support and providing very useful information.
Conflicts of Interest
The authors declare no conflict of interest.
References
- Numbers of Refugees. Available online: https://www.ukrinform.ua/rubric-ato/3436732-kilkist-bizenciv-z-ukraini-perevisila-35-miljona-oon.html (accessed on 20 February 2024).
- Nesteruk, I. Impact of the Russian invasion of Ukraine on the COVID-19 pandemic dynamics. MedRxiv 2022. [Google Scholar] [CrossRef]
- Chumachenko, D.; Chumachenko, T. Impact of war on the dynamics of COVID-19 in Ukraine. BMJ Glob. Health 2022, 7, e009173. [Google Scholar] [CrossRef] [PubMed]
- COVID-19 Data Repository by the Center for Systems Science and Engineering (CSSE) at Johns Hopkins University (JHU). Available online: https://github.com/owid/covid-19-data/tree/master/public/data (accessed on 20 February 2024).
- Nesteruk, I. Improvement of the software for modeling the dynamics of epidemics and developing a user-friendly interface. Infect. Dis. Model. 2023, 8, 806–821. [Google Scholar] [CrossRef]
- Nesteruk, I. Epidemic waves caused by SARS-CoV-2 omicron (B.1.1.529) and pessimistic forecasts of the COVID-19 pandemic duration. Medcomm 2022, 3, e122. [Google Scholar] [CrossRef] [PubMed]
- Nesteruk, I. Final sizes and durations of new COVID-19 pandemic waves in Poland and Germany predicted by generalized SIR model. MedRxiv 2021. [Google Scholar] [CrossRef]
- Available online: https://www.r-bloggers.com/2020/04/effective-reproduction-number-estimation/ (accessed on 20 February 2024).
- Adlhoch, C.; Schöneberg, I.; Fell, G.; Brandau, D.; Benzler, J. Increasing case numbers of adenovirus conjunctivitis in Germany, 2010. EuroSurveillance 2010, 15, 45. [Google Scholar] [CrossRef]
- Cori, A.; Ferguson, N.M.; Fraser, C.; Cauchemez, S. A New Framework and Software to Estimate Time-Varying Reproduction Numbers During Epidemics. Am. J. Epidemiol. 2013, 178, 1505–1512. [Google Scholar] [CrossRef] [PubMed]
- Arroyo-Marioli, F.; Bullano, F.; Kucinskas, S.; Rondyn-Moreno, C. Tracking R of COVID-19: A new real-time estimation using the Kalman filter. PLoS ONE 2021, 16, e0244474. [Google Scholar] [CrossRef] [PubMed]
- Thompson, R.N.; Stockwin, J.E.; Van Gaalen, R.D.; Polonsky, J.A.; Kamvar, Z.N.; DeMarsh, P.A.; Dahlqwist, E.; Li, S.; Miguel, E.; Jombart, T.; et al. Improved inference of time-varying reproduction numbers during infectious disease outbreaks. Epidemics 2019, 29, 100356. [Google Scholar] [CrossRef] [PubMed]
- Ogi-Gittins, I.; Hart, W.S.; Song, J.; Nash, R.K.; Polonsky, J.; Cori, A.; Hill, E.M.; Thompson, R.N. A simulation-based approach for estimating the time-dependent reproduction number from temporally aggregated disease incidence time series data. medRxiv 2023. [Google Scholar] [CrossRef]
- Hart, W.S.; Miller, E.; Andrews, N.J.; Waight, P.; Maini, P.K.; Funk, S.; Thompson, R.N. Generation time of the alpha and delta SARS-CoV-2 variants: An epidemiological analysis. Lancet Infect. Dis. 2022, 22, 603–610. [Google Scholar] [CrossRef]
- Nishiura, H.; Linton, N.M.; Akhmetzhanov, A.R. Serial interval of novel coronavirus (COVID-19) infections. Int. J. Infect. Dis. 2020, 93, 284–286. [Google Scholar] [CrossRef]
- Coronavirus in Ukraine—Statistics—Map of Infections, Graphs [Internet]. 2021. Available online: https://index.minfin.com.ua/ua/reference/coronavirus/ukraine/ (accessed on 20 February 2024).
- Cabinet of Ministers of Ukraine—Home [Internet]. Available online: https://www.kmu.gov.ua/ (accessed on 20 February 2024).
- Covid-19 Data for Germany. [Internet]. Available online: https://www.destatis.de/EN/Service/EXSTAT/Datensaetze/covid19-data-germany.html (accessed on 20 February 2024).
- Tracking the Spread of Coronavirus in Germany. [Internet]. Available online: https://www.deutschland.de/en/topic/politics/the-coronavirus-in-germany-facts-and-figures (accessed on 20 February 2024).
- Office for National Statistics. [Internet]. Available online: https://www.ons.gov.uk/peoplepopulationandcommunity/healthandsocialcare/conditionsanddiseases (accessed on 20 February 2024).
- UKHSA Data Dashboard. [Internet]. Available online: https://ukhsa-dashboard.data.gov.uk/ (accessed on 20 February 2024).
- ZOE Health Study. [Internet]. Available online: https://health-study.zoe.com/data (accessed on 20 February 2024).
- Website of the Republic of Poland. [Internet]. Available online: https://www.gov.pl/web/coronavirus (accessed on 20 February 2024).
- Statistics Poland. [Internet]. Available online: https://stat.gov.pl/en/covid/studies-related-to-covid-19/ (accessed on 20 February 2024).
- National Bureau of Statistics of the Republic of Moldova/[Internet]. Available online: https://statistica.gov.md/en/sovid-19-188_4540.html (accessed on 20 February 2024).
- Moldova Coronavirus COVID-19 Cases. [Internet]. Available online: https://tradingeconomics.com/moldova/coronavirus-cases (accessed on 20 February 2024).
Figure 1.
The omicron waves and further pandemic dynamics in Ukraine and in the whole world. The results of SIR simulations of the 14th wave in Ukraine are shown by black lines. Blue lines represent the 7th pandemic wave in the world. Numbers of victims V(t) = I(t) + R(t)—solid lines (for the world divided by 60); numbers of infected and spreading I(t) (multiplied by 5 for Ukraine)—dashed; derivatives dV/dt, multiplied by 100 for Ukraine and by 2 for the world)—dotted. “Circles” correspond to the accumulated numbers of cases registered during the periods taken for SIR simulations (for the world divided by 60). “Stars” correspond to Vj values beyond these time periods (for the world divided by 60). “Crosses” show the numerical derivative (11) multiplied by 100 for Ukraine and by 2 for the world. Black markers correspond to Ukraine ([6], Table S1), blue—the world ([6], Table S2).

Figure 2.
The COVID-19 pandemic waves in Poland (red) and Germany (black) in 2021 and 2022. The results of SIR simulations of the 4th wave in Poland and the 5th wave in Germany are shown by red and black lines, respectively, [7]. Numbers of victims V(t) = I(t) + R(t)—solid lines; numbers of infected and spreading I(t) multiplied by 10—dashed; derivatives dV/dt (multiplied by 100)—dotted. “Circles” correspond to the accumulated numbers of cases registered during the period taken for SIR simulations. “Stars” correspond to Vj values beyond this time period. “Crosses” show the averaged daily number of new cases DVi calculated with the use of Equation (11) and data sets presented in Tables S3 and S4 (multiplied by 100).

Figure 3.
The COVID-19 pandemic waves in the UK (red) and the Republic of Moldova (blue) in 2021 and 2022. “Stars” represent accumulated numbers of laboratory-confirmed cases Vj listed in Tables S5 and S6 (multiplied by 10 for Moldova). “Crosses” show the averaged daily number of new cases DVi (calculated with the use of Equation (11) and JHU data sets listed in Tables S5 and S6; multiplied by 100 for the UK and by 1000 for Moldova).

Figure 4.
The effective reproduction numbers of the COVID-19 pandemic in different countries and worldwide for the period from 1 February to 30 April 2022. Solid lines represent the results of calculations with the use of Equation (13) and τ = 4 days; dashed ones—JHU data sets. Red “dots” show the results of calculations for Poland with the use of Formula (12). Magenta “triangles” represent calculations for the global dynamics using (13) and τ = 3.3872977636047 (see corresponding value in Table 1).


Table 1.
Optimal values of parameters and other characteristics of the COVID-19 pandemic waves in Ukraine, Poland, Germany, and the world.
Table 1.
Optimal values of parameters and other characteristics of the COVID-19 pandemic waves in Ukraine, Poland, Germany, and the world.
| Characteristics | 14th Epidemic Wave in Ukraine, i = 14, [6] | 4th Epidemic Wave in Poland, i = 4, [7] | 5th Epidemic Wave in Germany, i = 5, [7] | 7th Epidemic Wave in the Whole World, i = 7, [6] |
|---|---|---|---|---|
| Time period taken for calculations, Tci | 22 January– 4 February 2022 | 22 November– 5 December 2021 | 22 November– 5 December 2021 | 22 January– 4 February 2022 |
| Ii | 64,676.7037685832 | 182,880.050730977 | 175,036.042911984 | 11,190,879.9375884 |
| Ri | 3,956,648.86765999 | 3,181,514.23498331 | 5,301,466.81423087 | 337,916,505.348126 |
| Ni | 5,678,291.86675200 | 5,410,976 | 10,300,000 | 815,388,678.72 |
| νi | 1,064,719.47680477 | 1,574,583.94143908 | 4,370,737.14176735 | 453,226,448.070179 |
| , [day]−1 | 1.7392861614679 × 10⁻⁷ | 5.96394337877141 × 10⁻⁸ | 6.8098348012594 × 10⁻⁸ | 6.5137543977307 × 10⁻¹⁰ |
| , [day]−1 | 0.185185185185185 | 0.0939072947186539 | 0.297639978951643 | 0.295220576928501 |
| , days | 5.4 | 10.6488 | 3.35976371024561 | 3.38729776360470 |
| ri | 0.998361163644707 | 0.998395644300319 | 0.996581480894305 | 0.999439451877399 |
| 552,746 | 854,850 | 3,186,419 | 359,119,917 | |
| 5,125,546 | 4,556,126 | 7,113,581 | 456,268,762 | |
| Final day of the epidemic wave | December 2023 | September 2025 | April 2023 | April 2085 |
Disclaimer/Publisher’s Note: The statements, opinions and data contained in all publications are solely those of the individual author(s) and contributor(s) and not of MDPI and/or the editor(s). MDPI and/or the editor(s) disclaim responsibility for any injury to people or property resulting from any ideas, methods, instructions or products referred to in the content. |
© 2024 by the authors. Licensee MDPI, Basel, Switzerland. This article is an open access article distributed under the terms and conditions of the Creative Commons Attribution (CC BY) license (https://creativecommons.org/licenses/by/4.0/).
Share and Cite
MDPI and ACS Style
Nesteruk, I.; Brown, P. Impact of Ukrainian Refugees on the COVID-19 Pandemic Dynamics after 24 February 2022. Computation 2024, 12, 70. https://doi.org/10.3390/computation12040070
AMA Style
Nesteruk I, Brown P. Impact of Ukrainian Refugees on the COVID-19 Pandemic Dynamics after 24 February 2022. Computation. 2024; 12(4):70. https://doi.org/10.3390/computation12040070
Chicago/Turabian StyleNesteruk, Igor, and Paul Brown. 2024. "Impact of Ukrainian Refugees on the COVID-19 Pandemic Dynamics after 24 February 2022" Computation 12, no. 4: 70. https://doi.org/10.3390/computation12040070
Note that from the first issue of 2016, this journal uses article numbers instead of page numbers. See further details here.