Abstract
For many climate change impacts such as drought and heat waves, global and national frameworks for climate services are providing ever more critical support to adaptation activities. Coastal zones are especially in need of climate services for adaptation, as they are increasingly threatened by sea level rise and its impacts, such as submergence, flooding, shoreline erosion, salinization and wetland change. In this paper, we examine how annual to multi-decadal sea level projections can be used within coastal climate services (CCS). To this end, we review the current state-of-the art of coastal climate services in the US, Australia and France, and identify lessons learned. More broadly, we also review current barriers in the development of CCS, and identify research and development efforts for overcoming barriers and facilitating their continued growth. The latter includes: (1) research in the field of sea level, coastal and adaptation science and (2) cross-cutting research in the area of user interactions, decision making, propagation of uncertainties and overall service architecture design. We suggest that standard approaches are required to translate relative sea level information into the forms required to inform the wide range of relevant decisions across coastal management, including coastal adaptation.
1. Introduction
The concept of climate services emerged some 15 years ago to support decision-making related to mitigation of and adaptation to climate change [1]. As a general principle, climate services transfer climate information from research to users in order to help users manage and communicate the risks and opportunities of climate variability and change [2,3,4]. The users of climate services span a variety of needs and have differing levels of understanding of scientific information and, crucially, the strengths and limitations of this information in supporting their particular decisions. Users include local, regional, and national government entities, business and industry, beneficiaries of coastal ecosystem services (e.g., fisheries, tourism), transportation providers, and members of the public. Their decisions span a wide spatio-temporal range, further complicating issues for different users and for those providing climate services. Climate services are not limited to the provision of research data and information. Rather, they refer to the translation of climate research into an operational delivery of services in support to adaptation and mitigation of climate change. Such services may be provided on either a fee-paying or a free-of-charge basis. However, a viable economic model involving private or public funding for both the research and it translation is required to ensure their sustainability.
Existing climate services have focused on different thematic areas that vary by region and country: in Europe, they provide essential climate projections relevant for mean and extreme temperatures and precipitation and their impacts, but much less information is made available to support coastal adaptation [5,6,7]. Conversely, in the US, more information is available for relative sea level changes, including subsidence or uplift components [8], because this topic was the focus of a national study published in 1987 [9] and follow-on national studies [10,11,12].
The need for coastal climate services (CCS) is becoming more apparent as coastal stakeholders require support to adapt to global and local sea level rise and increase their resilience to coastal hazards and risks such as flooding, erosion and saline intrusion in estuaries and aquifers (see definitions in Table 1). As sea levels continue to rise, the annual frequency of minor tidal flooding is growing rapidly in frequency in many world regions, such as dozens of U.S. coastal communities [10]. Flooding during extreme events (storm surges and tropical cyclones) will become stronger, shoreline erosion will become more severe, and human interventions more costly [13,14]. In the future, changing sea level is expected to affect economic activities associated with maritime and inland navigation and environmental goods and services upon which many coastal communities rely (e.g., fishing, tourism). Furthermore, because many decisions taken today in coastal zones have implications for decades or more, longer-term information on future sea level rise is required to avoid maladaptation and substantial economic losses. Indeed, sea level will continue to rise for centuries even under low greenhouse gas emissions, as ice sheets and ocean expansion are characterized by long response times [15,16]. Hence, there will be a continuing need for CCS for adaptation that consider future relative sea level rise (including subsidence or land uplift) and associated impacts, even if the ambitious climate goals of the Paris Agreement are met [17]. Furthermore, CCS are required by a large number of private and public stakeholders, with the result that a market for economic activities responding to this demand is emerging [18]. However, these services are often tailored very specifically to the particular hazards, consequences, and other needs of the locality or region implementing adaptation, and do not necessarily identify themselves as climate services. As a consequence, defining CCS and characterizing their users and providers remains challenging.

Table 1.
Terms used in this article and their definitions.
This article addresses the challenge of CCS based on information related to changes in observed and expected future sea levels. So far, this information has been provided primarily in the form of scenarios corresponding to plausible future sea level changes, or projections. These provide future sea level rise (SLR) given assumptions such as social and economic narratives [19], global temperature increase (e.g., 1.5 °C above preindustrial levels) [16], or representative concentration pathways [20,21]. They cover a range of timescales from the next decades to the coming centuries, can be continuous or discrete, and some estimate the related uncertainties. Furthermore, the best available sea level projections also consider regional variability in SLR [8,20,22,23,24,25,26]. Today, an increasing number of regional projections are being produced for specific regions or countries (e.g., northern Europe [27], The Netherlands [28,29], Canada [30], Norway [31]; Australia [32], United States [10,11], etc.). These include specific attention to relevant processes influencing relative sea level in the region of interest (e.g., Global Isostatic Adjustment in the case of Norway). In fact, future sea levels are only a part of the climate information needed for coastal adaptation: climate impacts to the warming of surface ocean waters and changes in ocean acidification [33,34] are especially important to anticipate how ecosystem services will be altered in the future [35]. However, coastal managers currently have limited access to specialised and tailored information on projections of future sea levels [7], and the significance of potential damages and losses motivates a specific study in this area [36,37,38].
This article addresses requirements for effective use of SLR information in coastal climate services (CCS). To do this, we review selected practices. This review leads to the definition of generic characteristics of CCS based on sea level projections to be drawn, in order to ultimately examine how the use of sea level projections in CCS could be improved. Specifically, we address the following questions:
- What is the current state-of-the-art in the area of CCS using SLR projections (Section 2)?
- What are the current technical barriers to satisfying the demand for CCS based on sea level projections (Section 3)?
- What is needed to overcome barriers and to facilitate the use of sea level information in CCS (Section 4)?
In the conclusion, we provide recommendations for stakeholders involved in designing the next generation of climate services.
2. Current Coastal Climate Services Using Sea Level Information
This section examines the state of CCS based on sea level scenarios or projections today. To do so, we start with an analysis of existing CCS (Section 2.1). Then, based on these examples, we provide a generic picture characterizing current CCS, and the different stakeholders involved therein (Section 2.2).
2.1. Examples of Existing Coastal Climate Services
2.1.1. Example 1: USA Coastal Climate Services
The type of flooding events related to SLR range from frequent chronic flooding (also called tidal or nuisance flooding in the literature [10,39,40,41,42]), to rare, event-driven flooding, which occurs in most cases during storms or cyclones. In many places, the frequency of chronic flooding is rapidly increasing in annual frequency (Figure 1a) and accelerating in some coastal towns (Figure 1b) [10,39,43]. Such floods often occur during relatively calm, sunny conditions. These floods adversely affect ground-level and subsurface infrastructure in many U.S. coastal communities (e.g., roadways, storm/waste/fresh-water systems, and private/commercial property) that were not designed for repetitive salt-water exposure or inundation. Until long-term adaptation strategies are put into place, SLR related impacts will be experienced as more-frequent chronic flooding will occur at high-tide (Figure 1c).
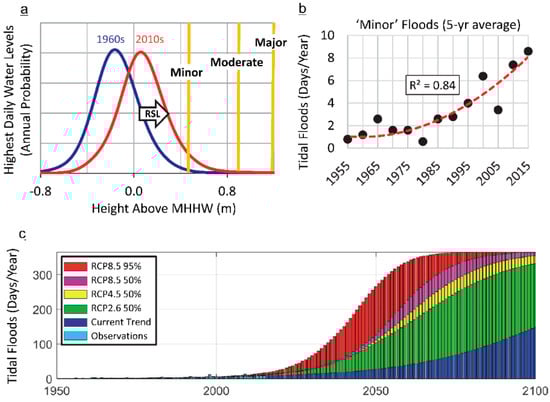
Figure 1.
(a) Multi-year empirical (smoothed) distributions for daily highest water levels in Norfolk, VA, USA, for the 1960s and 2010s, showing extent that local relative sea level (RSL) rise has increased the flood probability relative to impact thresholds defined locally by NOAA’s National Weather Service [50] for minor (~0.5 m: nuisance level), moderate (~0.9 m) and major (~1.2 m: local level of Hurricane Sandy in 2012) impacts, relative to mean higher high water (MHHW) tidal datum of the National Tidal Datum Epoch (1983–2001) and due to RSL rise; (b) annual flood frequencies (based upon 5-year averages) in Norfolk for recurrent tidal floods with minor impacts are accelerating, as shown by the quadratic trend fit (goodness of fit [R2] = 0.84). From Sweet et al. [12]; In (c) are projections of local minor daily floods for Norfolk, VA of Sweet and Park [43] forced by the local SLR trend (navy blue) and those of Kopp et al. [8] based upon representation concentration pathways (RCP). The y-axis in c saturates at 365 days/year with a flood.
In the U.S., the demand by decision makers for information about chronic coastal flooding is mounting: for example, the growing rise in chronic flooding in Norfolk is seen as posing long-term problems due to its cumulative toll and being monitored by credit-rating companies [44]. Afflicted communities are assessing locations and damages associated with chronic flooding and budgeting on an annual basis for anticipated costs required for mobilization of emergency responders to close streets and for temporary installation of pumps, sand bags and storm-water inflow preventers. In the US, such land use and coastal risk management decisions taken at local scale complement the state and federal government coastal planning strategies.
Access to seasonal/annual flood-frequency predictions allows for more effective preparedness and response. As a result, the National Oceanic and Atmospheric Administration (NOAA) has recently provided experimental annual flood predictions that consider past trends, and in some locations, interannual variability with the El Niño Southern Oscillation [45]. This allows for statistical-dynamical tidal-flood [46,47] and sea level anomaly [48] predictions, enabling uses to improve readiness for current and future flooding. These products complement mid- and longer-term climate services such as NOAA’s SLR Viewer web mapping tool [49], that support community decision making around infrastructure plans and designs that consider performance and reliability for local relative SLR up to 100 years in the future.
Several providers of CCS exist in the US, including academic institutions, nongovernmental organizations, and federal government agencies. Each organization acts at a different phases of the disaster management cycle, which include prevention, preparedness, crisis management and recovery, according to the disaster risk reduction terminology [51]. Each phase involves different actions such as: (1) flood monitoring, warning, and near-real-time local hazard mapping to improve preparedness and manage the crisis (role of NOAA); (2) hydrodynamic modelling and long-term hazard mapping to support prevention, preparedness, and recovery (Federal Emergency Management Agency—FEMA) [52]; (3) engineered nonstructural, structural, natural, and nature-based infrastructure adaptation to reduce risks from coastal hazards (US Army Corps of Engineers—USACE) [53,54]; and (4) evaluation of impacts to complex geomorphic systems such as coastal aquifers, shorelines and active coastal zones (US Geological Survey—USGS) [55,56,57]. In many other countries (e.g., France), a similar composite network of organizations is involved in the provision of climate services. From the perspective of this article, these CCS providers can be classified in two groups: those providing information on sea level observations, modelling and analysis, and those using this information to provide information on preparedness and response to coastal impacts (Figure 2).
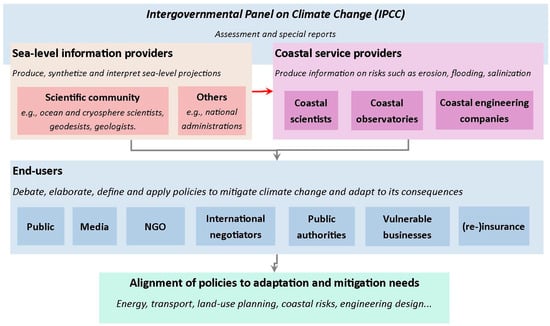
Figure 2.
Current interactions between users and producers of sea level projections. Arrows denote information flows involving sea level projections or derived products.
2.1.2. Example 2: Australian Coastal Climate Services
Similar to the US, coastal planning at national to regional scale in Australia is shared by the federal and the state/territory governments, while local coastal planning and management is primarily the role of local governments under the direction of state policy. Each of the state/territory governments has established different SLR planning guidelines. For example, the state of Victoria has stipulated since 2008 (and reassessed in 2014) that planning authorities must plan for a SLR increase of ‘not less than’ 0.8 m by 2100, whereas in South Australia new developments should take into consideration 0.3 m SLR by 2050 and a further 0.7 m SLR between 2050 and 2100 [58]. To support local council planning and management, CCS in the form of regional sea level projections and their uncertainties up to 2100, including sea level allowances to support coastal defense upgrades, have been developed [32]. These are delivered as a national climate service along with other projected atmospheric and oceanic variables such as temperature, precipitation, wind, ocean and pH [59], but also as a more specific coastal climate service at the scale of individual Australian coastal councils on the ‘CoastAdapt’ web site [60]. In addition to SLR projections and allowances at the coastal council scale, CoastAdapt provides tools such as inundation mapping software, local coastline morphological information, coastal climate adaptation decision support guidance and Australian case studies on coastal adaptation.
2.1.3. Example 3: French Coastal Climate Services
CCS are developing at different paces depending on the region and country or state. Until 2010, the awareness and implementation of coastal adaptation was much more advanced in the UK and the Netherlands than elsewhere in Europe [61], including France, where local coastal risk prevention plans lagged. However, awareness can rise rapidly due to extreme events, as illustrated by the case of the Xynthia storm and surge in France in 2010, which caused more than 50 deaths and significant economic damages on the Atlantic coast [62]. After this event, the French risk prevention regulations were modified to improve coastal hazard maps [63] by defining standards to model coastal processes such as storm surge and wave setup [64] and to consider future SLR. To avoid heterogeneous responses along the coastlines driven by individual municipality selections, the scientific community concerned with SLR was consulted, and a standardized fixed sea level projection of +60 cm by the end of the 21st century was defined and included into the regulation [65]. This resulted in additional constraints on land use planning policies, while stimulating research and development on coastal flood modelling [66]. In addition, non-binding regulatory frameworks were implemented to facilitate land use planning in coastal zones, and the insurance and reinsurance industry is considering the introduction of new insurance products to anticipate and favour adaptation. Despite the real progress in the development of CCS since 2010, there are still concerns due to the limitations of sea level projections currently used, because uncertainties, temporal, regional and local variability are not considered. In this case, SLR projections are essentially used to limit further urbanisation in coastal zones, potentially creating a maladaptation trap in area where sea level will exceed the threshold defined by the regulation [67]. Recently, an additional law for adaptation has been discussed in the parliament to institute construction regulations that consider the expected lifetime of engineered infrastructure together with shoreline change predictions. However, providing shoreline erosion predictions with a sufficient degree of confidence remains a research challenge today. This is illustrative of a situation where the implementation of an adaptation policy is limited by research.
2.1.4. Example 4: Critical Settlements and Infrastructure
Sea level projections beyond 2100 are being developed for critical coastal assets, such as nuclear power plants [68], security infrastructure [11], and critical settlements such as atoll islands or low-lying deltas. However, in many vulnerable areas, long-term issues related to SLR are not considered due to the urgency of other risks, such as cyclones, earthquakes or industrial risks, and also because of institutional, social and economic barriers to their prevention and management [69]. For example, developing countries have large immediate development concerns, which inevitably consume the limited human, technical and financial resources at the expense of multi-decadal to multi-centennial issues. New management initiatives such as the Bangladesh Delta Plan 2100 [70] provide mechanisms to address this issue of balancing temporal scales. To cover all relevant timescales in such vulnerable areas, CCS will also require support from international projects involving international networks of scientists, as well as the strong background knowledge provided by the Intergovernmental Panel on Climate Change (IPCC). More general climate services, considering not only sea level, are based on IPCC results, for instance in the Netherlands by the KNMI [71]. In the UK, national climate projections combine international studies, including research reported in the IPCC, with domestic modeling approaches [72].
2.2. Generic Lessons from These Examples
2.2.1. The Status of Coastal Climate Services
The review has shown that coastal climate services already exist in some places. In the US, several services [49,50] are based on scenarios [9], while others [10,11] have built on the recently released set of sea level projections [8]. In many other countries, unlike other climate services relying on a core service providing essential climate variables such as mean and extreme temperatures, CCS are emerging in a scattered manner linked to local or national coastal management. In all cases, they remain mostly unconnected to the global framework of climate services. The range of examples here demonstrates that a one-size-fits-all approach is not warranted. On the other hand, these case studies enable the identification of common elements of coastal climate services, which could apply on a more global scale. Nevertheless, it can be also noted that the sea level projections considered in these examples are mostly consistent with those published by the IPCC.
2.2.2. The Purpose of Coastal Climate Services
The demand for services based on sea level projections is driven by three main user needs (Table 2; after Titus and Narayan, 1995 [73]):
Table 2.
Coastal climate services based on sea level scenarios or projections.
The third need can be further divided into a range of more specific needs related to adaptation and disaster risk reduction strategies [77]. Global to national level users, for example, require assessments of impacts over varying spatio-temporal scales, in order to stimulate the implementation of adaptation plans or regulations, as in the French example (Row 3a in Table 2). Other users at regional to local scales require services to support preparedness to current sea level and flood hazards (Row 3b in Table 2) and to understand local to regional adaptation needs over multi-decadal timescales [78], including critical infrastructure where relevant [11] (Row 3c in Table 2). The U.S. example shows that coastal researchers and engineers have already partly responded to these needs, for example by providing annual predictions of high-water event frequencies to help budget appropriately in terms of costs of preparedness and crisis management (e.g., road closures, installation of pumps, sandbags, inflow preventers in storm water systems). Finally, Row 3d in Table 2 highlights the emergence of services aiming at evaluating the efficiency of adaptation measures and policies [79]. For example, building dikes to reduce the occurrence of overflow modifies flooding risks at local to regional scale: catastrophic flooding can still occur due to overtopping or breaching of dikes, and applying this measure systematically can result in amplifications of the tidal and surge maxima, ultimately increasing the flooding. Overall, Table 2 illustrates that CCS refer to a wide range of impacts and temporal and spatial scales, especially in the area of adaptation.
2.2.3. Users and Providers of Coastal Climate Services
The examples of Section 2.1 indicate that the climate services involves interactions among users and service providers (illustrated through arrows displaying information flows in Figure 2). This is suggestive of an evolution toward higher technology readiness levels, whereby CCS are entering in a phase of development, according to the research-to-operation scale of Brooks [101]. Figure 2 identifies three groups of users and providers of CCS, who all build upon the IPCC reports, and, when available, other expert groups:
- End-users of CCS, who ultimately benefit from them, and who are in charge of implementing adaptation and mitigation: this refers to a wide range of parties concerned with mitigating climate change and adapting to its consequences, who are generally involved in the process of decision making.
- Sea level information providers, such as the climate science community or government agencies who develop, use and interpret the models evaluating future sea level changes, and ultimately provide of mean and extreme sea level scenarios and projections.
- The coastal service providers, including coastal engineers, and consultants whose expertise is concerned with evaluating coastal hazards, such as coastal flooding, erosion and sedimentation, saline intrusions in estuaries, lagoons and coastal aquifers as well as their impacts on human activities, the environment and the economy. Traditionally, these coastal service providers have provided coastal information to end users. They are users of sea level projections.
2.2.4. The Business Case for Coastal Climate Services
The examples in Section 2.1 show that both public and private sectors are involved in the development of climate services [102]. However, economic activities supplying climate services remain today almost exclusively driven by a public demand (e.g., near-term investments for coastal protection or adaptation to chronic flooding vs. longer-term investments for larger infrastructure or relocation) or by public regulations [18]. Private organizations involved in coastal climate services are responding to this public demand, as in the case of France, where both private and public organization are assessing coastal hazards in support to local regulatory coastal risk prevention plans. Furthermore, despite the variety of the examples presented above, large vulnerable geographic regions are not covered by climate services today. Therefore, incentives and investments will be necessary to accelerate the development of coastal services.
3. Barriers to Coastal Climate Services Using SLR Scenarios or Projections
3.1. Common Barriers in the Development of Climate Services
Common barriers to the uptake of a variety of climate services have been extensively discussed in the literature [3,4,18,102,103,104,105,106]. Table 3 examines the extent to which these common barriers apply to the case of CCS. Among the four barriers identified during the first phase of early design of climate services, only one applies to CCS: as adaptation is now considered an urgent issue, users are requesting an increasing amount of information, which remains in the field of research. Wherever the research community is the only service provider able to respond to the demand while meeting the quality standards, the different time-scales involved in translating research into operations means that adaptation is often lagging behind the expected schedules. While this difficulty appears obvious in the French example (Section 2.1.3), it is not specific to the case of CCS and rather highlights the need to support innovation, as previously noted by Brooks [101].
Table 3.
Barriers to the uptake of CCS (after: Vaughan and Dessai [3]; Brasseur and Gallardo [4]; Cavelier et al. [18], Brooks [101]; Nuseibeh and Easterbrook [103], Cash et al. [104]; Monfray and Bley [105]).
In the second phase of climate services development, called the development phase, a range of barriers pertaining to difficulties in specifying and satisfying service requirements arise. Section 2 has already provided some empirical evidence of these barriers: when attempting to define CCS based on sea level projections, no single framework can be identified. Moreover, as previously noted by Hinkel et al. [7], sea level information provided so far has remained largely centered on science, while barely considering the workflows of users and their usages of sea level information. Overall, these barriers arise due to a lack of communication among stakeholders involved in the design and development of CCS. In the remainder of this section, we thus examine current interactions and information flows among stakeholders of coastal climate services (arrows in Figure 2), in order to identify specific barriers to their further development. Specifically, we successively examine three important barriers in the development phase (see Table 3):
- -
- Lack of formalized requirements from end-users (Section 3.2)
- -
- Lack of formalized requirements from translators of climate information into services (Section 3.3)
- -
- Lack of salient sea level information (Section 3.4)
3.2. Lack of Formalized Requirements from End-Users
Difficulty in specifying end-user needs is a common barrier to the uptake of climate services [101,103]. In the area of SLR, a specific difficulty consists of understanding the extent to which users may accept higher damages than those implied by the likely range [7]. Indeed, knowledge about risk aversion and acceptability levels are difficult to obtain and to communicate [114] and can vary widely between users. Section 2 provided empirical evidence that this specific difficulty has not prevented the development of CCS in practice, as it presents examples where end-users have been able to include sea level information and coastal impact studies in their workflows. For example, coastal impacts studies are commonly used to justify “low-regret” strategies, such as maintaining ecological services and quality in coastal zones [115], relocating some buildings or activities, or to limit further urbanization in low lying or erodible coastal areas [116]. They are also used to anticipate the upgrade of defence works in coastal areas, which will be necessary to control safety levels despite sea level rise, demographic growth and land use pressure [32,36,89,90]. Moreover, other products are emerging: for example, coastal engineers not only design coastal defences that anticipate future upgrades [117], but also perform vulnerability assessments for existing infrastructure, which may have already experienced changing sea levels over a century or more [100].
For all those examples, precise products are defined (e.g., “setback lines”, “sea level allowances”, “elevation thresholds”), which all require knowledge of historic sea levels and SLR scenarios or projections. These examples demonstrate that the hypothesis that CCS systematically lack precise requirements can be rejected. Hence, other information flows in Figure 2 must be considered to explain why CCS emerge too slowly.
3.3. Lack of Formalized Requirements from Translators of Climate Information into Services
To obtain information on coastal impacts of SLR, end-users are turning to traditional coastal service providers such as coastal engineers, geologists, consultants and coastal scientists (upper right block in Figure 2). For these service providers, the main challenge is to choose an appropriate conceptual or physical modelling framework to evaluate coastal hazards, impacts and adaptation over time, in order to respond adequately to the questions raised by end-users. The multiple impacts of sea level rise (inundation/flooding, erosion, salinization, wetland loss and change, etc.) means that such assessments need to be comprehensive and consider a variety adaptation responses [118]. Coastal service providers use a range of approaches to tackle this challenge.
A first approach used by coastal service providers consists of classifying the coastal systems considered according to their vulnerability, instead of focusing on the details of SLR projections [86]. Such classifications translate some simple principles on a map: for example, regardless of the future sea level, eroding sand spits, former wetlands, unconsolidated cliffs and low-lying areas exposed to storms are known to be the most vulnerable areas. Once these simple rules have been identified, elaborating a coastal vulnerability index becomes a classical multi-criteria decision mapping problem [119], involving heterogeneous data regarding the physical and human coastal environment and expert opinion [86,120,121,122,123]. This approach considers rough SLR assumptions only (e.g., 1 m by 2100) and can identify critical areas where avoiding further urbanisation and development or planned retreat should be considered. This qualitative approach is unable to identify exactly when adaptation is required, though it can provide a range of time over which effects may be expected. For complex situations or cases where the consequences are high, more detailed approaches may be required. Hence, its use remains presently limited to assessments and evaluations other than for critical areas (Table 2, 1st Column).
A second approach applied to assess impacts and adaptation uses scenarios or sea level projections with coastal models of varying complexity to quantify possible impacts [88,124,125,126,127]. Hydrodynamic models of floods and salinization assuming constant morphology are reasonably skilful [66,93,128], but coastal evolution morphodynamic models still have limited predictive capabilities over the timescales relevant for decision making on coastal adaptation. Most of them rely on equilibrium profile assumptions, such as the Bruun rule, to model the impacts of SLR [108,109,129,130,131]. While flexible probabilistic modelling approaches for estimating setback lines from erosion are increasingly being developed [106,116,132,133], care is required in interpreting the uncertainties reported in IPCC SLR scenarios, particularly when representing the uncertainties by probability distributions (see Section 3.4.3 below). Similar cautions apply to the calculation of sea level allowances [32,90,91,92]. Furthermore, in many areas where active sediment processes are taking place, changing bathymetries modify coastal hydrodynamic processes and the related flooding hazards [55,134]. Similarly, neither socioeconomic uncertainties nor the impacts of human adaptation are fully addressed in existing modeling frameworks [37]. Because these complex and coupled processes are still poorly represented in integrated coastal impact models, large residual uncertainties remain.
Some end-users are already accustomed to making decisions in a context of uncertainties. However, Table 2 (Column 3) shows that several needs are very demanding for coastal impact models: for example, the decision-making requirement to discriminate between the efficiency of different adaptation strategies will not be satisfied if the different modelling results are dwarfed by the uncertainties of coastal impact models outcomes. Ultimately, these large uncertainties can hinder the ability of CCS providers to meet user needs for specific risk acceptability criteria, and at worst, they may mislead coastal decision-making [7].
We conclude from this subsection that coastal impact models do not always have the capabilities required to satisfy user needs and meet the challenges exposed in the 3rd Column of Table 2. Consequently, relying on providers to interpret user requirements alone is not sufficient. However, this practice remains quite common today as illustrated by the one-way information flow in Figure 2 between sea level and coastal impact information providers. Instead, there are still large research and development efforts to improve current coastal impact models, their use of sea level scenarios or projections, and their use in CCS. Hence, a challenge for CCS will be to promote two-way communication between sea level information providers and coastal service providers to ensure that sea level projections are fit-for-purpose for a larger range of next-user applications.
3.4. Lack of Salient Sea Level Information
3.4.1. Requirements for SLR Information
Both modelling approaches discussed above require sea level products considering the following aspects:
- Regional to local variability of sea level change, including coastal vertical land movement, irrespective of whether they are driven by climate change, tectonic change or direct human interventions, to downscale to local impacts assessments [109].
- Uncertainties, including likely, high-end and low-end scenarios, which are needed to examine impacts and adaptation responses [37,38,90], to test the robustness of adaptation measures, to identify minimum adaptation needs;
- The temporal evolution of sea level, which is important for estimating when to adapt or to define times of emergence for coastal impacts and adaptation needs.
- Most existing sea level scenarios and projections have addressed regional variability and their uncertainties (Section 3.4.2 and Section 3.4.3 below), all following approximately the same methodology (Figure 3). However, much less information is available on temporal evolution (Section 3.4.4 below). Today, such sea level products are either used directly in coastal impact studies, or to define fixed standardized sea level scenarios can be defined by end-users, as is the case in France and some US agencies [53,54].
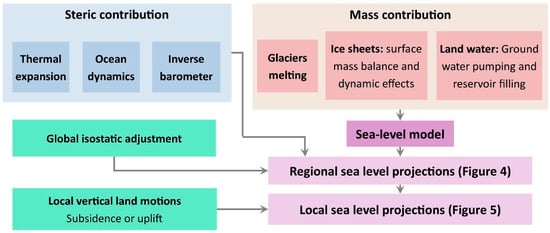 Figure 3. Methodology currently used to produce spatio-temporal sea level projections (Adapted from [23]).
3.4.2. Barriers to Providing Regional to Local Variability of Sea Level Changes
Scenarios and projections accounting for the oceanic, mass exchange and solid earth deformation processes causing regional sea level variability are now widely available [8,20,21,22,23,24,25,26] (Figure 4). However, coastal users in general still lack precise information to convert SLR from global models to a local on-shelf scale, including distortion of the SLR signal on continental shelves [135,136]. Furthermore, while coastal subsidence or uplift cause additional regional to local sea level variability (Figure 5), only the effects of the global isostatic adjustment and the response of the solid Earth to current large scale ice and water mass redistributions are usually included in sea level projections. Other vertical ground motions due to tectonic, volcanic, hydro-sedimentary and ground stability processes are often not available. However, they can have substantial effects at spatial scales ranging from a few meters to entire regions. Pointwise information regarding subsidence is included in the projections of Kopp et al. [8] and the U.S. scenarios of Sweet et al. [12], based on an analysis of tide gauge records. Alternatively, Global Navigation Satellite Systems (GNSS) measurements can be used, where possible, to infer vertical land motion trend rates [11,137]. These pointwise geodetic observations can be insufficient to characterize vertical ground motions where substantial and spatially variable subsidence rates exist [138,139,140]. Furthermore, these approaches assume that subsidence-related trends will persist through 2100, which could be invalidated if human activities are largely the cause of the measured subsidence and these activities cease in the future [140,141,142,143,144,145].
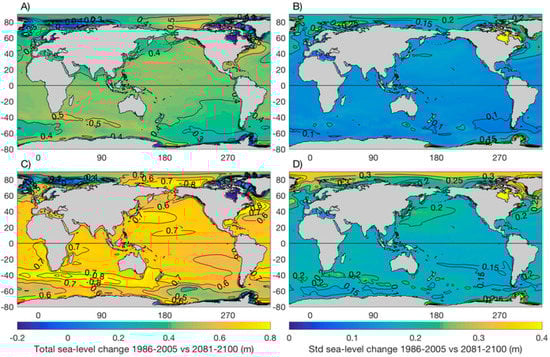
Figure 4.
regional variability of SLR and their uncertainties (1-standard deviation) in the RCP 2.6 (A,B) and RCP 8.5 (C,D) scenarios (data: IPCC AR5 Ch13 [20]).
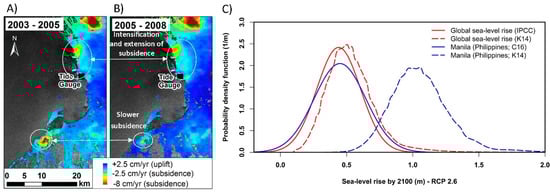
Figure 5.
Vertical ground motions and SLR projections for Manila (The Philippines). (A,B) vertical ground motions estimated by Synthetic Aperture Radar Interferometry (InSAR), probably caused by groundwater extractions in Manila, displaying strong spatial variability and non-linear evolutions in time; (C) probabilistic representations of SLR global mean and near Manila, by 2100 and for the scenario RCP 2.6, based on the IPCC, Carson et al. (C16) [24] and Kopp et al. (K14) [8] data. The probability density functions (PDF) in Manila are slightly flatter than at global scale, reflecting the larger uncertainties caused by the large distance to glacial ice melting sources. Unlike Carson et al., Kopp et al. include a background subsidence estimated from sea level time series, so that the PDF is shifted to the right. However, future vertical ground motion will depend on future groundwater extraction, and is likely to be variable by location, increasing uncertainty. These examples illustrate the type of information coastal service providers need to analyse when designing sea level projections applicable at local scales. Data from IPCC AR5 Ch13 [20], Carson et al. [24], Kopp et al. [8], Raucoules et al. [140].
Figure 5A,B illustrate these issues in the case of Manila (Philippines), which has displayed vertical ground motions of >10 mm/year and net changes of several metres during the 20th Century. In fact, this city is prone to large subsidence due to groundwater withdrawal and/or drainage, similar to other coastal cities built on thick Holocene and Pleistocene deposits and where groundwater extractions exceed the recharge of aquifers [118,145,146]. The ground motion velocity fields shown in Figure 5A,B show that current pointwise measurements (Tide gauge, GPS, Doris) remain spatially too sparse and records too short, so that coastal users would have difficulties to quantify the contribution of vertical ground motions to relative SLR without complementary information from synthetic aperture radar interferometry [138,139,140,144]. This example shows that for subsidence and uplift processes unrelated to climate change, more observations would be extremely beneficial to CCS.
3.4.3. Barriers to Providing Information on Uncertainties of Future Sea Level Change
Before addressing the uncertainties, it is worth noting that even if climate change is mitigated to reach the Paris agreement objectives, sea level will continue rising for millennia [15], and that uncertainties remain about the speed of the process.
Users of sea level scenarios generally account for uncertainties by using several scenarios and assessing the robustness of their results to these scenarios (e.g., [54]). Several studies have attempted to provide coastal users with further details on uncertainties in future sea level projections, either by adjusting probability distributions to the median and likely range provided by the IPCC, or by designing non-parametric methods [8,89,90] (Figure 5C). This exercise is difficult because the processes involved in ice sheet melting are deeply uncertain. In the near future, the uncertainties in sea level projections are likely to be informed by two lines of research:
- -
- Using one or several sets of probabilistic sea level projections, assuming a specific modelling framework for ice sheets. For example, the recent projections by Kopp et al. [147] are based on the modelling assumptions of DeConto and Pollard [148], but other projections could be based on the probabilistic projections of Ritz et al. [149].
- -
- Using sea level projections based on expert judgement of ice sheets contributions to future SLR [150], or combining expert judgement with process-based models [151].
In the first case, deep uncertainties will be reflected by the different distributions resulting from different modelling frameworks. In the latter case, due to the lack of information to define each quantile of any probability distribution, it might not be possible to credibly quantify the precise probability of the tails of the SLR distribution [152]. However, this does not mean there is not useful information on these more extreme changes [100]. This raises the need for other theories of uncertainties able to convey differences among different estimates while minimizing the introduction of arbitrary information in uncertainty representations [153,154]. These latter approaches are complementary to probabilistic descriptions of uncertainties: in some coastal areas, users will require an optimal response to SLR through probabilistic projections [89,155], whereas others will use sea level scenarios or projections conveying minimum or maximum SLR estimates, in order to estimate minimum adaptation needs or to explore high end scenarios1.
As shown by Figure 4B,D the uncertainties of local sea level projections display a regional variability. Furthermore, each source contributing to future SLR has a different probability distribution, with the longest tail probably being due to west Antarctic ice-sheet instability/melting. Due to the regional fingerprints of each contribution to sea level change, the regional probabilistic sea level projection will vary from place to place [8,25,26,156] (Figure 4B,D and Figure 5C). This means that new estimates for each of the contributions will also have different consequences on a regional level.
However, this information has been only made available for coastal users since 2014 (in particular through the supplementary materials of Kopp et al. and of the IPCC report Ch13), thus limiting the number of coastal studies accounting for this spatial variability of uncertainties in SLR projections. From the perspective of coastal service providers, regional probabilistic sea level projections should also account for additional sources of uncertainties due to meso-scale coastal oceanic processes or vertical ground motions. However, existing regional sea level projections only partly take into account these sources of uncertainties, as this type information is often not available. It is made more difficult because the confidence in each term may be different. It is not clear at this time whether users are fully aware of the different uncertainties introduced by the use of projections beyond the uncertainties they are accustomed to dealing with in the scenario approach. This topic deserves further exploration by providers to fully understand how the differences in decisions taken using scenarios vary from those taken based on projections. This is required to be sure that the services do not inadvertently bias decisions makers in a way that increases the potential for adverse impacts.
3.4.4. Barriers to Providing Information on the Temporal Dynamics of Sea Level Changes
Beside the long-term sea level trend, the seasonal, interannual and multidecadal variability superimposed on these trends is of importance. For example, Slangen et al. (this volume, [92]) calculate the change in flooding risk due to the combined effect of sea level trends and variability by using the concept of allowances [89,90]. Users can find information on the temporal variability in the trends in SLR projections in the integrated Data Center of the University of Hamburg, which presents the timeseries of the IPCC AR5 projections [20,24,157]. However, this information only partly includes the meso-scale ocean processes causing interannual to decadal sea level variability such as El Niño lower frequency modes of variability [158,159,160], or interactions between tides and SLR [161,162,163]. Furthermore, vertical land motion (especially subsidence) can be highly non-linear in space and time, and may depend on non-predictable natural or anthropogenic processes such as tectonics or drainage/groundwater extraction [140]. In addition to the efforts to explicitly model these sources of temporal variability in sea level projections (see Section 2.1), coastal service providers have taken into account these processes either by analyzing their impacts on past sea level observations and assuming they will remain unchanged in the future [29,164], or by considering them as an additional source of uncertainty together with other processes causing deviations to a global or regional average [78,111]. While coastal service providers are aware of these issues, many of them require guidance to use these different components, design locally applicable sea level projections, and propagate their uncertainties and temporal dynamics into coastal impacts models. Finally, most sea level projections end in 2100, while as already noted in Table 2 there can be interest in longer-term projections for long-term design and planning issues.
4. Elements for Overcoming Barriers and Facilitating the Use of Sea Level Projections in Coastal Climate Services
4.1. A Framework for Coastal Climate Services
Due to the diversity of stakeholders, user needs and kinds of services required, future work on coastal climate services would greatly benefit from an overarching framework to guide their development. This subsection provides such a framework by extending the general climate service framework of Monfray and Bley (2016) [105] to the case of CCS based on sea level scenarios or projections (Figure 6). The starting point for developing CCS is the demand by user communities for services related to climate, sea level and coastal science. Neither observations and databases available today [137,165,166,167,168,169] nor the existing models and climate services (e.g., CMIP-5 [170], CORDEX [171], solid Earth deformation models [172,173,174,175]) directly respond to this demand. Hence, as in other areas of climate services, there is a need to strengthen the linkages between users and climate, sea level and coastal information providers [105]. In the context of the development of CCS, the scientific community is not only concerned with developing observations and models, but it is also expected to play a major role in the development of the boundary layers that translate climate, sea level and coastal information for users. Here, relevant approaches include building on best practices from the science community (such as the IPCC reports [13,20]) and exemplary case studies that combine both the science of SLR with applications (e.g., Section 2). For example, several countries such as the USA have moved beyond scenarios to planning and implementation for chronic and long-term effects of sea level changes (Section 2.1.1). Figure 6 also identifies boundary areas, which connect user requirements to climate, sea level and coastal science. This transitional layer includes eight topic areas, where applied research is needed, including (1) cross-cutting research (see Section 4.2 below) and (2) topical research in the area of mean and extreme sea level scenarios and projections, biophysical and socioeconomic impacts and adaptation (see Section 3). We argue that removing the barriers identified in Section 3 implies combining efforts in these interdisciplinary and topical research areas.
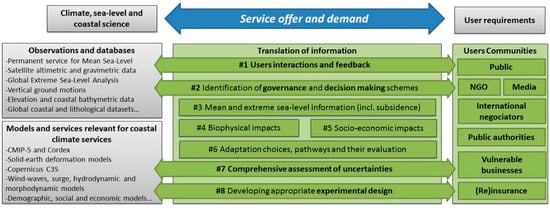
Figure 6.
A framework for developing CCS (after: Monfray and Bley, 2016 [105]). This framework is valid as long as CCS based on sea level scenarios or projections are in a phase of research and development (Table 3).
Importantly, Figure 6 escapes from the simplistic linear top-down model of “providing information to users”, and recognizes the benefits of co-design and co-development between users and researchers, starting with the specific decision and governance context users are facing. A vital component of this is the longer term influence of the user needs on underpinning climate and impact science development.
4.2. Addressing Cross-Cutting Research Needs
Whatever the coastal impact considered, four cross-cutting lines of research can help to bridge the gap between the user demand and coastal and sea level science (Figure 6, shaded green arrows). They include all the disciplines needed to:
- Interact with users appropriately [105,176,177,178,179], in order to progressively settle on CCS meeting their needs.
- Identify where CCS can be mainstreamed into existing decision making frameworks [180,181,182].
- Address uncertainties in a consistent and comprehensive way all along the chain of disciplines involved, taking account of different levels of confidence in uncertainty estimates, and considering not only observations or models, but also users’ differing needs and risk tolerance (following Hinkel et al. [7]).
- Develop appropriate experimental designs for decision support tools, combining all required components of CCS, addressing the challenges identified in the 3rd Column of Table 2, and allowing a comprehensive assessment of uncertainties from all relevant sources, including climate and coastal processes [83,183].
In the previous sections, we have shown that irrespective of the specific needs of end-users, a main concern of coastal service providers is to deliver robust, trusted and understood outputs (see Table 2 and Section 3). This leads to questions such as: are the conclusions suggested by coastal impact modelling experiments robust against the uncertainties in sea level projections and other uncertain parameters incorporated by the model and in agreement with existing data? Are the modelling results sensitive to different and equally appropriate modelling strategies [81,183]? Does the model itself have a bias or imprecision that could jeopardize the robustness of these conclusions? How are the residual uncertainties resulting from incomplete knowledge of the different processes generating coastal risks addressed [184]? If the uncertainties prevent the drawing of robust conclusions, is there a way to reduce them? How is expert judgement incorporated alongside the use of models?
A natural response to such concerns consists of propagating the uncertainties through the chain of models and conducting a sensitivity analysis [185,186]. Here, research is needed to guide users toward coastal modelling schemes that are sufficiently accurate, precise and resolved spatially and temporally to incorporate sea level scenarios or projections and to respond to their needs (Table 2, 3rd Column). At present, coastal impacts models do not always have the required accuracy and precision to meet these challenges [108], except in the case of coastal flood modelling during extreme events, where errors can be reduced to about 10 cm [66]. In the area of coastal evolution and erosion, further research efforts are needed to quantify modelling uncertainties for examples of mixed physical/empirical models able to incorporate precise sea level projections [56,133,187]. Furthermore, detailed salinization impact studies require high-complexity hydrogeological models able to represent groundwater fluxes through heterogeneous geological layers, and all models finally require evolving shorelines and bathymetries as boundary conditions. Finally, uncertainty theories are also useful to understand and model the residual uncertainties of coastal impact models, including those resulting from the high right hand tail of probabilistic sea level projections (see Section 3). This should be accompanied with similar efforts to model the uncertainties of other impact drivers, such as variable and changing waves and surge patterns, and to better understand the differences in decisions resulting from scenarios and those resulting from projections. Such research focused on the overall architecture of the experimental design can greatly benefit from existing frameworks developed at various scales [36,126,127].
4.3. Sustaining Public Finance and Developing Viable Private Business Model
When new services are supplied, a key question remains as to whether and how public demand can be satisfied before private demand has developed [101]. Presently, CCS are primarily demanded publicly, through research funding and public tenders, by agencies involved in government investments, by regulatory and permit requirements, or as terms in calls for tenders (Section 2). However, the demand is expected to grow as industries seek to assess their exposure to risk in response to the recommendations of the Task Force for Financial Disclosure [188] and as the Paris Agreement includes a strong adaptation focus. In developing countries such as small island developing states, CCS are increasingly supported by organizations such as the multilateral funds under the UNFCCC (e.g., the Green Climate Fund) and other national funds, donor organizations and the finance community concerned with the adaptation finance gap [189]. A prerequisite for sustaining and enhancing these financial flows is to identify viable business models for CCS in vulnerable developing countries that do not depend on public funding only.
4.4. Guidance and Capacity Building for Developing Countries
The information conveyed through IPCC reports is critically needed for the uptake of local CCS, especially in developing countries. They often constitute the most credible scientific reference for many end-users, but suffer from the major problem that new science emerges between reports, and waiting for the next round of IPCC assessment might lead to the most appropriate science being omitted from planning. At present the IPCC TGICA group (Task Group on Data and Scenario Support for Impact and Climate Analysis) provides some guidance on the use of IPCC scenarios. However, there is a need for guidance to be developed more closely with the working groups that develop the scenarios with more focus on the limitation of the scenarios and updating of guidance that is more closely tied to the time-scales of the major assessment reports. This could include improved access to datasets and tools for processing and extracting the relevant regional data. Additionally, there is a need to look to other initiatives, including the global framework on climate services [2] to combine IPCC information with that from other more frequently updated information. Together these can help users to conduct local coastal risks analysis and develop their own CCS.
5. Conclusions
Over the coming decade, climate services, supporting adaptation to and mitigation of climate change, are expected to become a viable market, driven by near-term user needs, by regulations, and by bi-and multilateral development institutes and financial mechanisms to support adaptation such us those established under the UNFCCC. Coastal zones are hotspots of climate change impacts, so that climate services will be increasingly needed to support adaptation. From this perspective, it seems important to identify how relevant information such as sea level scenarios or projections can be included in CCS. Given this context, this paper has provided preliminary answers to the following three questions:
- What is the current state of the art in the area of coastal climate services using SLR scenarios or projections? Section 2 has shown that there are some examples of early CCS based on SLR scenarios. The demand for these CCS is driven by decision makers interested in investments in coastal risk prevention and adaptation in the near-term future, by regulations and calls for tenders of international organisations addressing longer term issues, and, finally, by the demand of public and private decision makers concerned with critical infrastructure or settlements. However, there is large thematic and geographical diversity in the demanded CCS based on sea level projections. At least in Europe, this diversity explains why the development of coastal climate services is lagging behind those developments in other sectors. Overall, we find that CCS are emerging too slowly to meet the diversity of challenges posed by coastal climate change impacts, but there are already viable business models in place in some countries such as the USA and France.
- What are the current technical barriers to satisfying the demand for coastal climate services based on sea level scenarios or projections? Section 3 has identified two sets of barriers. The first one pertains to topical research needs, in order to increase confidence in coastal impact models and to respond to user’s needs for sea level information; the latter includes sea level projections considering near-term (seasonal to decadal) and long term (beyond 2100) timescales, local to regional vertical ground motions, as well as the description (and reduction) of the related uncertainties. The second one pertains to barriers at the interface between sea level and coastal information providers: indeed, there are large gaps between what sea level science is able to provide (probabilistic, regional and time-evolving SLR projections often focusing on the open ocean) and methods of traditional coastal services providers (detailed flood or hydrodynamic modeling, probabilistic sizing of coastal defenses). We suggest that these difficulties prevent the integration of different components of CCS in a way that satisfies end user’s needs. Hence, we argue that besides disciplinary research needs, what is lacking today is an accepted common methodology to elaborate CCS for adaptation.
- What is needed to overcome barriers and to facilitate the use of sea level information in coastal climate services? To overcome barriers identified in Section 3, we recommend defining a global framework for CCS. Section 4 proposes an integrated framework involving all stakeholders concerned with developing CCS. This framework addresses: (1) cross-cutting issues such as user interactions, decision making frameworks, uncertainties and overall architecture of the services to be developed; and (2) topical research on sea level science, coastal hydrodynamics, morphodynamics, biology, demography and economy, to ensure that current coastal modeling tools are able to include sea level rise information adequately. This framework could be useful to establish standards in the area of coastal climate services supporting adaptation to and mitigation of climate change.
Acknowledgments
This paper is a contribution to the Grand Challenge “Regional Sea level changes and coastal impacts” of the World Climate Research Programme (WCRP-GC). G.L.C., J.H. and R.v.d.W. acknowledge funding from the ERANET ERA4CS (INSeaPTION project). K.L.M. acknowledges funding from the NESP Earth Systems and Climate Change Hub. We thank all members of the WCRP GC, especially Detlef Stammer and Jonathan Gregory, for insightful discussions. We thank Daniel Raucoules for help in preparing Figure 5 and Olivier Douez for advice on coastal aquifer salinization. We thank Robert Kopp and Mark Carson for making their data available. These data are used to plot Figure 5C. Finally, we thank the two reviewers whose insightful comments led to significant improvements on this article. The scientific results and conclusions, as well as any views or opinions expressed herein, are those of the author(s) and do not necessarily reflect the views of USACE, NOAA or the Department of Commerce.
Author Contributions
This paper was drafted by G.L.C. and all authors based on contributions, meetings and exchanges of the WCRP GC (Work Package 5), led by R.J.N. K.L.M. and G.L.C. and involving J.H., R.S.W.V.d.W., K.D.W. and others. R.J.N. provided feedback on CCS development at the international and country levels. J.H. and G.L.C. proposed a common framework for CCS. W.V.S. and K.D.W. provided the US example. W.V.S. provided Figure 1. K.L.M. provided the Australian examples and insight into uncertainties. R.S.W.V.d.W. and A.B.A.S. provided knowledge of current sea level rise projections and their use. A.B.A.S. provided Figure 4. J.A.L. provided background regarding IPCC guidance, the global framework for climate services and UK examples. All authors wrote the final version of this article.
Conflicts of Interest
The authors declare no conflict of interest.
References
- National Research Council of the National Academies (NRC); Board on Atmospheric Sciences and Climate. A Climate Services Vision: First Steps Toward the Future; The National Academies Press: Washington, DC, USA, 2001. [Google Scholar]
- Hewitt, C.; Mason, S.; Walland, D. Commentary: The global framework for climate services. Nat. Clim. Chang. 2012, 2, 831–832. [Google Scholar] [CrossRef]
- Vaughan, C.; Dessai, S. Climate services for society: Origins, institutional arrangements, and design elements for an evaluation framework. Wiley Interdiscip. Rev.-Clim. Chang. 2014, 5, 587–603. [Google Scholar] [CrossRef] [PubMed]
- Brasseur, G.P.; Gallardo, L. Climate services: Lessons learned and future prospects. Earths Future 2016, 4, 79–89. [Google Scholar] [CrossRef]
- Lémond, J.; Dandin, P.; Planton, S.; Vautard, R.; Pagé, C.; Déqué, M.; Moisselin, J.M. DRIAS: A step toward Climate Services in France. Adv. Sci. Res. 2011, 6, 179–186. [Google Scholar] [CrossRef]
- Kjellstrom, E.; Nikulin, G.; Hansson, U.; Strandberg, G.; Ullerstig, A. 21st century changes in the european climate: Uncertainties derived from an ensemble of regional climate model simulations. Tellus Ser. Dyn. Meteorol. Oceanogr. 2011, 63, 24–40. [Google Scholar] [CrossRef]
- Hinkel, J.; Jaeger, C.; Nicholls, R.J.; Lowe, J.; Renn, O.; Shi, P.J. Sea-level rise scenarios and coastal risk management. Nat. Clim. Chang. 2015, 5, 188–190. [Google Scholar] [CrossRef]
- Kopp, R.E.; Horton, R.M.; Little, C.M.; Mitrovica, J.X.; Oppenheimer, M.; Rasmussen, D.J.; Strauss, B.H.; Tebaldi, C. Probabilistic 21st and 22nd century sea-level projections at a global network of tide-gauge sites. Earths Future 2014, 2, 383–406. [Google Scholar] [CrossRef]
- National Research Council; Committee on Engineering Implications of Changes in Relative Mean Sea Level; Marine Board; Commission on Engineering and Technical Systems. Responding to Changes in Sea Level, Engineering Implications; National Academy Press: Washington, DC, USA, 1987; Available online: http://www.nap.edu/catalog.php?record_id=1006 (accessed on 10 October 2017).
- Sweet, W.; Park, J.; Marra, J.; Zervas, C.; Gill, S. Sea-Level Rise and Nuisance Flood Frequency Changes around the United States. National Oceanic and Atmospheric Administration. NOAA Technical Report NOS CO-OPS 073, 2014. Available online: https://tidesandcurrents.noaa.gov/publications/NOAA_Technical_Report_NOS_COOPS_073.pdf (accessed on 4 May 2017).
- Hall, J.A.; Gill, S.; Obeysekera, J.; Sweet, W.; Knuuti, K.; Marburger, J. Regional Sea Level Scenarios for Coastal Risk Management: Managing the Uncertainty of Future Sea Level Change and Extreme Water Levels for Department of Defense Coastal Sites Worldwide. U.S. Department of Defense, Strategic Environmental Research and Development Program, 2016; 224p. Available online: https://www.serdp-estcp.org/content/download/38961/375873/version/4/file/CARSWG+SLR+April+2016.pdf (accessed on 4 May 2017).
- Sweet, W.V.; Kopp, R.E.; Weaver, C.P.; Obeysekera, J.; Thieler, E.R.; Zervas, C. Global and Regional Sea Level Scenarios for the United States. NOAA Technical Report NOS CO-OPS 083, 2017. Available online: https://tidesandcurrents.noaa.gov/publications/techrpt83_Global_and_Regional_SLR_Scenarios_for_the_US_final.pdf (accessed on 4 May 2017).
- Wong, P.P.; Losada, I.J.; Gattuso, J.-P.; Hinkel, J.; Khattabi, A.; McInnes, K.L.; Saito, Y.; Sallenger, A. Coastal systems and low-lying areas. In Climate Change 2014: Impacts, Adaptation, and Vulnerability; Part A: Global and Sectoral Aspects. Contribution of Working Group II to the Fifth Assessment Report of the Intergovernmental Panel on Climate Change; Field, B.C., Barros, V.R., Dokken, D.J., Mach, K.J., Mastrandrea, M.D., Bilir, T.E., Chatterjee, M., Ebi, K.L., Estrada, Y.O., Genova, R.C., et al., Eds.; Cambridge University Press: Cambridge, UK; New York, NY, USA, 2014; pp. 361–409. [Google Scholar]
- Vitousek, S.; Barnard, P.L.; Fletcher, C.H.; Frazer, N.; Erikson, L.; Storlazzi, C.D. Doubling of coastal flooding frequency within decades due to sea-level rise. Sci. Rep. 2017, 7, 1399. [Google Scholar] [CrossRef] [PubMed]
- Clark, P.U.; Shakun, J.D.; Marcott, S.A.; Mix, A.C.; Eby, M.; Kulp, S.; Levermann, A.; Milne, G.A.; Pfister, P.L.; Santer, B.D.; et al. Consequences of twenty-first-century policy for multi-millennial climate and sea-level change. Nat. Clim. Chang. 2016, 6, 360–369. [Google Scholar] [CrossRef]
- Lissner, T.K.; Fischer, E.M. Differential climate impacts for policy-relevant limits to global warming: The case of 1.5 °C and 2 °C. Earth Syst. Dyn. 2016, 7, 327–351. [Google Scholar]
- United Nations Framework Convention on Climate Change (UNFCCC). Available online: http://unfccc.int/paris_agreement/items/9485.php (accessed on 4 May 2017).
- Cavelier, R.; Borel, C.; Chareyron, V.; Chaussade, M.; Le Cozannet, G.; Morin, D.; Ritti, D. Condition for a market uptake of climate services for adaptation in France. Clim. Serv. 2017, 6, 34–40. [Google Scholar] [CrossRef]
- Meehl, G.A.; Stocker, T.F.; Collins, W.D.; Friedlingstein, P.; Gaye, A.T.; Gregory, J.M.; Kitoh, A.; Knutti, R.; Murphy, J.M.; Noda, A.; et al. 2007: Global Climate Projections. In Climate Change 2007: The Physical Science Basis; Contribution of Working Group I to the Fourth Assessment Report of the Intergovernmental Panel on Climate Change; Solomon, S., Qin, D., Manning, M., Chen, Z., Marquis, M., Averyt, K.B., Tignor, M., Miller, H.L., Eds.; Cambridge University Press: Cambridge, UK; New York, NY, USA, 2007. [Google Scholar]
- Church, J.A.; Clark, P.U.; Cazenave, A.; Gregory, J.M.; Jevrejeva, S.; Levermann, A.; Merrifield, M.A.; Milne, G.A.; Nerem, R.S.; Nunn, P.D.; et al. Sea Level Change. In Climate Change 2013: The Physical Science Basis; Contribution of Working Group I to the Fifth Assessment Report of the Intergovernmental Panel on Climate Change; Stocker, T.F., Qin, D., Plattner, G.-K., Tignor, M., Allen, S.K., Boschung, J., Nauels, A., Xia, Y., Bex, V., Midgley, P.M., Eds.; Cambridge University Press: Cambridge, UK; New York, NY, USA, 2013; pp. 1137–1216. [Google Scholar]
- Mengel, M.; Levermann, A.; Frieler, K.; Robinson, A.; Marzeion, B.; Winkelmann, R. Future sea level rise constrained by observations and long-term commitment. Proc. Natl. Acad. Sci. USA 2016, 113, 2597–2602. [Google Scholar] [CrossRef] [PubMed]
- Slangen, A.B.A.; Carson, M.; Katsman, C.A.; van de Wal, R.S.W.; Kohl, A.; Vermeersen, L.L.A.; Stammer, D. Projecting twenty-first century regional sea-level changes. Clim. Chang. 2014, 124, 317–332. [Google Scholar] [CrossRef]
- Slangen, A.B.A.; Katsman, C.A.; van de Wal, R.S.W.; Vermeersen, L.L.A.; Riva, R.E.M. Towards regional projections of twenty-first century sea-level change based on ipcc sres scenarios. Clim. Dyn. 2012, 38, 1191–1209. [Google Scholar] [CrossRef]
- Carson, M.; Kohl, A.; Stammer, D.; Slangen, A.B.A.; Katsman, C.A.; van de Wal, R.S.W.; Church, J.; White, N. Coastal sea level changes, observed and projected during the 20th and 21st century. Clim. Chang. 2016, 134, 269–281. [Google Scholar] [CrossRef]
- Perrette, M.; Landerer, F.; Riva, R.; Frieler, K.; Meinshausen, M. A scaling approach to project regional sea level rise and its uncertainties. Earth Syst. Dyn. 2013, 4, 11–29. [Google Scholar] [CrossRef]
- Jackson, L.P.; Jevrejeva, S. A probabilistic approach to 21st century regional sea-level projections using rcp and high-end scenarios. Glob. Planet. Chang. 2016, 146, 179–189. [Google Scholar] [CrossRef]
- Grinsted, A.; Jevrejeva, S.; Riva, R.E.M.; Dahl-Jensen, D. Sea level rise projections for northern europe under rcp8.5. Clim. Res. 2015, 64, 15–23. [Google Scholar] [CrossRef]
- Katsman, C.A.; Sterl, A.; Beersma, J.J.; van den Brink, H.W.; Church, J.A.; Hazeleger, W.; Kopp, R.E.; Kroon, D.; Kwadijk, J.; Lammersen, R.; et al. Exploring high-end scenarios for local sea level rise to develop flood protection strategies for a low-lying delta-the netherlands as an example. Clim. Chang. 2011, 109, 617–645. [Google Scholar] [CrossRef]
- De Vries, H.; Katsman, C.; Drijfhout, S. Constructing scenarios of regional sea level change using global temperature pathways. Environ. Res. Lett. 2014, 9. [Google Scholar] [CrossRef]
- Han, G.Q.; Ma, Z.M.; Chen, N.; Thomson, R.; Slangen, A. Changes in mean relative sea level around Canada in the twentieth and twenty-first centuries. Atmos.-Ocean 2015, 53, 452–463. [Google Scholar] [CrossRef]
- Simpson, M.J.R.; Nilsen, J.E.Ø.; Ravndal, O.R.; Breili, K.; Sande, H.; Kierulf, H.P.; Steffen, H.; Jansen, E.; Carson, M.; Vestøl, O. Sea-level change for Norway. NCCS report n°1/2015, 2015. Available online: http://www.miljodirektoratet.no/Documents/publikasjoner/M405/M405.pdf (accessed on 4 May 2017).
- McInnes, K.L.; Church, J.A.; Monselesan, D.; Hunter, J.R.; O’Grady, J.G.; Haigh, I.D.; Zhang, X. Sea-level Rise Projections for Australia: Information for Impact and Adaptation Planning. Aust. Meteorol. Oceanogr. J. 2015, 65, 127–149. [Google Scholar] [CrossRef]
- Bates, N.R.; Astor, Y.M.; Church, M.J.; Currie, K.; Dore, J.E.; González-Dávila, M.; Lorenzoni, L.; Muller-Karger, F.; Olafsson, J.; Santana-Casiano, J.M. A time-series view of changing ocean chemistry due to ocean uptake of anthropogenic CO2 and ocean acidification. Oceanography 2014, 27, 126–141. [Google Scholar] [CrossRef]
- Mathis, J.T.; Cross, J.N.; Evans, W.; Doney, S.C. 2015: Ocean acidification in the surface waters of the Pacific–Arctic boundary regions. Oceanography 2015, 28, 122–135. [Google Scholar] [CrossRef]
- Gattuso, J.P.; Magnan, A.; Bille, R.; Cheung, W.W.L.; Howes, E.L.; Joos, F.; Hoegh-Guldberg, O.; Kelly, P.; Pörtner, P.H.-O.; Rogers, A.D.; et al. Contrasting futures for ocean and society from different anthropogenic CO2 emissions scenarios. Science 2015, 349. [Google Scholar] [CrossRef] [PubMed]
- Hallegatte, S.; Green, C.; Nicholls, R.J.; Corfee-Morlot, J. Future flood losses in major coastal cities. Nat. Clim. Chang. 2013, 3, 802–806. [Google Scholar] [CrossRef]
- Hinkel, J.; Lincke, D.; Vafeidis, A.T.; Perrette, M.; Nicholls, R.J.; Tol, R.S.J.; Marzeion, B.; Fettweis, X.; Ionescu, C.; Levermann, A. Coastal flood damage and adaptation costs under 21st century sea-level rise. Proc. Natl. Acad. Sci. USA 2014, 111, 3292–3297. [Google Scholar] [CrossRef] [PubMed]
- Hinkel, J.; Nicholls, R.J.; Tol, R.S.J.; Wang, Z.B.; Hamilton, J.M.; Boot, G.; Vafeidis, A.T.; McFadden, L.; Ganopolski, A.; Klein, R.J.T. A global analysis of erosion of sandy beaches and sea-level rise: An application of diva. Glob. Planet. Chang. 2013, 111, 150–158. [Google Scholar] [CrossRef]
- Moftakhari, H.R.; AghaKouchak, A.; Sanders, B.F.; Feldman, D.L.; Sweet, W.; Matthew, R.A.; Luke, A. Increased nuisance flooding along the coasts of the united states due to sea level rise: Past and future. Geophys. Res. Lett. 2015, 42, 9846–9852. [Google Scholar] [CrossRef]
- Moftakhari, H.R.; AghaKouchak, A.; Sanders, B.F.; Matthew, R.A. Cumulative hazard: The case of nuisance flooding. Earths Future 2017, 5, 214–223. [Google Scholar] [CrossRef]
- Dahl, K.A.; Fitzpatrick, M.F.; Spanger-Siegfried, E. Sea level rise drives increased tidal flooding frequency at tide gauges along the us east and gulf coasts: Projections for 2030 and 2045. PLoS ONE 2017, 12. [Google Scholar] [CrossRef] [PubMed]
- Ezer, T.; Atkinson, L.P. Accelerated flooding along the us east coast: On the impact of sea-level rise, tides, storms, the gulf stream, and the north atlantic oscillations. Earths Future 2014, 2, 362–382. [Google Scholar] [CrossRef]
- Sweet, W.V.; Park, J. From the extreme to the mean: Acceleration and tipping points of coastal inundation from sea level rise. Earths Future 2014, 2, 579–600. [Google Scholar] [CrossRef]
- Moodys’ Flood Risk in Coastal Virginia. Available online: https://www.moodys.com/research/Moodys-Flood-risk-in-coastal-Virginia-supports-need-for-proactive--PR_328282 (accessed on 4 May 2017).
- ENSO Forecasts at the International Research Institute of the University of Columbia. Available online: http://iri.columbia.edu/our-expertise/climate/forecasts/enso/current (accessed on 4 May 2017).
- Sweet, W.V.; Marra, J.J. 2014 State of Nuisance Tidal Flooding, 2015. Available online: http://www.noaanews.noaa.gov/stories2015/2014%20State%20of%20Nuisance%20Tidal%20Flooding.pdf (accessed on 4 May 2017).
- Sweet, W.V.; Marra, J.J. 2016: 2015 State of Nuisance Tidal Flooding, 2016. Available online: https://www.ncdc.noaa.gov/monitoring-content/sotc/national/2016/may/sweet-marra-nuisance-flooding-2015.pdf (accessed on 4 May 2017).
- Widlansky, M.J.; Marra, J.J.; Chowdhury, M.R.; Stephens, S.A.; Miles, E.R.; Fauchereau, N.; Spillmanf, C.M.; Smithf, G.; Beardf, G.; Wells, J. Multi-model ensemble sea level forecasts for tropical Pacific islands. J. Appl. Meteorol. Climatol. 2017. [Google Scholar] [CrossRef]
- NOAA Sea Level Rise Viewer Web Mapping Tool. Available online: https://coast.noaa.gov/slr (accessed on 4 May 2017).
- NOAA’s National Weather Service. Available online: http://water.weather.gov/ahps (accessed on 4 May 2017).
- Disaster Risk Reduction Terminology. Available online: https://www.unisdr.org/we/inform/terminology (accessed on 27 August 2017).
- Federal Emergency Management Agency (FEMA). Projected Impact of Relative SLR on the National Flood Insurance Program; FEMA: Washington, DC, USA, 1991.
- USACE. Engineer Regulation 1100-2-8162, Incorporating Sea Level Change in Civil Works Programs. Department of the Army, U.S. Army Corps of Engineers: Washington, DC, USA, 2013. Available online: http://www.publications.usace.army.mil/Portals/76/Publications/EngineerRegulations/ER_1100-2-8162.pdf (accessed on 4 May 2017).
- U.S. Army Corps of Engineers (USACE). Engineer Technical Letter 1100-2-1, Procedures to Evaluate Sea Level Change: Impacts, Responses, and Adaptation. Department of the Army, U.S. Army Corps of Engineers: Washington, DC, USA, 2014. Available online: http://www.publications.usace.army.mil/Portals/76/Publications/EngineerRegulations/ER_1100-2-8162.pdf (accessed on 4 May 2017).
- Lentz, E.E.; Thieler, E.R.; Plant, N.G.; Stippa, S.R.; Horton, R.M.; Gesch, D.B. Evaluation of dynamic coastal response to sea-level rise modifies inundation likelihood. Nat. Clim. Chang. 2016, 6, 696–700. [Google Scholar] [CrossRef]
- Gutierrez, B.T.; Plant, N.G.; Thieler, E.R. A bayesian network to predict coastal vulnerability to sea level rise. J. Geophys. Res.-Earth Surf. 2011, 116. [Google Scholar] [CrossRef]
- Masterson, J.P.; Fienen, M.N.; Thieler, E.R.; Gesch, D.B.; Gutierrez, B.T.; Plant, N.G. Effects of sea-level rise on barrier island groundwater system dynamics—Ecohydrological implications. Ecohydrology 2014, 7, 1064–1071. [Google Scholar] [CrossRef]
- Good, M. Government Coastal Planning to Rising Sea Levels. Technical Report, 2011. Available online: http://acecrc.org.au/wp-content/uploads/2015/03/TR-Government-Coastal-Planning-Responses-to-Rising-Sea-Levels.pdf (accessed on 4 May 2017).
- Climate Change in Australia. Available online: https://www.climatechangeinaustralia.gov.au/en/ (accessed on 4 May 2017).
- CoastAdapt. Available online: https://coastadapt.com.au/ (accessed on 4 May 2017).
- Tol, R.S.J.; Klein, R.J.T.; Nicholls, R.J. Towards successful adaptation to sea-level rise along europe’s coasts. J. Coast. Res. 2008, 24, 432–442. [Google Scholar] [CrossRef]
- Przyluski, V.; Hallegatte, S. Gestion des Risques Naturels: Leçons de la Tempête Xynthia; Editions Quae: Versailles, France, 2013. [Google Scholar]
- Deboudt, P. Towards coastal risk management in france. Ocean Coast. Manag. 2010, 53, 366–378. [Google Scholar] [CrossRef]
- Stockdon, H.F.; Holman, R.A.; Howd, P.A.; Sallenger, A.H. Empirical parameterization of setup, swash, and runup. Coast. Eng. 2006, 53, 573–588. [Google Scholar] [CrossRef]
- Ministère de L’Ecologie, du Développement Durable, des Transports et du Logement (MEDDTL). Circulaire du 27 Juillet 2011 Relative à la Prise en Compte du Risque de Submersion Marine Dans les Plans de Prévention des Risques Naturels Littoraux, 2011. Available online: http://www.bulletin-officiel.developpement-durable.gouv.fr/fiches/BO201115/met_20110015_0100_0021.pdf (accessed on 4 May 2017).
- Le Roy, S.; Pedreros, R.; Andre, C.; Paris, F.; Lecacheux, S.; Marche, F.; Vinchon, C. Coastal flooding of urban areas by overtopping: Dynamic modelling application to the johanna storm (2008) in gavres (france). Nat. Hazards Earth Syst. Sci. 2015, 15, 2497–2510. [Google Scholar] [CrossRef]
- Magnan, A.K.; Schipper, E.L.F.; Burkett, M.; Bharwani, S.; Burton, I.; Eriksen, S.; Gemenne, F.; Schaar, J.; Ziervogel, G. Addressing the risk of maladaptation to climate change. Wiley Interdiscip. Rev.-Clim. Chang. 2016, 7, 646–665. [Google Scholar] [CrossRef]
- Wilby, R.L.; Nicholls, R.J.; Warren, R.; Wheater, H.S.; Clarke, D.; Dawson, R.J. Keeping nuclear and other coastal sites safe from climate change. Proc. Inst. Civ. Eng.-Civ. Eng. 2011, 164, 129–136. [Google Scholar] [CrossRef]
- Conway, D.; Mustelin, J. Strategies for improving adaptation practice in developing countries. Nat. Clim. Chang. 2014, 4, 339–342. [Google Scholar] [CrossRef]
- Bengladesh Delta Plan 2100. Available online: http://www.bangladeshdeltaplan2100.org/ (accessed on 29 August 2017).
- Van den Hurk, B.; van Oldenborgh, G.J.; Lenderink, G.; Hazeleger, W.; Haarsma, R.; de Vries, H. Drivers of mean climate change around the netherlands derived from cmip5. Clim. Dyn. 2014, 42, 1683–1697. [Google Scholar] [CrossRef]
- UK Climate Reports Projections. Available online: http://ukclimateprojections.metoffice.gov.uk/21678 (accessed on 4 May 2017).
- Titus, J.G.; Narayanan, V.K. The Probability of Sea Level Rise; US Environmental Protection Agency: Washington, DC, USA; Office of Policy, Planning, and Evaluation: Bethesda, MD, USA; Climate Change Division, Adaptation Branch: Washington, DC, USA, 1995; Volume 95.
- Nicholls, R.J.; Lowe, J.A. Benefits of mitigation of climate change for coastal areas. Glob. Environ. Chang.-Hum. Policy Dimens. 2004, 14, 229–244. [Google Scholar] [CrossRef]
- Rahmstorf, S. A semi-empirical approach to projecting future sea-level rise. Science 2007, 315, 368–370. [Google Scholar] [CrossRef] [PubMed]
- Hansen, J.; Sato, M.; Hearty, P.; Ruedy, R.; Kelley, M.; Masson-Delmotte, V.; Russell, G.; Tselioudis, G.; Cao, J.J.; Rignot, E.; et al. Ice melt, sea level rise and superstorms: Evidence from paleoclimate data, climate modeling, and modern observations that 2 a degrees c global warming could be dangerous. Atmos. Chem. Phys. 2016, 16, 3761–3812. [Google Scholar] [CrossRef]
- Romieu, E.; Welle, T.; Schneiderbauer, S.; Pelling, M.; Vinchon, C. Vulnerability assessment within climate change and natural hazard contexts: Revealing gaps and synergies through coastal applications. Sustain. Sci. 2010, 5, 159–170. [Google Scholar] [CrossRef]
- Nicholls, R.J.; Hanson, S.E.; Lowe, J.A.; Warrick, R.A.; Lu, X.F.; Long, A.J. Sea-level scenarios for evaluating coastal impacts. Wiley Interdiscip. Rev.-Clim. Chang. 2014, 5, 129–150. [Google Scholar] [CrossRef]
- Hallegatte, S. Strategies to adapt to an uncertain climate change. Glob. Environ. Chang. 2009, 19, 240–247. [Google Scholar] [CrossRef]
- Hoffman, J.S.; Keyes, D.L.; Titus, J.G. Projecting Future Sea Level Rise: Methodology, Estimates to the Year 2100, and Research Needs; Strategic Studies Staff, Office of Policy Analysis: Washington, DC, USA; Office of Policy and Resource Management: Washington, DC, USA; US Environmental Protection Agency: Washington, DC, USA, 1983.
- Bilskie, M.V.; Hagen, S.C.; Alizad, K.; Medeiros, S.C.; Passeri, D.L.; Needham, H.F.; Cox, A. Dynamic simulation and numerical analysis of hurricane storm surge under sea level rise with geomorphologic changes along the northern gulf of mexico. Earths Future 2016, 4, 177–193. [Google Scholar] [CrossRef]
- Smith, M.D.; Murray, A.B.; Gopalakrishnan, S.; Keeler, A.G.; Landry, C.E.; McNamara, D.; Moore, L.J. Geoengineering Coastlines? From Accidental to Intentional; From Accidental to Intentional (June 2014); Duke Environmental and Energy Economics Working Paper EE, 14-02; Elsevier: Amsterdam, The Netherlands, 2014. [Google Scholar]
- Le Cozannet, G.; Rohmer, J.; Cazenave, A.; Idier, D.; van de Wal, R.; de Winter, R.; Pedreros, R.; Balouin, Y.; Vinchon, C.; Oliveros, C. Evaluating uncertainties of future marine flooding occurrence as sea-level rises. Environ. Model. Softw. 2015, 73, 44–56. [Google Scholar] [CrossRef]
- Hoshino, S.; Esteban, M.; Mikami, T.; Takagi, H.; Shibayama, T. Estimation of increase in storm surge damage due to climate change and sea level rise in the greater tokyo area. Nat. Hazards 2016, 80, 539–565. [Google Scholar] [CrossRef]
- Hardy, R.D.; Nuse, B.L. Global sea-level rise: Weighing country responsibility and risk. Clim. Chang. 2016, 137, 333–345. [Google Scholar] [CrossRef]
- Gornitz, V. Global coastal hazards from future sea-level rise. Glob. Planet. Chang. 1991, 89, 379–398. [Google Scholar] [CrossRef]
- McInnes, K.L.; Walsh, K.J.E.; Hoeke, R.K.; O’Grady, J.G.; Colberg, F.; Hubbert, G.D. Quantifying storm tide risk in fiji due to climate variability and change. Glob. Planet. Chang. 2014, 116, 115–129. [Google Scholar] [CrossRef]
- French, J.; Payo, A.; Murray, B.; Orford, J.; Eliot, M.; Cowell, P. Appropriate complexity for the prediction of coastal and estuarine geomorphic behaviour at decadal to centennial scales. Geomorphology 2016, 256, 3–16. [Google Scholar] [CrossRef]
- Hunter, J. A simple technique for estimating an allowance for uncertain sea-level rise. Clim. Chang. 2012, 113, 239–252. [Google Scholar] [CrossRef]
- Hunter, J.R.; Church, J.A.; White, N.J.; Zhang, X. Towards a global regionally varying allowance for sea-level rise. Ocean Eng. 2013, 71, 17–27. [Google Scholar] [CrossRef]
- Buchanan, M.K.; Kopp, R.E.; Oppenheimer, M.; Tebaldi, C. Allowances for evolving coastal flood risk under uncertain local sea-level rise. Clim. Chang. 2016, 137, 347–362. [Google Scholar] [CrossRef]
- Slangen, A.B.A.; van de Wal, R.S.W.; Reerink, T.J.; de Winter, R.C.; Hunter, J.R.; Woodworth, P.L.; Edwards, T. The impact of uncertainties in ice sheet dynamics on sea-level allowances at tide gauge locations. J. Mar. Sci. Eng. 2017, 5, 21. [Google Scholar] [CrossRef]
- Dawson, R.J.; Dickson, M.E.; Nicholls, R.J.; Hall, J.W.; Walkden, M.J.A.; Stansby, P.K.; Mokrech, M.; Richards, J.; Zhou, J.; Milligan, J.; et al. Integrated analysis of risks of coastal flooding and cliff erosion under scenarios of long term change. Clim. Chang. 2009, 95, 249–288. [Google Scholar] [CrossRef]
- Dawson, D.; Shaw, J.; Gehrels, W.R. Sea-level rise impacts on transport infrastructure: The notorious case of the coastal railway line at Dawlish, England. J. Trans. Geogr. 2016, 51, 97–109. [Google Scholar] [CrossRef]
- Brown, J.M.; Ciavola, P.; Masselink, G.; McCall, R.; Plater, A.J. Preface: Monitoring and modelling to guide coastal adaptation to extreme storm events in a changing climate. Nat. Hazards Earth Syst. Sci. 2016, 16, 463–467. [Google Scholar] [CrossRef]
- Nurse, L.A.; McLean, R.F.; Agard, J.; Briguglio, L.P.; Duvat-Magnan, V.; Pelesikoti, N.; Tompkins, E.; Webb, A. Small islands. In Climate Change 2014: Impacts, Adaptation, and Vulnerability; Part B: Regional Aspects; Contribution of Working Group II to the Fifth Assessment Report of the Intergovernmental Panel on Climate Change; Barros, V.R., Field, C.B., Dokken, D.J., Mastrandrea, M.D., Mach, K.J., Bilir, T.E., Chatterjee, M., Ebi, K.L., Estrada, Y.O., Genova, R.C., et al., Eds.; Cambridge University Press: Cambridge, UK; New York, NY, USA, 2014; pp. 1613–1654. [Google Scholar]
- Storlazzi, C.D.; Elias, E.P.L.; Berkowitz, P. Many atolls may be uninhabitable within decades due to climate change. Sci. Rep. 2015, 5, 14546. [Google Scholar] [CrossRef] [PubMed]
- Hall, J.W.; Lempert, R.J.; Keller, K.; Hackbarth, A.; Mijere, C.; McInerney, D.J. Robust climate policies under uncertainty: A comparison of robust decision making and info-gap methods. Risk Anal. 2012, 32, 1657–1672. [Google Scholar] [CrossRef] [PubMed]
- Haasnoot, M.; Kwakkel, J.H.; Walker, W.E.; ter Maat, J. Dynamic adaptive policy pathways: A method for crafting robust decisions for a deeply uncertain world. Glob. Environ. Chang.-Hum. Policy Dimens. 2013, 23, 485–498. [Google Scholar] [CrossRef]
- Ranger, N.; Reeder, T.; Lowe, J. Addressing ‘deep’ uncertainty over long-term climate in major infrastructure projects: Four innovations of the Thames Estuary 2100 Project. EURO J. Decis. Process. 2013, 1, 233–262. [Google Scholar] [CrossRef]
- Brooks, M.S. Accelerating innovation in climate services: The 3 e’s for climate service providers. Bull. Am. Meteorol. Soc. 2013, 94, 807–819. [Google Scholar] [CrossRef]
- Tompkins, E.L.; Eakin, H. Managing private and public adaptation to climate change. Glob. Environ. Chang. 2012, 22, 3–11. [Google Scholar] [CrossRef]
- Nuseibeh, B.; Easterbrook, S. Requirements engineering: A roadmap. In Proceedings of the Future of Software Engineering, Limerick, Ireland, 4–11 June 2000; pp. 35–46. [Google Scholar]
- Cash, D.W.; Clark, W.C.; Alcock, F.; Dickson, N.M.; Eckley, N.; Guston, D.H.; Jager, J.; Mitchell, R.B. Knowledge systems for sustainable development. Proc. Natl. Acad. Sci. USA 2003, 100, 8086–8091. [Google Scholar] [CrossRef] [PubMed]
- Monfray, P.; Bley, D. JPI Climate: A key player in advancing Climate Services in Europe. Clim. Serv. 2016, 4, 61–64. [Google Scholar] [CrossRef]
- Kinsela, M.A.; Monis, B.D.; Daley, M.J.A.; Hanslow, D.J. A flexible approach to forecasting coastline change on wave dominated beaches. J. Coast. Res. 2016, 952–956. [Google Scholar] [CrossRef]
- Stive, M.J.F.; Aarninkhof, S.G.J.; Hamm, L.; Hanson, H.; Larson, M.; Wijnberg, K.M.; Nicholls, R.J.; Capobianco, M. Variability of shore and shoreline evolution. Coast. Eng. 2002, 47, 211–235. [Google Scholar] [CrossRef]
- Ranasinghe, R. Assessing climate change impacts on open sandy coasts: A review. Earth-Sci. Rev. 2016, 160, 320–332. [Google Scholar] [CrossRef]
- Cazenave, A.; Le Cozannet, G. Sea level rise and its coastal impacts. Earths Future 2014, 2, 15–34. [Google Scholar] [CrossRef]
- World Bank Group Climate Change Action Plan. Available online: http://pubdocs.worldbank.org/en/677331460056382875/WBG-Climate-Change-Action-Plan-public-version.pdf (accessed on 5 May 2017).
- Hulme, M.; Jenkins, G.J.; Lu, X.; Tumpenny, J.R.; Mitchell, T.D.; Jones, R.G.; Lowe, J.; Murphy, J.M.; Hassell, D.C. Climate Change Scenarios for the United Kingdom: The UKCIP02 Scientific Report; Tyndall Centre for Climate Change Research, University of East Anglia: Norwich, UK, 2002; 120p. [Google Scholar]
- Lowe, J.A.; Howard, T.; Pardaens, A.; Tinker, J.; Holt, J.; Wakelin, S.; Milne, G.; Leake, J.; Wolf, J.; Horsburgh, K.; et al. UK Climate Projections Science Report: Marine and Coastal Projections; Met Office Hadley Centre: Exeter, UK, 2009.
- UKCP18 (Forthcoming). Available online: http://ukclimateprojections.metoffice.gov.uk/24125 (accessed on 5 May 2017).
- Idier, D.; Rohmer, J.; Bulteau, T.; Delvallée, E. Development of an inverse method for coastal risk management. Nat. Hazards Earth Syst. Sci. 2013, 13, 999–1013. [Google Scholar] [CrossRef]
- Spalding, M.D.; McIvor, A.L.; Beck, M.W.; Koch, E.W.; Moller, I.; Reed, D.J.; Rubinoff, P.; Spencer, T.; Tolhurst, T.J.; Wamsley, T.V.; et al. Coastal ecosystems: A critical element of risk reduction. Conserv. Lett. 2014, 7, 293–301. [Google Scholar] [CrossRef]
- Wainwright, D.J.; Ranasinghe, R.; Callaghan, D.P.; Woodroffe, C.D.; Jongejan, R.; Dougherty, A.J.; Rogers, K.; Cowell, P.J. Moving from deterministic towards probabilistic coastal hazard and risk assessment: Development of a modelling framework and application to narrabeen beach, new south wales, australia. Coast. Eng. 2015, 96, 92–99. [Google Scholar] [CrossRef]
- Sergent, P.; Prevot, G.; Mattarolo, G.; Brossard, J.; Morel, G.; Mar, F.; Benoit, M.; Ropert, F.; Kergadallan, X.; Trichet, J.J.; et al. Adaptation of coastal structures to mean sea level rise. La Houille Blanche 2014, 54–61. [Google Scholar] [CrossRef]
- Nicholls, R.J. Impacts of and responses to sea-level rise. In Understanding Sea-Level Rise and Variability; Church, J.A., Woodworth, P.L., Aarup, T., Wilson, W.S., Eds.; Wiley-Blackwell: Chichester, GB, USA, 2010; pp. 17–51. [Google Scholar]
- Malczewski, J. Gis-based multicriteria decision analysis: A survey of the literature. Int. J. Geogr. Inf. Sci. 2006, 20, 703–726. [Google Scholar] [CrossRef]
- Boruff, B.J.; Emrich, C.; Cutter, S.L. Erosion hazard vulnerability of us coastal counties. J. Coast. Res. 2005, 21, 932–942. [Google Scholar] [CrossRef]
- Hanson, S.; Nicholls, R.J.; Balson, P.; Brown, I.; French, J.R.; Spencer, T.; Sutherland, W.J. Capturing coastal geomorphological change within regional integrated assessment: An outcome-driven fuzzy logic approach. J. Coast. Res. 2010, 26, 831–842. [Google Scholar] [CrossRef]
- Bagdanavičiūtė, I.; Kelpsaite, L.; Soomere, T. Multi-criteria evaluation approach to coastal vulnerability index development in micro-tidal low-lying areas. Ocean Coast. Manag. 2015, 104, 124–135. [Google Scholar] [CrossRef]
- Le Cozannet, G.; Garcin, M.; Bulteau, T.; Mirgon, C.; Yates, M.L.; Mendez, M.; Baills, A.; Idier, D.; Oliveros, C. An APH-derived method for mapping the physical vulnerability of coastal areas at regional scales. Nat. Hazards Earth Syst. Sci. 2013, 13, 1209–1227. [Google Scholar] [CrossRef]
- Hanson, H.; Aarninkhof, S.; Capobianco, M.; Jimenez, J.A.; Larson, M.; Nicholls, R.J.; Plant, N.G.; Southgate, H.N.; Steetzel, H.J.; Stive, M.J.F.; et al. Modelling of coastal evolution on yearly to decadal time scales. J. Coast. Res. 2003, 19, 790–811. [Google Scholar]
- Mokrech, M.; Nicholls, R.J.; Richards, J.A.; Henriques, C.; Holman, I.P.; Shackley, S. Regional impact assessment of flooding under future climate and socio-economic scenarios for east anglia and north west england. Clim. Chang. 2008, 90, 31–55. [Google Scholar] [CrossRef]
- Hinkel, J.; Klein, R.J.T. Integrating knowledge to assess coastal vulnerability to sea-level rise: The development of the diva tool. Glob. Environ. Chang.-Hum. Policy Dimens. 2009, 19, 384–395. [Google Scholar] [CrossRef]
- Narayan, S.; Nicholls, R.J.; Clarke, D.; Hanson, S.; Reeve, D.; Horrillo-Caraballo, J.; le Cozannet, G.; Hissel, F.; Kowalska, B.; Parda, R.; et al. The spr systems model as a conceptual foundation for rapid integrated risk appraisals: Lessons from europe. Coast. Eng. 2014, 87, 15–31. [Google Scholar] [CrossRef]
- Ketabchi, H.; Mahmoodzadeh, D.; Ataie-Ashtiani, B.; Simmons, C.T. Sea-level rise impacts on seawater intrusion in coastal aquifers: Review and integration. J. Hydrol. 2016, 535, 235–255. [Google Scholar] [CrossRef]
- Cooper, J.A.G.; Pilkey, O.H. Sea-level rise and shoreline retreat: Time to abandon the bruun rule. Glob. Planet. Chang. 2004, 43, 157–171. [Google Scholar] [CrossRef]
- Silva, P.A.; Bertin, X.; Fortunato, A.B.; Oliveira, A. Intercomparison of sediment transport formulas in current and combined wave-current conditions. J. Coast. Res. 2009, 25, 559–563. [Google Scholar]
- Ranasinghe, R.; Stive, M.J.F. Rising seas and retreating coastlines. Clim. Chang. 2009, 97, 465–468. [Google Scholar] [CrossRef]
- Ranasinghe, R.; Duong, T.M.; Uhlenbrook, S.; Roelvink, D.; Stive, M. Climate-change impact assessment for inlet-interrupted coastlines. Nat. Clim. Chang. 2013, 3, 83–87. [Google Scholar] [CrossRef]
- Ranasinghe, R.; Callaghan, D.; Stive, M.J.F. Estimating coastal recession due to sea level rise: Beyond the bruun rule. Clim. Chang. 2012, 110, 561–574. [Google Scholar] [CrossRef]
- Familkhalili, R.; Talke, S.A. The effect of channel deepening on tides and storm surge: A case study of Wilmington, NC. Geophys. Res. Lett. 2016, 43. [Google Scholar] [CrossRef]
- Zhang, X.; Church, J.A.; Monselesan, D.; McInnes, K.L. Sea level projections for the Australian region in the 21st century. Geophys. Res. Lett. 2017, 44. [Google Scholar] [CrossRef]
- Zhang, X.; Oke, P.; Feng, M.; Chamberlain, M.; Church, J.; Monselesan, D.; Sun, C.; Matear, R.; Schiller, A.; Fiedler, R. A near-Global Eddy-Resolving OGCM for Climate Studies. Geosci. Model Dev. Discuss. 2016. [Google Scholar] [CrossRef]
- Santamaria-Gomez, A.; Gravelle, M.; Collilieux, X.; Guichard, M.; Miguez, B.M.; Tiphaneau, P.; Woppelmann, G. Mitigating the effects of vertical land motion in tide gauge records using a state-of-the-art gps velocity field. Glob. Planet. Chang. 2012, 98–99, 6–17. [Google Scholar] [CrossRef]
- Woeppelmann, G.; Le Cozannet, G.; de Michele, M.; Raucoules, D.; Cazenave, A.; Garcin, M.; Hanson, S.; Marcos, M.; Santamaria-Gomez, A. Is land subsidence increasing the exposure to sea level rise in Alexandria, Egypt? Geophys. Res. Lett. 2013, 40, 2953–2957. [Google Scholar] [CrossRef]
- Woeppelmann, G.; Marcos, M. Vertical land motion as a key to understanding sea level change and variability. Rev. Geophys. 2016, 54, 64–92. [Google Scholar] [CrossRef]
- Raucoules, D.; Le Cozannet, G.; Woeppelmann, G.; de Michele, M.; Gravelle, M.; Daag, A.; Marcos, M. High nonlinear urban ground motion in manila (philippines) from 1993 to 2010 observed by dinsar: Implications for sea-level measurement. Remote Sens. Environ. 2013, 139, 386–397. [Google Scholar] [CrossRef]
- Teatini, P.; Ferronato, M.; Gambolati, G.; Bertoni, W.; Gonella, M. A century of land subsidence in ravenna, italy. Environ. Geol. 2005, 47, 831–846. [Google Scholar] [CrossRef]
- Ericson, J.P.; Vorosmarty, C.J.; Dingman, S.L.; Ward, L.G.; Meybeck, M. Effective sea-level rise and deltas: Causes of change and human dimension implications. Glob. Planet. Chang. 2006, 50, 63–82. [Google Scholar] [CrossRef]
- Syvitski, J.P.M.; Kettner, A.J.; Overeem, I.; Hutton, E.W.H.; Hannon, M.T.; Brakenridge, G.R.; Day, J.; Vorosmarty, C.; Saito, Y.; Giosan, L.; et al. Sinking deltas due to human activities. Nat. Geosci. 2009, 2, 681–686. [Google Scholar] [CrossRef]
- Tosi, L.; Teatini, P.; Strozzi, T. Natural versus anthropogenic subsidence of venice. Sci. Rep. 2013, 3, 2710. [Google Scholar] [CrossRef] [PubMed]
- World Bank. Climate Risks and Adaptation in Asian Coastal Megacities: A Synthesis Report; World Bank Group: Washington, DC, USA, 2010. [Google Scholar]
- Erkens, G.; Bucx, T.; Dam, R.; de Lange, G.; Lambert, J. Sinking coastal cities, Prevention and Mitigation of Natural and Anthropogenic Hazards due to Land Subsidence. In Proceedings of the Ninth International Symposium on Land Subsidence (NISOLS), Nagoya, Japan, 15–19 November 2015; pp. 189–198. [Google Scholar]
- Kopp, R.; DeConto, R.M.; Bader, D.A.; Hay, C.C.; Horton, R.M.; Kulp, S.; Oppenheimer, M.; Pollard, D.; Strauss, B.H. 2017: Preprint. Available online: https://arxiv.org/abs/1704.05597 (accessed on 10 October 2017).
- DeConto, R.M.; Pollard, D. Contribution of antarctica to past and future sea-level rise. Nature 2016, 531, 591–597. [Google Scholar] [CrossRef] [PubMed]
- Ritz, C.; Edwards, T.L.; Durand, G.; Payne, A.J.; Peyaud, V.; Hindmarsh, R.C.A. Potential sea-level rise from antarctic ice-sheet instability constrained by observations. Nature 2015, 528, 115–118. [Google Scholar] [CrossRef] [PubMed]
- Bamber, J.L.; Aspinall, W.P. An expert judgement assessment of future sea level rise from the ice sheets. Nat. Clim. Chang. 2013, 3, 424–427. [Google Scholar] [CrossRef]
- Oppenheimer, M.; Little, C.M.; Cooke, R.M. Expert judgement and uncertainty quantification for climate change. Nat. Clim. Chang. 2016, 6, 445–451. [Google Scholar] [CrossRef]
- De Vries, H.; van de Wal, R.S.W. How to interpret expert judgment assessments of the 21st century sea-level rise. Clim. Chang. 2015, 130, 87–100. [Google Scholar] [CrossRef]
- Ben Abdallah, N.; Mouhous-Voyneau, N.; Denoeux, T. Combining statistical and expert evidence using belief functions: Application to centennial sea level estimation taking into account climate change. Int. J. Approx. Reason. 2014, 55, 341–354. [Google Scholar] [CrossRef]
- Le Cozannet, G.; Manceau, J.C.; Rohmer, J. Bounding probabilistic sea-level projections within the framework of the possibility theory. Environ. Res. Lett. 2017, 12, 014012. [Google Scholar] [CrossRef]
- Wong, T.E.; Bakker, A.M.; Keller, K. Impacts of Antarctic fast dynamics on sea-level projections and coastal flood defense. arXiv, 2016; arXiv:1612.07175. [Google Scholar]
- De Winter, R.; Reerink, T.J.; Slangen, A.B.; de Vries, H.; Edwards, T.; van de Wal, R.S. Impact of asymmetric uncertainties in ice sheet dynamics on regional sea level projections. Nat. Hazards Earth Syst. Sci. 2017. [Google Scholar] [CrossRef]
- Integrated Climate Data Center at the Hambourg University. Available online: http://icdc.cen.uni-hamburg.de/daten/ocean/ar5-slr.html (accessed on 5 May 2017).
- Becker, M.; Meyssignac, B.; Letetrel, C.; Llovel, W.; Cazenave, A.; Delcroix, T. Sea level variations at tropical pacific islands since 1950. Glob. Planet. Chang. 2012, 80–81, 85–98. [Google Scholar] [CrossRef]
- Meyssignac, B.; Becker, M.; Llovel, W.; Cazenave, A. An assessment of two-dimensional past sea level reconstructions over 1950–2009 based on tide-gauge data and different input sea level grids. Surv. Geophys. 2012, 33, 945–972. [Google Scholar] [CrossRef]
- Melet, A.; Meyssignac, B.; Almar, R.; Le Cozannet, G. Underestimated wave contribution to sea level rise and changes at the coast. 2017; submitted. [Google Scholar]
- Woodworth, P.L. A survey of recent changes in the main components of the ocean tide. Cont. Shelf Res. 2010, 30, 1680–1691. [Google Scholar] [CrossRef]
- Pickering, M.D.; Horsburgh, K.J.; Blundell, J.R.; Hirschi, J.M.; Nicholls, R.J.; Verlaan, M.; Wells, N.C. The impact of future sea-level rise on the global tides. Cont. Shelf Res. 2017, 142, 50–68. [Google Scholar] [CrossRef]
- Idier, D.; Paris, F.; Le Cozannet, G.; Boulahya, F.; Dumas, F. Sea-level rise impacts on the tides of the European Shelf. Cont. Shelf Res. 2017, 137, 56–71. [Google Scholar] [CrossRef]
- Albert, S.; Leon, J.X.; Grinham, A.R.; Church, J.A.; Gibbes, B.R.; Woodroffe, C.D. Interactions between sea-level rise and wave exposure on reef island dynamics in the solomon islands. Environ. Res. Lett. 2016, 11, 054011. [Google Scholar] [CrossRef]
- Vafeidis, A.T.; Nicholls, R.J.; McFadden, L.; Tol, R.S.J.; Hinkel, J.; Spencer, T.; Grashoff, P.S.; Boot, G.; Klein, R.J.T. A new global coastal database for impact and vulnerability analysis to sea-level rise. J. Coast. Res. 2008, 24, 917–924. [Google Scholar] [CrossRef]
- Menendez, M.; Woodworth, P.L. Changes in extreme high water levels based on a quasi-global tide-gauge data set. J. Geophys. Res.-Ocean. 2010, 115. [Google Scholar] [CrossRef]
- Holgate, S.J.; Matthews, A.; Woodworth, P.L.; Rickards, L.J.; Tamisiea, M.E.; Bradshaw, E.; Foden, P.R.; Gordon, K.M.; Jevrejeva, S.; Pugh, J. New data systems and products at the permanent service for mean sea level. J. Coast. Res. 2013, 29, 493–504. [Google Scholar] [CrossRef]
- Hemer, M.A.; Fan, Y.L.; Mori, N.; Semedo, A.; Wang, X.L.L. Projected changes in wave climate from a multi-model ensemble. Nat. Clim. Chang. 2013, 3, 471–476. [Google Scholar] [CrossRef]
- Emanuel, K.A. Downscaling cmip5 climate models shows increased tropical cyclone activity over the 21st century. Proc. Natl. Acad. Sci. USA 2013, 110, 12219–12224. [Google Scholar] [CrossRef] [PubMed]
- Little, C.M.; Horton, R.M.; Kopp, R.E.; Oppenheimer, M.; Yip, S. Uncertainty in twenty-first-century CMIP5 sea level projections. J. Clim. 2015, 28, 838–852. [Google Scholar] [CrossRef]
- Giorgi, F.; Jones, C.; Asrar, G.R. Addressing climate information needs at the regional level: The CORDEX framework. World Meteorol. Organ. (WMO) Bull. 2009, 58, 175. Available online: http://wcrp.ipsl.jussieu.fr/cordex/documents/CORDEX_giorgi_WMO.pdf (accessed on 10 October 2017).
- Mitrovica, J.X.; Gomez, N.; Morrow, E.; Hay, C.; Latychev, K.; Tamisiea, M.E. On the robustness of predictions of sea level fingerprints. Geophys. J. Int. 2011, 187, 729–742. [Google Scholar] [CrossRef]
- Tamisiea, M.E.; Mitrovica, J.X. The moving boundaries of sea level change understanding the origins of geographic variability. Oceanography 2011, 24, 24–39. [Google Scholar] [CrossRef]
- Spada, G. Glacial isostatic adjustment and contemporary sea level rise: An overview. Surv. Geophys. 2017, 38, 153–185. [Google Scholar] [CrossRef]
- Spada, G.; Bamber, J.L.; Hurkmans, R. The gravitationally consistent sea-level fingerprint of future terrestrial ice loss. Geophys. Res. Lett. 2013, 40, 482–486. [Google Scholar] [CrossRef]
- Lemos, M.C.; Morehouse, B.J. The co-production of science and policy in integrated climate assessments. Glob. Environ. Chang.-Hum. Policy Dimens. 2005, 15, 57–68. [Google Scholar] [CrossRef]
- McNie, E.C. Delivering climate services: Organizational strategies and approaches for producing useful climate-science information. Weather Clim. Soc. 2013, 5, 14–26. [Google Scholar] [CrossRef]
- Weaver, C.P.; Mooney, S.; Allen, D.; Beller-Simms, N.; Fish, T.; Grambsch, A.E.; Hohenstein, W.; Jacobs, K.; Kenney, M.A.; Lane, M.A.; et al. From global change science to action with social sciences. Nat. Clim. Chang. 2014, 4, 656–659. [Google Scholar] [CrossRef]
- Mimura, N.; Pulwarty, R.S.; Duc, D.M.; Elshinnawy, I.; Redsteer, M.H.; Huang, H.-Q.; Nkem, J.N.; Rodriguez, R.A.S. Adaptation planning and implementation. In Climate Change 2014: Impacts, Adaptation, and Vulnerability; Part A: Global and Sectoral Aspects; Contribution of Working Group II to the Fifth Assessment Report of the Intergovernmental Panel on Climate Change; Field, B.C., Barros, V.R., Dokken, D.J., Mach, K.J., Mastrandrea, M.D., Bilir, T.E., Chatterjee, M., Ebi, K.L., Estrada, Y.O., Genova, R.C., et al., Eds.; Cambridge University Press: Cambridge, UK; New York, NY, USA, 2014; pp. 869–898. [Google Scholar]
- Bisaro, A.; Hinkel, J. Governance of social dilemmas in climate change adaptation. Nat. Clim. Chang. 2016, 6, 354–359. [Google Scholar] [CrossRef]
- Dittrich, R.; Wreford, A.; Moran, D. A survey of decision-making approaches for climate change adaptation: Are robust methods the way forward? Ecol. Econ. 2016, 122, 79–89. [Google Scholar] [CrossRef]
- Hinkel, J.; Bisaro, A. Methodological choices in solution-oriented adaptation research: A diagnostic framework. Reg. Environ. Chang. 2016, 16, 7–20. [Google Scholar] [CrossRef]
- Wong, T.E.; Keller, K. Deep Uncertainty Surrounding Coastal Flood Risk Projections: A Case Study for New Orleans. arXiv, 2017; arXiv:1705.07722. [Google Scholar]
- Robinson, A.E.; Ogunyoye, F.; Sayers, P.; van den Brink, T.; Tarrant, O. Accounting for Residual Uncertainty: Updating the Freeboard Guide. Report—SC120014, UK Environmental Agency, Flood and Coastal Erosion Risk Management Research and Development Programme, 2017. Available online: https://www.gov.uk/government/uploads/system/uploads/attachment_data/file/595618/Accounting_for_residual_uncertainty___an_update_to_the_fluvial_freeboard_guide_-_report.pdf (accessed on 6 May 2017).
- Norton, J. An introduction to sensitivity assessment of simulation models. Environ. Model. Softw. 2015, 69, 166–174. [Google Scholar] [CrossRef]
- Saltelli, A.; Annoni, P. How to avoid a perfunctory sensitivity analysis. Environ. Model. Softw. 2010, 25, 1508–1517. [Google Scholar] [CrossRef]
- Plant, N.G.; Thieler, E.R.; Passeri, D.L. Coupling centennial-scale shoreline change to sea-level rise and coastal morphology in the gulf of mexico using a bayesian network. Earths Future. 2016, 4, 143–158. [Google Scholar] [CrossRef]
- Recommendations of the Task Force for Financial Disclosure of Risk. Available online: http://www.fsb.org/2017/06/recommendations-of-the-task-force-on-climate-related-financial-disclosures-2/ (accessed on 31 August 2017).
- United Nations Environment Programme (UNEP). The Adaptation Finance Gap Report 2016; United Nations Environment Programme (UNEP): Nairobi, Kenya, 2016. [Google Scholar]
| 1 | We avoid the term worst case, as it is impossible to define accurately and precisely. |
© 2017 by the authors. Licensee MDPI, Basel, Switzerland. This article is an open access article distributed under the terms and conditions of the Creative Commons Attribution (CC BY) license (http://creativecommons.org/licenses/by/4.0/).