Article

Influence of Wind Strength and Duration on Relative Hypoxia Reductions by Opposite Wind Directions in an Estuary with an Asymmetric Channel

1
Virginia Institute of Marine Science, Chesapeake Bay Office, 410 Severn Avenue, Annapolis, MD 21403, USA
2
Virginia Institute of Marine Science, P.O. Box 1346, Gloucester Point, VA 23062, USA
3
USEPA Chesapeake Bay Program Office, 410 Severn Avenue, Annapolis, MD 21403, USA
4
Chesapeake Research Consortium, 645 Contees Wharf Road, Edgewater, MD 21037, USA
*
Author to whom correspondence should be addressed.
J. Mar. Sci. Eng. 2016, 4(3), 62; https://doi.org/10.3390/jmse4030062
Submission received: 8 July 2016 / Revised: 7 September 2016 / Accepted: 9 September 2016 / Published: 19 September 2016

Abstract

:
Computer model experiments are applied to analyze hypoxia reductions for opposing wind directions under various speeds and durations in the north–south oriented, two-layer-circulated Chesapeake estuary. Wind’s role in destratification is the main mechanism in short-term reduction of hypoxia. Hypoxia can also be reduced by wind-enhanced estuarine circulation associated with winds that have down-estuary straining components that promote bottom-returned oxygen-rich seawater intrusion. The up-bay-ward along-channel component of straining by the southerly or easterly wind induces greater destratification than the down-bay-ward straining by the opposite wind direction, i.e., northerly or westerly winds. While under the modulation of the west-skewed asymmetric cross-channel bathymetry in the Bay’s hypoxic zone, the westward cross-channel straining by easterly or northerly winds causes greater destratification than its opposite wind direction. The wind-induced cross-channel circulation can be completed much more rapidly than the wind-induced along-channel circulation, and the former is usually more effective than the latter in destratification and hypoxia reduction in an early wind period. The relative importance of cross-channel versus along-channel circulation for a particular wind direction can change with wind speed and duration. The existence of month-long prevailing unidirectional winds in the Chesapeake is explored, and the relative hypoxia reductions among different prevailing directions are analyzed. Scenarios of wind with intermittent calm or reversing directions on an hourly scale are also simulated and compared.

1. Introduction

Excessive nutrient and organic matter loads from the watershed and nutrient-driven algal blooms in the spring and summer are the main drivers of summer hypoxia and anoxia in the Chesapeake Bay estuary [1,2]. On the other hand, destratification by wind can increase dissolved oxygen (DO) in deep water and reduce hypoxia [3,4,5]. With the north-south oriented (Bay head to mouth) Chesapeake Bay main channel, different wind directions cause different degrees of destratification and associated reduction in hypoxia [6,7,8,9,10]. Hypoxia describes a condition of depressed dissolved oxygen, defined as concentrations less than 2 mg/L [11,12], and is a primary concern for Chesapeake water quality management [13]. The lower bound of hypoxia (DO ≤ 0.2 mg/L) is referred to as anoxia. This study uses anoxic volume (the volume of water with DO levels ≤ 0.2 mg/L) to measure the extent of the hypoxic condition and provide a reference for relative hypoxia reductions between opposite wind directions when wind speed or duration changes.
There are three ways by which wind can effect destratification and mixing [6]: (a) direct wind mixing; (b) along channel straining; and (c) cross channel straining. Direct wind mixing agitates the water surface and transmits energy downwards to disturb lower layers and effect stratification. Destratification is stronger in southerly (S) and northerly (N) winds than in easterly (E) and westerly (W) winds in most locations in the Chesapeake Bay, because the northerly and southerly winds have longer fetches along the main channel’s orientation [6]. Cross channel straining by westward or eastward components of the wind-induced flow generates counterclockwise or clockwise (looking to the north) circulation and disturbs the stratified layers. The cross-channel bathymetry along the Bay’s hypoxic/anoxic zone in the northerly Bay is dominant with a steeper and narrower slope on the eastern shoal (Figure 1). Such a bathymetry shown from a vertical cross-channel Profile in the Northern Bay is abbreviated the PN-type bathymetry or cross section. The asymmetric bathymetry modifies wind-induced cross-channel circulation differently among varying wind directions. In the strongly stratified summer in the Chesapeake Bay, circulation by easterly winds promotes greater destratification and hypoxia reduction than that caused by westerly winds [10,14]. Along-channel straining by the up-Bay-ward southerly winds pushes surface water to the Bay head, whereby water levels are elevated and downwelling is induced. This then creates a return down-Bay-ward bottom current, generating along-channel circulation. In the exact opposite manner, down-Bay-ward northerly winds push surface water to the Bay mouth, generating along-channel circulation via a return up-Bay-ward bottom current, in a reverse spin-direction to that produced by the southerly wind. Southerly winds blow against the net direction of surface flow and can reduce stratification significantly. Although along-channel straining by northerly winds point in the same direction as net surface flow, which could promote stratification, wind-induced cross-channel circulation and direct wind mixing can still cause significant mixing and destratification at speeds greater than 4 m/s [6,10].
Due to the Coriolis effect, the wind-induced surface water flow by all four idealized wind directions have both along-channel and cross-channel components (Table 1). The wind-induced along-channel circulation by the northerly and southerly winds is much stronger than the wind-induced cross-channel circulation by the easterly and westerly winds, because of the longer fetches associated with northerly and southerly winds. Indeed, the east- or west- components of the northerly and southerly winds are as strong as the east- or west-components of easterly and westerly winds at the same speeds, and are even greater in narrow channels.
Model experiments of 2–3 day winds at 6–8 m/s in the Chesapeake Bay indicated that the southerly wind reduced more hypoxic volume than the northerly wind during their respective periods of peak hypoxia reduction [7,14], illustrated in Figure 2. This is due to greater destratification by the along-channel straining in the southerly wind. After analyzing time-series development of stratification and bottom DO, Wang et al. [10] found that, under the modulation of asymmetric cross-channel bathymetry on wind-induced cross-channel circulation, northerly winds caused greater destratification and hypoxia reduction than southerly winds in the early wind period (i.e., before Hour 24 of an 8 m/s wind event) when the wind-induced along-channel circulation does not strongly influence the Bay’s hypoxic/anoxic center.
Destratification by wind promotes the mixing of bottom and surface waters thereby oxygenating lower layers and reducing hypoxia, which has been studied extensively [4,7,15,16,17]. Besides the destratification-related hypoxia reduction, there is another mechanism that reduces hypoxia by wind, which is related to an enhanced estuarine circulation. This is mainly influenced by the wind directions that induce a down-Bay-ward component of surface-flow, e.g., the northerly or westerly wind. Down-Bay-ward along-channel straining generates a returned up-Bay-ward force at the bottom, thereby enhancing estuarine circulation. The promoted seawater intrusion along the lower layer can bring in oxygen-rich water to the Bay’s hypoxic zone and reduce hypoxia, and this effect could be more prominent under a prolonged period of northerly wind [14].
The overall destratification by wind direction is dependent on the aforementioned three types of mixing processes. The overall hypoxia reduction is dependent on the amount of oxygen-rich water intruding into the lower level of the hypoxic zone, where destratification plays an important role, and potentially enhanced bottom seawater intrusion. The two processes can also differ as to which wind direction produces a greater hypoxia reduction, and the strengths of the effects can vary with wind speed and duration. Thus, complicated phenomena can occur in winds of different durations and speeds. Most studies of relative influences on destratification or hypoxia reduction by two opposite wind directions were based on relatively short duration wind events, equal to or less than three days [6,7,8,10]. The relative hypoxia reductions among wind directions could differ among prolonged, e.g., months long, unidirectional winds compared to short period wind events (hours to three days). This paper explores such a range of model experiments, including various wind speeds and durations, and analyses the temporal development of anoxic volume to better assess wind’s influence on hypoxia and anoxia. The hydrodynamics and mechanisms that explain the differential destratification and hypoxia reduction by different wind directions have been described previously [6,8,10] and this analysis will primarily focus on model simulated anoxic volumes.
Because wind direction can change frequently this work also conducted model experiments on winds with directions changing hourly or four-hourly, with or without intermittent periods of no wind velocity, to compare against unidirectional winds of constant speed. Despite frequent changes in wind direction, the phenomena of unidirectional prevailing winds in some seasons have been observed in the Chesapeake. It is therefore of interest to study how anoxia is affected by different month-long prevailing unidirectional winds. This work will establish additional model scenarios involving both the observed and modified wind fields that have prevailing directions in certain months to analyze the impacts on anoxia and hypoxia. Because the surface flow direction could change with tidal stages, the influence of tides is also briefly studied.

2. Methods

The coupled CH3D hydrodynamic model and CE-QUAL-ICM water quality model, which compose the Chesapeake Bay Water Quality and Sediment Transport Model (WQSTM) [18], is used. The WQSTM is peer reviewed and was applied in the development of the Chesapeake Total Maximum Daily Load (TMDL) [13]. The hydrodynamic module simulates estuarine circulation considering factors of wind, freshwater inputs, tides, and Coriolis effects [19]. The water quality module simulates 36 state variables including various species of nutrients, 3 types of phytoplankton, and related biochemical processes. The errors of estimated DO in the mainstem are 0.3 mg/L and −0.45 mg/L at depths of 6.7–12.8 m and depths greater than 12.8 m, respectively [18]. Hourly anoxic volume of the Bay is calculated by adding volumes of the model cells that have hourly DO ≤ 0.2 mg/L. Several sets of model scenarios were designed to analyze the effects of wind speed, direction, and duration. Appendix A further describes the model.

2.1. Scenario Sets of Winds at a Fixed Speed and Fixed Direction

In this category of scenarios at fixed speed and fixed direction, three scenario sets were designed. Scenario Sets A, B, and C model wind durations of two days, 1 h, and 20 days, respectively. Within a scenario set, an individual scenario has either no speed or a fixed wind speed and direction from the north (N), south (S), east (E), or west (W). All wind events began (labeled as Hour 0) at 4:00 a.m. on Day 222 of Year 1996 after a spin-up of 221 days under a no-wind condition. The wind speed was also set to zero after the wind event. Daily nutrient inputs comparable to those observed in 1996 were estimated from a watershed model [20]. The scenario of no-wind throughout year 1996 is used as a reference to quantify the extent of anoxia reduction. Year 1996 had high winter-spring nutrient load that yielded higher summer anoxia compared to most other years.
A subset of Scenario Set A (Scenario Set A_8) of 8 m/s winds over two days is defined as the Core Scenario Set, and is used as a baseline to compare to other scenarios. This is because the mechanisms leading to differences in destratification and changes in bottom DO for opposite wind directions, including the cross-channel versus along-channel circulation and the effect of cross-channel bathymetry, have been analyzed comprehensively [10].

2.2. Scenario Set D: Fixed Wind Direction with Intermittent No-Wind at Every Odd Hour

Similar to the Core Scenario Set, Scenario Set D lasts for two days in a fixed direction with speeds of 8 m/s. However, wind speeds of 8 m/s occur only at even hours, and there is no wind speed at odd hours. The scenarios are labeled d_0_d, where d will be substituted by N, S, E, or W to indicate the central direction from which the wind blows (at 8 m/s) and 0 implies the intermittent no-wind condition.

2.3. Scenario Set E: Reversing Direction at Every Even Hour, and No-Wind at Every Odd Hour

Scenario Set E is a modification of Scenario Set D wherein there are no wind speeds at odd hours and speeds of 8 m/s during even hours. However, the direction of the 8 m/s winds reverses every even hour, switching between S and N, or E and W. A scenario would be labeled, for example, S_0_N if the direction of the wind switches between southerly and northerly.

2.4. Scenario Set F: Reversing Wind Direction Every One Hour

Scenario Set F is similar to the Core Scenario Set; speeds are constant at 8 m/s, but direction reverses every hour, switching between S and N, or E and W and are labeled S_N or E_W.

2.5. Scenario Set G: Wind Direction Rotates ± 90 Degrees Every 4 h from a Central Direction

Most wind conditions in Scenario Set G are the same as those in the Core Scenario Set, i.e., wind speeds of 8 m/s lasting approximately 2 days starting at 4:00 a.m. on Day 222 of 1996, with difference being a rotation of ± 90 degrees about a central wind direction (N, S, E, or W) every 4 h (Table 2). The scenarios are labeled d ± 90, where d represents the central wind direction. A fifth scenario, S_360, rotates 8 m/s winds clockwise every 4 h, starting from the south.

2.6. Scenario Set H: Year-Long Winds at a Fixed Direction

This set of scenarios preserved observed 1996 wind speeds, but the directions were fixed to only N, S, E, or W. The fixed unidirectional wind began at Day 1 of 1996 after a five-year (1991–1995) spin-up using observed wind conditions. Daily freshwater and nutrient inputs were based on the calibrated watershed model. The scenario set is labeled Y96_d (Table 3), where d specifies the wind direction. Two other scenarios are also conducted for reference. Scenario Y96_0 has no-wind in 1996, and Scenario Y96_obs uses the observed wind direction and speed.

2.7. Scenario Set I: Rotating Direction Based on Observed Wind

June 1996 and July 2004 had especially dominant southerly winds (Figure 3). In Scenario Set I, the observed wind directions are rotated clockwise 90, 180, or 270 degrees (Table 4). They are labeled as Yyy_cw90, Yyy_cw180, and Yyy_cw270, respectively, where yy represents either 1996 or 2004 to indicate the year of base-data for wind and watershed inputs. Only the winds in a specified summer month, i.e., June 1996 or July 2004, were rotated. The prevailing directions of these scenarios are listed in Table 4. The scenario without rotation is labeled Yyy_cw00, which is also labeled Yyy_obs, as a non-rotation scenario is equivalent to the observed wind condition.
Table 5 summarizes the above nine scenario sets. Note: The scenario labeled Y96_obs in all scenarios sets (Table 3 and Table 4) is identical in each.

3. Results and Discussions

The analyses are based on model simulated anoxic volumes, mainly the reduction of anoxic volume from the no-wind scenario. The anoxic volumes are only compared at or before the peak reduction, while the post-peak recovery of anoxic volume is not covered in this paper.

3.1. Relative Anoxia Reduction by Wind Directions in Two-Day Wind Events

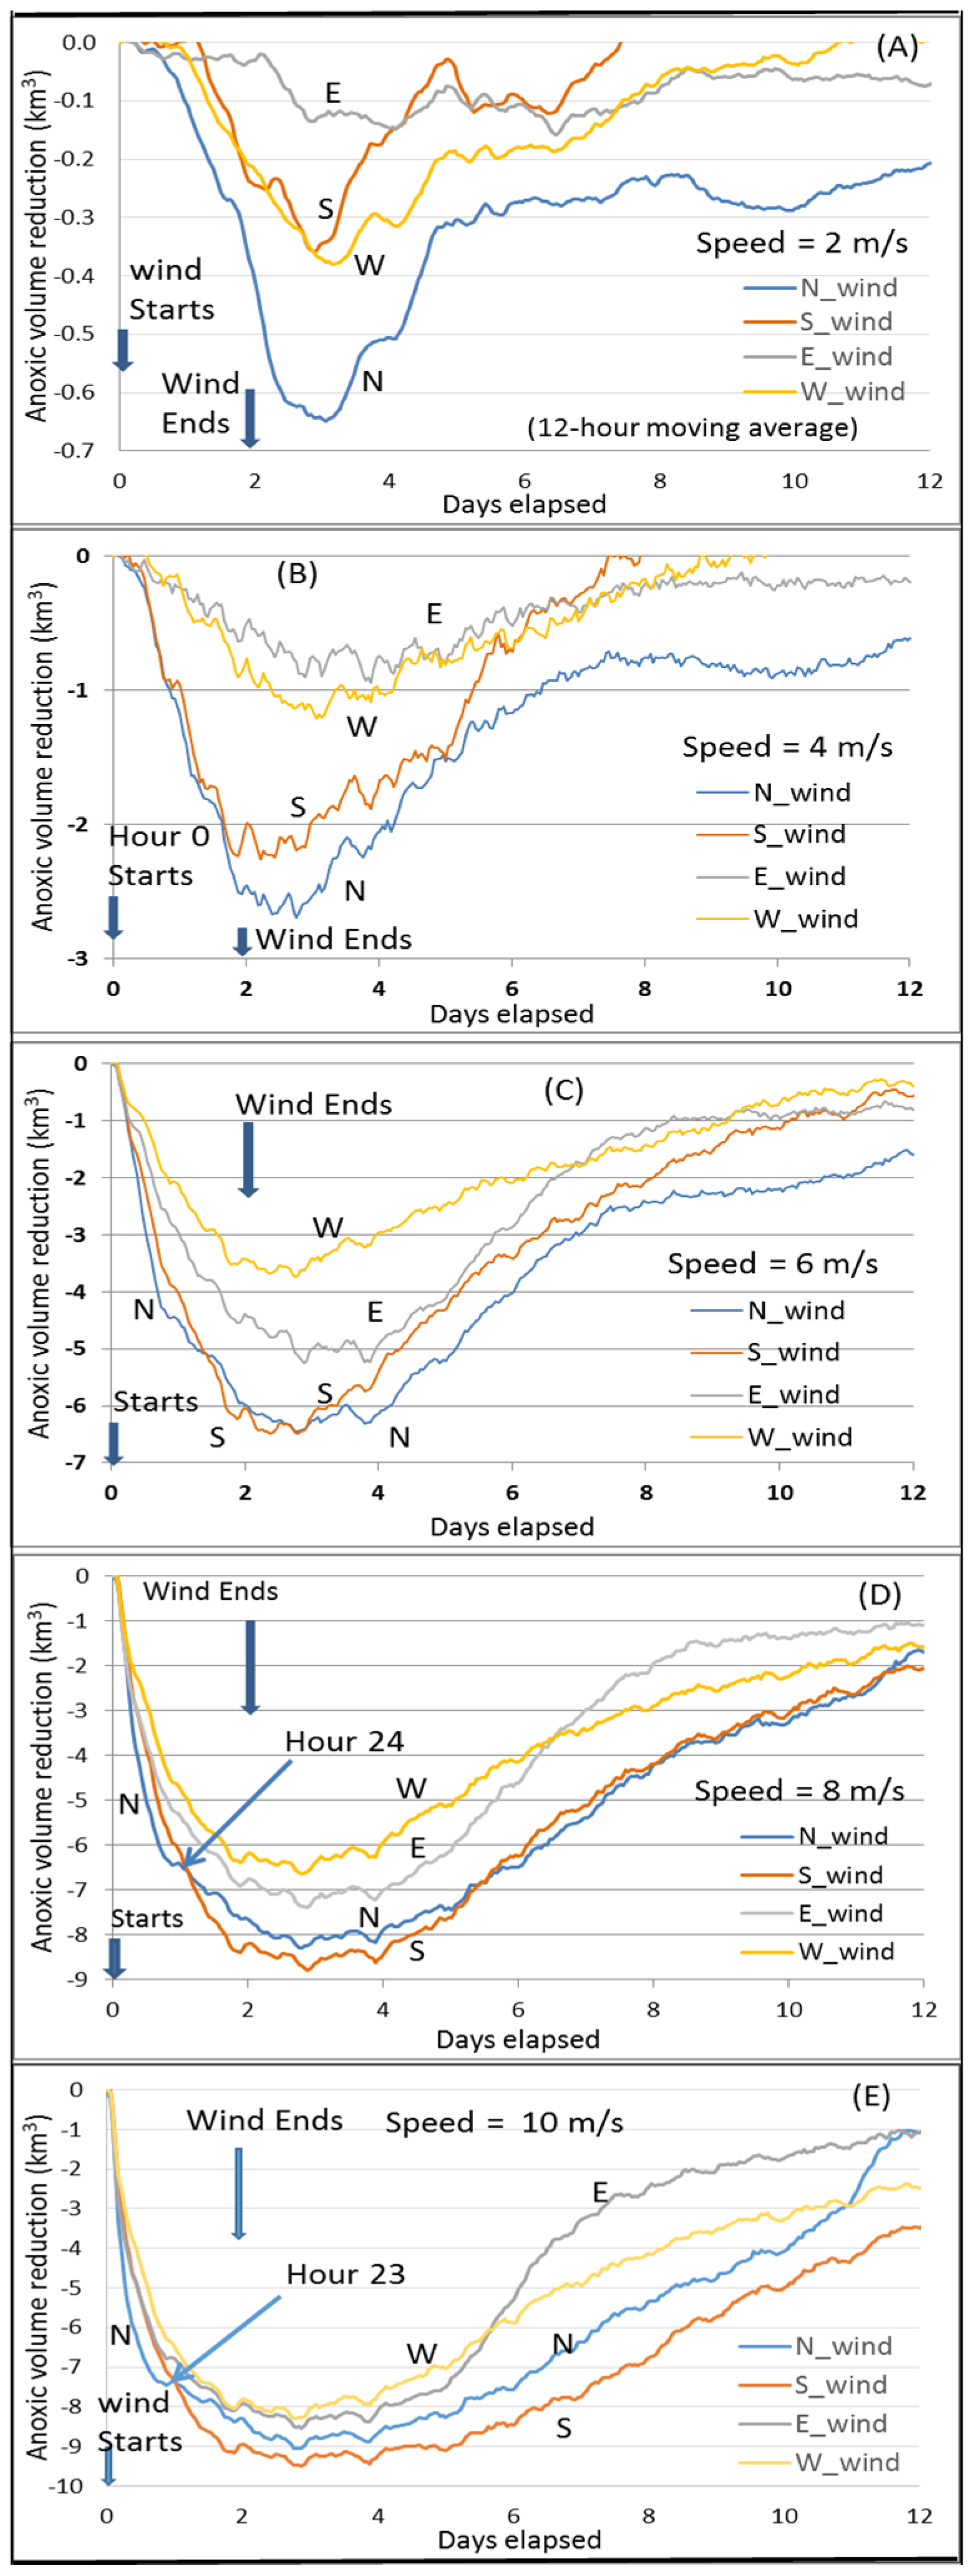
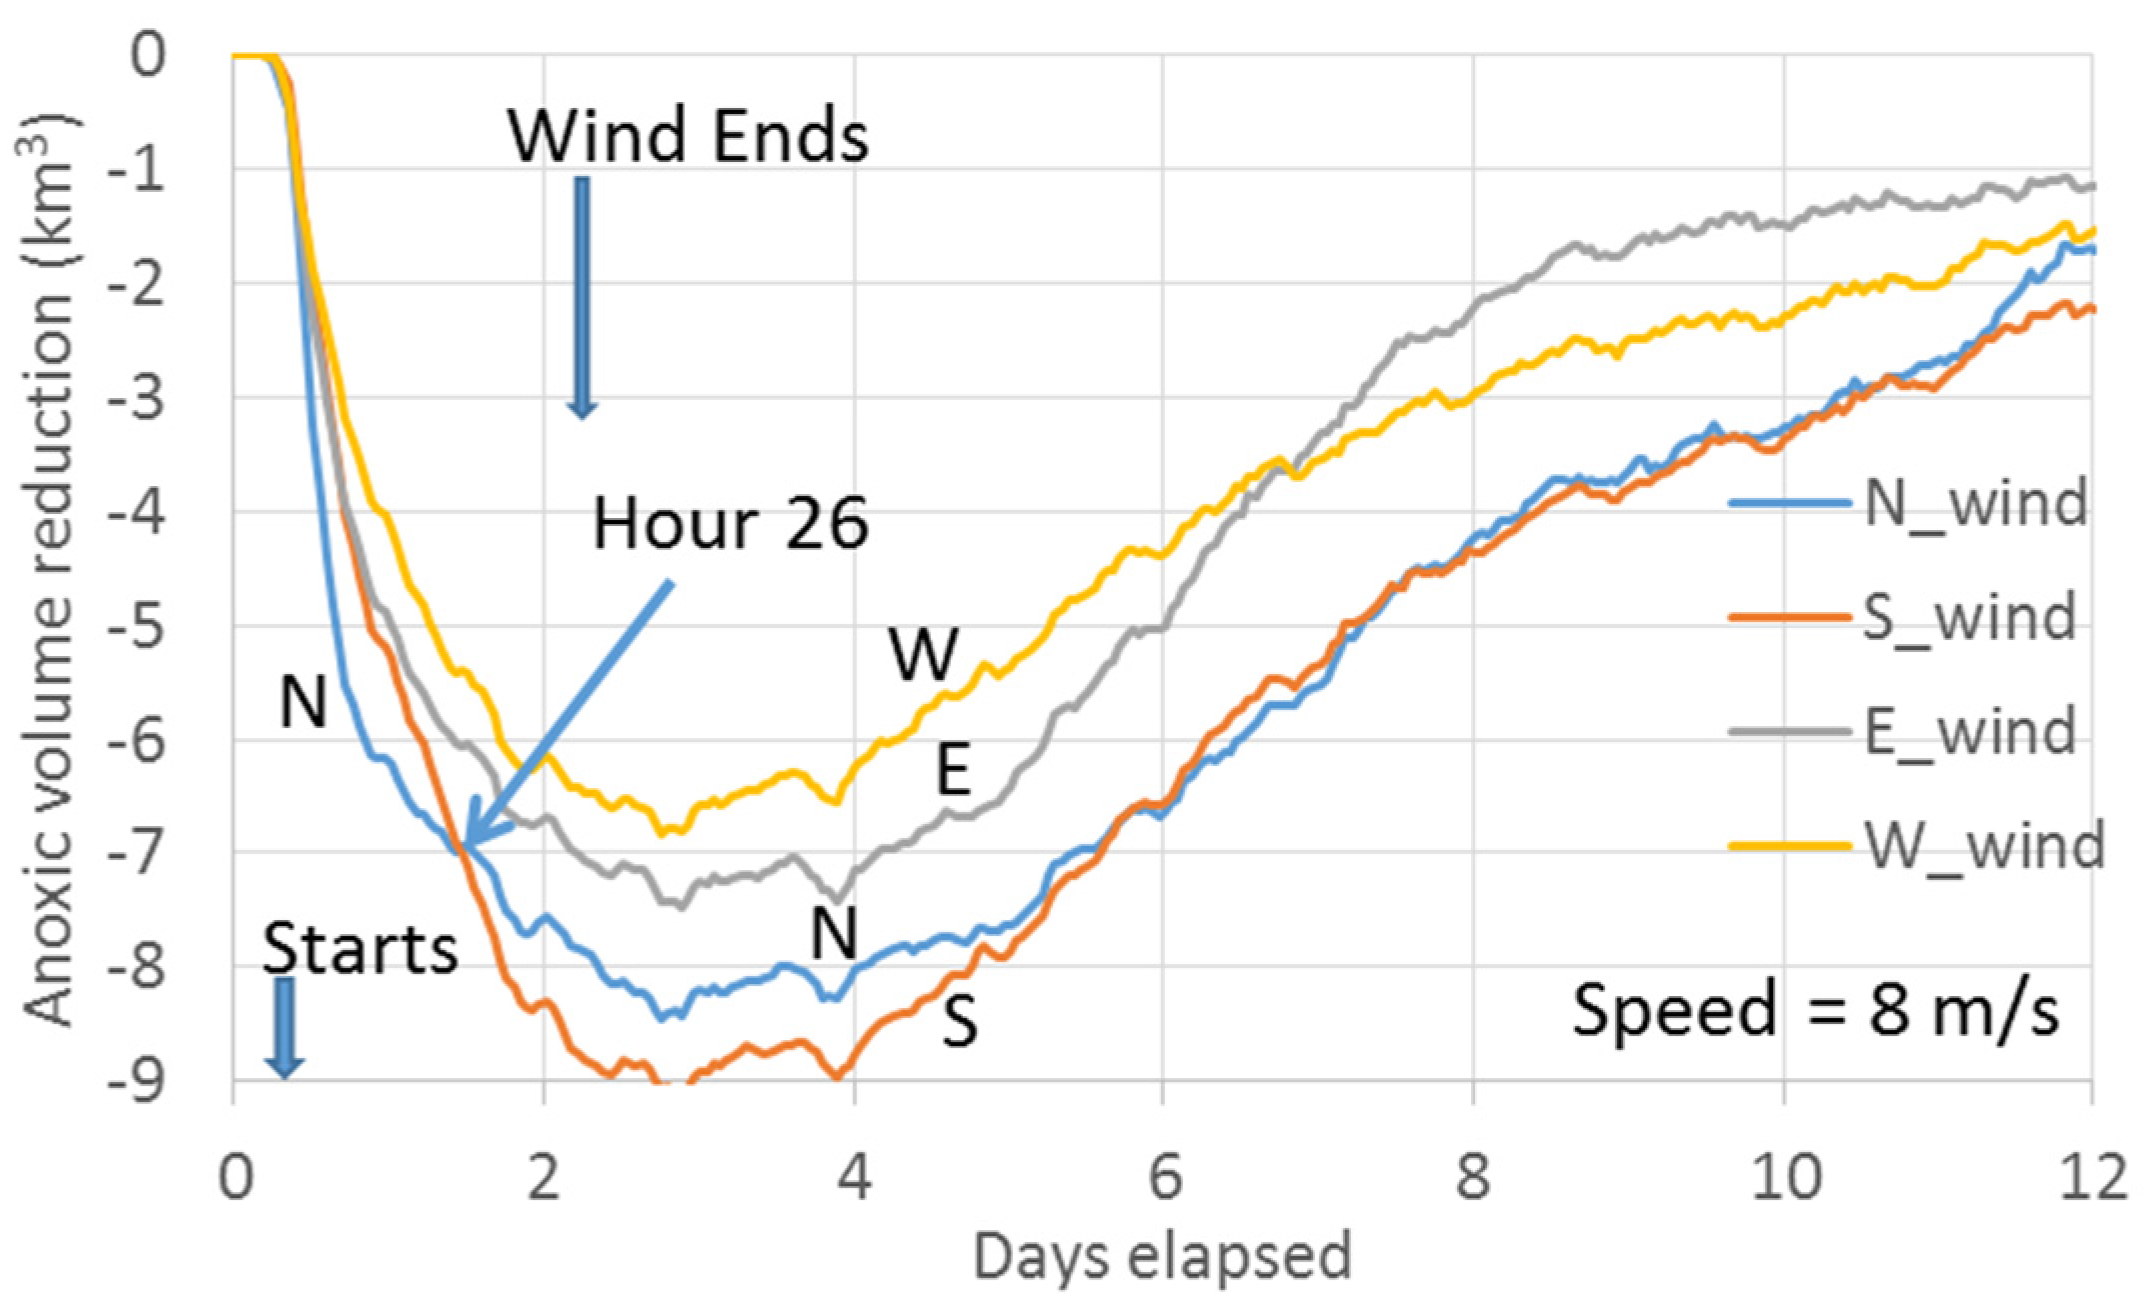
The core scenario A_8 (wind speeds of 8 m/s for two days, Figure 4D) is the same as the key scenario used in Wang et al. [10]. Here it is used as a reference to compare the results from other scenarios. Thus, it is useful to review the key findings by Wang et al. [
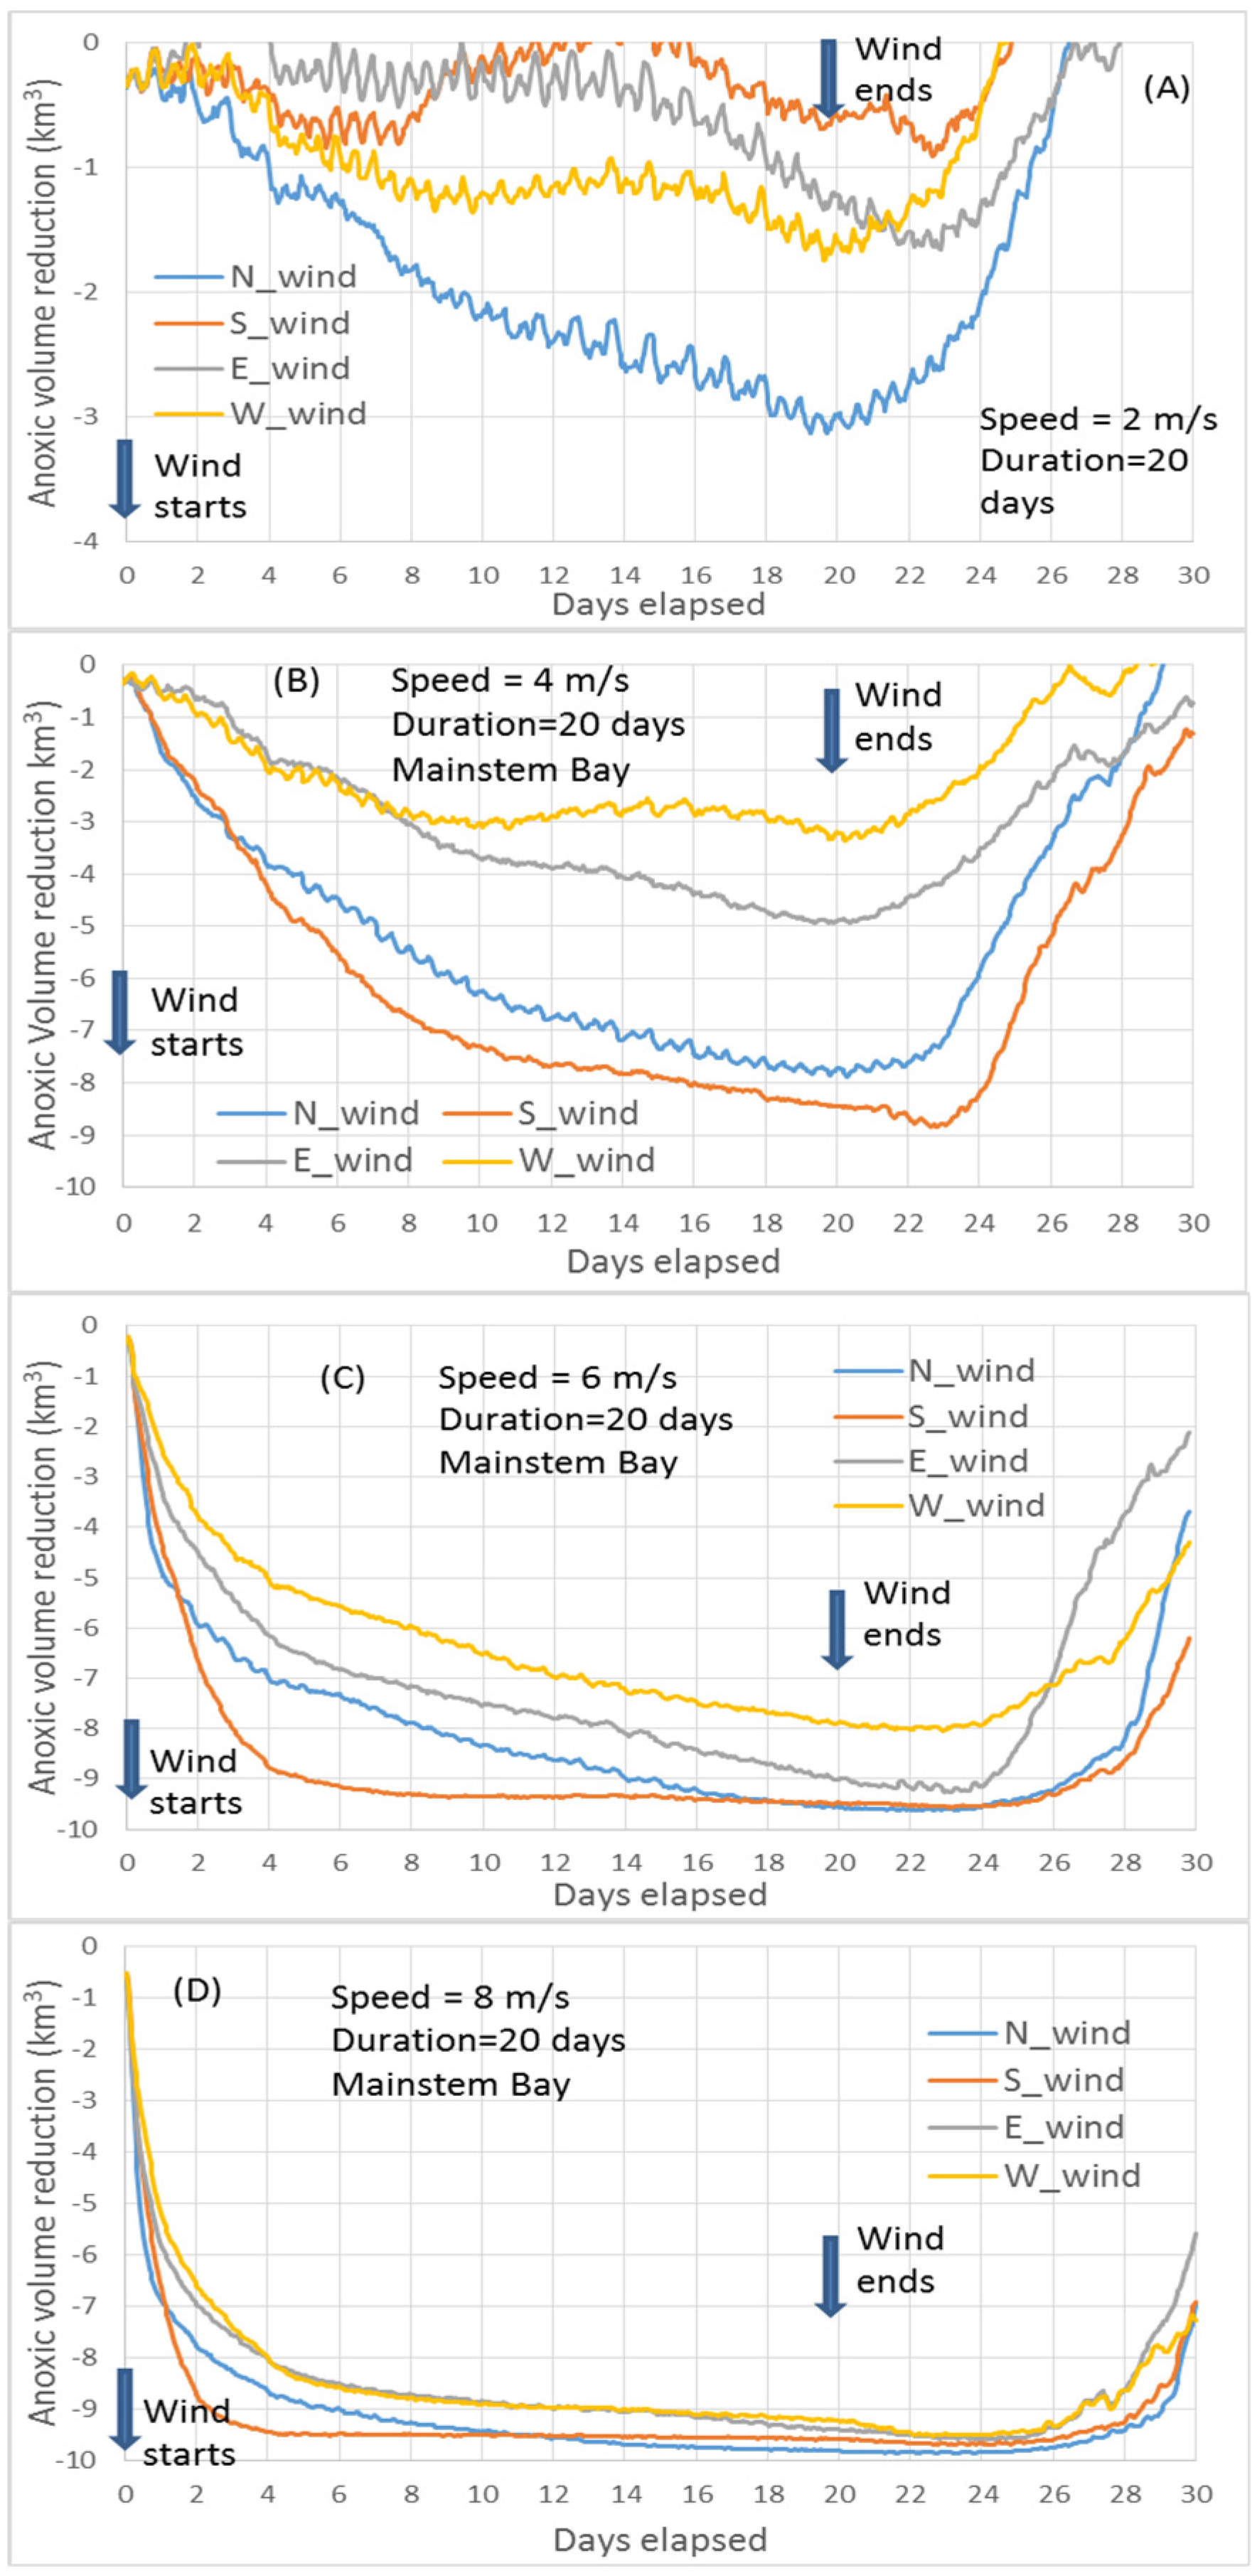
10]. The minimum point of the curves in Figure 4D represents the maximum anoxic volume reduction. The dominant PN-type cross-channel bathymetry in the Bay’s anoxic center provides a favorable condition for the easterly wind to have a greater destratification than the westerly wind under the wind-induced cross-channel circulation [10]. Thus, the easterly wind reduces more anoxia than the westerly wind. The direction of the southerly and northerly wind travel, respectively, against and along with the net transport direction of the surface fresher water, resulting in stronger destratification and greater reduction of anoxia by the southerly wind [6,7]. Notably, before Hour 24 of the wind event, northerly winds reduced anoxia more than southerly winds, also due to the effects of the PN-type bathymetry that modulates the wind-induced cross-channel circulation [10]. The northerly wind has westward straining component as the easterly wind, and the southerly wind has eastward straining component as the westerly wind. Thus, under the modulation of the PN-type bathymetry on the wind-induced cross-channel circulation, the northerly wind promotes greater destratification. Cross-channel circulation under the simulated wind speeds could be completed in a couple of hours, while a timeline of 1–2 days is necessary for the wind-induced along-channel circulation to effectively influence the anoxic center [21]. Before Hour 24, the northerly wind reduces more anoxic volume than the southerly wind, when the wind-induced cross-channel circulation plays a more important role. Following this period, however, the southerly wind-induced along-channel circulation (via downwelling from the Bay head) influences a wider area of the anoxic zone, leading to an overall greater anoxia reduction. The rest of this section will discuss anoxia reduction by winds at speeds different than the Core Scenario.
Northerly versus southerly wind. At a speed of 10 m/s, the transition point of greater anoxia reduction from northerly winds to southerly winds occurs one hour earlier (at Hour 23, Figure 4E) than the Core Scenario (Figure 4D), because the influence of the wind-induced along-channel circulation by the southerly wind is greater at higher speeds.
At speeds of 6 m/s, the maximum anoxic volume reduction by northerly winds becomes closer to that produced by southerly winds, and the transition to greater anoxia reduction by southerly winds is delayed to Hour 32 (Figure 4C). This is due to a slower influence exercised upon the anoxic center by the wind-induced along-channel circulation at lower wind speeds.
At 2 or 4 m/s wind speeds, destratification is weak and the influence of wind-induced along-channel circulation by southerly winds is weak and slow. The aforementioned transition does not occur, and northerly winds reduce anoxia more than southerly winds across the entire time period (Figure 4A,B). Again, this is primarily controlled by the wind-induced cross-channel circulation under the modulation of the PN-type cross-channel bathymetry.
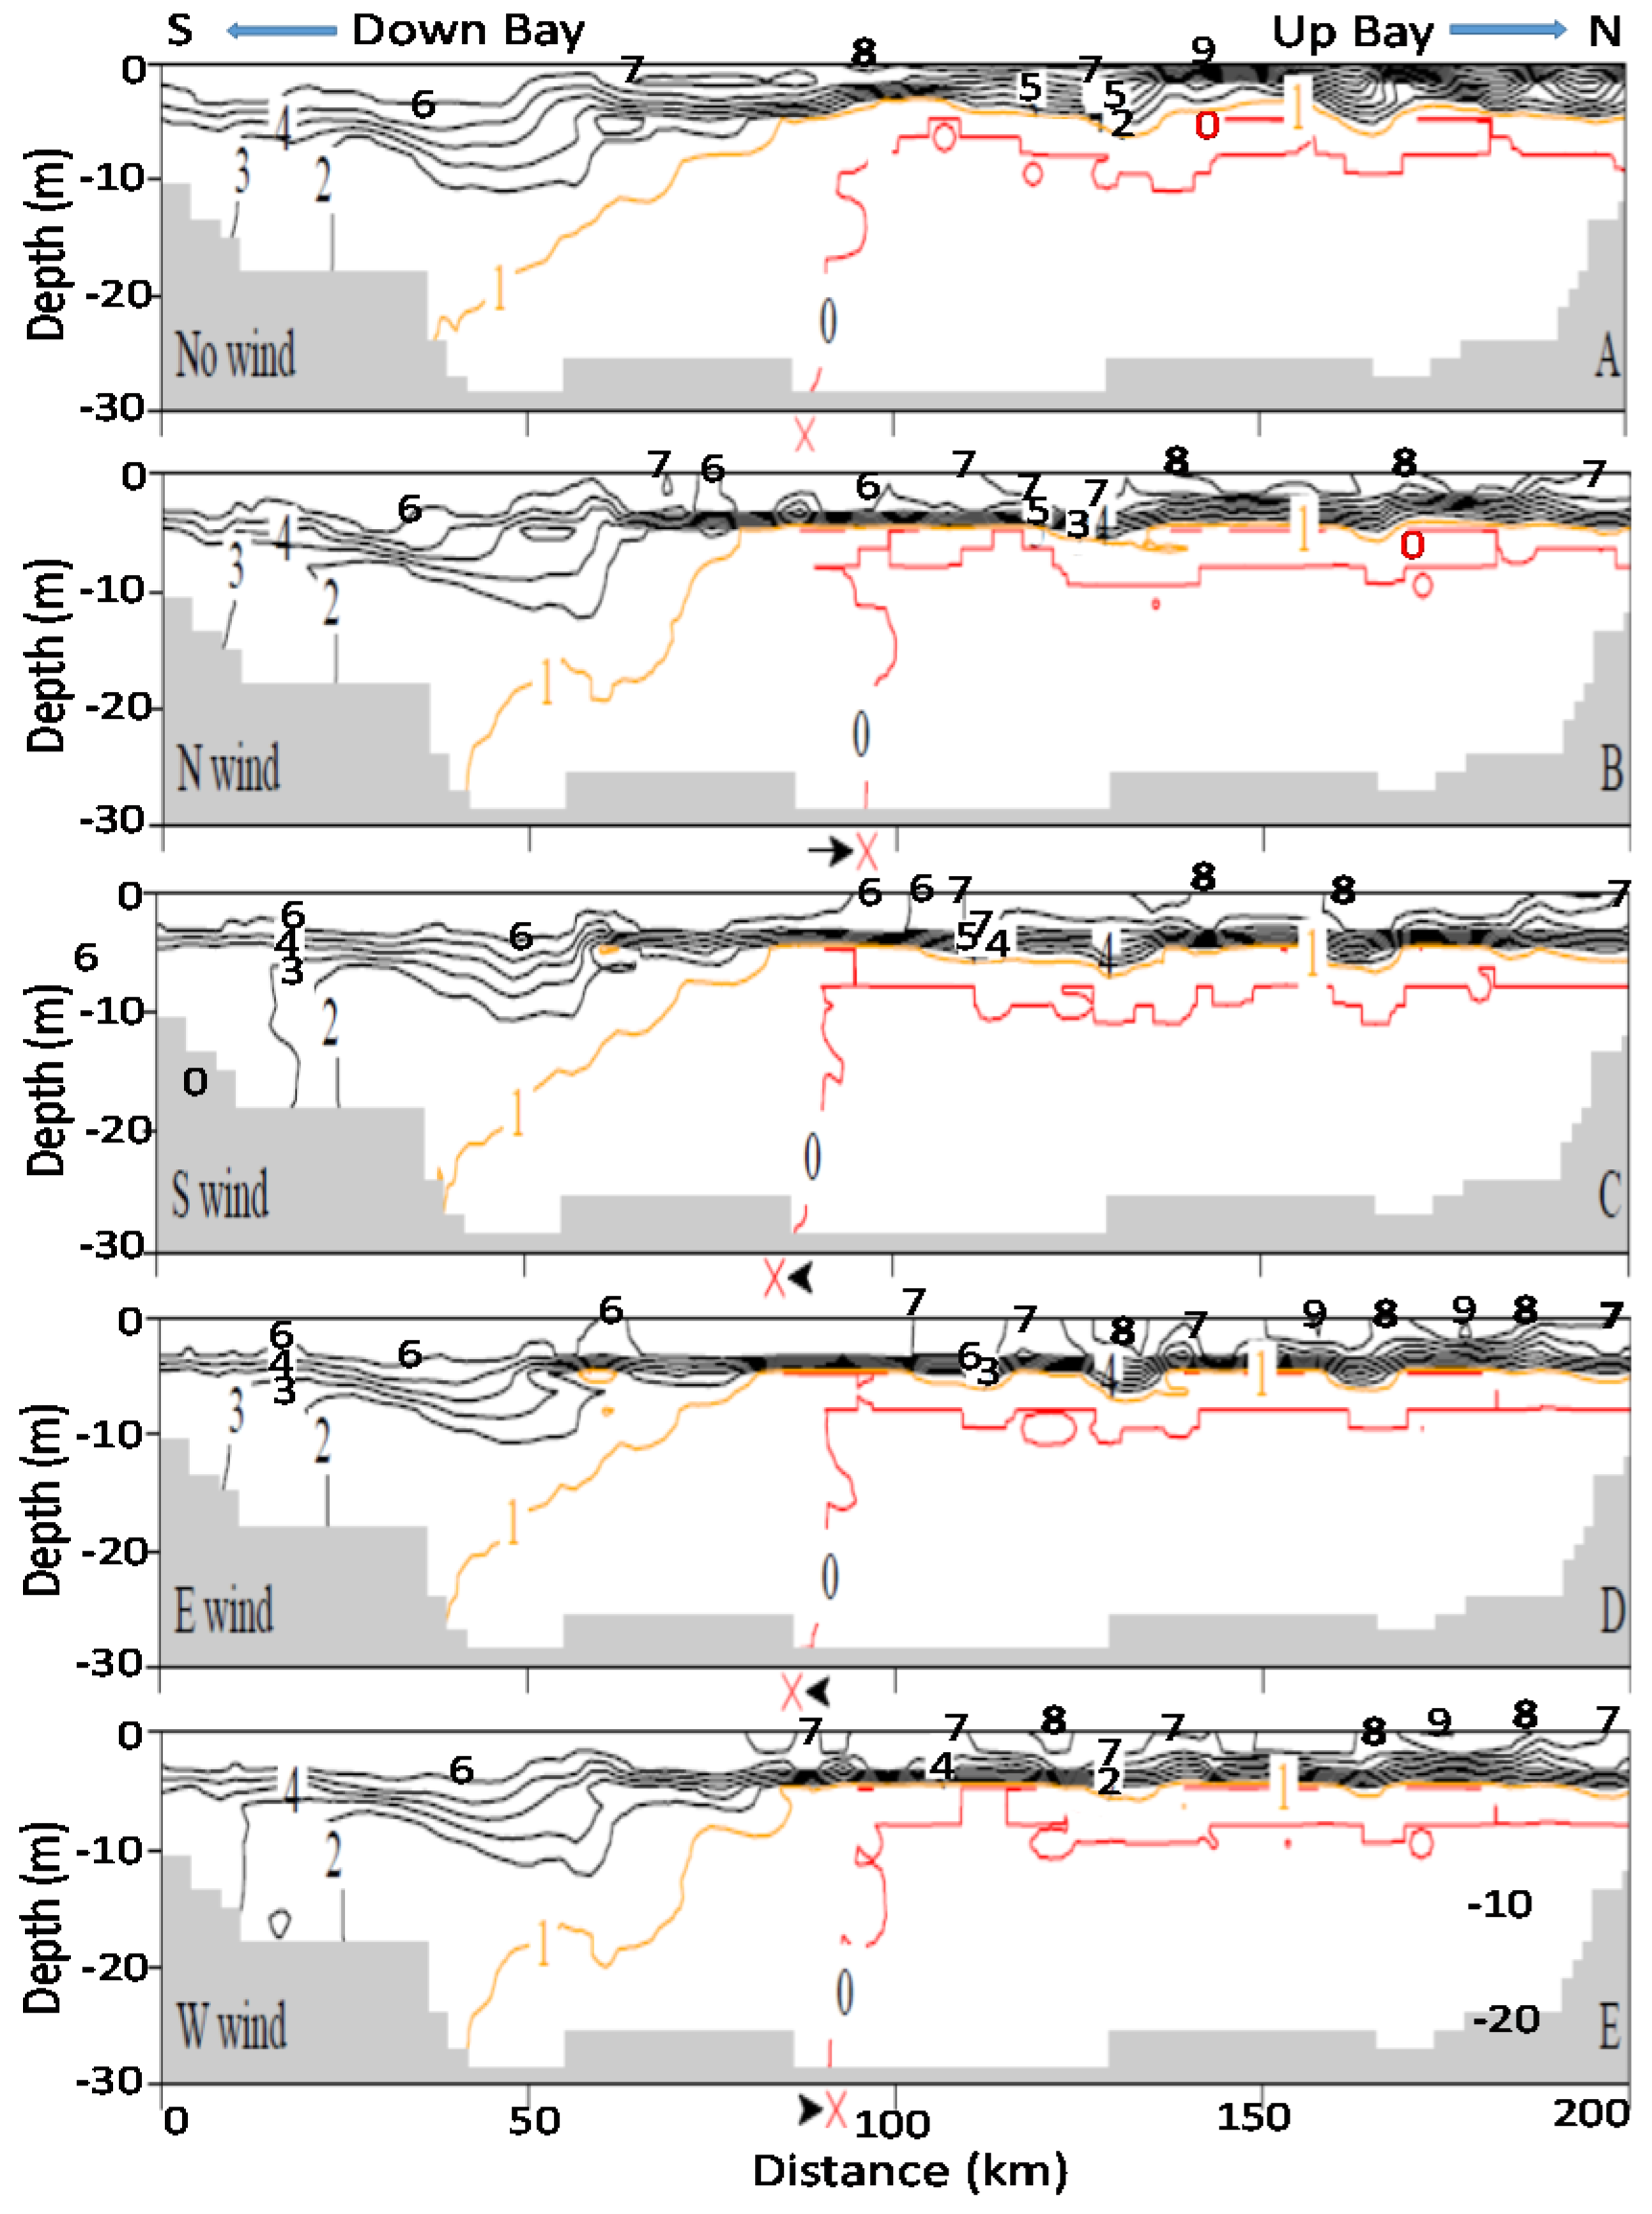
It should also be noted that the promoted up-Bay-ward bottom seawater intrusion promoted by northerly winds also plays a certain role, which can be seen in DO contours of along-channel sections in Figure 5 and Figure 6. 
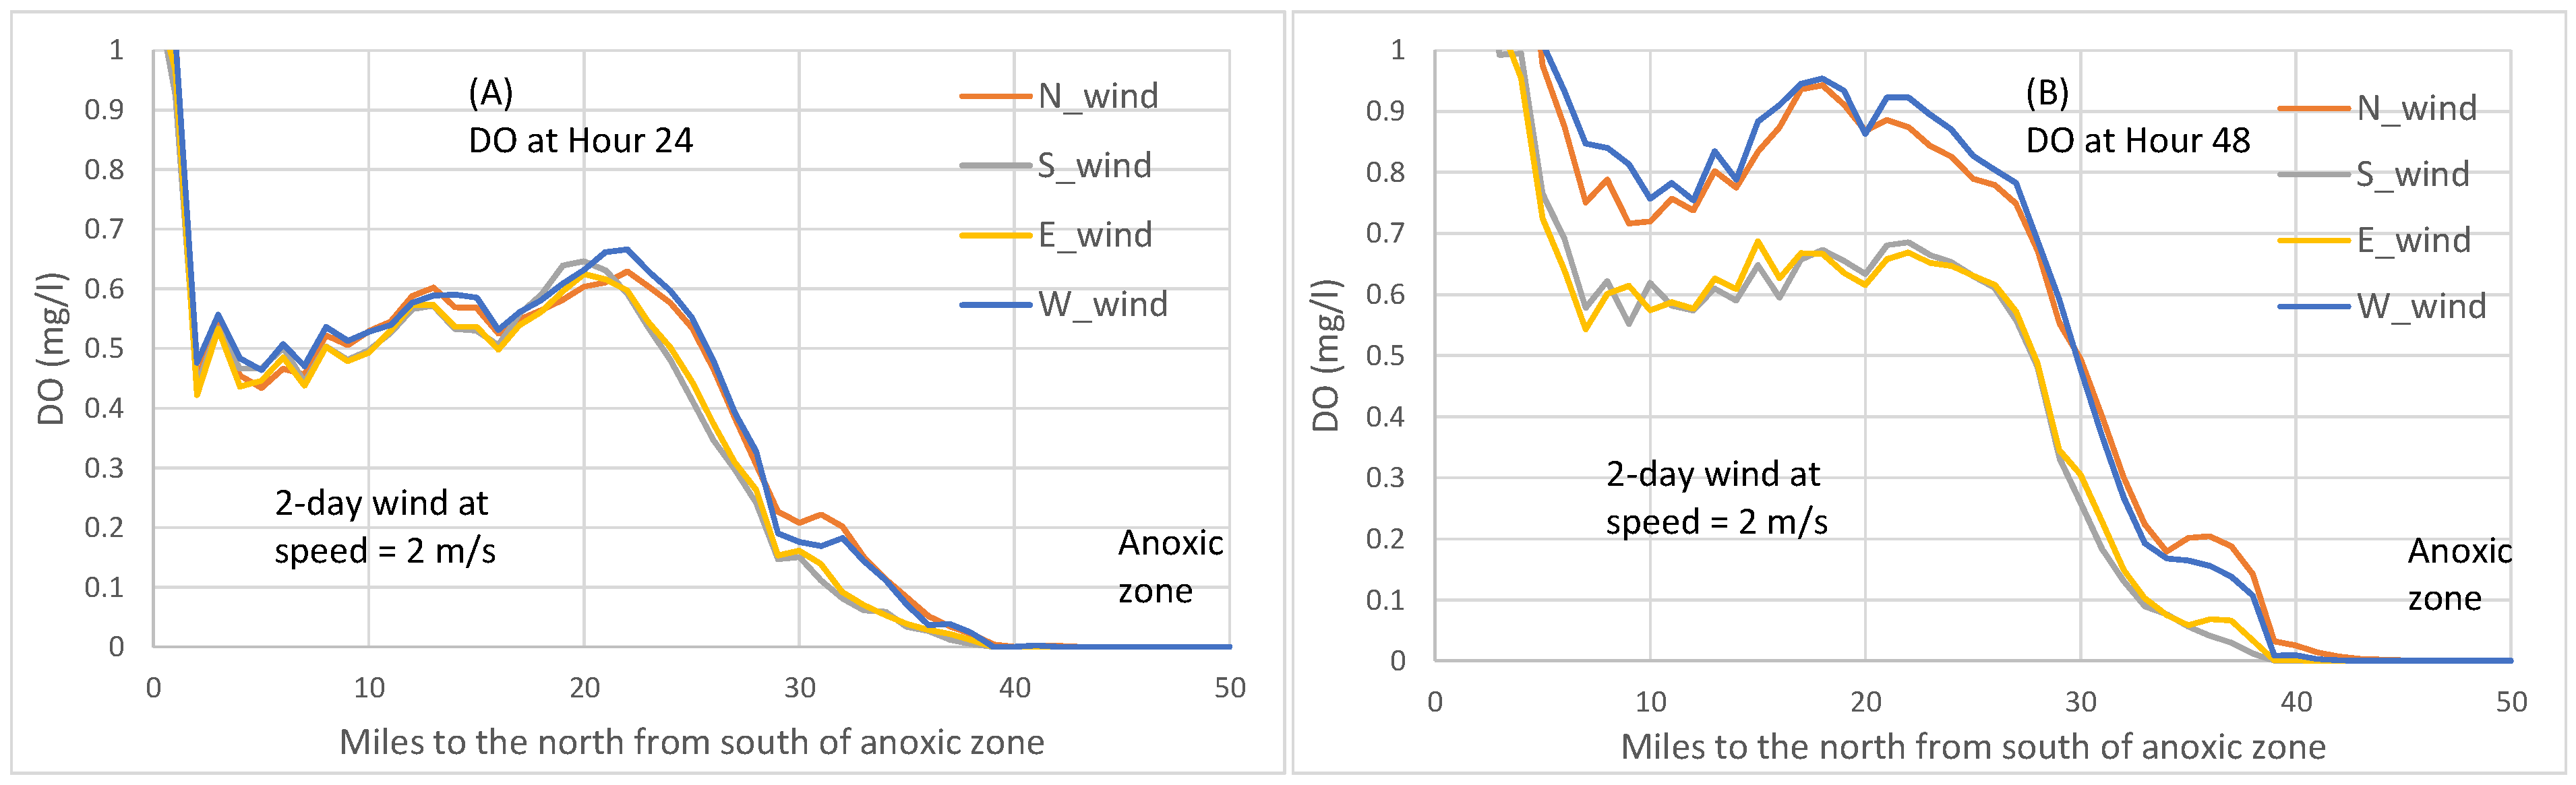
Figure 5 represents Hour 24 of the two-day wind scenario at 8 m/s, while Figure 6 shows Hour 48 of a two-day wind scenario at 2 m/s. The symbol X by the x-axis marks the southern end of the 0 mg/L DO isopleths that intersect with the bottom bathymetry. Compared to the no-wind scenarios in Figure 5A and Figure 6A, the X retreats northwards for northerly winds (Figure 5B and Figure 6B) and extends further south in southerly winds (Figure 5C and Figure 6C). The role of the enhanced bottom seawater intrusion in anoxia reduction is difficult to quantitatively separate from other mechanisms. In 8 m/s wind velocities, the bulk anoxia reduction are mainly controlled by wind’s mixing and destratification, while the contribution of oxygenation by enhanced bottom seawater intrusion from northerly (or westerly) winds is relatively small (Figure 5). In 2 m/s wind velocities, mixing or destratification is weak, the initial stratification is well maintained, and the DO isopleths in the four winds are similar to those in the no-wind condition (Figure 6), exhibiting virtually no difference. The intrusion of oxygen-rich seawater via enhanced estuarine circulation by northerly winds caused the 0 mg/L DO isopleths to shrink and reduced overall anoxic volume. This can be further seen in Figure 7 where bottom DO concentrations are plotted, northerly winds produce higher bottom DO than southerly winds, consistent with the anoxic volume reduction by northerly versus southerly winds shown in Figure 4A.
Easterly versus westerly winds. In easterly and westerly winds, the wind-induced cross-channel circulation is the dominant component that causes mixing and anoxia reduction. The PN-type cross-channel bathymetry provides favorable conditions for easterly winds over westerly winds to effect destratification by cross-channel circulation to a greater extent. Additionally, easterly winds have an up-Bay-ward component of along-channel straining, like southerly winds. Thus, at speeds of 6 m/s and greater in the two-day winds, easterly winds reduced more anoxia than westerly winds throughout the entire two-day wind event (Figure 4C–E).
At wind speeds of 2 or 4 m/s, destratification induced by easterly and westerly winds was weak and the enhanced estuarine circulation due to westerly winds became relatively important in reducing anoxia, especially in the late wind period. Before Day 1, the hypoxia reduction was mainly controlled by the bathymetry-modulated wind-induced cross-channel circulation; therefore, easterly winds had a greater anoxia reduction than westerly winds. After about 24 h, westerly winds had a greater anoxia reduction than easterly winds, including the point of peak anoxia reduction (Figure 4A,B), which is mainly due to the enhanced estuarine circulation by the westerly wind. The influence of bottom seawater intrusion on anoxia by westerly versus easterly winds can also be seen in Figure 6 by the direction in which the symbol X moves. At wind speeds of 2 m/s, westerly winds caused the 0 mg/L DO isopleths to retreat northwards, reducing anoxia (Figure 6E), and westerly winds produced higher bottom DO than easterly winds (Figure 7). During most times after Hour 24 in the scenarios of wind speeds equal to 2 or 4 m/s, westerly winds reduced anoxia to a greater extent than easterly winds (Figure 4A,B). Before Hour 24, easterly winds reduced more anoxic volume because this period was still primarily controlled by the bathymetry-modulated cross-channel circulation, while the enhanced estuarine circulation effected by westerly winds had not yet reached the anoxic center to a significant extent.
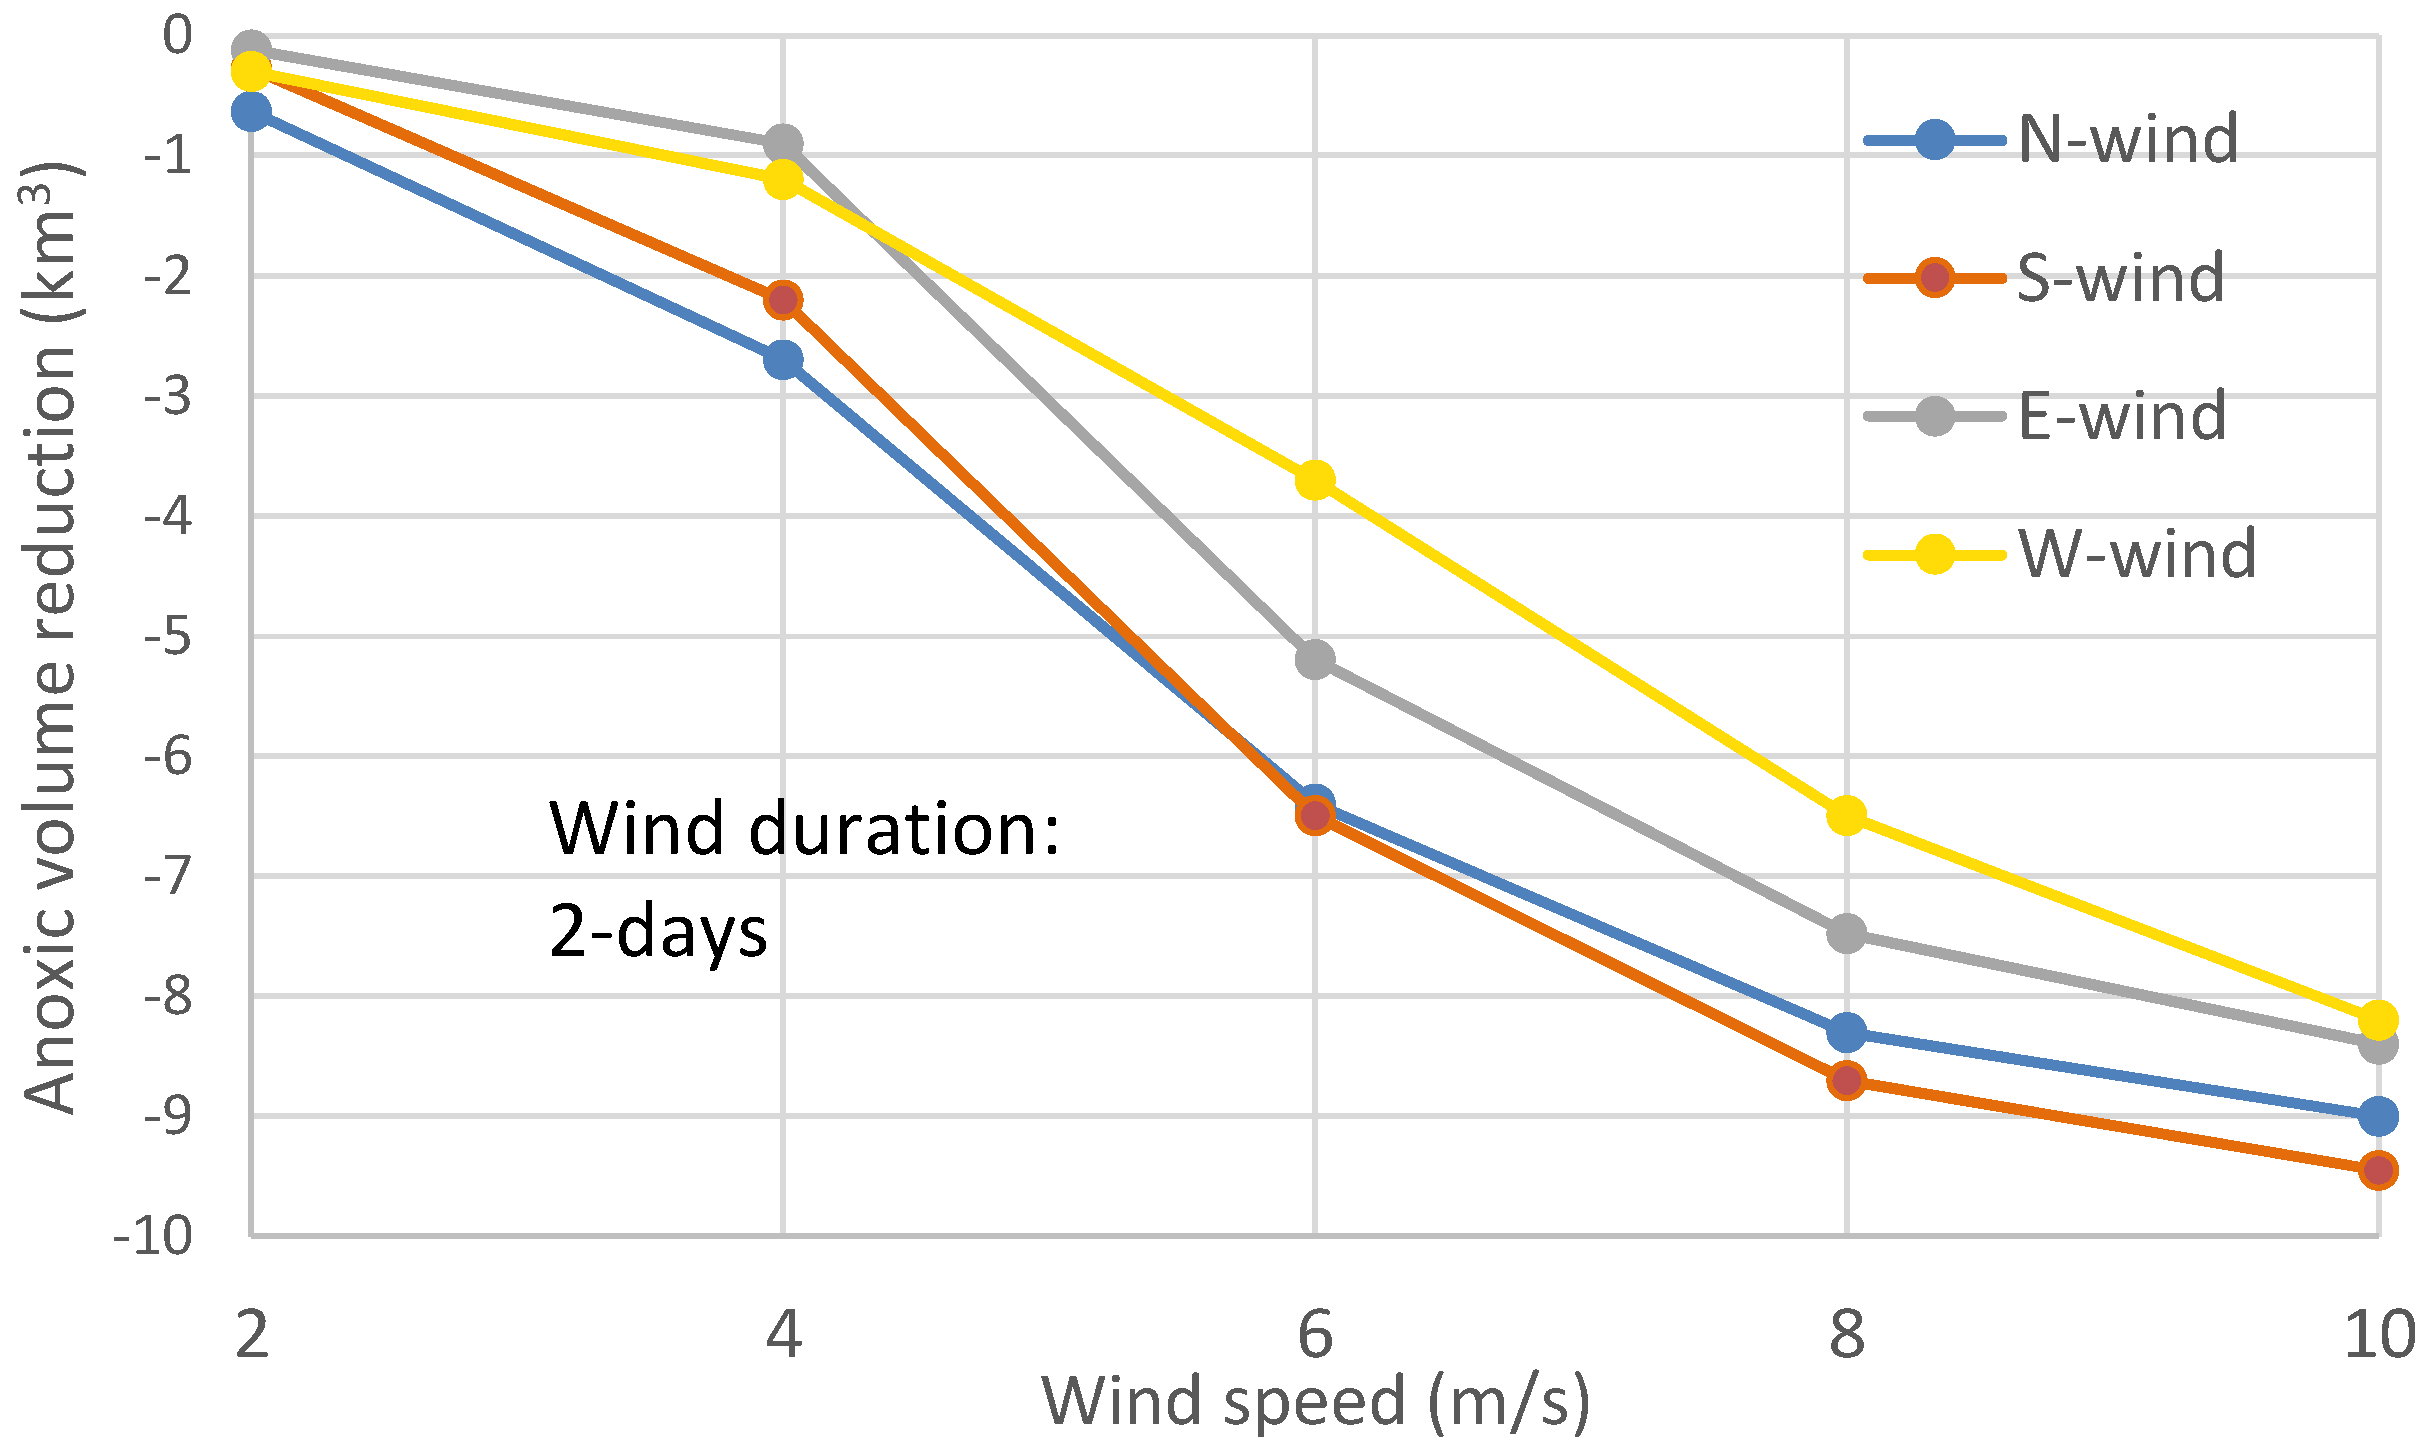
The above processes help to explain the summary figure (Figure 8) of maximum anoxia reduction among wind directions at different speeds of the two-day winds, as seen in Figure 4.
Assessing the influence of tide. The stages of tide (ebb versus flood) at the moment when the wind event starts can also influence the responses of destratification to wind’s longitudinal straining [22,23]. 
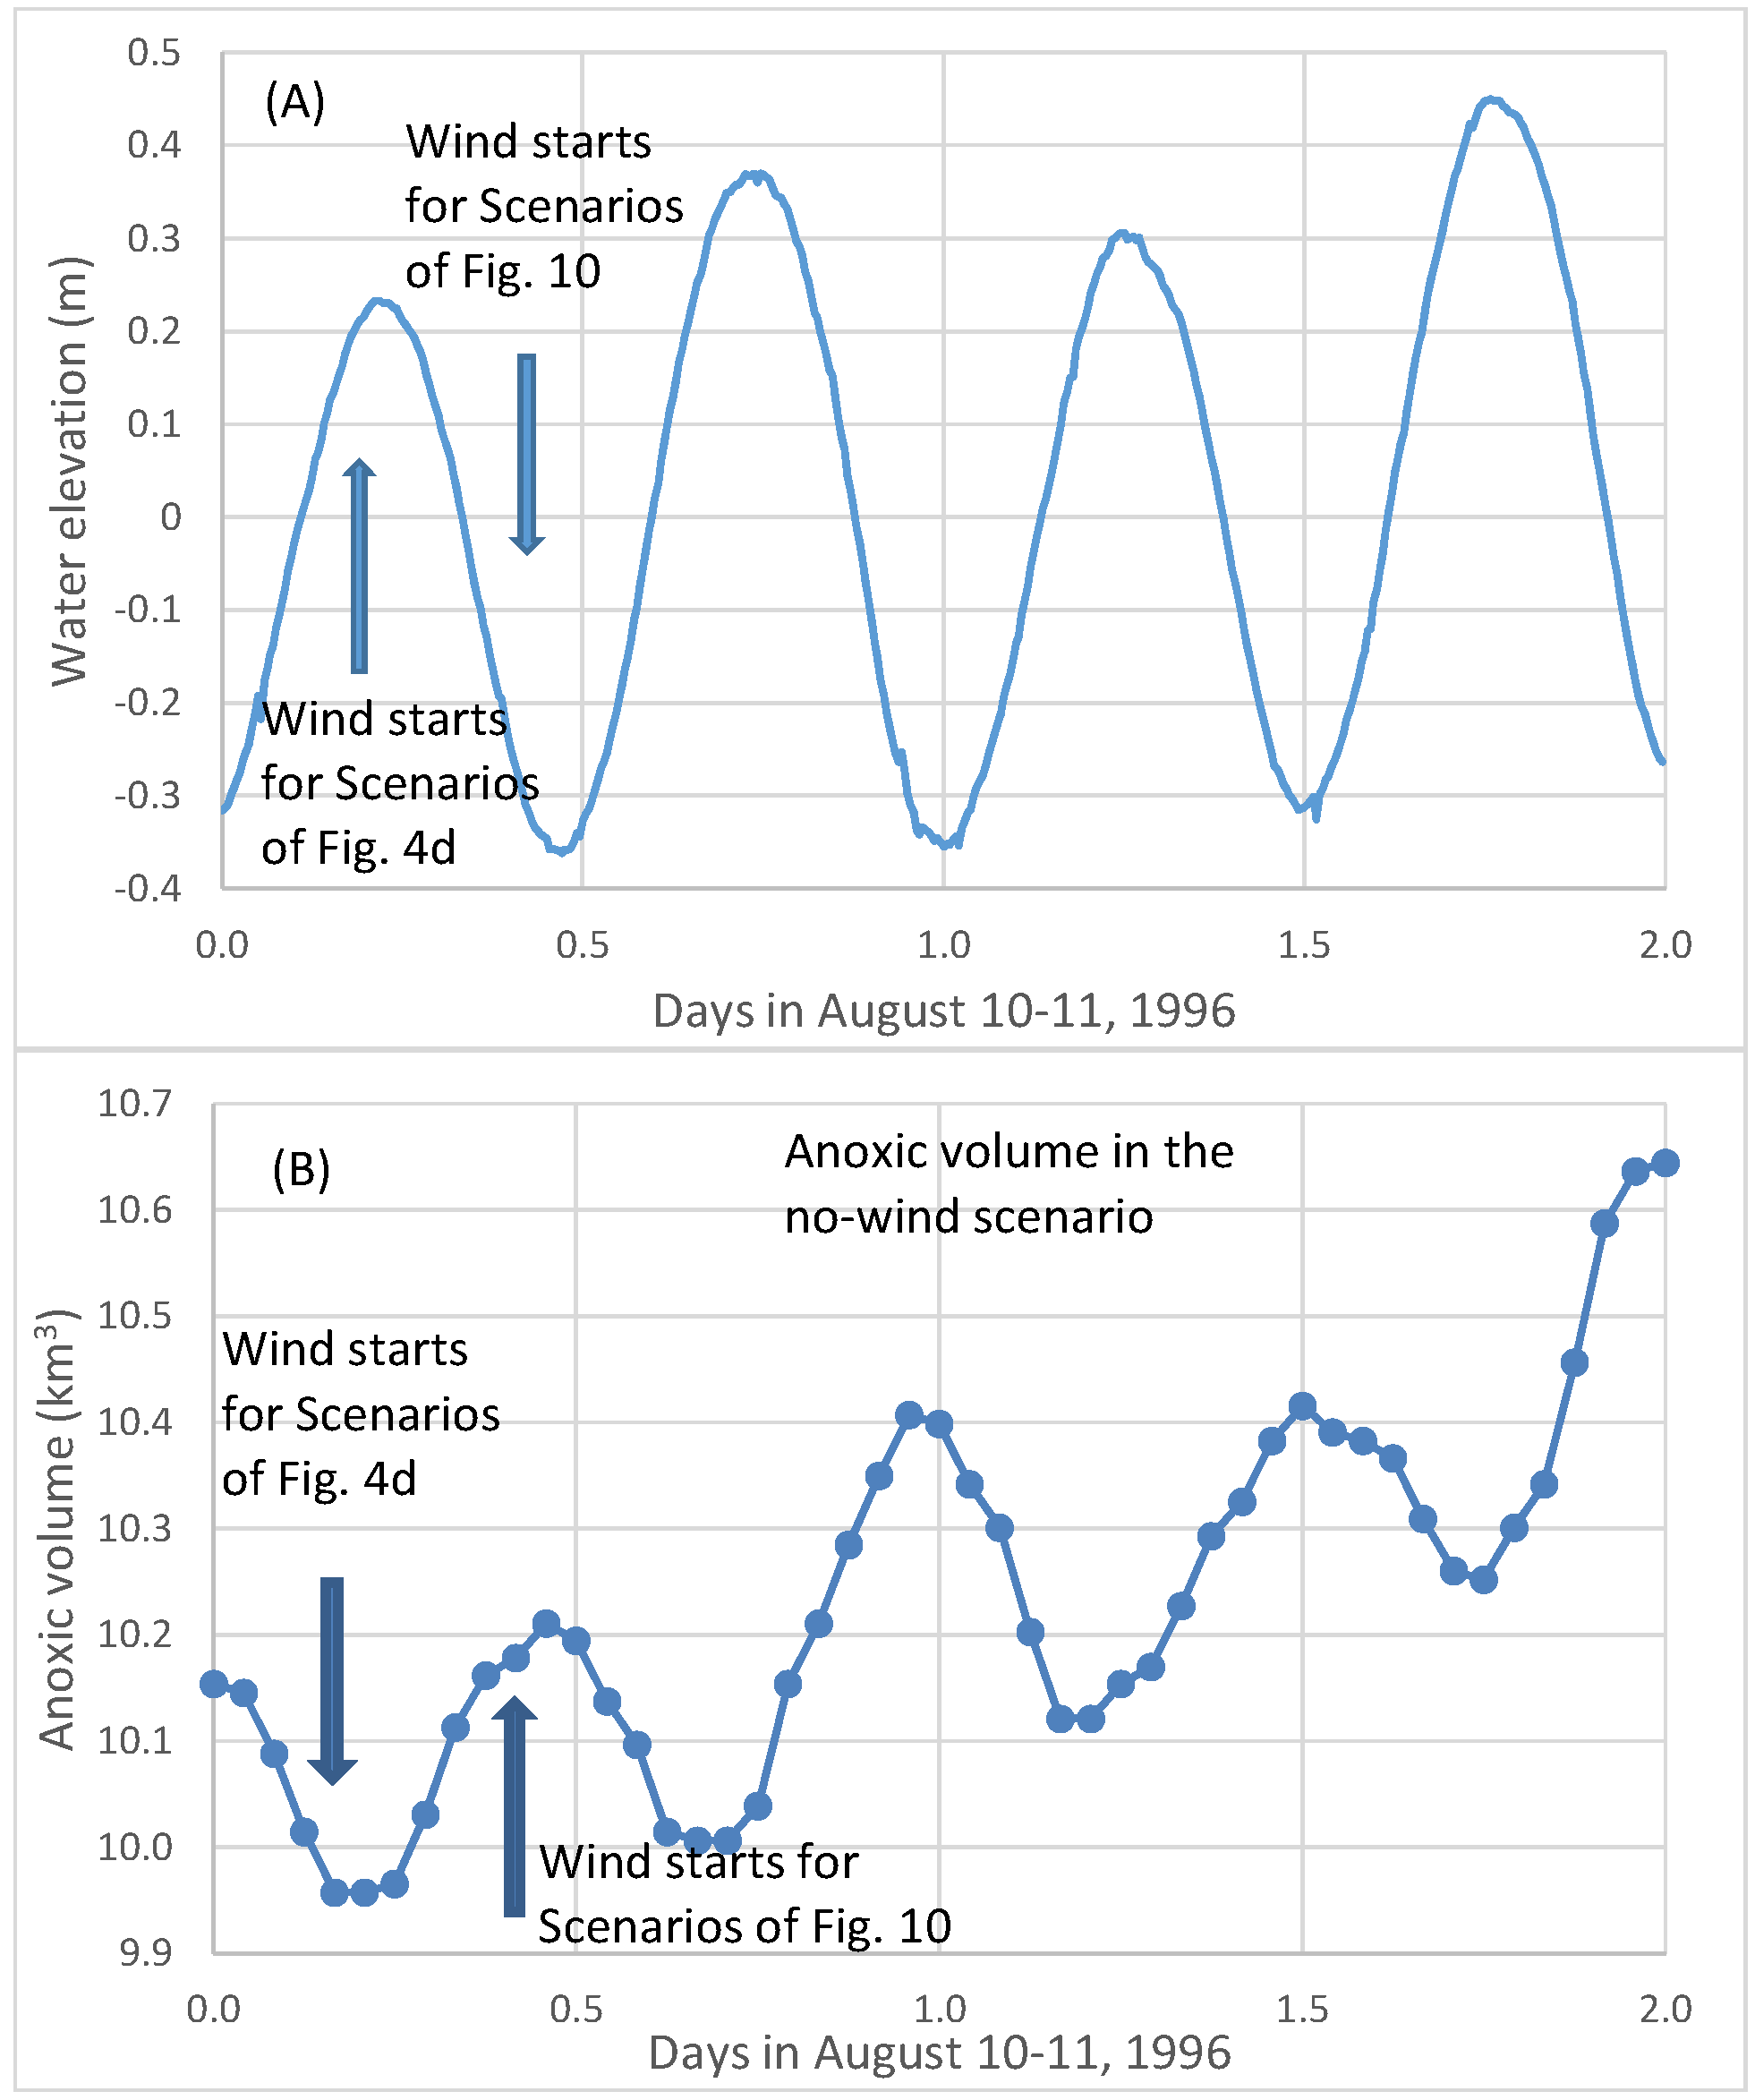
Figure 9b shows simulated hourly anoxic volume on 10 and 11 August 1996 from a no-wind scenario. The average daily anoxic volume increased from Day 1 to Day 2 due to strong oxygen consumption in early August. The two peaks and two valleys of anoxic volume in one day (Figure 9b) were associated with the M2 tide (Figure 9a). The peaks of the anoxic volume (lower DO) were associated with the stage of low-water after ebb tide, and the valleys of the anoxic volume (higher DO) were associated with the stage of high-water after flood tide. The flood tide brought oxygen-rich seawater to the anoxic zone and reduced anoxic volume. The influence of tides on the fluctuation of anoxic volume reached approximately 0.3 km3 in this simulated high anoxic period.
The first arrow in Figure 9A,B indicates the wind starting time in scenario set A_8 (Figure 4d). It started at 4:00 a.m. on 10 August 1996, near high-tide as ebbing began at the Bay mouth. The second arrow indicates the wind’s starting time for another scenario set of 8 m/s winds, but the wind event began 6 hours later, at 10:00 a.m., near low-tide when flooding began at the Bay mouth. Figure 10 plots the simulated anoxic volume reductions by the latter scenario set of 8 m/s winds.
For a better comparison of Figure 10 and Figure 4d in temporal development, the origin of the x-axis in both figures is set to 4:00 a.m. on 10 August 1996. The wind events for the scenarios in Figure 10 began 6 hours later, delineated in the graph. There is no significant difference in relative anoxia reduction among wind directions between Figure 10 and Figure 4d. In Figure 10, the northerly wind reduced slightly more anoxia, and the time transitioning from greater anoxia reductions between northerly winds and southerly winds was delayed 2 hours, to Hour 26 of the wind event. Northerly winds can have certain advantages in destratification/anoxia reduction in flood tide versus ebb tide. It is difficult to determine a reference location for tidal stages that relate to wind-induced destratification in the anoxic center, because the time difference of the co-tidal lines is approximately 6–8 hours between the Bay mouth and the anoxic center in the mid-Bay and approximately 12 hours between the Bay mouth and the Bay head [24]. The Bay mouth is used as reference location for tidal stages where the tidal changes are forced. Further analysis of this point lies beyond the scope of this work. The model experiments presented in Figure 10 and Figure 4d indicate that greater anoxia reduction by northerly winds than southerly winds before Hour 24 is not due to tidal stages during the wind events, and both experiments confirmed the argument of Wang et al. [10] regarding the modulation of wind-induced cross-channel circulation by the PN-type bathymetry.

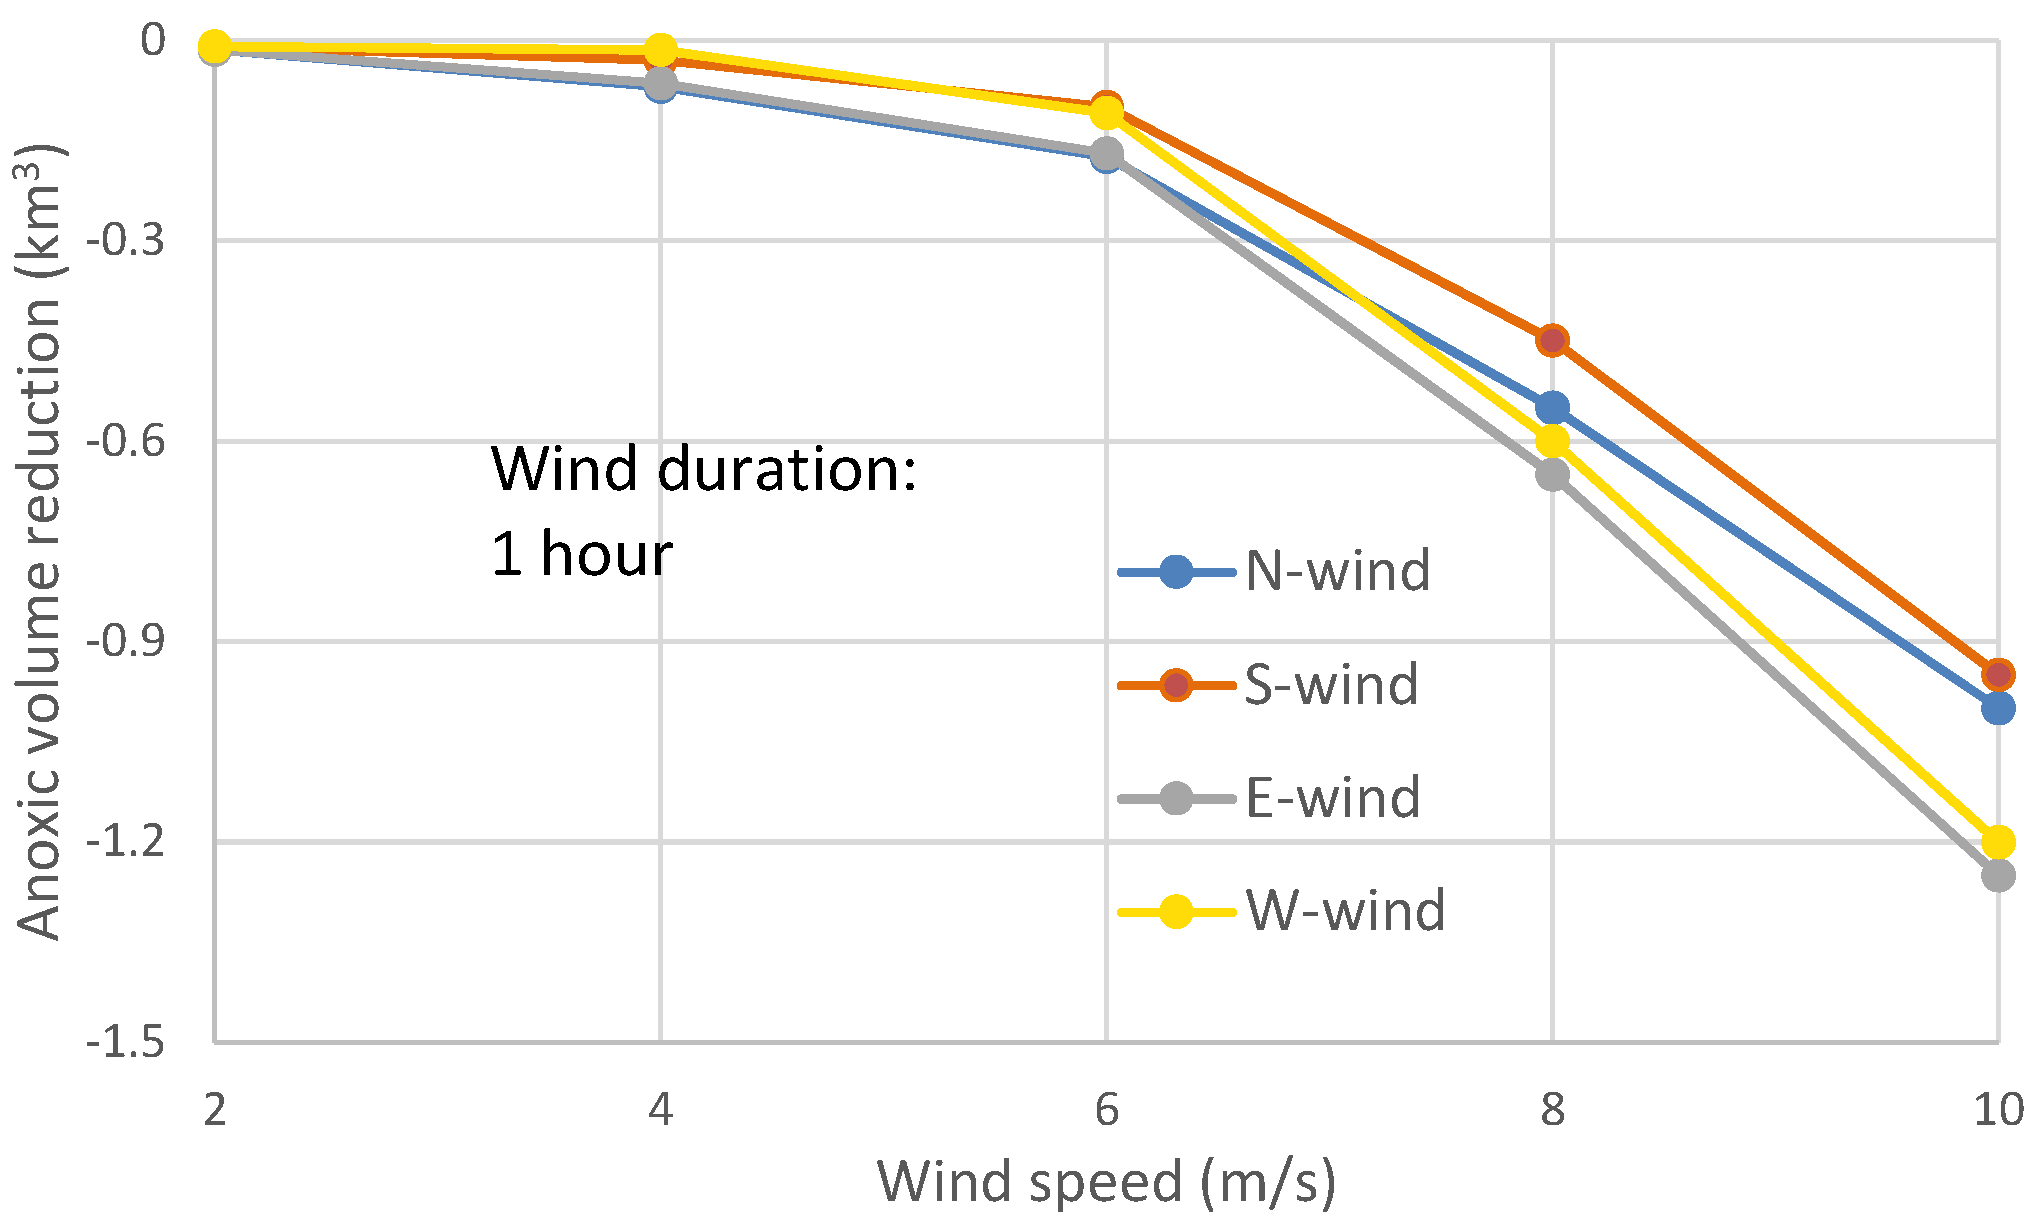
3.2. Relative Anoxia Reduction by Wind Directions in One-Hour Wind Events

Although there rarely exists a continuous calm period for a few days with only one hour of wind, it is worthwhile to conduct model experiments to assess the response of anoxia to one-hour wind events. In the model experiments of one-hour winds, the post-wind recovery of anoxia appeared soon after the wind event stopped. The peak anoxia reduction occurred about 4–5 h after the end of the wind event for wind speeds at 4–8 m/s, and occurred sooner at lower wind speeds. The maximum reduction of anoxic volume was less than 0.3 km3 at wind speeds of 6 m/s or lower (Figure 11), near the same magnitude of the tidal influence on anoxic volume (Figure 9). The differences in anoxia reduction among wind directions in wind speeds less than 4 m/s were not prominent, most are less than 0.1 km3.
The wind-induced along-channel circulation in one-hour wind events did not significantly influence the center of anoxia, while the cross-channel circulation became more important in reducing the peak anoxic volume (Figure 11). The modulation of the PN-type bathymetry caused easterly winds to reduce more anoxia than westerly winds, and northerly winds to reduce more anoxia than southerly winds.
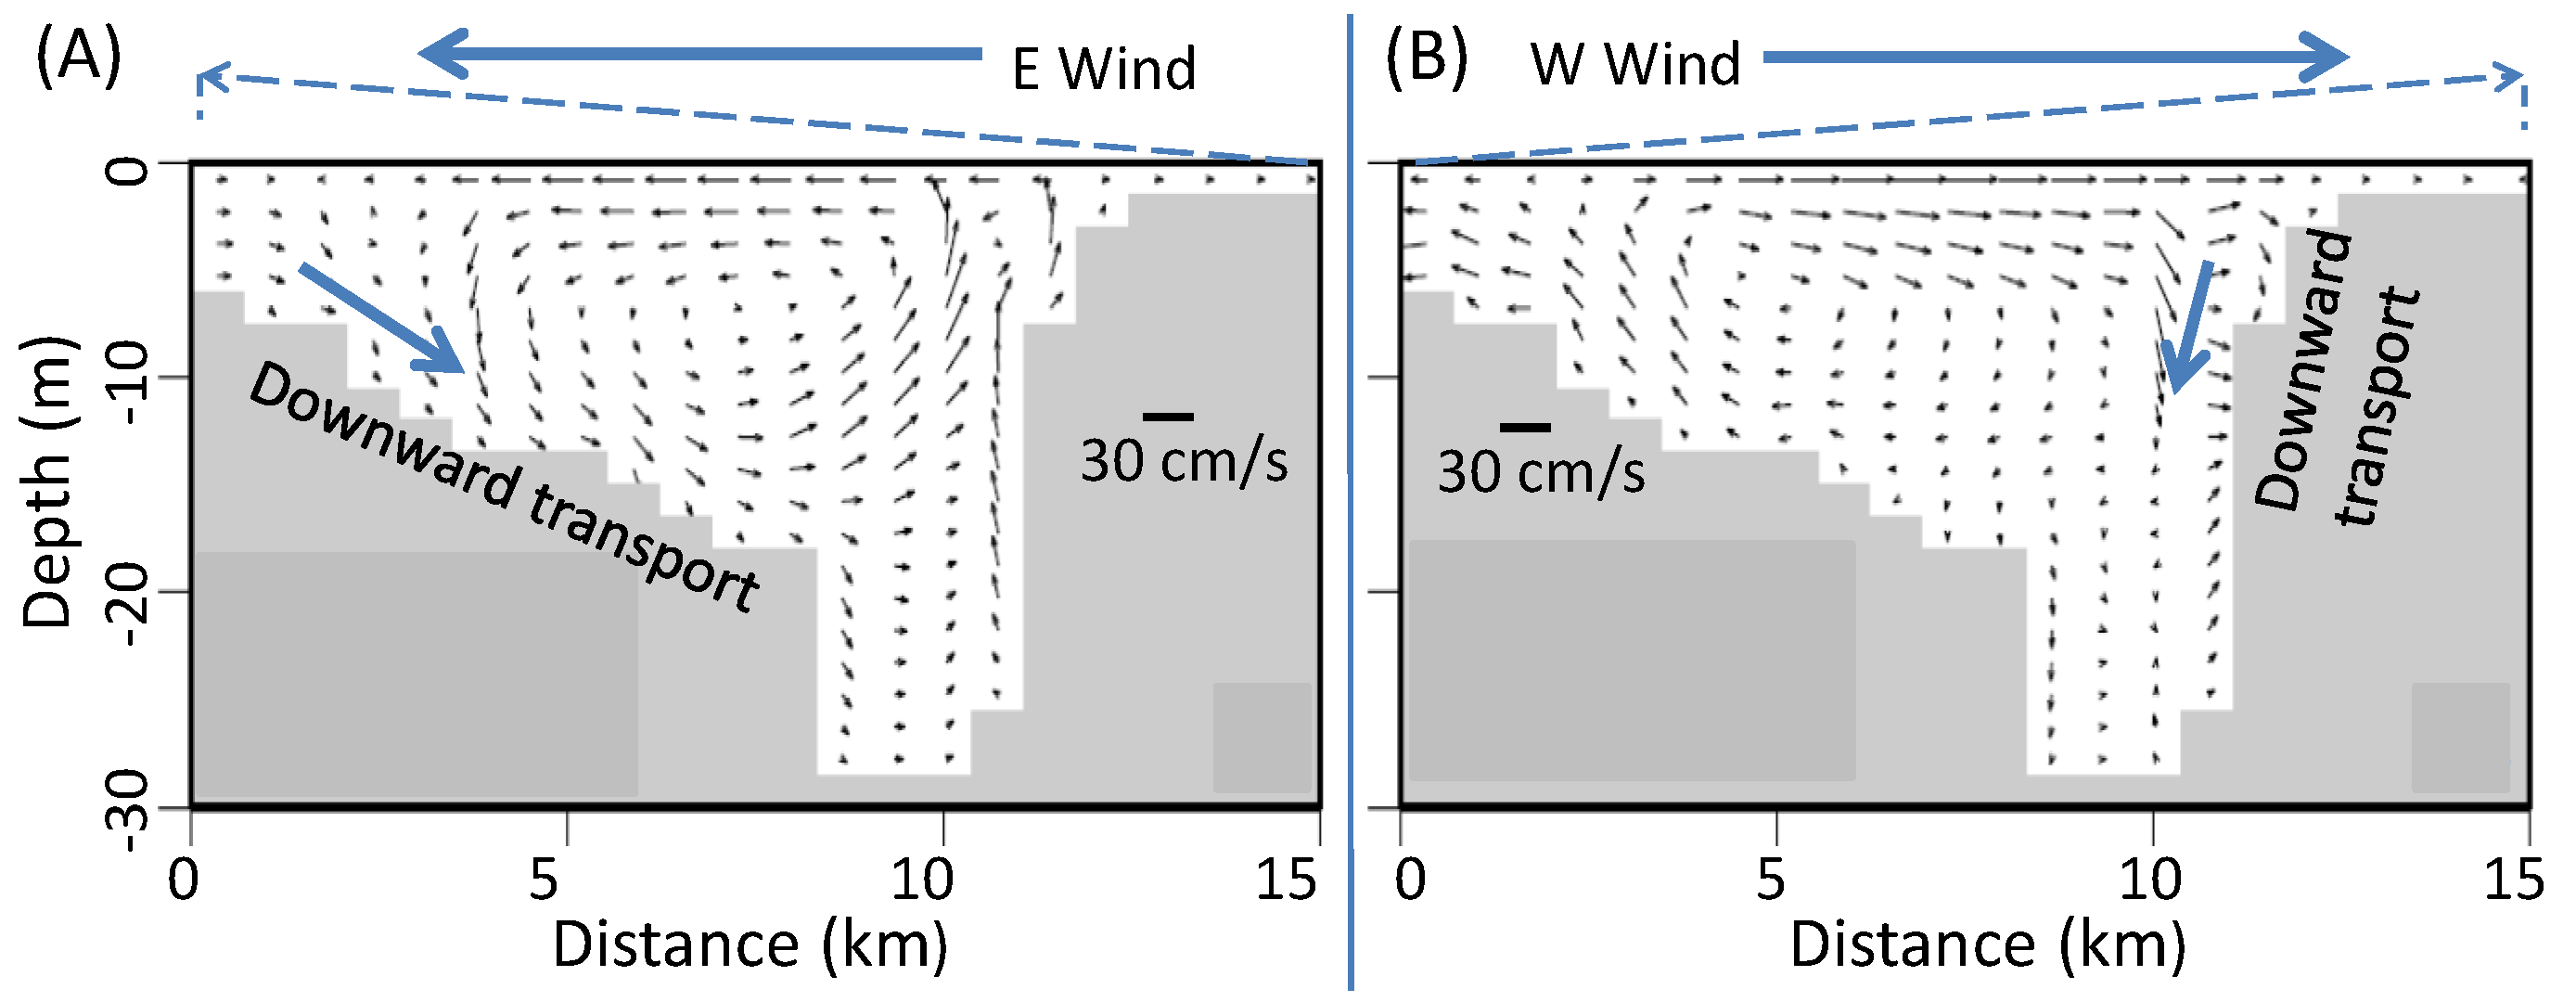
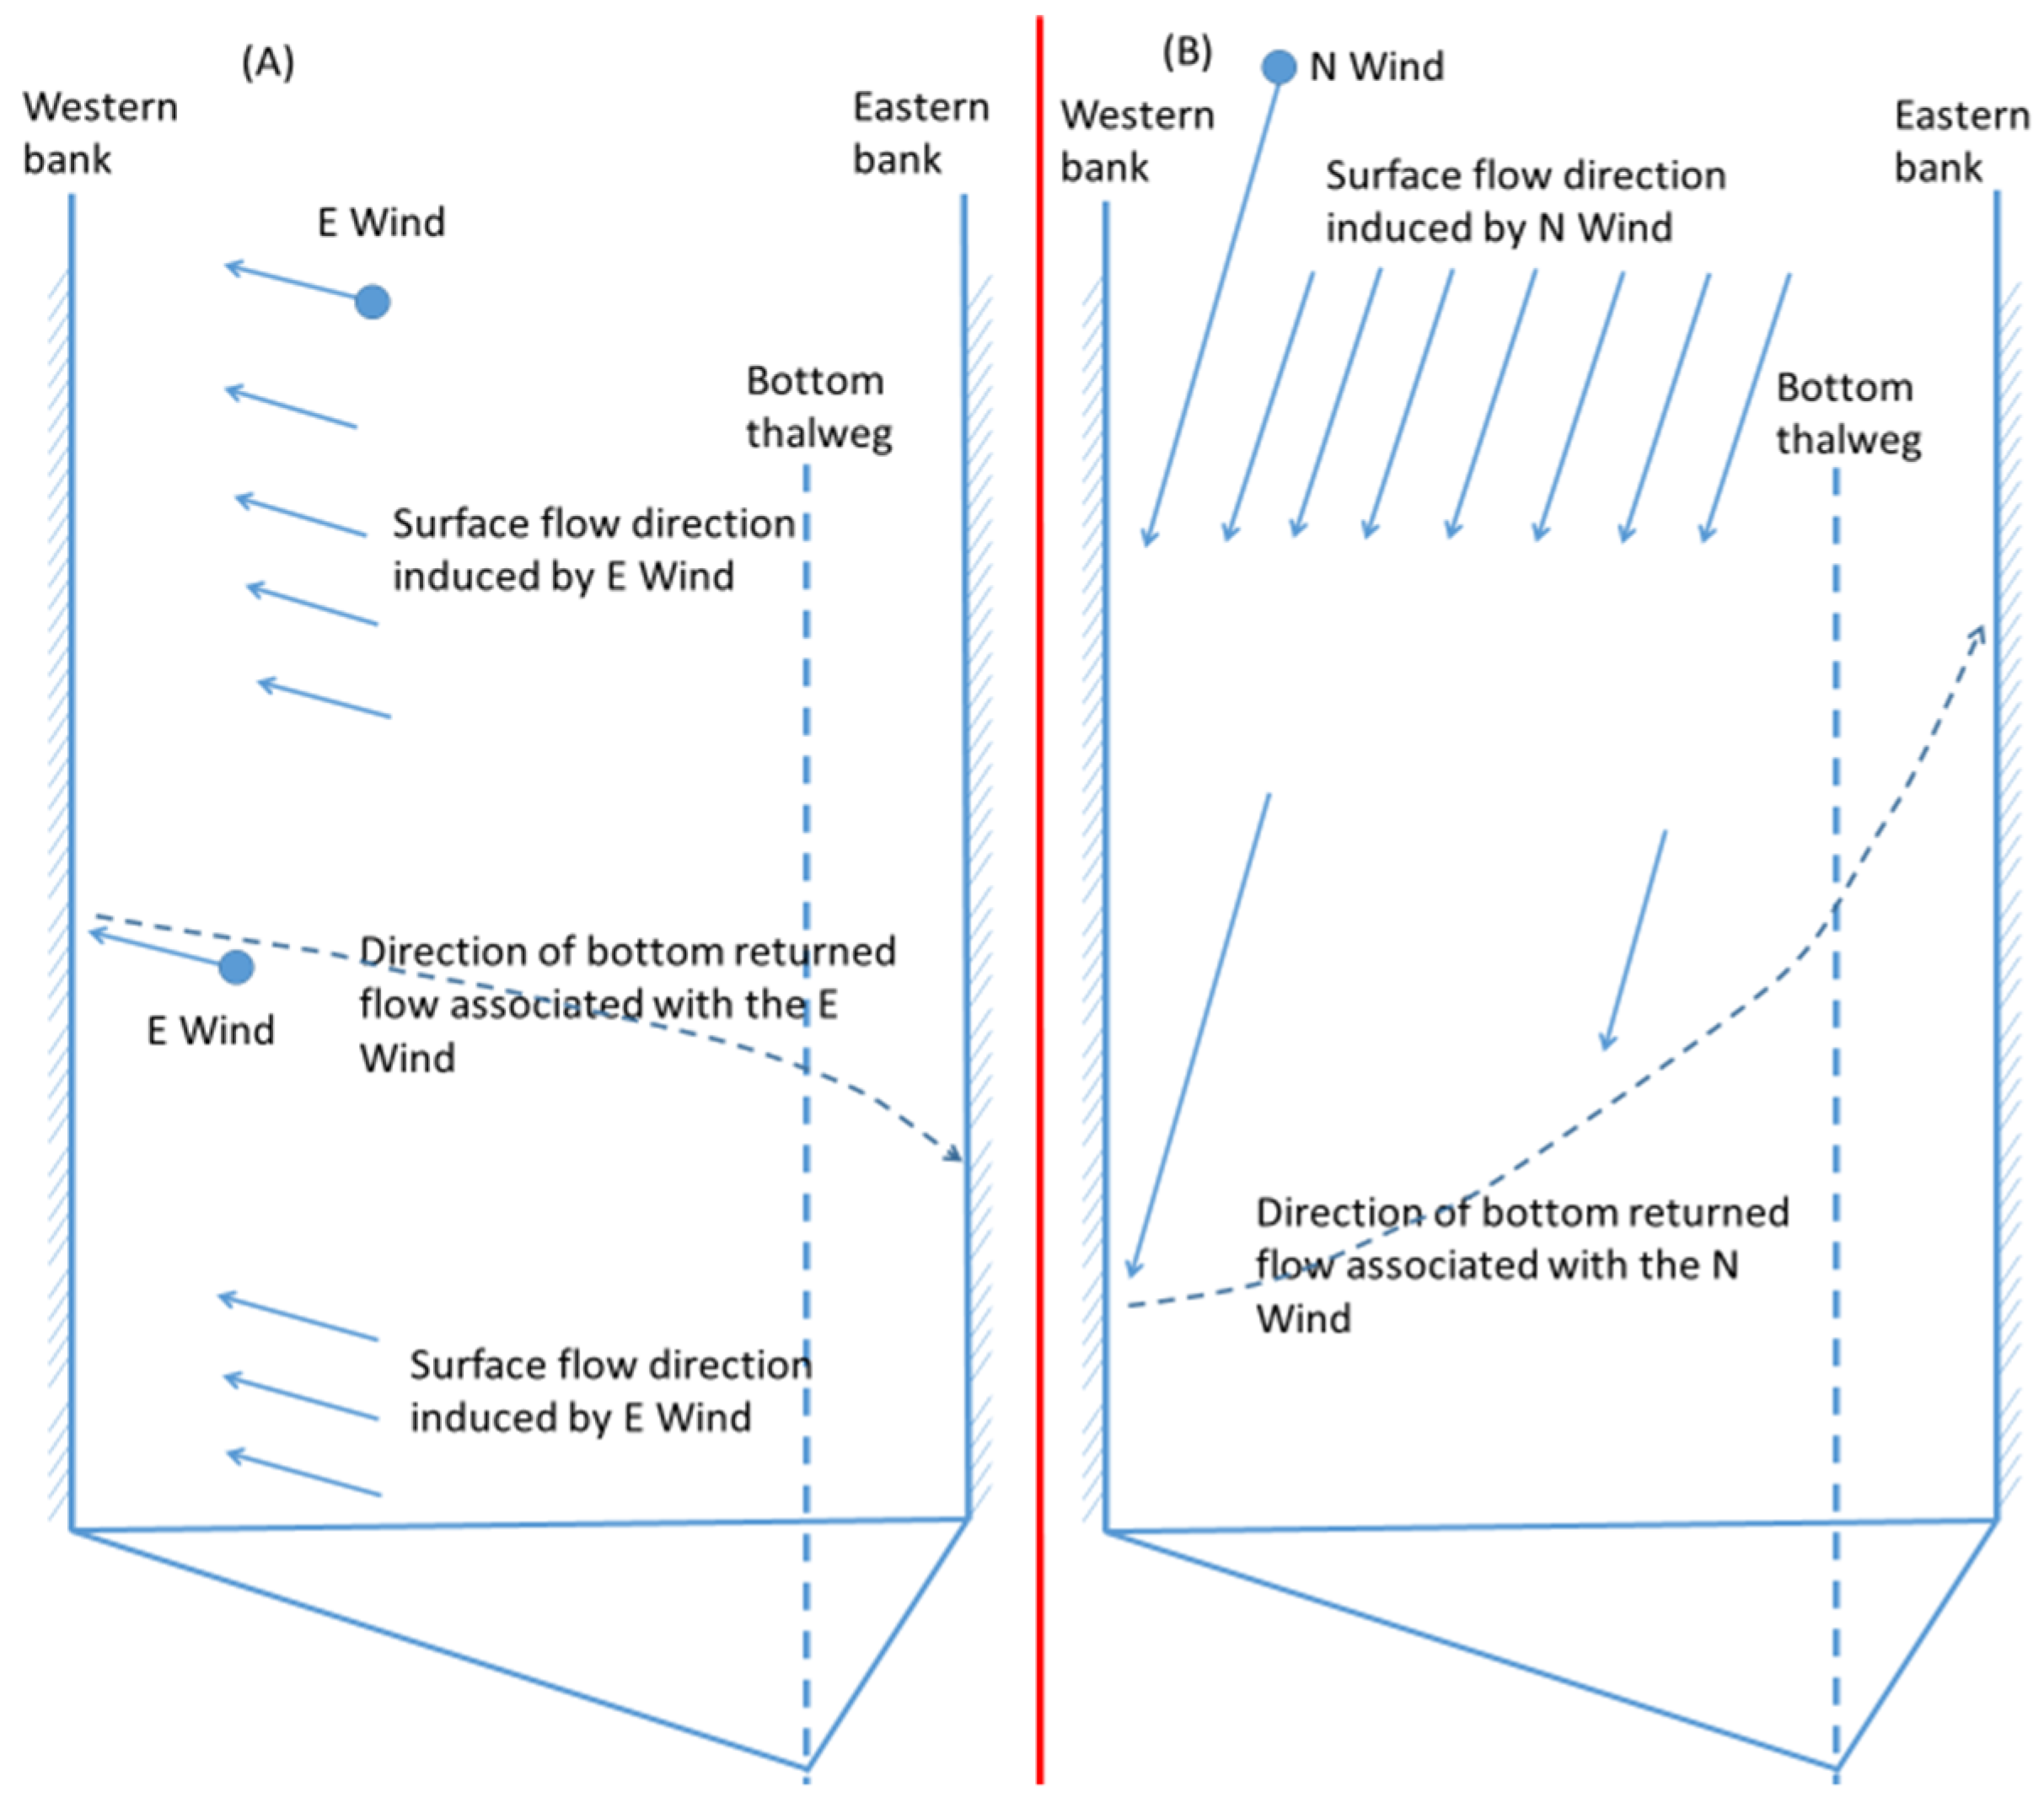
In two-day wind events, northerly and southerly winds reduced more anoxia than easterly and westerly winds, but in most cases of one-hour winds easterly (or westerly) winds reduced more anoxia than northerly (or southerly) winds, as explained in the following using Figure 12. In Figure 12, the dashed arrow approximates the returned flow along the bed from the downwind shore. The wind-induced cross-channel circulation can complete its cycle in an hour, and the deepest bottom was influenced to a certain degree, to a greater extent by easterly winds than by northerly winds, because the travel distance of the returned bottom current was shorter in easterly winds. Thus, in the one-hour wind events easterly winds had greater anoxia reduction than northerly winds. However, if the wind event continued for several hours, the wind-induced cross-channel circulation by northerly and easterly winds would involve several cycles. Because the bottom was constantly influenced by the wind-induced circulation, and not by travel distances, the anoxia reduction by wind-induced cross-channel circulation by northerly and easterly winds became similar. The northerly wind had stronger direct wind mixing (due to a longer fetch) and stronger longitudinal straining than the easterly wind, and the influence of longitudinal straining was stronger later in the wind period than the first hour of the wind event. Overall, northerly winds caused greater destratification and anoxia reduction than easterly winds in the later period of two-day wind events. Similarly, westerly winds reduced more anoxia than southerly winds if the wind event only lasted for one hour. This phenomenon is more prominent for greater wind speeds (8 or 10 m/s).
In summary, the peak anoxia reductions between opposite wind directions in the one-hour wind events (Figure 11) are comparable to the anoxia reduction in the first 2–6 h of two-day wind events (Figure 4) that are mainly controlled by wind-induced cross-channel circulation and wind induced direct mixing. These are different from the peak anoxia reductions in two-day wind scenarios (Figure 8), since the latter generates more influence by wind-induced along-channel circulation. Generally, in one-hour wind events, the northerly winds effected a greater anoxia reduction than southerly winds, easterly winds had greater anoxia reduction than westerly winds (Figure 11), and easterly (or westerly) winds had greater anoxia reduction than northerly (or southerly) winds.

3.3. Relative Anoxia Reduction among Wind Directions during Prolonged Unidirectional Winds

3.3.1. Anoxia Reduction by Wind Directions in 20-Day Wind Events

When a unidirectional wind event is extended to 20 days, the peak anoxia reduction occurs at a later time, between Day 21 and 23 or 1–3 days after the end of the wind event (Figure 13). As the wind event continues past two days, the roles of wind-induced along-channel circulation can play a greater role in destratification and anoxia reduction. In addition, the enhanced estuarine circulation in the northerly or westerly winds would contribute more to anoxia reduction. The combination of wind-induced along and cross-channel circulation would be expected to produce more complicated phenomena related to anoxia reduction.
At wind speeds of 2 m/s, the influence of anoxia reduction by wind-induced along-channel circulation is insignificant and occurs later than winds of greater speeds, while the bathymetry-modulated wind-induced cross-channel circulation becomes more important, which favors greater destratification by northerly over southerly winds. On the other hand, the enhanced estuarine circulation by northerly winds also plays a role in hypoxia reduction. Thus, northerly winds reduce more anoxia than southerly winds during the entire wind period for both the two-day (Figure 4a) and 20-day (Figure 13a) wind events. For easterly versus westerly winds in both two-day and 20-day wind events, prior to the end of Day 1, the easterly wind reduced more anoxic volume than the westerly wind. This is because during the early part of the wind event, the returned bottom current by wind-induced longitudinal circulation had not influenced the Bay center, while the wind-induced cross-channel circulation was dominant. With the modulation of the cross-channel bathymetry, easterly winds caused a greater hypoxia reduction than westerly winds. From Day 2 onwards, westerly winds caused greater hypoxia reduction than easterly winds in both the two-day (Figure 4a) and 20-day (Figure 13a) wind events due to enhanced estuarine circulation by westerly winds.
At wind speeds of 4 m/s (Figure 13B), wind’s destratification began to play a greater role in anoxia reduction. After Day 3, southerly winds reduced more anoxia than northerly winds because of a greater influence by wind-induced along-channel circulation. This transition was not observed in the two-day wind event (Figure 4B) since wind stopped prior to Day 3. On easterly versus westerly winds, in both the 20-day wind and two-day wind events there was a transition from more anoxia reduction by easterly winds to westerly winds at approximate the end of Day 1 (Figure 13B and Figure 4B). Prior to the end of Day 1, the bathymetry-modulated wind-induced cross-channel circulation played a greater role in anoxia reduction; after Day 1, the enhanced estuarine circulation by the westerly wind began to play a greater role. The returned bottom currents by wind’s along-channel straining are due to downwelling at the Bay head or mouth region. Since this response is a Bay-wide process, it could take an extended period, e.g., 8–31 h to influence the bottom of the mid-Bay [25]. Extended travel time is needed for the down-bay-ward returned bottom current induced by southerly or easterly winds, because the current direction is against the seawater intrusion. It was estimated to be about 0.5–1 day for the returned bottom current in 8 m/s southerly winds to effectively influence the anoxic center in the mid Bay [10]. Compared to northerly or southerly winds, under the same wind speeds in easterly or westerly winds, there was much weaker along-channel straining. For 4 m/s easterly winds, it was estimated to take more than five days for the returned bottom current (from the Bay head) to show an effective influence on the anoxic center. Figure 13B shows that a 20-day wind event at 4 m/s, the easterly wind begins to reduce more anoxic volume than the westerly wind on Day 7.5. This is potentially due to the returned bottom current, because at this time the returned bottom current associated with the easterly wind gradually plays its role. The overall response of DO is a combined effect of bathymetry modulated cross-channel circulation and the returned bottom flow that favors easterly winds a greater anoxia reduction over westerly winds after Day 7.5, although the influence of enhanced estuarine circulation by westerly winds can be more effective as the unidirectional wind prolonged. In the 20-day wind scenarios, the second transition to greater anoxia reduction from westerly to easterly winds modeled at speed of 4 m/s (Figure 13B) did not exist at speeds of 2 m/s (Figure 13A) because of weak destratification that reduced easterly winds’ effectiveness. This transition is also absent from the scenarios of two-day wind at speeds of 4 m/s (Figure 4B), because wind stopped after Day 2.
At wind speed of 8 m/s, wind’s destratification was strong, and was the main factor in reducing anoxia. Similar to a two-day wind event at the same speed (Figure 4D), after Day 1 in the 20 day wind scenario, southerly winds reduced more anoxia than northerly winds (Figure 13D) as wind-induced along-channel circulation outweighed the effects of wind-induced cross-channel circulation. As winds continued after Day 2, relative anoxia reductions between opposite wind directions changed. In this prolonged unidirectional wind event northerly winds’ addition of oxygen-rich seawater by enhanced estuarine circulation factored more heavily. After Day 4, the rate of anoxia reduction (by referring to the slope of the curves, Figure 13D) was greater by northerly winds than by southerly winds, and the two curves intersected on Day 11.5. From this point onwards, northerly winds reduced anoxia more than southerly winds. Of the two transitions seen in Figure 13D, only the first at Hour 24 from northerly to southerly winds was present in the two day wind event.
In the 8 m/s two-day wind scenarios, easterly winds had greater maximum anoxia reduction than westerly winds (Figure 4D) throughout the entire period. In 20-day wind scenarios, easterly winds still had greater maximum anoxia reduction than westerly winds (Figure 13D), but underwent two transitions (at Day 4 and Day 14) in relative anoxia reduction between the two wind directions. In the first few hours, the PN-type bathymetry modulated cross-channel circulation caused easterly winds to reduce more anoxia than westerly winds. This was controlled by the destratification-related anoxia reduction, in which easterly winds caused a greater destratification than westerly winds. After Day 2, the rate of anoxia reduction was greater for westerly than easterly winds (referring to the slope of the curves, Figure 13D), again mainly due to enhanced estuarine circulation, but the anoxic volume was still lower in the easterly winds. At Day 5, westerly winds began to yield lower anoxic volume, but the rate of anoxia reduction began to slow down to a point that yielded similar amount anoxic volume as the easterly winds did. During this time following the transition, the up-Bay-ward component of longitudinal straining by easterly winds induced downwelling at the Bay head and a return down-Bay-ward bottom current bringing fresher water to the Bay’s anoxic area. Combined with PN-type bathymetry modulated cross-channel circulation, on Day 16, easterly winds then began to exercise greater anoxia reduction. These were controlled by multiple mechanisms including wind’s along-channel straining, cross-channel straining, the modulation of bathymetry, the supply of oxygen-rich water by returned bottom flow from the Bay mouth or head, the influence of tide, etc. A detailed hydrodynamic analysis and quantification of these multiple effects are needed to explain the detailed phenomena, but they are beyond the scope of this work. Besides destratification, the up-Bay-ward along-channel straining by southerly or easterly winds can cause downwelling of oxygen-rich freshwater at the Bay head and be transported down-Bay-ward by the bottom return force. Since the direction goes against the bottom current of the estuarine circulation, its influence could be less significant compared to other factors influencing anoxia.
At wind speeds of 6 m/s, the wind-induced destratification among all wind directions and wind-enhanced estuarine circulation by northerly and westerly winds are moderately strong in 20-day wind events. The differential responses of anoxia reduction among wind directions (Figure 13C) are in between the scenarios with velocities of 4 and 8 m/s (Figure 13B,D).

3.3.2. Anoxia Reduction by Wind Directions in Year-Long Unidirectional Winds

Figure 14 plots simulated daily anoxic volumes from Scenario Set H, which models year-long unidirectional winds. Here, the wind speeds were the same as the observed in all scenarios except zero for Scenario Y96_0. Southerly and northerly winds resulted in lower anoxic volume than easterly and westerly winds (Figure 14) because of the longer fetch and greater potential for destratification. The anoxic volume simulated using the observed wind (obs wind) lies in between the northerly-southerly winds and the easterly-westerly winds (Figure 14), as the observed wind directions varied with time. The sum of anoxic volume-day over the year (487 km3) was less than that affected by northerly-southerly winds, and greater than that affected by easterly-westerly winds. The no-wind scenario yielded the highest anoxic volume, two times greater than that observed.
In two-day wind scenarios at 8 m/s, southerly winds reduced more anoxia than northerly winds (Figure 4D). This relationship was reversed for year-long winds, in which northerly winds had a lesser anoxic volume (Figure 14). For the short two-day wind period, the promoted bottom seawater intrusion in the northerly wind was insignificant, while the stronger destratification by the southerly wind could effectively influence the Bay’s anoxic center and increase bottom DO. Under longer periods of unidirectional wind, promoted seawater intrusion by northerly winds became prominent, reducing anoxia significantly.
The relative strengths of anoxia reduction by easterly and westerly winds for the two scenario sets of contrasting durations (Figure 4D and Figure 14) were also opposite. The PN-type bathymetry in the anoxic center provided favorable conditions for greater destratification by easterly winds [10]. In short wind events, easterly winds caused greater destratification and reduced more anoxia. However, under a prolonged westerly wind, its southward component of straining promoted the intrusion of oxygen-rich seawater. During year-long unidirectional winds westerly winds’ anoxia reduction could supersede the easterly winds’ destratification-related anoxia reduction.
The relatively weak winds in 1996 could be another factor. The winds in the summer of 1996 were relatively weak, mostly (>80%) below 4 m/s, with wind velocities only exceeding 8 m/s for a few hours (≤5%). Therefore, the mechanisms of anoxia reduction in the 20-day winds of 2 or 4 m/s (Figure 13A,B) can be more useful to explain the simulated phenomena in the year-long wind scenarios. In weak winds, the destratification-related anoxia reduction by southerly or easterly winds becomes less significant, while enhanced seawater intrusion under prolonged unidirectional northerly or westerly winds becomes more important in reducing anoxia.
The Bay mouth lies at the south of the Bay, facing east. A prolonged southerly wind could extend the estuarine residence time, which could promote eutrophication process. The easterly wind has westward and northward straining components on the surface water movement, and could also extend the residence time. Notably for easterly winds, anoxia occurred earlier and produced greater anoxic volume than the no-wind condition in the late spring and early summer (Figure 14). This was mainly due to the trapping of nutrients in the Bay and weaker destratification than southerly or northerly winds. Although westerly winds caused even weaker destratification than easterly winds, prolonged westerly winds effected more seawater intrusion and shorter residence times yielding lower anoxic volumes. The unidirectional wind event began on 1 January in this set of scenarios and the retarded residence times could significantly affect the biochemical processes in the spring and oxygen consumption in the summer. Because the two-day wind scenarios began in August and only lasted for a short period, the differential hypoxia reduction between wind directions was mainly controlled by wind’s mixing and estuarine circulation, while the differences in biological processes’ associated residence times were negligible.

3.4. Intermittent Hourly Winds: Scenario Set D

In contrast with the Core Scenario set of constant wind speeds, in Scenario Set D the wind intermittently stopped for every odd-hour and blew at 8 m/s during even hours. Scenario Set D yielded a 1.5–2 km3 smaller reduction in anoxic volume than the counterpart wind directions of the Core Scenario (Figure 15). Still, the anoxia reductions by Scenario Set D were greater than their counterpart wind directions at constant speeds of 6 m/s (Figure 8), suggesting that intermittent winds can still strongly reduce anoxia as long as the speed reaches a certain threshold that causes destratification.

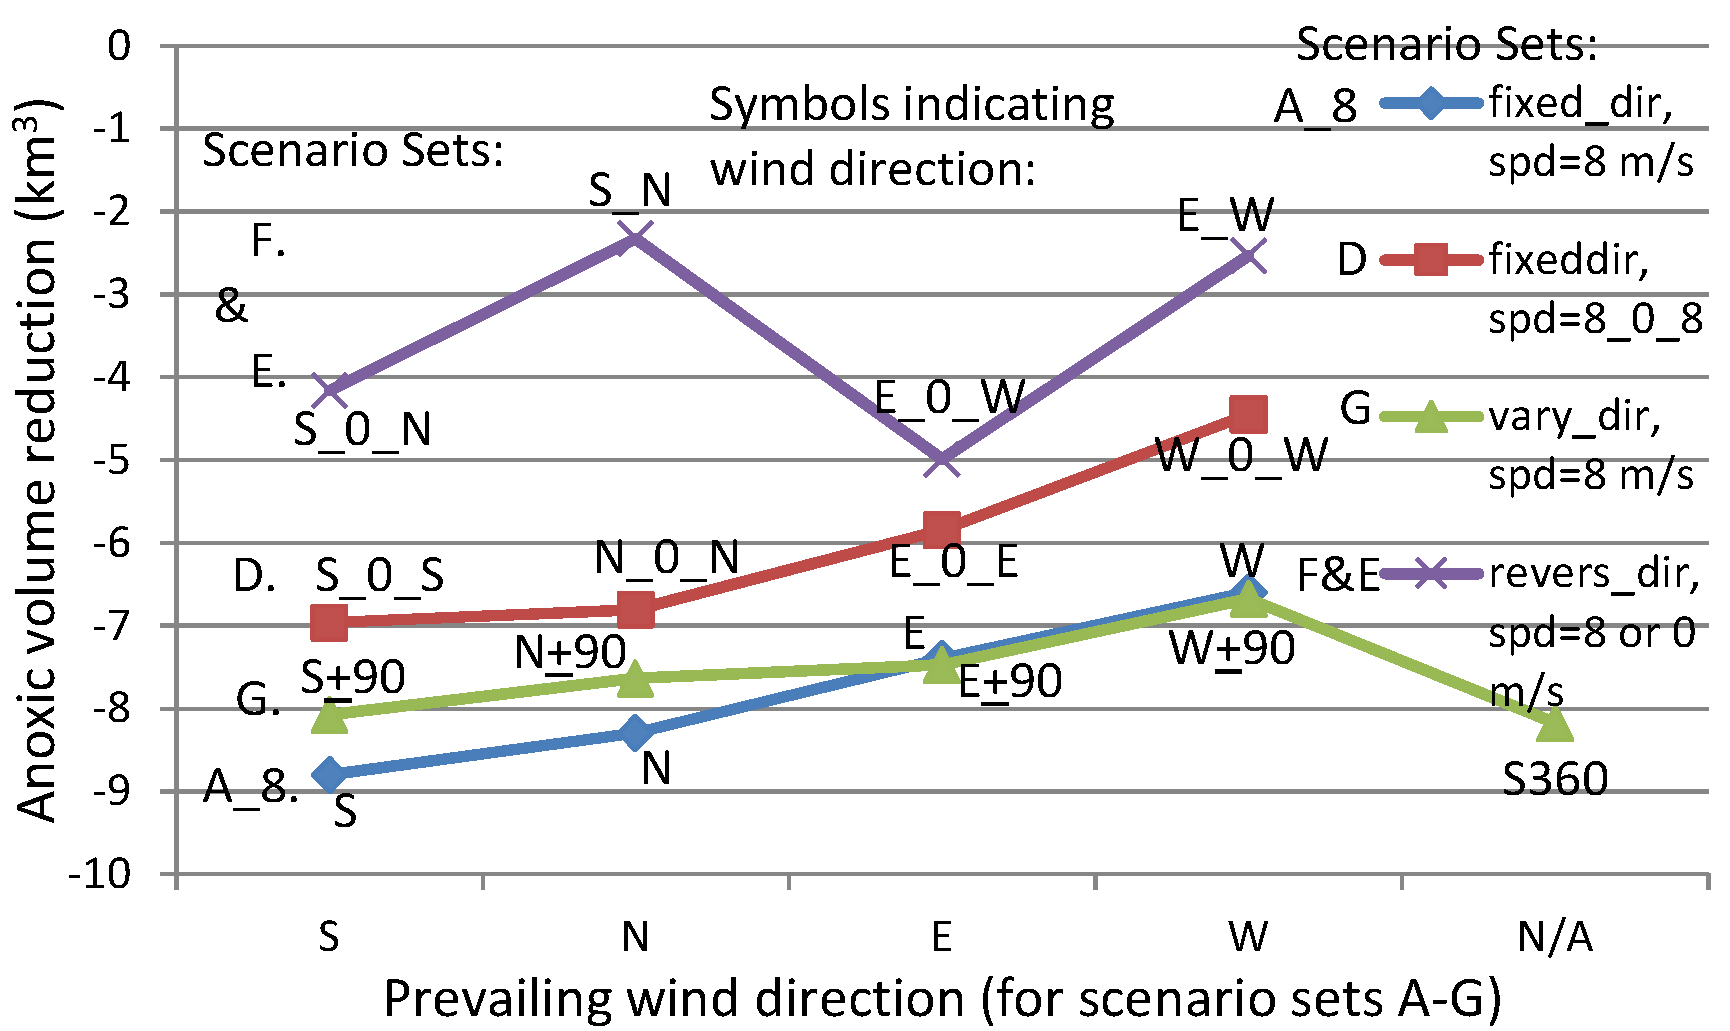
3.5. Winds of Hourly Reversing Directions: Scenario Sets F and E

Scenario S_N of Scenario Set F switches between southerly and northerly wind directions every hour, and is used to compare the southerly and northerly winds of Scenario A_8 (Figure 15). Similarly, Scenario E_W is used to compare the easterly and westerly winds of Scenario A_8. All have speeds of 8 m/s over a two-day period. The frequent switching seemed to negate the effects of the preceding wind direction. The anoxia reduction by Scenario E_W was 4–5 km3 less than the reduction by constant westerly or easterly winds, and the anoxia reduction by Scenario S_N was 6–7 km3 less than the reduction by constant northerly or southerly winds (Figure 15). With intermittent no wind between reversing wind directions (e.g., Scenario S_0_N or E_0_W) the reduction of anoxic volume was approximately 2 km3 more than the S_N or E_W scenarios. Nevertheless, Scenario S_0_N and E_0_W still had a reduction in anoxic volume of 3–4 km3 less than the constant unidirectional southerly or northerly winds and easterly or westerly winds, respectively.
The anoxic volume reduction by Scenario E_0_W lies in between reductions modeled in Scenarios E_0_E and W_0_W. Scenario E_0_E had more frequent easterly winds than the other two scenarios, and yielded more anoxia reduction. The intermittent no wind between switching directions in Scenario E_0_W weakened the cancellation of anoxia reduction processes by the two switching wind directions, therefore, still had a greater anoxia reduction than Scenario W_0_W. Cross-channel circulation was important in destratification by easterly and westerly winds. The widths of cross channel around the anoxic center were narrow. The wind’s effect could be effectively realized within the one-hour period of calm. The next phase of wind in opposite direction generated the next round of reduction. Because of more frequencies in easterly wind, Scenario E_0_W had a greater anoxia reduction than Scenario W_0_W. While, Scenario E_W had no calm period between changing directions, significantly reducing destratification.
Compared to Scenario N_0_N and S_0_S, Scenario S_0_N had an approximately 3 km3 lesser reduction of anoxic volume. The wind-induced circulation of along-channel transport by northerly or southerly winds could not be completed within a single hour. Reversing wind directions weakened the actions of the preceding wind direction. Therefore, Scenario S_0_N had weaker anoxia reduction than both Scenarios S_0_S and N_0_N. Scenario S_N switched wind directions between southerly and northerly each hour without a calm period, and yielded even weaker anoxia reduction. This model experiment confirms that wind-induced along-channel circulation affects the anoxic center much more slowly than wind-induced cross-channel circulation.

3.6. Winds with Rotating Directions at Fixed Speeds of 8 m/s: Scenario G

A comparison of anoxia reduction among scenarios with ± 90 degrees rotation about a central direction every 4 h (Scenario Set G) and the Core Scenario was also completed. For a scenario rotating about a southerly or northerly central direction (S ± 90 or N ± 90), the anoxic volume reduction was about 0.6 km3 less than that caused by the winds of fixed southerly or northerly direction (Figure 15). This can be attributed to the addition of easterly and westerly winds (Table 2), which had shorter fetch and generated weaker destratification than southerly or northerly winds. For scenarios rotating about an easterly or westerly central direction (i.e., E ± 90 or W ± 90), anoxia reductions were slightly increased than the corresponding easterly (E) wind or westerly (W) wind of Core Scenario A_8, because of the inclusion of southerly and northerly winds.
Scenario S_360 had a decreased reduction in anoxia than the wind in a constant southerly direction did, as expected. Surprisingly, it also reduced more anoxia than Scenario S ± 90 did, and the causes are unclear. It is hypothesized that a continuous rotating direction is more effective in destratification and anoxia reduction than a rotation backwards along an already traversed path that could weaken the anoxia reduction effects of a prior wind direction.
These scenarios indicate that turbulence induced by winds of gradual changing directions at a similar speed generally can continue to weaken stratification. In many cases, directional change of 90 degrees does not significantly cancel out wind induced circulations. It is more likely that conditions in the Chesapeake Bay often lie somewhere in between scenarios G and D. For time scales of a few days, in most cases a prevailing southerly wind would cause greater anoxia reduction than a prevailing northerly wind, and would also hold true for prevailing easterly versus westerly winds. However, for month-long prevailing unidirectional wind the relative anoxia reductions between opposite wind directions can exhibit different anoxia reduction patterns, which will be discussed in the next section.

3.7. Scenarios Based on Naturally Occurred Month-Long Prevailing Winds: Scenario I

June 1996 and July 2004 both had observed prevailing southerly winds, although other directions were included intermittently (Figure 3). Southerly prevailing winds in Scenario Y96_obs were flipped in Scenario Y96_cw180 (Table 6) becoming northerly prevailing winds, which yielded lower anoxic volume than Scenario Y96_obs. Scenario Y96_cw90’s prevailing westerly winds yielded lower anoxic volume than the scenario of prevailing easterly winds (Y96_cw270). Scenarios with prevailing northerly or southerly wind also yielded lower anoxic volumes than either the scenario of prevailing easterly or westerly wind. The results are comparable to the relative anoxia reductions by scenarios with low wind speeds (e.g., 2 or 4 m/s) of two-day winds (Figure 4A,B), and year-long unidirectional wind scenarios (i.e., Scenario Set H, Figure 14).
Similar phenomena were also found from scenarios of rotating wind direction in July 2004. The same patterns held in this instance, although westerly prevailing winds (Y04_cw90) also yielded slightly lower model estimated anoxic volume than southerly prevailing winds (Y04_obs). This was due to a greater frequency of westerly (and easterly) winds with the prevalent southerly winds in the July 2004 condition (Figure 3B) than in the June 1996 condition (Figure 3A). When rotating 90 degrees to prevail westerly in scenario Y04_cw90, there were considerable frequencies in northerly (and southerly) winds. Superposed by the influence of northerly winds to the promoted saline water intrusion by the month-long westerly prevailing winds, slightly lower simulated anoxia was generated, in contrast with the original prevailing southerly wind field.
Besides the prevailing wind directions, the wind-rose (Figure 3) also shows relative frequency of other wind directions in June 1996 and July 2004. However, it cannot determine whether the prevailing wind events were frequently interlayered by events of other wind directions, or whether the events of prevailing direction and the other directions were aggregated separately in two periods. The impact on anoxia reduction could differ between the two cases. The initial anoxia intensities and wind speeds and directions prior to the time period of model analysis could affect. These questions can be studied further through more model experimentation, but are beyond the scope of this work.

4. Conclusions

The model experiments in this work analyzed the impact of wind speed and duration on relative hypoxia reductions for opposite wind directions within the north-south oriented Chesapeake Bay. Besides presenting the reduction of summer hypoxia by wind’s mixing and destratification-related processes, this study further explores another process of hypoxia reduction by wind; this process is primarily associated with enhanced estuarine circulation bringing oxygen-rich seawater to the Bay via winds with down-estuary straining components, i.e., northerly and westerly winds. In strong wind events equal to or greater than 6 m/s, model experiments showed that destratification processes are the main mechanisms by which wind can reduce anoxia. At low wind speeds (e.g., 2 m/s) or in prolonged unidirectional wind events, an enhanced estuarine circulation-related process plays a greater role in hypoxia reduction.
For two-day wind events of speeds equal to 8 m/s, easterly winds cause greater hypoxia reduction than westerly winds because of greater destratification (Wang et al., 2016) [10]. This is primarily due to the modulation of the PN-type bathymetry to wind-induced cross-channel circulation, where the easterly wind causes a greater destratification and hypoxia reduction than the westerly wind in the strongly stratified Chesapeake summer. The second reason is that easterly winds have an up-Bay-ward component of straining that cause greater destratification than westerly winds. However, at low wind speeds, e.g., 2 m/s, when stratification is well preserved or in prolonged unidirectional wind events, westerly winds yield a greater reduction of hypoxia because enhanced estuarine circulation brings oxygen-rich seawater to the hypoxic zone.
In the first 24 hours of a two-day wind event at speeds of 8 m/s, the PN-type bathymetry causes northerly winds to reduce more hypoxia than southerly winds because of greater destratification by wind-induced cross-channel circulation. In later wind periods, i.e., after Hour 24, southerly winds cause a greater hypoxia reduction because the influence of wind-induced along-channel circulation becomes dominant in the Bay’s hypoxic zone [10]. If the unidirectional wind events continue for more than 12 days, there is a second transition, and northerly winds begin to reduce hypoxia further once more, as the enhanced estuarine circulation begins to play a significant role in reducing hypoxia. This study shows that the timing of these transitions varies with wind speeds, and that there is no second transition if the wind event is short. In weaker wind events (e.g., wind speeds of 2 m/s), wind’s destratification is weak and the enhanced estuarine circulation by northerly winds becomes an important factor in reducing hypoxia. Therefore, at all of the times of the simulated 2-day or 20-day wind events, northerly winds reduce more hypoxia than southerly winds.
Most natural wind events are episodic and are subject to frequent changes in wind direction. The relative influences on hypoxia by wind directions might then be characterized by short-period wind events. On the other hand, it is also unlikely that wind events will occur for only one hour over a period of a few days. Thus, the model experiments of two-day wind as well as their modified scenarios can be more useful in analyzing relative hypoxia reduction among observed wind directions. The model experiments demonstrated that if an 8 m/s hourly intermittent wind maintains the same direction, and then it can still strongly reduce hypoxia approximately equal to 75% of the anoxia reductions by nonstop winds over two days. Reductions in hypoxia by winds that reverse directions hourly are largely negated by the previous phase of wind direction. If there is an intermittent calm period between reversing directions, the cancellation effect is lessened, and the hypoxia reduction is approximately 50% of the reduction produced by constant winds. If the wind direction rotates up to ± 90 degrees about a central direction, it can still yield high hypoxia reduction, equivalent to approximately 90%–100% of the reduction induced by constant winds. These results were derived from model simulations under specific initial stratification and hypoxia conditions, and the percent anoxia/hypoxia reductions should be expected to differ under altered conditions. This paper describes differences in hypoxia reduction for wind directions. In general, change of wind speeds could have more influence on hypoxia than the change of wind directions. Indicated from Figure 8 and Figure 11, in the model experimental setting of speeds at 4 to 10 m/s over short time periods, e.g., one hour or two days, a change in speed of 10%–20% results in a greater hypoxic volume change than switching wind direction.
Month-long unidirectional prevailing winds can exist, during which period the relative influences on hypoxia reduction by wind directions could be differ from the model experiments of short-period wind events.
Relative effectiveness of destratification in the hypoxic zone between opposite wind directions varies with wind speed and duration, as do the subsequent relative reductions of hypoxia. These responses are associated with changes in relative destratification by wind-induced cross-channel circulation and along-channel circulation, as well as enhanced estuarine circulation for different wind speeds and durations. The model experiments in this work provide additional supportive evidence on the modulation of PN-type bathymetry that provide favorable conditions for greater destratification by easterly winds compared to westerly winds, and northerly winds compared to southerly winds [10,14]. The strengths of initial stratification, tidal stages, and some other factors can also affect these results, and further detailed analyses are needed to obtain a more complete picture. Note that the above conclusions were drawn from model experiments. Although this model can simulate reasonable responses of anoxic volume to altered wind strengths and directions, care should be taken when applied to management analysis.

Acknowledgments

The writers appreciate the professional input and support to this research from Richard Batiuk, the Associate Director for Science at USEPA Chesapeake Bay Program Office. This project is supported by USEPA Grant CB963060-01.

Author Contributions

P. Wang and L. Linker conceived and designed the experiments; H. Wang, K. Hinson and P. Wang performed the experiments; P. Wang and H. Wang analyzed the data; and P. Wang, K. Hinson and L. Linker wrote the paper.

Conflicts of Interest

The authors declare no conflict of interest.

Appendix A: Description of Computer Model That Is Used in the Study

The Chesapeake Bay Water Quality and Sediment Transport Model (WQSTM) is a coupled CH3D hydrodynamic model and ICM water quality model [18]. The CH3D model was first developed for the US Army Engineer Waterways Experiment Station [25] and has been extensively modified since [19]. The model computes numerical solutions for the basic equations of continuity, motion, and mass conservation. It simulates physical processes controlling Bay-wide circulation and mixing, such as tides, wind, temperature and density effects, freshwater inflows, turbulence, and the effect of the earth’s rotation. The vertical diffusivity is computed by a turbulent kinetic energy (t-k-ε) closure model [26,27]. Details of the solution scheme are provided by Johnson et al. [19]. The horizontal resolution of model cells is approximately 1 km × 1 km, and are reduced to 0.5 km at the deep channel area. The physical transport of materials, for example, the salinity (Sa) fields, are computed thusly:
( S a ) t = R O ( ( u S a ) x + ( v S a ) y + ( w S a ) z ) + E k H Pr H ( ( K H ( S a ) / x ) x + ( K H ( S a ) / y ) y ) + E k V Pr V ( K V S a / z ) z
where, u, v, and w represent the x (W->E), y (S->N), and z (down->up) velocity components, respectively; t = time; Ro = Rossby number; K = turbulent eddy coefficients; Ek = Ekman number; Pr = Prandtl number; and the subscript H (horizontal) or V (vertical) for the K, Ek and Pr variables indicates their horizontal or vertical component, respectively. The model was calibrated for 10 years using a 1991–2000 hydrology. In the mainstem Bay, compared against the observed data on the same date, the mean difference and the relative difference of the model for salinity are −0.01 ppt and 10%, respectively.
The ICM water quality model simulates 36 state variables including various forms of nitrogen, phosphorus and carbon, three generalized groups of algae, dissolved oxygen, sediment diagenesis and other state variables relevant to Chesapeake water quality. The time rate change of a state variable (C) within a control volume is:
F ( C ) = C t d V
where V is a control volume.
For each control volume, i, and for each state variable, transport and kinetics are calculated based on the mass-conservation equation:
δ V i C i δ t = k = 1 n Q k C k + k = 1 n A k D k δ C k δ x k + S i
where, Vi = volume of ith control volume (m3); Ci = concentration in ith control volume (g·m−3); t, x = temporal and spatial coordinates; n = number of flow faces attached to ith control volume; Qk = volumetric flow across flow face k of ith control volume (m3·s−1); Ck = concentration in flow across face k (g·m−3); Ak = area of flow face k (m2); Dk = diffusion coefficient at flow face k (m2·s−1); and Si = sum of external loads and kinetic sources and sinks in ith control volume (g·s−1).
The WQSTM simulates nutrient transport and dynamics in the estuary in variable time steps of approximately 2∓5 minutes. The oxygen kinetics consists of an air-sea exchange, algal photosynthesis and respiration, heterotrophic respiration, and various oxidation and reduction reactions of the simulated substances, with a full carbon based DO simulation. The model was calibrated with observed data for 10 years (1991–2000). In the mainstem DO estimates, at depths less than 6.7 meters, the model mean error (ME) and relative error (RE) are 0.14 g/m3 and 11.2%; at depths between 6.7−12.8 meters, the ME and RE are 0.30 g/m3 and 19.4%; and at depths greater than 12.8 meters, the ME and RE are −0.45 g/m3 and 28.7% [18], respectively.
Figure A1 presents an example of multi-year model calibration in salinity and bottom DO in a deep monitoring station, CB4.1C. Although model simulated dissolved oxygen can have an approximate 30% deviation from observed values, generally the model performed well in producing proportional responses of anoxic volume to changes in wind, and had much lower relative errors (less than 10%) among scenarios in regards to proportional changes in wind strength.
Figure A1. Model simulated versus observed for year 1991−2000: (A) surface salinity; (B) bottom salinity; and (C) bottom dissolved oxygen at Chesapeake Bay monitoring station CB4.1C (from Wang et al. [10]).
Jmse 04 00062 g016

References

  1. Officer, C.B.; Biggs, R.B.; Taft, J.L.; Cronin, L.E.; Tyler, M.A.; Boynton, W. R. Chesapeake Bay anoxia: Origin, development and significance. Science 1984, 233, 22–27. [Google Scholar] [CrossRef] [PubMed]
  2. Harding, L.W.; Leffler, M.; Mackiernan, G.B. Dissolved Oxygen in The Chesapeake Bay: A Scientific Consensus; Maryland Sea College: College Park, MD, USA, 1992; p. 18. [Google Scholar]
  3. Kato, H.; Phillips, O.M. On the penetration of a turbulent layer into a stratified fluid. J. Fluid Mech. 1969, 37, 643–655. [Google Scholar] [CrossRef]
  4. Malone, T.C.; Kemp, W.M.; Ducklow, H.W.; Boynton, W.R.; Tuttle, J.H.; Jonas, R.B. Lateral variation in the production and fate of phytoplankton in a partially stratified estuary. Mar. Ecol. Prog. Ser. 1986, 32, 149–160. [Google Scholar] [CrossRef]
  5. O’Donnell, J.; Dam, H.G.; Bohlen, W.F.; Fitzgerald, W.; Gay, P.S.; Houk, A.E.; Cohen, D.C.; Howard-Strobel, M.M. Intermittent ventilation in the hypoxic zone of western Long Island Sound during the summer of 2004. J. Geophys. Res. 2008, v113, C09025. [Google Scholar] [CrossRef]
  6. Chen, S.N.; Sanford, L.P. Axial wind effects on stratification and longitudinal salt transport in an idealized, partially mixed estuary. J. Phys. Oceanogr. 2009, 39, 1905–1920. [Google Scholar] [CrossRef]
  7. Scully, M.E. Wind modulation of dissolved oxygen in Chesapeake Bay. Estuar. Coasts 2010, 33, 1164–1175. [Google Scholar] [CrossRef]
  8. Li, Y.; Li, M. Effects of winds on stratification and circulation in a partially mixed estuary. J Geophys. Res. 2011, v116, C12012. [Google Scholar] [CrossRef]
  9. Scully, M.E. Physical controls on hypoxia in Chesapeake Bay: A numerical modeling study. J. Geophys. Res. 2013, 118, 1239–1256. [Google Scholar] [CrossRef]
  10. Wang, P.; Wang, H.; Linker, L.; Tian, R. Effects of cross-channel bathymetry and wind direction on destratification and hypoxia reduction in the Chesapeake Bay. Estuar. Coast. Shelf Sci. 2016. [Google Scholar] [CrossRef]
  11. Diaz, R.J.; Rosenberg, R. Marine benthic hypoxia: a review of its ecological effects and the behavioural responses of benthic macrofauna. OOceanogr. Mar. Biol. Annu. Rev. 1995, 33, 245–303. [Google Scholar]
  12. Hagy, J.D.; Boynton, W.R.; Keefe, C.W.; Wood, K.V. Hypoxia in Chesapeake Bay, 1950–2001: Long-term changes in relation to nutrient loading and river flow. Estuaries 2004, 27, 634–658. [Google Scholar] [CrossRef]
  13. USEPA (U.S. Environmental Protection Agency). Chesapeake Bay Total Maximum Daily Load for Nitrogen, Phosphorus and Sediment. Available online: https://www.epa.gov/sites/production/files/ 2014-12/documents/cbay_final_tmdl_exec_sum_section_1_through_3_final_0.pdf (accessed on 12 September 2016).
  14. Wang, P.; Wang, H. The Wind Effect on Chesapeake Bay Destratification and Hypoxia. In Proceedings of the July 2012 Modeling Subcommittee Quarterly Meeting, Annapolis, MD, USA, 11 July 2012.
  15. Wang, P.; Wang, H.; Linker, L. Relative importance of nutrient load and wind on regulating interannual summer hypoxia in the Chesapeake Bay. Estuar. Coasts 2015, 38, 1048–1061. [Google Scholar] [CrossRef]
  16. Kemp, W.M.; Boynton, W.R.; Adolf, J.E.; Boesch, D.F.; Boicourt, W.C.; Brush, G.; Cornwell, J.C.; Fisher, T.R.; Glibert, P.M.; Hagy, J.D.; et al. Eutrophication of Chesapeake Bay: Historical trends and ecological interactions. Mar. Ecol. Prog. Ser. 2005, 303, 1–29. [Google Scholar] [CrossRef]
  17. Murphy, R.R.; Kemp, W.M.; Ball, V.P. Long-term trends in Chesapeake Bay seasonal hypoxia, stratification, and nutrient loading. Estuar. Coasts 2011, 34, 1293–1309. [Google Scholar]
  18. Cerco, C.F.; Kim, S.C.; Noel, M. The 2010 Chesapeake Bay Eutrophication Model: A Report to USEPA Chesapeake Bay Program; US Army Engineer Research and Devilopment Center: Vicksburg, MS, USA, 2010. [Google Scholar]
  19. Johnson, B.; Heath, R.; Hsieh, B.; Kim, K.; Butler, L. User’s Guide for a Three-Dimensional Numerical Hydrodynamic, Salinity, and Temperature Model of Chesapeake Bay; Technical Report HL-91-20; Department of the Army Waterways Experiment Station: Vicksburg, MS, USA, 1991. [Google Scholar]
  20. Shenk, G.W.; Linker, L.C. Development and Application of the 2010 Chesapeake TMDL Watershed Model. J. Am. Water Resour. Assoc. 2013. [Google Scholar] [CrossRef]
  21. Pritchard, D.W.; Vieira, M.E.C. Vertical variations in residual current response to meteorological forcing in the mid-Chesapeake Bay. In The Estuary as A Filter; Kennedy, V.S., Ed.; Academic Press: Orlando, FL, USA, 1984; pp. 27–65. [Google Scholar]
  22. Breitburg, D.L. Nearshore hypoxia in Chesapeake Bay: Patterns and relationships among physical factors. Estuar. Coast. Shelf Sci. 1990, 30, 593–609. [Google Scholar] [CrossRef]
  23. Jay, D.A.; Musiak, J.D. Internal tidal asymmetry in channel flows: Rrigins and consequence. Coast. Estuar. Studies 1996, 50, 211–249. [Google Scholar]
  24. Fisher, C.W. Tidal circulation in Chesapeake Bay. Ph.D. Thesis, Old Dominion University, Norfolk, UK, 1986; p. 255. [Google Scholar]
  25. Sheng, Y.P. A Three-Dimensional Model of Coastal, Estuarine and Lake Currents Using a Boundary-Fitted Grid; Titan Systems New Jersey Inc.: Princeton, NJ, USA, 1986. [Google Scholar]
  26. Rodi, W. Turbulence Models and Their Application in Hydraulics—A State of The Art Review; IAHR (International Association of Hydraulic Research): Delft, Netherlands, 1993. [Google Scholar]
  27. Bloss, S.; Lehfeldt, R.; Patterson, R. Modeling turbulent transport in stratified estuary. J. Hydraul. Eng. 1988, 114, 1115–1133. [Google Scholar] [CrossRef]
Figure 1. Flow velocity and lateral circulation pattern at a PN-type cross section in two opposite wind directions: (A) Easterly wind; and (B) westerly wind (after Wang et al. [10]). Note: The velocities were averaged from the first 12 h of the wind event of 8 m/s. The long dashed arrow indicates the tilt of the free surface when surface water is flushed from the upwind site to the downwind site. The dark arrow along the slope shows the direction of downwelling due to elevated water level.
Jmse 04 00062 g001
Figure 2. Time series of predicted anoxic volume (defined as the volume of water with DO ≤ 0.2 mg/L) in the mainstem Bay for 4 idealized wind directions at 8 m/s for 2 days. From Wang et al. [14].
Jmse 04 00062 g002
Figure 3. Wind roses of: (A) June 1996; and (B) July 2004.
Jmse 04 00062 g003
Figure 4. Hourly anoxic volume reduction in the mainstem Bay compared to the no-wind condition forfour idealized wind directions in Scenario Set A (two-day duration) at five speed settings: (A) 2 m/s; (B) 4 m/s; (C) 6 m/s; (D) 8 m/s; and (E) 10 m/s. The initial anoxic volume was approximately 10 km3 before the wind event, which began at 4:00 a.m. of 10 August 1996 (i.e., Hour 0), and is the origin (i.e., 0) of the x-axis.
Jmse 04 00062 g004
Figure 5. Contours of DO concentration (mg/L) along the main channel from mid lower Bay (south) to mid upper Bay (north) at Hour 24 of a two-day wind scenario at 8 m/s.
Jmse 04 00062 g005
Figure 6. Contours of DO concentration (mg/L) along the main channel from mid lower Bay (south) to mid upper Bay (north) at Hour 48 of a two-day wind scenario at 2 m/s.
Jmse 04 00062 g006
Figure 7. Bottom DO concentrations (mg/L) along the main channel near the south boundary of the anoxic zone for the two-day scenario at 2 m/s. The traverse is approximate at the locations from 50 km to 100 km in Figure 5 or Figure 6: (A) Hour 24 of the wind event; and (B) Hour 48 of the wind event.
Jmse 04 00062 g007
Figure 8. Peak anoxic volume reduction in the mainstem Bay from the no-wind condition by four wind directions in Scenario Set A (i.e., two-day duration) at five speed settings. Greater negative values correspond to greater anoxia reductions.
Jmse 04 00062 g008
Figure 9. Tidal stage and simulated annoxic volume in 10 and 11 August 1996: (A) Water elevation at the Bay mouth; and (B) simulated anoxic volume in the no wind scenario. The M2 tide contributes significantly to the fluctuation of anoxic volume.
Jmse 04 00062 g009
Figure 10. Hourly anoxic volume reduction in the mainstem Bay from four idealized wind directions (compared to no wind) over a two-day duration at 8 m/s that began 6 hours later at a different tidal stage than that in Scenario Set A-8. The initial anoxic volume was about 10 km3 before the wind event started. To better compare Figure 4d in temporal development, the origin of the x-axis in both Figure 10 and Figure 4d is at 4:00 a.m. on 10 August 1996. Here, Hour 0 (wind starts) lies at 10:00 a.m., 6 hours past the origin point.
Jmse 04 00062 g010
Figure 11. Peak anoxic volume reduction in the mainstem Bay compared to a no-wind condition by four wind directions in Scenario Set B (i.e., one-hour duration) at five speed settings. Greater negative values correspond to greater anoxia reductions.
Jmse 04 00062 g011
Figure 12. Schematic flow directions of the bottom returned current by winds: (A) easterly wind; and (B) northerly wind.
Jmse 04 00062 g012
Figure 13. Model simulated anoxic volume reduction in the mainstem Bay compared to a no-wind condition by four idealized wind directions in Scenario Set C (i.e., 20-day duration) at four wind speed settings: (A) 2 m/s; (B) 4 m/s; (C) 6 m/s; and (D) 8 m/s. The initial anoxic volume was approximately 10 km3 prior to the wind event.
Jmse 04 00062 g013
Figure 14. Scenario Set H: Daily anoxic volume for year-long unidirectional wind events. Note: Lower anoxic volume corresponds to a greater reduction of anoxia compared to the no-wind condition.
Jmse 04 00062 g014
Figure 15. Peak anoxic volume reduction by dominant wind direcitons in scenario sets of two-day winds with speeds = 8 m/s or interlayered with no wind. Greater negative values correspond to greater anoxia reductions.
Jmse 04 00062 g015
Table 1. Directions of along-channel and cross-channel components of wind-induced surface flow in the Chesapeake Bay main channel 1.
Wind directionDirection of surface flux of along-channel circulationDirection of surface flux of cross-channel circulation
Northerly To S (down-Bay-ward), principalTo W, secondary
SoutherlyTo N, (up-Bay-ward), principalTo E, secondary
EasterlyTo N, secondaryTo W, principal
WesterlyTo S, secondaryTo E, principal
1 After Table 2 of Wang et al. [10].
Table 2. Scenario Set G: Direction rotates ± 90 degree every 4 h from a central direction 1.
HourWind direction at hours since wind startsPrevail direction
0–4481216202428323640
Scenario nameS ± 90SWSESWSESWWS
N ± 90NENWNENWNEEN
E ± 90ENESENESENNE
W ± 90WSWNWSWNWSSW
S_360 2SWNESWNESWWNon
1 Wind speed = 8 m/s throughout the wind event. 2 There is no central direction for Scenario S_360, which begins with southerly winds.
Table 3. Scenario Set H: Using observed wind speeds in 1996, but are fixed to one direction for a year.
Scenario nameWind speedsWind directionWatershed inputsNote
Y96_N1996 obsNortherly1996 obsWind directions are modified starting on 1 January for the entire year
Y96_S1996 obsSoutherly1996 obs
Y96_E1996 obsEasterly1996 obs
Y96_W1996 obsWesterly1996 obs
Y96_00 m/sN/A1996 obs
Y96_obs1996 obs1996 obs1996 obsEquals 1996 calibration run
Table 4. Scenarios Set I: Rotating wind directions from the observed wind fields that had a month-long prevailing direction.
Scenario names for modification onAngles of wind dir rotatedPrevailing wind dir after rotate
1996, June wind2004, July wind
Y96_obsY04_obsNo rotateS
Y96_cw90Y04_cw9090° c.w.W
Y96_cw180Y04_cw180180° c.w.N
Y96_cw270Y04_cw270270° c.w.E
Table 5. Summary of scenario sets.
Wind directionSpeed (m/s)DurationNotesSymbol for Scenario *
AFixed, (blowing from N, S, E, W)Constant (e.g., at 8, 4, 2, etc., m/s)2 daysStart at 4:00 a.m. 8 August 1996, with 7-month spin up.A_8 is specifically for speed = 8 m/s
BFixedConstant (e.g., at 8, 4, 2, etc., m/s)1 h
CFixedConstant (e.g., at 8, 4, 2, etc. m/s)20 days
D Fixed8 m/s at even hours, 0 at odd hours~2 daysd_0_d
EReverse at every even hour8 m/s at even hours, 0 at odd hours~2 daysS_0_N or E_0_W
F Reverse every 1-hConstant 8 m/s~2 daysS_N or E_W
GRotating ± 90° every 4 h from a central direction.Constant 8 m/s~2 daysd ± 90. See Table 2.
HFixedObservedYear-long1996Y96_d. See Table 3.
IRotating 90°, 180°, and 270° from the observed directionObservedJune or July1996, 2004See Table 4
* Note: d is to be substituted with N, S, E or W to represent the central wind direction. 0 indicates intermittent no wind.
Table 6. Anoxic volume in June 1996 and July 2004 for Scenario Set I (rotating wind direction).
Wind field modified1996 nutrient load and June Wind2004 nutrient load and July Wind
Scenario nameDominate wind dirJune AVScenario nameDominate wind dirJuly AV
No-rotationY96_obsS1.504Y04_obsS + some W1.336
90° c rotateY96_cw90W1.899Y04_cw90W + some N1.249
180° c rotateY96_cw180N1.018Y04_cw180N + some E0.828
270° c rotateY96_cw270E2.052Y04_cw270E + some S1.709

