
Uncovering Spatio-Temporal and Treatment-Derived Differences in the Molecular Physiology of a Model Coral-Dinoflagellate Mutualism with Multivariate Statistical Approaches


Abstract
:1. Introduction
2. Materials and Methods
2.1. The Experiments
2.2. Response Variables
2.3. MSA
3. Results
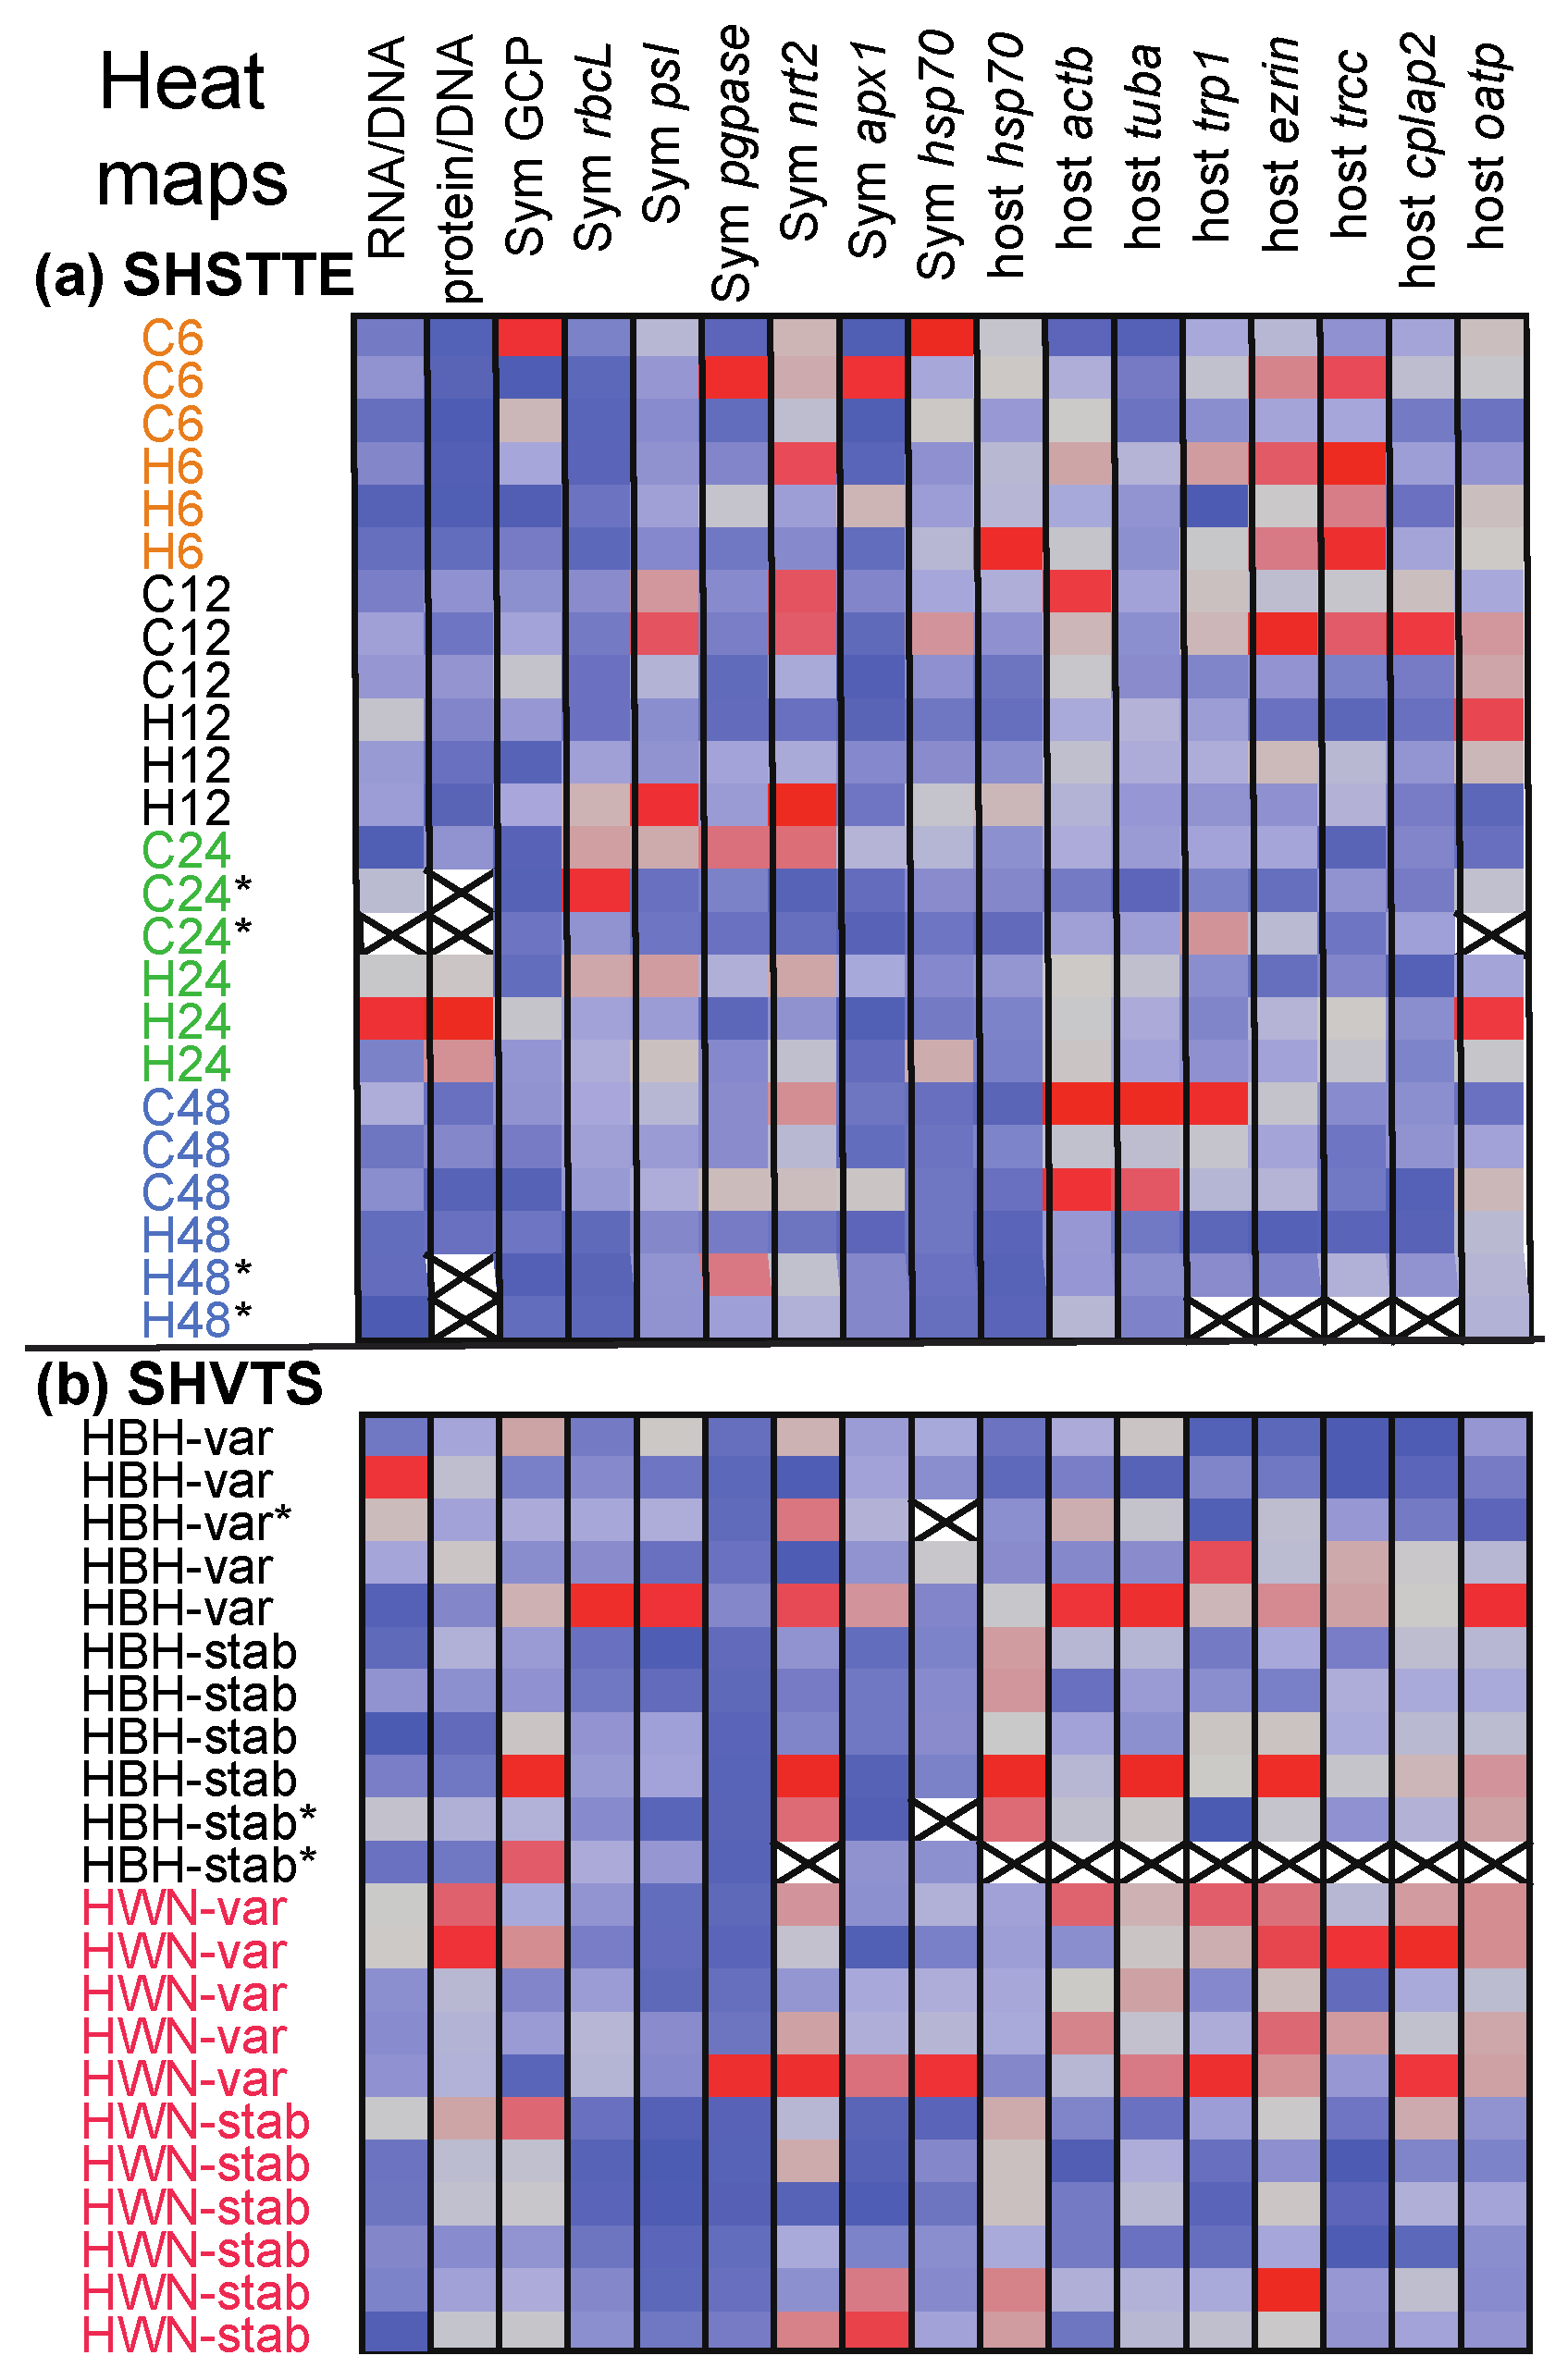
3.1. Overview of the Dataset
3.2. SHSTTE
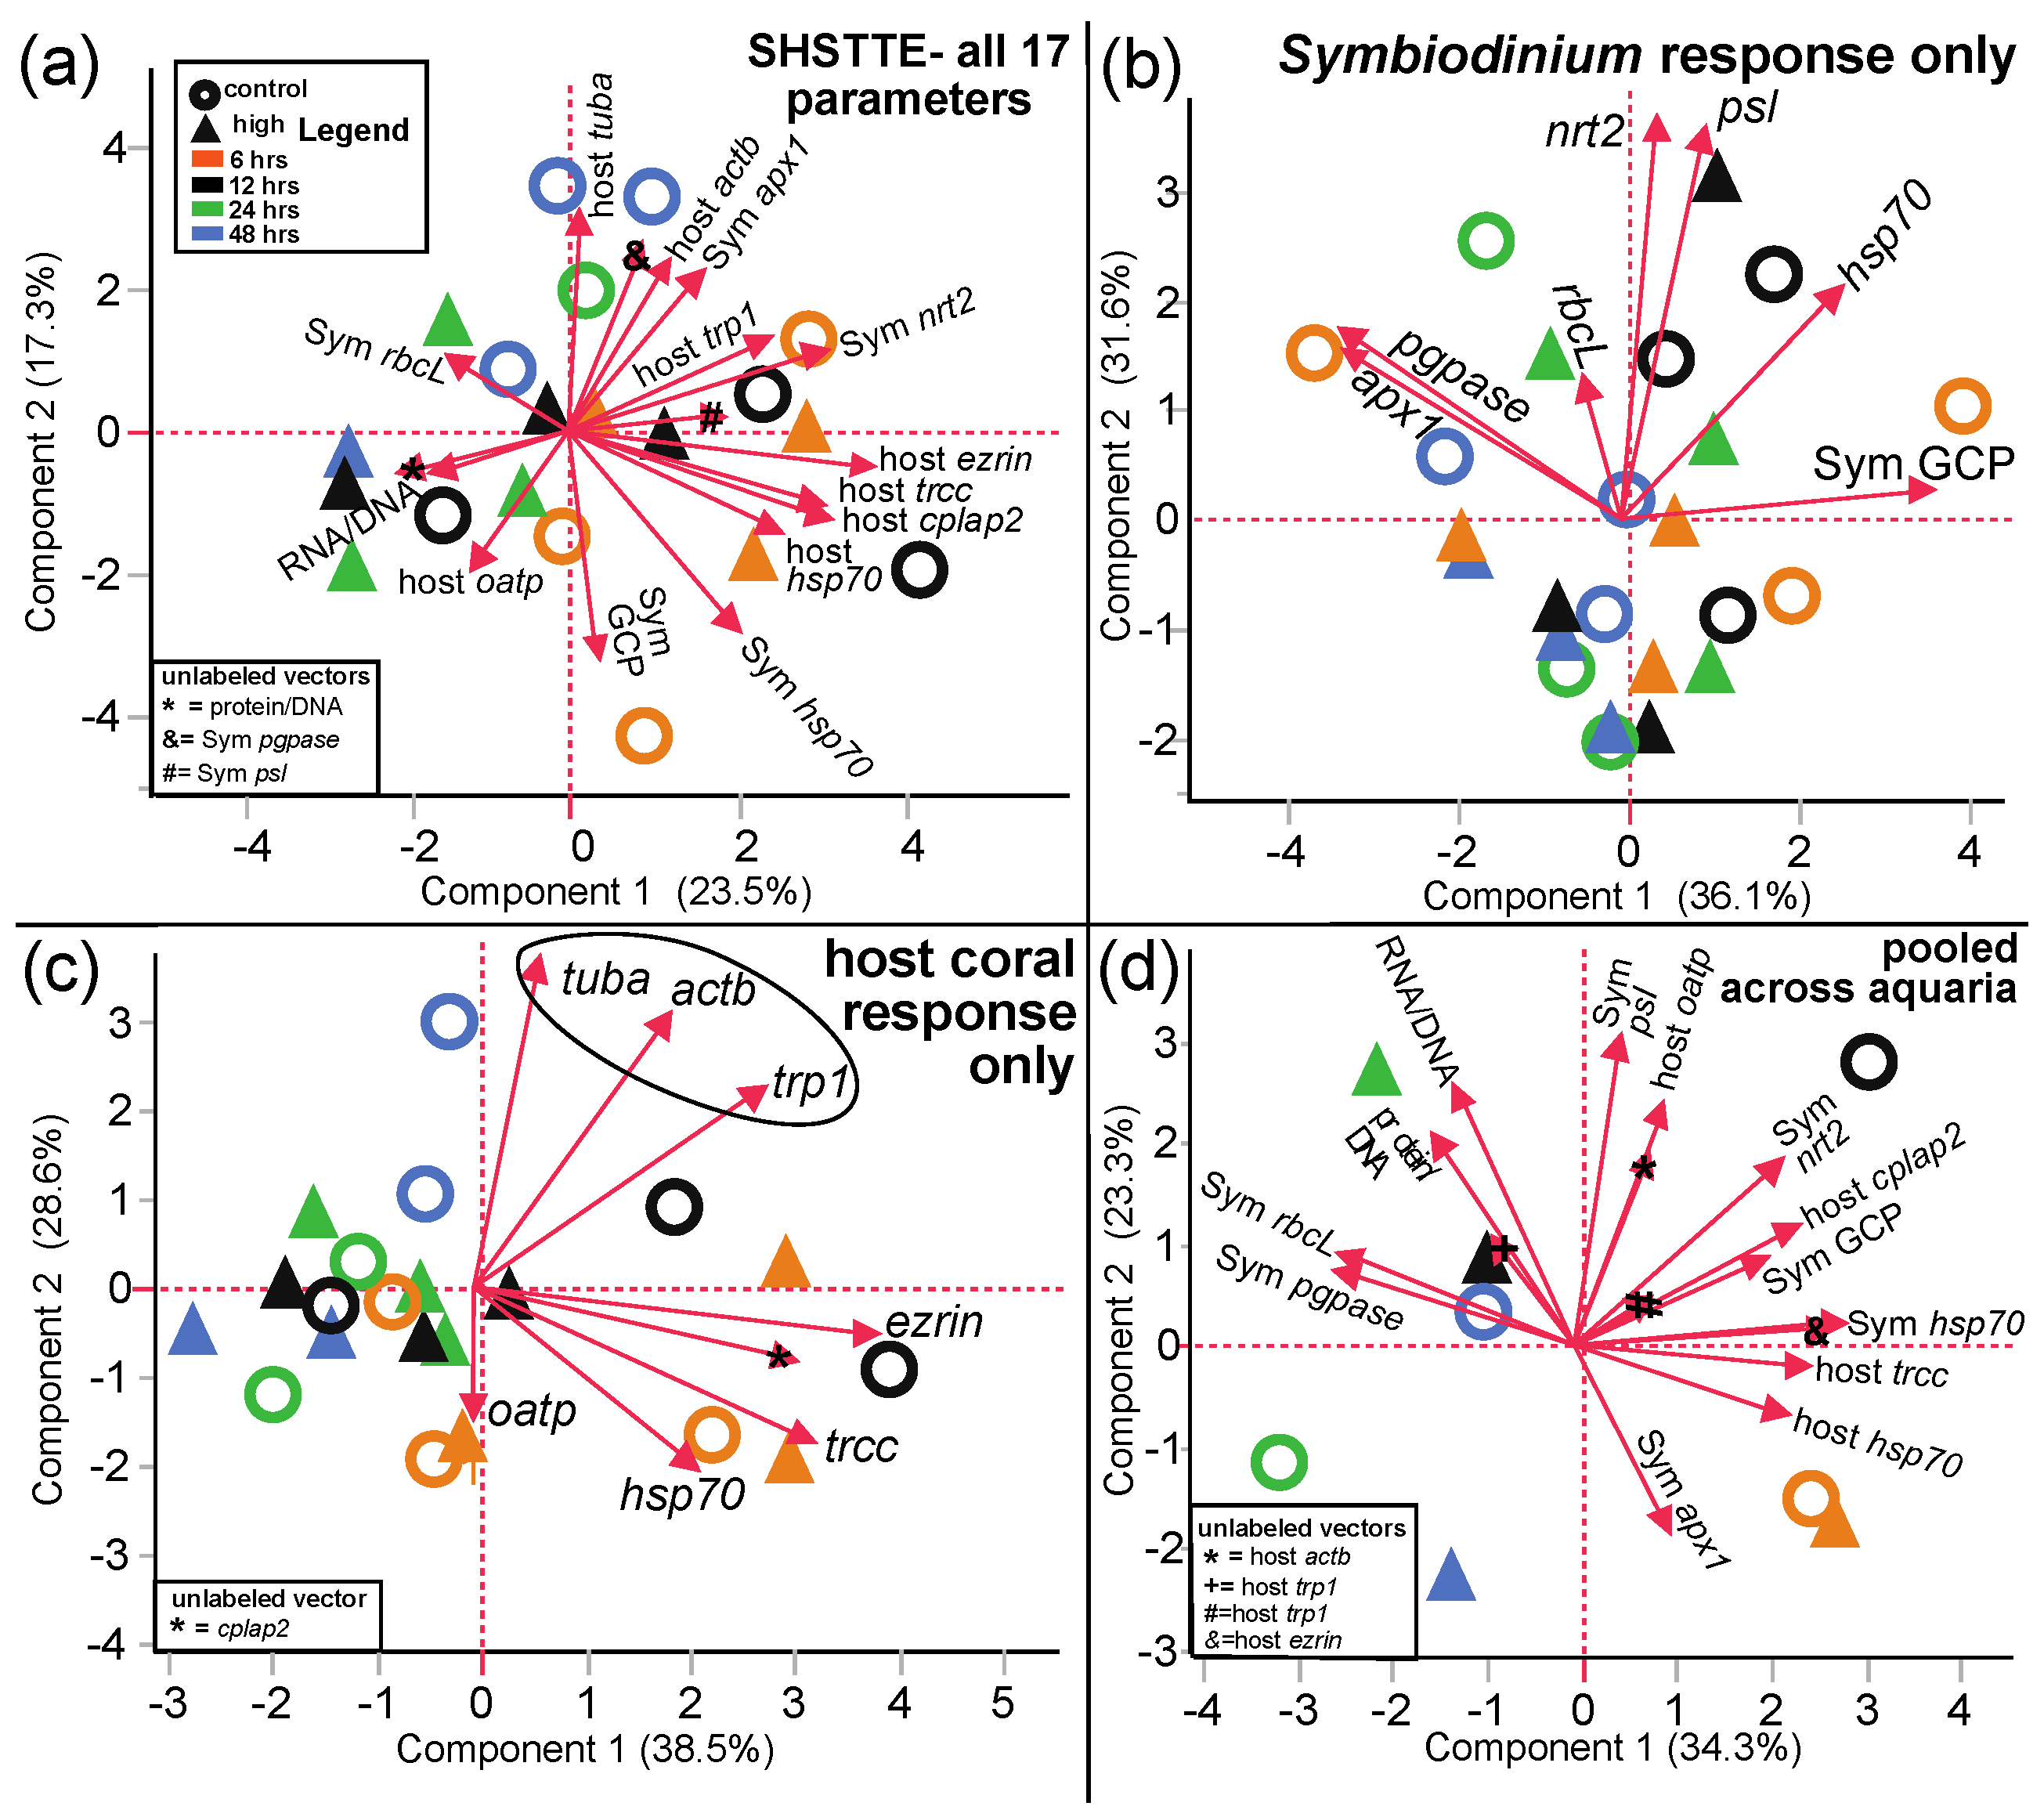
3.2.1. PCA
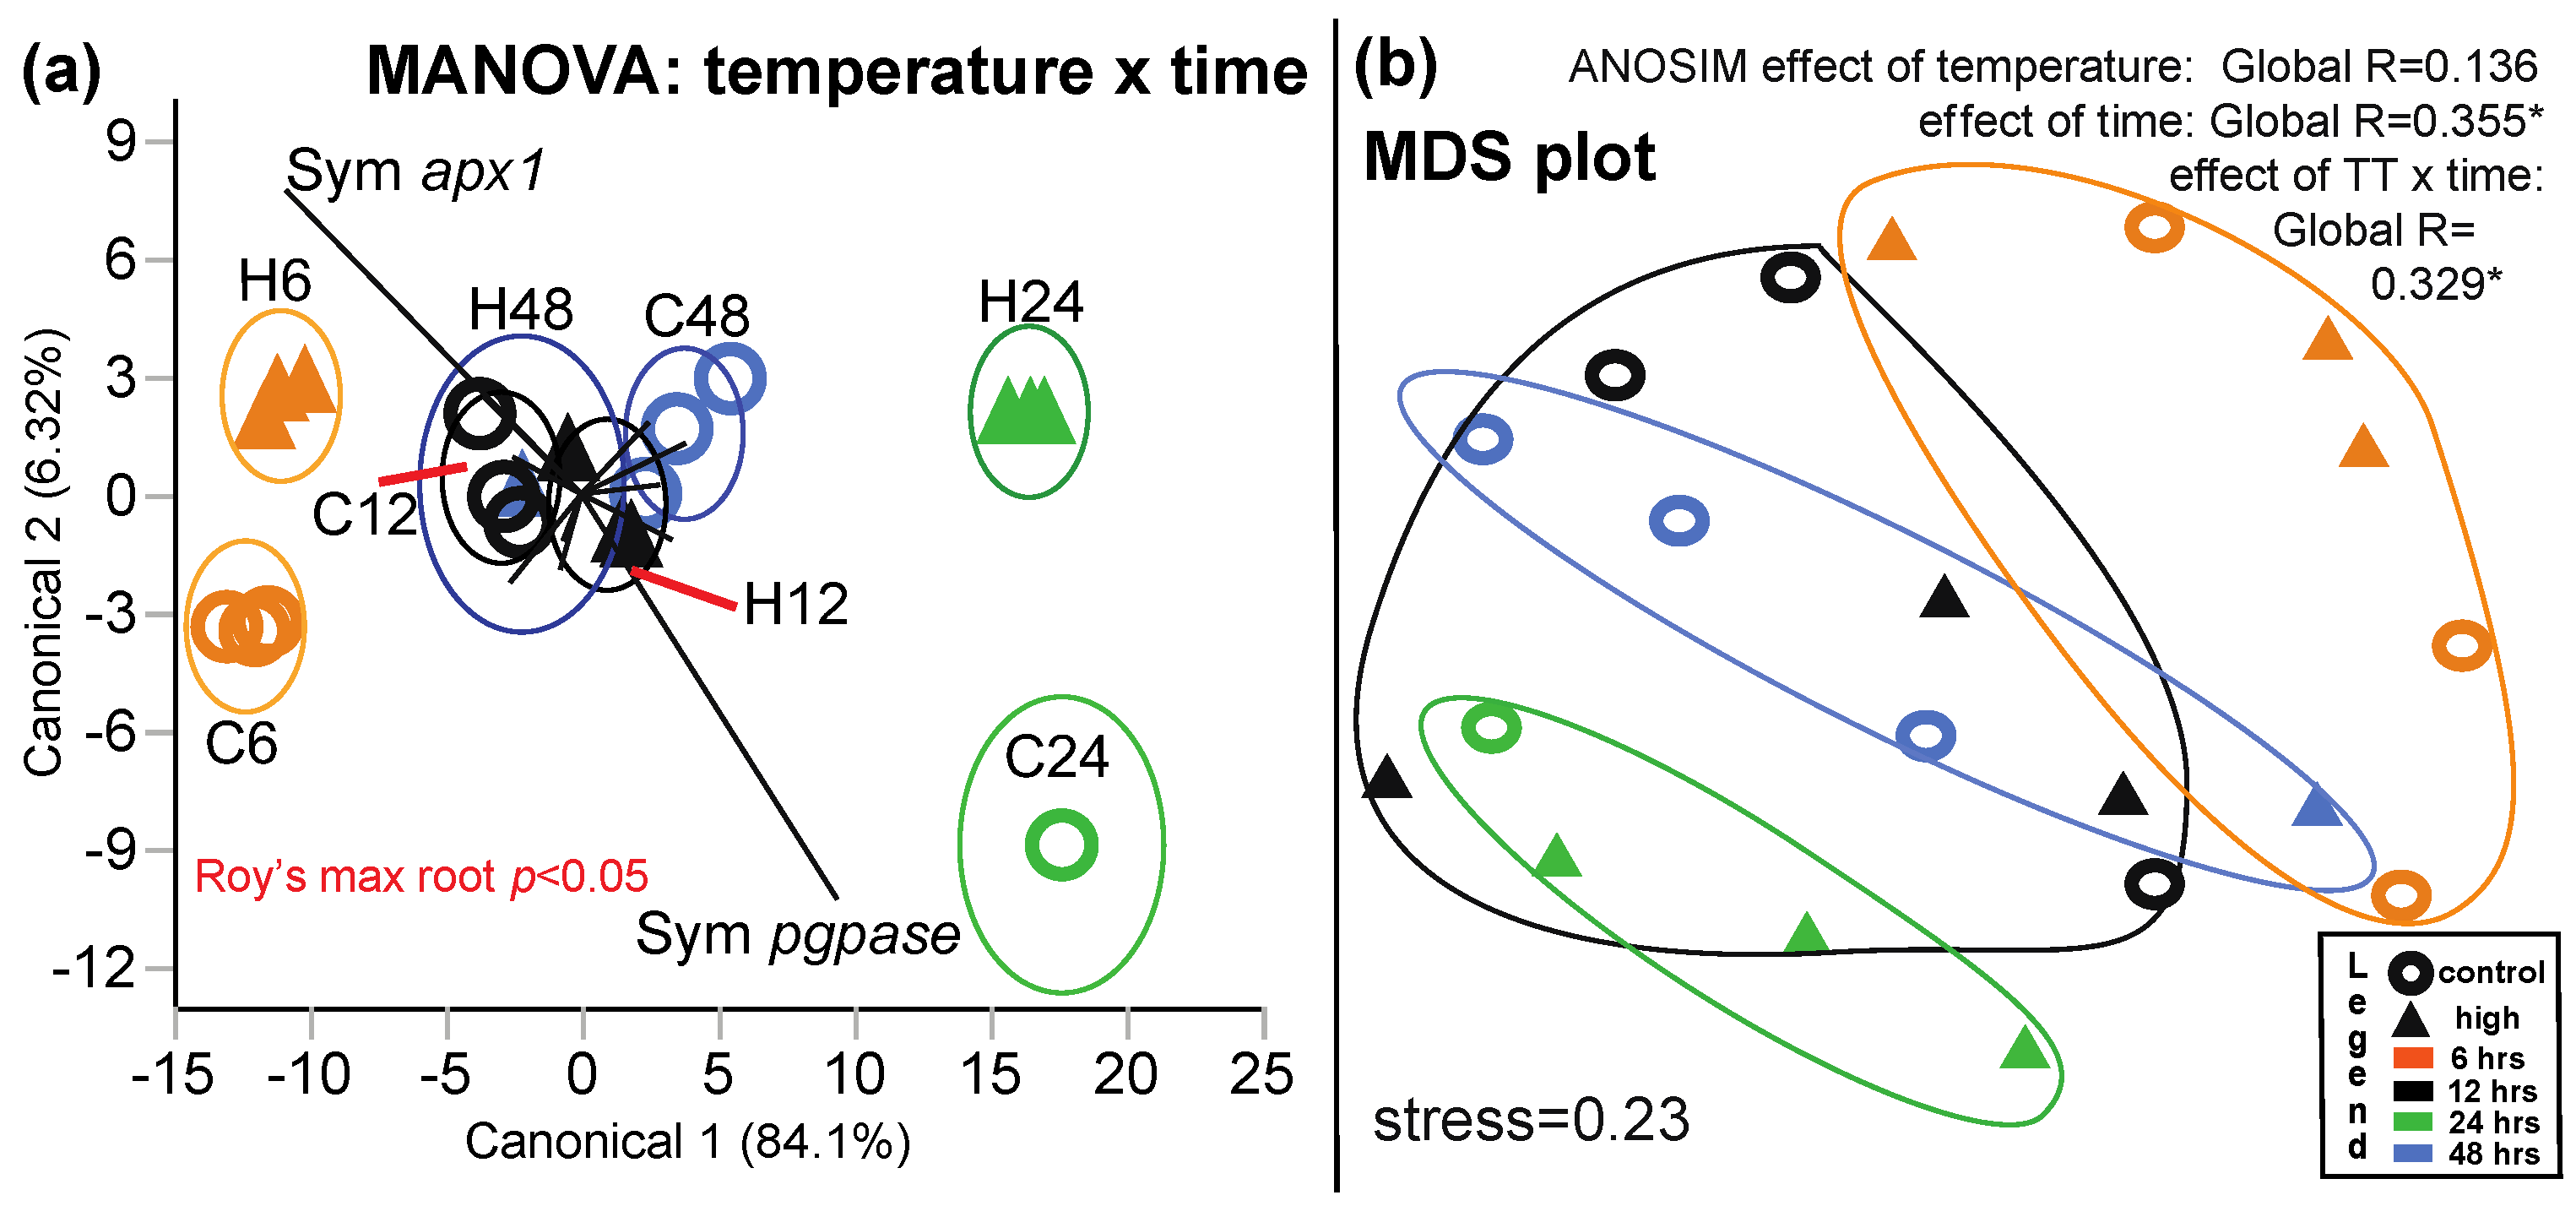
3.2.2. MANOVA
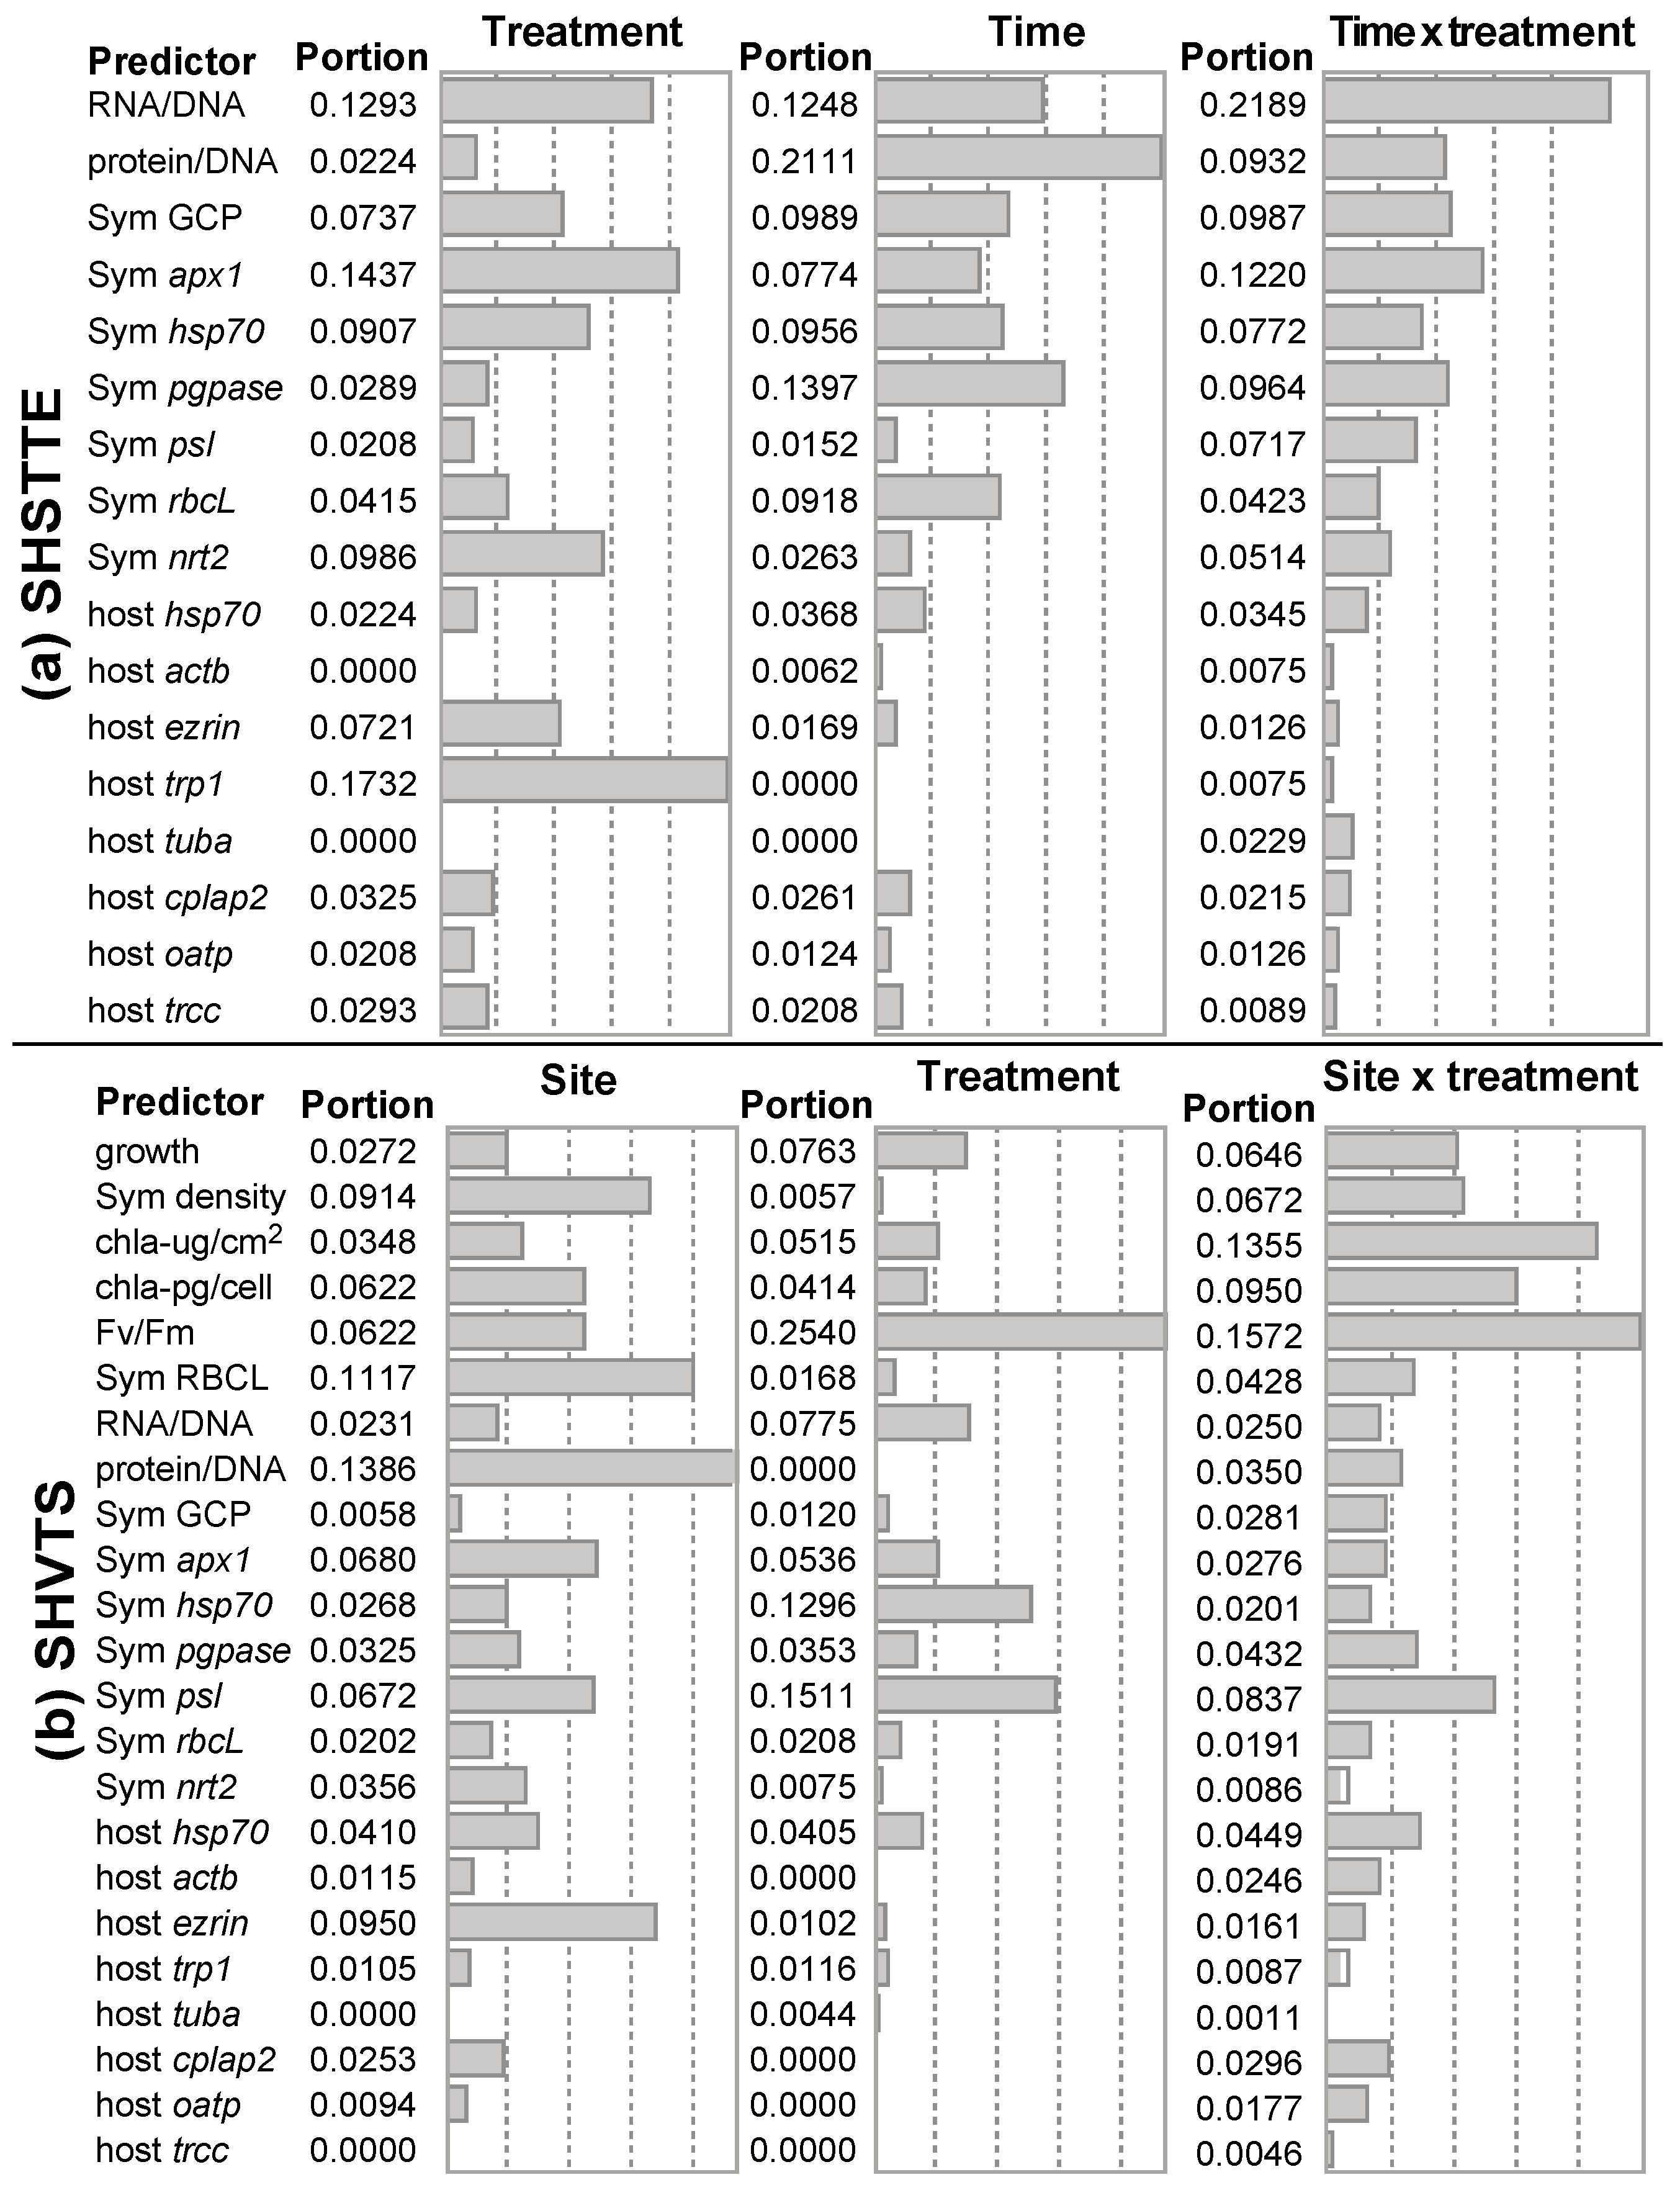
3.2.3. MDS and Predictor Screening
3.3. SHVTS
3.3.1. PCA
3.3.2. MANOVA
3.3.3. MDS and Predictor Screening
4. Discussion
5. Conclusions
Acknowledgments
Conflicts of Interest
References
- Peng, S.E.; Chen, W.N.U.; Chen, H.K.; Lu, C.Y.; Mayfield, A.B.; Fang, L.S.; Chen, C.S. Lipid bodies in coral-dinoflagellate endosymbiosis: Ultrastructural and proteomic analyses. Proteomics 2011, 17, 3540–3455. [Google Scholar] [CrossRef] [PubMed]
- Chen, W.N.U.; Kang, H.J.; Weis, V.M.; Mayfield, A.B.; Fang, L.S.; Chen, C.S. Diel rhythmicity of lipid body formation in a coral-Symbiodinium endosymbiosis. Coral Reefs 2012, 31, 521–534. [Google Scholar] [CrossRef]
- Mayfield, A.B.; Hsiao, Y.Y.; Fan, T.Y.; Chen, C.S. Temporal variation in RNA/DNA and protein/DNA ratios in four anthozoan-dinoflagellate endosymbioses of the Indo-Pacific: Implications for molecular diagnostics. Platax 2012, 9, 1–24. [Google Scholar]
- Chen, H.K.; Song, S.N.; Wang, L.H.; Mayfield, A.B.; Chen, Y.J.; Chen, W.N.U.; Chen, C.S. A compartmental comparison of major lipid species in a coral-Symbiodinium endosymbiosis: Evidence that the coral host regulates lipogenesis of its cytosolic lipid bodies. PLoS ONE 2015, e0132519. [Google Scholar] [CrossRef] [PubMed]
- DeSalvo, M.K.; Voolstra, C.A.; Sunagawa, S.; Schwartz, J.A.; Stillman, J.H.; Coffroth, M.A.; Szmant, A.M.; Medina, M. Differential gene expression during thermal stress and bleaching in the Caribbean coral Montastraea faveolata. Mol. Ecol. 2008, 17, 3952–3971. [Google Scholar] [CrossRef] [PubMed]
- Bellantuono, A.J.; Granados-Cifuentes, C.; Miller, D.J.; Hoegh-Guldberg, O.; Rodriguez-Lanetty, M. Coral thermal tolerance: Tuning gene expression to resist thermal stress. PLoS ONE 2012, e50685. [Google Scholar] [CrossRef] [PubMed]
- Mayfield, A.B.; Fan, T.Y.; Chen, C.S. The physiological impact of ex situ transplantation on the Taiwanese reef-building coral Seriatopora hystrix. J. Mar. Biol. 2013. [Google Scholar] [CrossRef]
- Hoegh-Guldberg, O.; Mumby, P.J.; Hooten, A.J.; Steneck, R.S.; Greenfield, P.; Gomez, E.; Harvell, C.D.; Sale, P.F.; Edwards, A.J.; Caldeira, K.; et al. Coral reefs under rapid climate change and ocean acidification. Science 2007, 318, 1737–1742. [Google Scholar] [CrossRef] [PubMed]
- Huang, Y.C.A.; Hsieh, H.J.; Huang, S.C.; Meng, P.J.; Chen, Y.S.; Keshavmurthy, S.; Nozawa, Y.; Chen, C.A. Nutrient enrichment caused by marine cage culture and its influence on subtropical coral communities in turbid waters. Mar. Ecol. Prog. Ser. 2011, 423, 83–93. [Google Scholar] [CrossRef]
- Gates, R.D. Seawater temperature and sublethal coral bleaching in Jamaica. Coral Reefs 1990, 8, 193–197. [Google Scholar] [CrossRef]
- Gates, R.D.; Edmunds, P.J. The physiological mechanisms of acclimatization in tropical reef corals. Integr. Comp. Biol. 1999, 39, 30–43. [Google Scholar] [CrossRef]
- Mayfield, A.B.; Wang, L.H.; Tang, P.C.; Fan, T.Y.; Hsiao, Y.Y.; Tsai, C.L.; Chen, C.S. Assessing the impacts of experimentally elevated temperature on the biological composition and molecular chaperone gene expression of a reef coral. PLoS ONE 2011, e26529. [Google Scholar] [CrossRef] [PubMed]
- Mayfield, A.B.; Chen, Y.H.; Dai, C.F.; Chen, C.S. The effects of temperature on gene expression in the Indo-Pacific reef-building coral Seriatopora hystrix: Insight from aquarium studies in Southern Taiwan. Int. J. Mar. Sci. 2014, 4, 1–23. [Google Scholar] [CrossRef]
- Mayfield, A.B.; Chan, P.S.; Putnam, H.M.; Chen, C.S.; Fan, T.Y. The effects of a variable temperature regime on the physiology of the reef-building coral Seriatopora hystrix: Results from a laboratory-based reciprocal transplant. J. Exp. Biol. 2012, 215, 4183–4195. [Google Scholar] [CrossRef] [PubMed]
- Mayfield, A.B.; Chen, Y.J.; Lu, C.Y.; Chen, C.S. Proteins involved in acclimation to variable temperature in the reef-building coral Seriatopora hystrix. In Coral Reefs: Ecosystems, Environmental Impact and Current Threats, 1st ed.; Ortiz, S.L., Ed.; NOVA Publishers: New York, NY, USA, 2016; pp. 1–60. [Google Scholar]
- Mayfield, A.B.; Hirst, M.B.; Gates, R.D. Gene expression normalization in a dual-compartment system: A real-time PCR protocol for symbiotic anthozoans. Mol. Ecol. Res. 2009, 9, 462–470. [Google Scholar] [CrossRef] [PubMed]
- Putnam, H.P.; Mayfield, A.B.; Gates, R.D.; Hawaii Institute of Marine Biology, Kaneohe, HI, USA. Unpublished work. 2010.
- Mayfield, A.B.; Fan, T.Y.; Chen, C.S. Physiological acclimation to elevated temperature in a reef-building coral from an upwelling environment. Coral Reefs 2013, 32, 909–921. [Google Scholar] [CrossRef]
- Mayfield, A.B.; Chen, C.S.; Liu, P.J. Decreased green fluorescent protein-like chromoprotein gene expression in specimens of the reef-building coral Pocillopora damicornis undergoing high temperature-induced bleaching. Platax 2014, 11, 1–23. [Google Scholar]
- Mayfield, A.B.; Wang, Y.B.; Chen, C.S.; Chen, S.H.; Lin, C.Y. Compartment-specific transcriptomics in a reef-building coral exposed to elevated temperatures. Mol. Ecol. 2014, 23, 5816–5830. [Google Scholar] [CrossRef] [PubMed]
- Mayfield, A.B.; Chen, M.; Meng, P.J.; Lin, H.J.; Chen, C.S.; Liu, P.J. The physiological response of the reef coral Pocillopora damicornis to elevated temperature: Results from coral reef mesocosm experiments in Southern Taiwan. Mar. Environ. Res. 2013, 86, 1–11. [Google Scholar] [CrossRef] [PubMed]
- Liu, P.J.; Mayfield, A.B.; National Museum of Marine Biology and Aquarium, Checheng, Taiwan. Unpublished work. 2014.
- Loya, Y.; Sakai, K.; Yamazato, K.; Nakano, Y.; Sambali, H.; van Woesik, R. Coral bleaching: The winners and the losers. Ecol. Lett. 2001, 4, 122–131. [Google Scholar] [CrossRef]
- Barshis, D.J.; Ladner, J.T.; Oliver, T.A.; Seneca, F.O.; Traylor-Knowles, N.; Palumbi, S.R. Genomic basis for coral resilience to climate change. Proc. Natl. Acad. Sci. USA 2013, 110, 1387–1392. [Google Scholar] [CrossRef] [PubMed]
- Jan, S.; Chen, C.T.A. Potential biogeochemical effects from vigorous internal tides generated in Luzon Strait: A case study at the southernmost coast of Taiwan. J. Geophys. Res. 2008, 114, 1–14. [Google Scholar] [CrossRef]
- Ziegler, M.; Roder, C.M.; Buchel, C.; Voolstra, C. Limits to physiological plasticity of the coral Pocillopora verrucosa from the central Red Sea. Coral Reefs 2014, 33, 1115–1129. [Google Scholar] [CrossRef]
- Schoepf, V.; Grottoli, A.G.; Levas, S.; Aschaffenburg, M.D.; Baumann, J.H.; Matsui, Y.; Warner, M.E. Annual coral bleaching and the long-term recovery capacity of coral. Proc. Bio. Soc. B 2015, 282. [Google Scholar] [CrossRef] [PubMed]
- Hoadley, K.D.; Pettay, D.T.; Grottoli, A.G.; Cai, W.J.; Melman, T.F.; Schoepf, V.; Hu, X.; Li, Q.; Xu, H.; Wang, Y.; et al. Physiological response to elevated temperature and pCO2 varies across four Pacific coral species: Understanding the unique host + symbiont response. Sci. Rep. 2015, 5. [Google Scholar] [CrossRef] [PubMed]
- Suggett, D.J.; Goyen, S.; Evenhuis, C.; Szabo, M.; Dettay, D.T.; Warner, M.E.; Ralph, P.J. Functional diversity of photobiological traits within the genus Symbiodinium appears to be governed by the interaction of cell size with cladal designation. New Phytol. 2015, 208, 370–381. [Google Scholar] [CrossRef] [PubMed]
- Hoadley, K.D.; Pettay, D.T.; Dodge, D.; Warner, M.E. Contrasting physiological plasticity in response to environmental stress within different cnidarians and their respective symbionts. Coral Reefs 2016, 35, 529–542. [Google Scholar] [CrossRef]
- Whitehead, J.F.; Douglas, A.E. Metabolite comparisons and the identity of nutrients translocated from symbiotic algae to the animal host. J. Exp. Biol. 2003, 206, 3149–3157. [Google Scholar] [CrossRef] [PubMed]
- Downs, C.A.; Mueller, E.; Phillips, S.; Fauth, J.E.; Woodley, C.M. A molecular biomarker system for assessing the health of coral (Montastrea faveolata) during heat stress. Mar. Biotech. 2000, 2, 533–544. [Google Scholar] [CrossRef] [PubMed]
- Liu, P.J.; Meng, P.J.; Liu, L.L.; Wang, J.T.; Leu, M.Y. Impacts of human activities on coral reef ecosystems of Southern Taiwan: A long-term study. Mar. Pollut. Bull. 2012, 64, 1129–1135. [Google Scholar] [CrossRef] [PubMed]
- Putnam, H.M.; Mayfield, A.B.; Fan, T.Y.; Chen, C.S.; Gates, R.D. The physiological and molecular responses of larvae from the reef-building coral Pocillopora damicornis exposed to near-future increases in temperature and pCO2. Mar. Biol. 2013, 160, 2157–2173. [Google Scholar] [CrossRef]
- Jones, R.J.; Hoegh-Guldberg, O.; Larkum, A.W.D.; Schreiber, U. Temperature-induced bleaching of corals begins with impairment of the CO2 fixation metabolism in zooxanthellae. Plant. Cell. Environ. 1998, 21, 1219–1230. [Google Scholar] [CrossRef]
- Bachvaroff, T.; Place, A.R. From stop to start: Tandem gene arrangement, copy number and trans-splicing sites in the dinoflagellate Amphidinium carterae. PLoS ONE 2008, e2929. [Google Scholar] [CrossRef] [PubMed]
- Leggat, W.; Seneca, F.; Wasmund, K.; Ukani, L.; Yellowlees, D.; Ainsworth, T.D. Differential responses of the coral host and their algal symbiont to thermal stress. PLoS ONE 2011, e26687. [Google Scholar] [CrossRef] [PubMed]
- Mayfield, A.B.; Gates, R.D. Osmoregulation in anthozoan-dinoflagellate symbiosis. Comp. Biochem. Physiol. 2007, 147A, 1–10. [Google Scholar] [CrossRef] [PubMed]
- Mayfield, A.B.; Hsiao, Y.Y.; Chen, H.K.; Chen, C.S. Rubisco expression in the dinoflagellate Symbiodinium sp. is influenced by both photoperiod and endosymbiotic lifestyle. Mar. Biotech. 2014, 16, 371–384. [Google Scholar] [CrossRef] [PubMed]
- Levy, O.; Achituv, Y.; Schneider, K.; Dubinsky, Z.; Gorbunov, M. Diurnal hysteresis in coral photosynthesis. Mar. Ecol. Prog. Ser. 2004, 268, 105–117. [Google Scholar] [CrossRef]
- Mayfield, A.B.; Hsiao, Y.Y.; Fan, T.Y.; Chen, C.S.; Gates, R.D. Evaluating the temporal stability of stress-activated protein kinase and cytoskeleton gene expression in the Pacific corals Pocillopora damicornis and Seriatopora hystrix. J. Exp. Mar. Biol. Ecol. 2010, 395, 215–222. [Google Scholar] [CrossRef]
- Sorek, M.; Yacobi, Y.Z.; Roopin, M.; Berman-Frank, I.; Levy, O. Photosynthetic circadian rhythmicity patterns of Symbiodium (sp.), the coral endosymbiotic algae (sp.). Proc. Royal Soc. 2013, 280B. [Google Scholar] [CrossRef]
- Clarke, K.R.; Warwick, R.M. Change in Marine Communities: An Approach to Statistical Analysis and Interpretation; Plymouth Marine Laboratory: Plymouth, UK, 1994. [Google Scholar]


| Year | Species | Sample Material | Timescale | Temperature (°C) | pCO2 (ppm) | Major Finding(s) | Reference(s) |
|---|---|---|---|---|---|---|---|
| 2009 * | S. hystrix | Colony | 2 days | 27 vs. 30 | NA | No response to elevated temperature. | [12,13] |
| 2010 * | S. hystrix | Nubbin | 7 days | 26 vs. 23–29 (var.) | NA | Corals can acclimate to variable temperature, even if they have never before been exposed to such temperature regimes in situ. | [7,13,14,15] |
| 2010 | Pocillopora damicornis | Larvae | 10 days | 25 vs. 29 | 400 vs. 630 | No response to OA. Mild response to elevated temperature No interaction effect of OA and high temperature. | [16] |
| 2010 | P. damicornis | Nubbin | 2 weeks | 25 vs. 29 | 400 vs. 850 | No response to OA. Mild response to elevated temperature. No interaction effect of OA and high temperature. | [17] |
| 2010–2011 | P. damicornis | Nubbin | 9 months | 27 vs. 30 | NA | No significant response to elevated temperature, albeit Symbiodinium affected more strongly than host. | [18,19,20] |
| 2011 | P. damicornis | Nubbin | 4 weeks | Up to 32 (var.) | NA | Corals can acclimate to high temperature if temperature decreases to ambient at night. | [21] |
| 2011 | P. damicornis | Nubbin | 4 weeks | 27 vs. 31.5 | NA | Exposure to 31.5 °C for ~10 days elicits bleaching. | [21] |
| 2014 | P. damicornis S. hystrix | Nubbin | 6 months | 25 vs. 31 | 400 vs. 1000 | Corals can acclimate to OA on a multi-month timescale. | [22] |
| Comparison-Method | Figure | Number of Parameters | Number of Samples | Conclusion(s) | Dominant Loading Factors/Canonical Correlations |
|---|---|---|---|---|---|
| SHSTTE (Figure 2 and Figure 3) | |||||
| PCA (Figure 2) | |||||
| All response variables | 2a | 17 | 20 | Time = 6-h samples are somewhat separated | Mix of host & Symbiodinium genes |
| Symbiodinium molecular response | 2b | 7 | 24 | Panmixia | |
| Host coral genes | 2c | 8 | 20 | Some separation of time = 6-h samples | Mix of cytoskeleton, stress, & osmoregulation genes |
| All response variables (pooled) | 2d | 17 | 8 | More separation by time than by TT | Mix of host & Symbiodinium genes |
| Photosynthesis parameters only | 3 a | 20 | Panmixia | ||
| MANOVA (Figure 3) | |||||
| Discrimination by time and TT | 3a | 17 | 20 | Times = 6-h & 24-h are well separated * | Negative relationship between Symbiodinium apx1 & pgpase |
| Host coral genes | 8 a | 24 | Panmixia | ||
| Symbiodinium molecular response | 7 a | 22 | Panmixia | ||
| Discrimination by TT only | 17 a | 20 | Panmixia | ||
| Host coral genes | 8 a | 24 | Panmixia | ||
| Symbiodinium molecular response | 7 a | 22 | Panmixia | ||
| Discrimination by time only | 17 a | 20 | Times = 6-h & 24-h are well separated | Negative relationship between host trcc & ezrin | |
| Host coral genes | 8 a | 24 | Panmixia | ||
| Symbiodinium molecular response | 7 a | 22 | Time = 6-h separated from other 3 times * | Negative relationship between apx1 & psI | |
| MDS (Figure 3) | 3b | 17 | 20 | Times = 6-h & 24-h are well separated * | Protein/DNA, Symbiodinium hsp70, & host hsp70 c |
| SHVTS (Figure 5 and Figure 6) | |||||
| PCA (Figure 5) | |||||
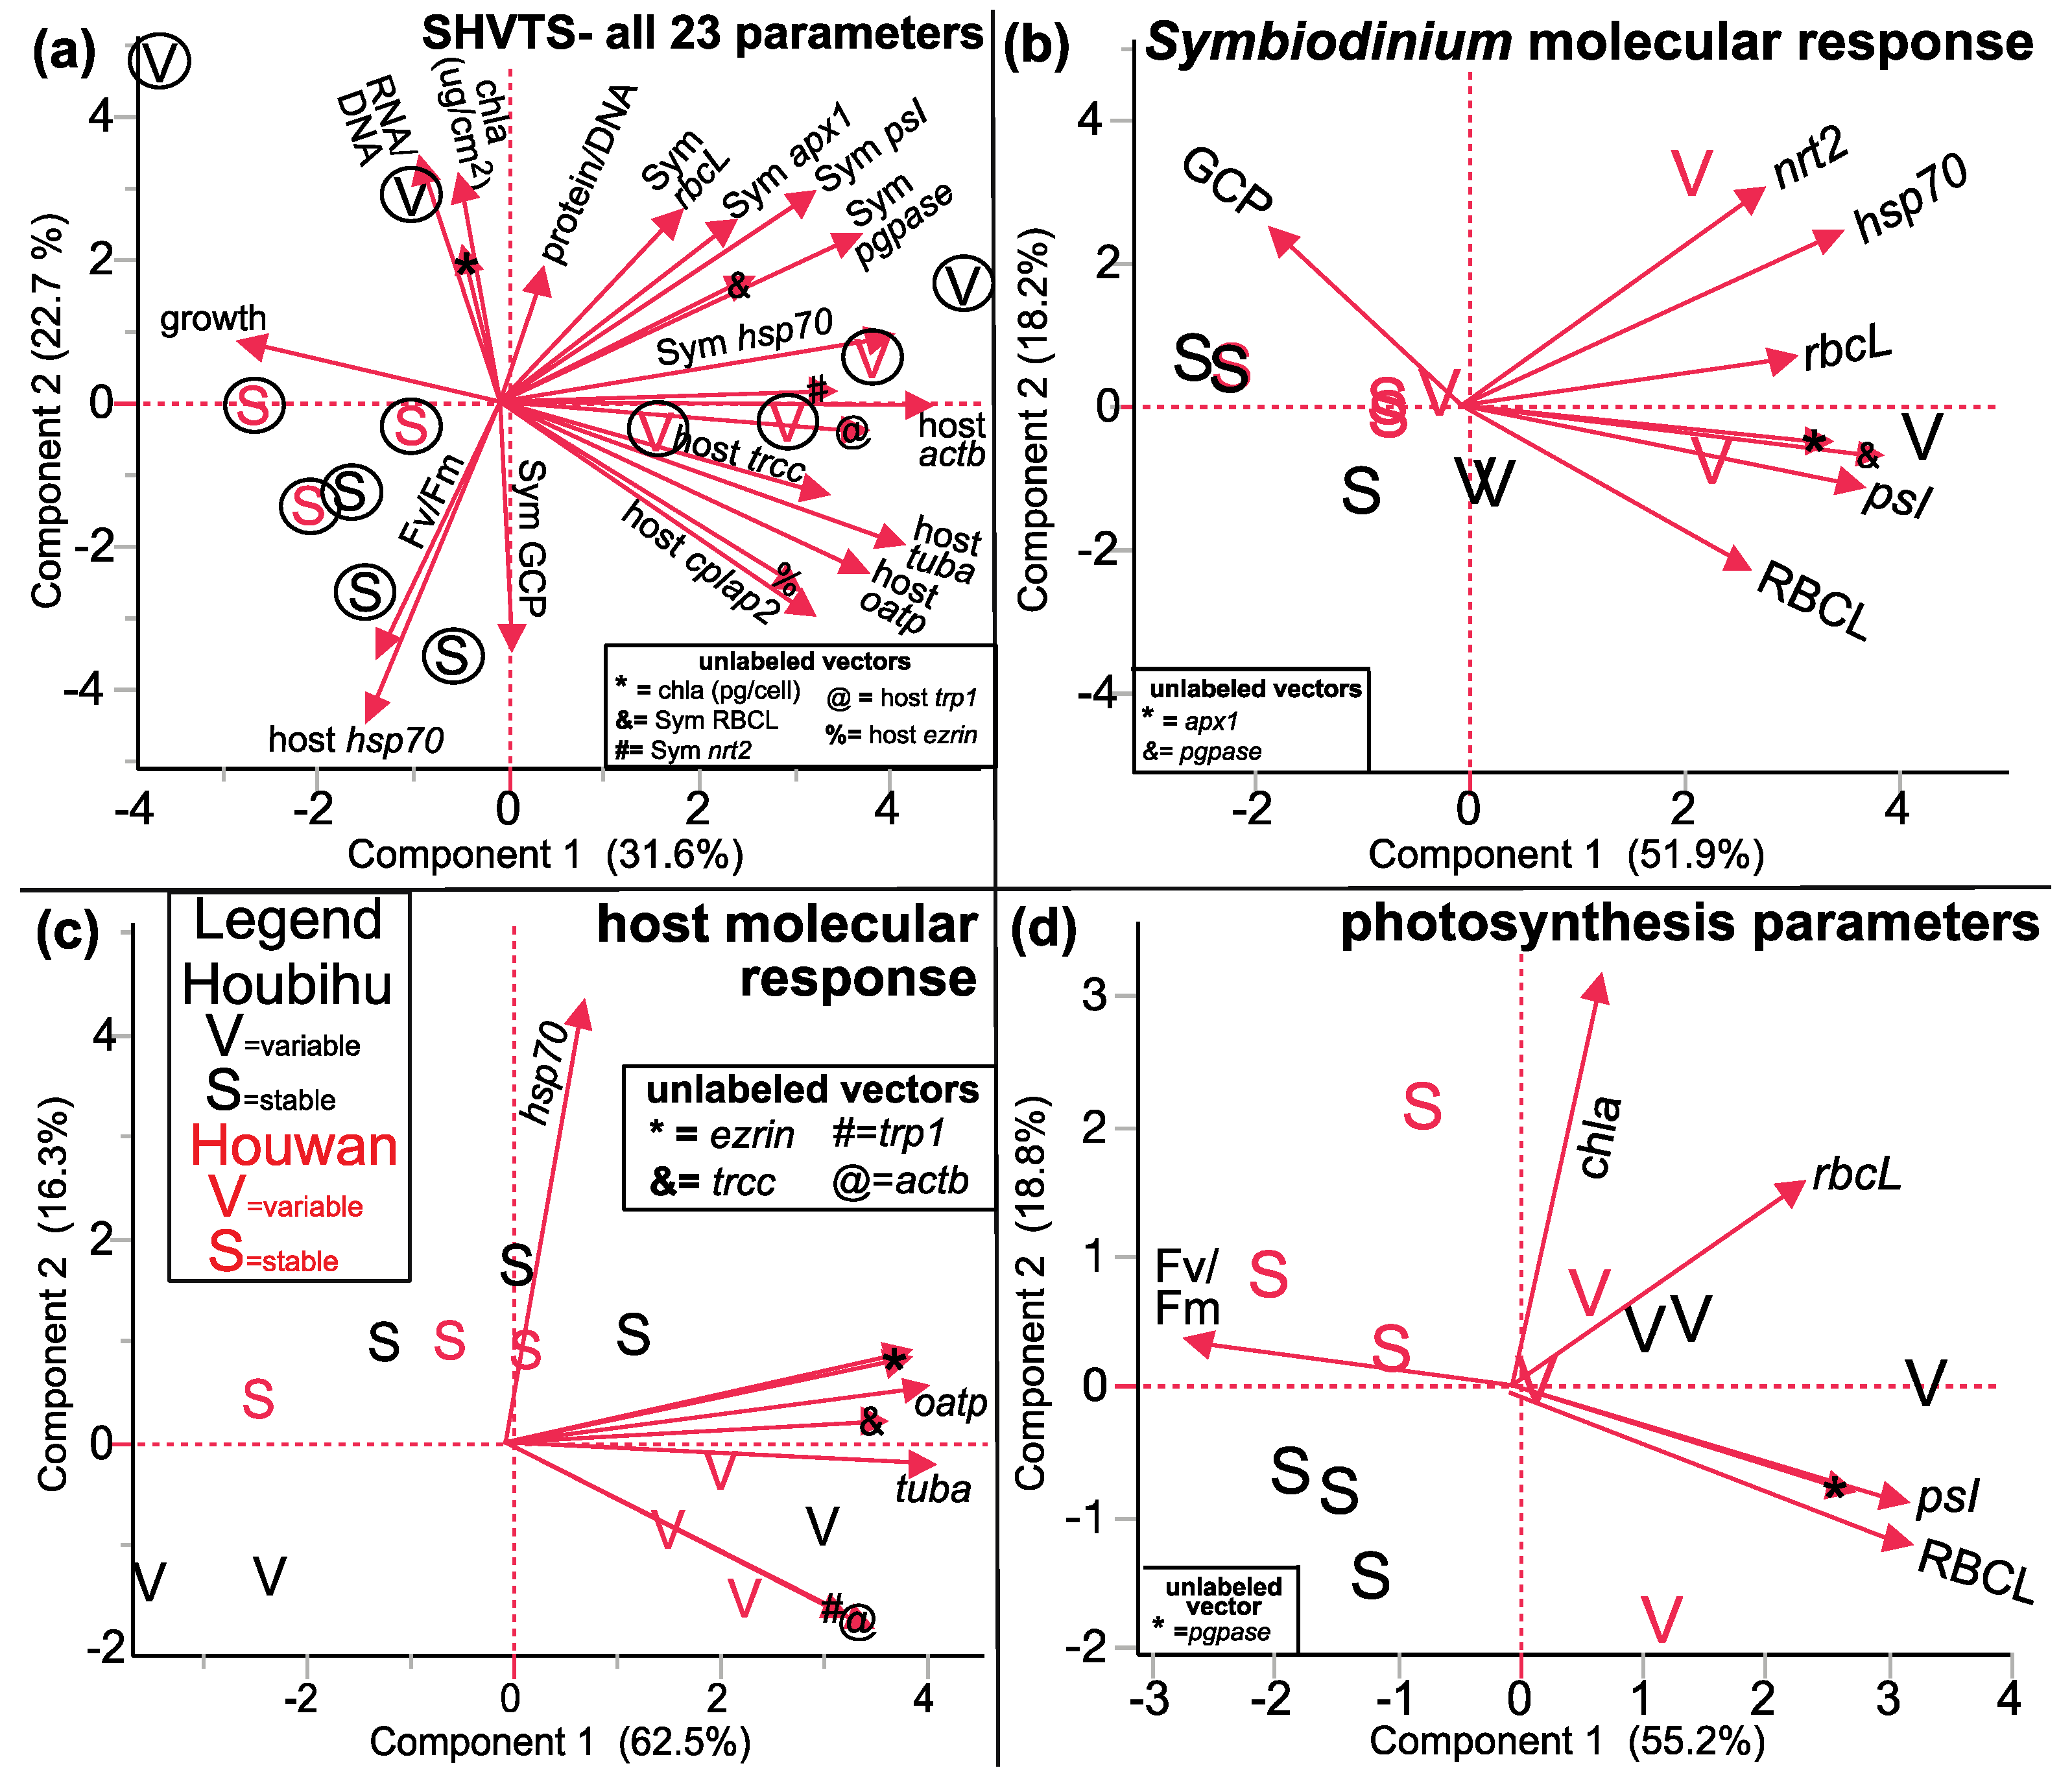
| All response variables | 5a | 23 | 12 | Two TT are well separated | Mix of host & Symbiodinium genes |
| Symbiodinium molecular response | 5b | 8 | 12 | Two TT are somewhat well separated | Symbiodinium genes & RBCL protein (PC1) |
| Host coral genes | 5c | 8 | 12 | Two TT are well separated | Host hsp70 (PC2) |
| Photosynthesis parameters only | 5d | 6 | 12 | Two TT are well separated | psI & RBCL |
| MANOVA (Figure 6) | |||||
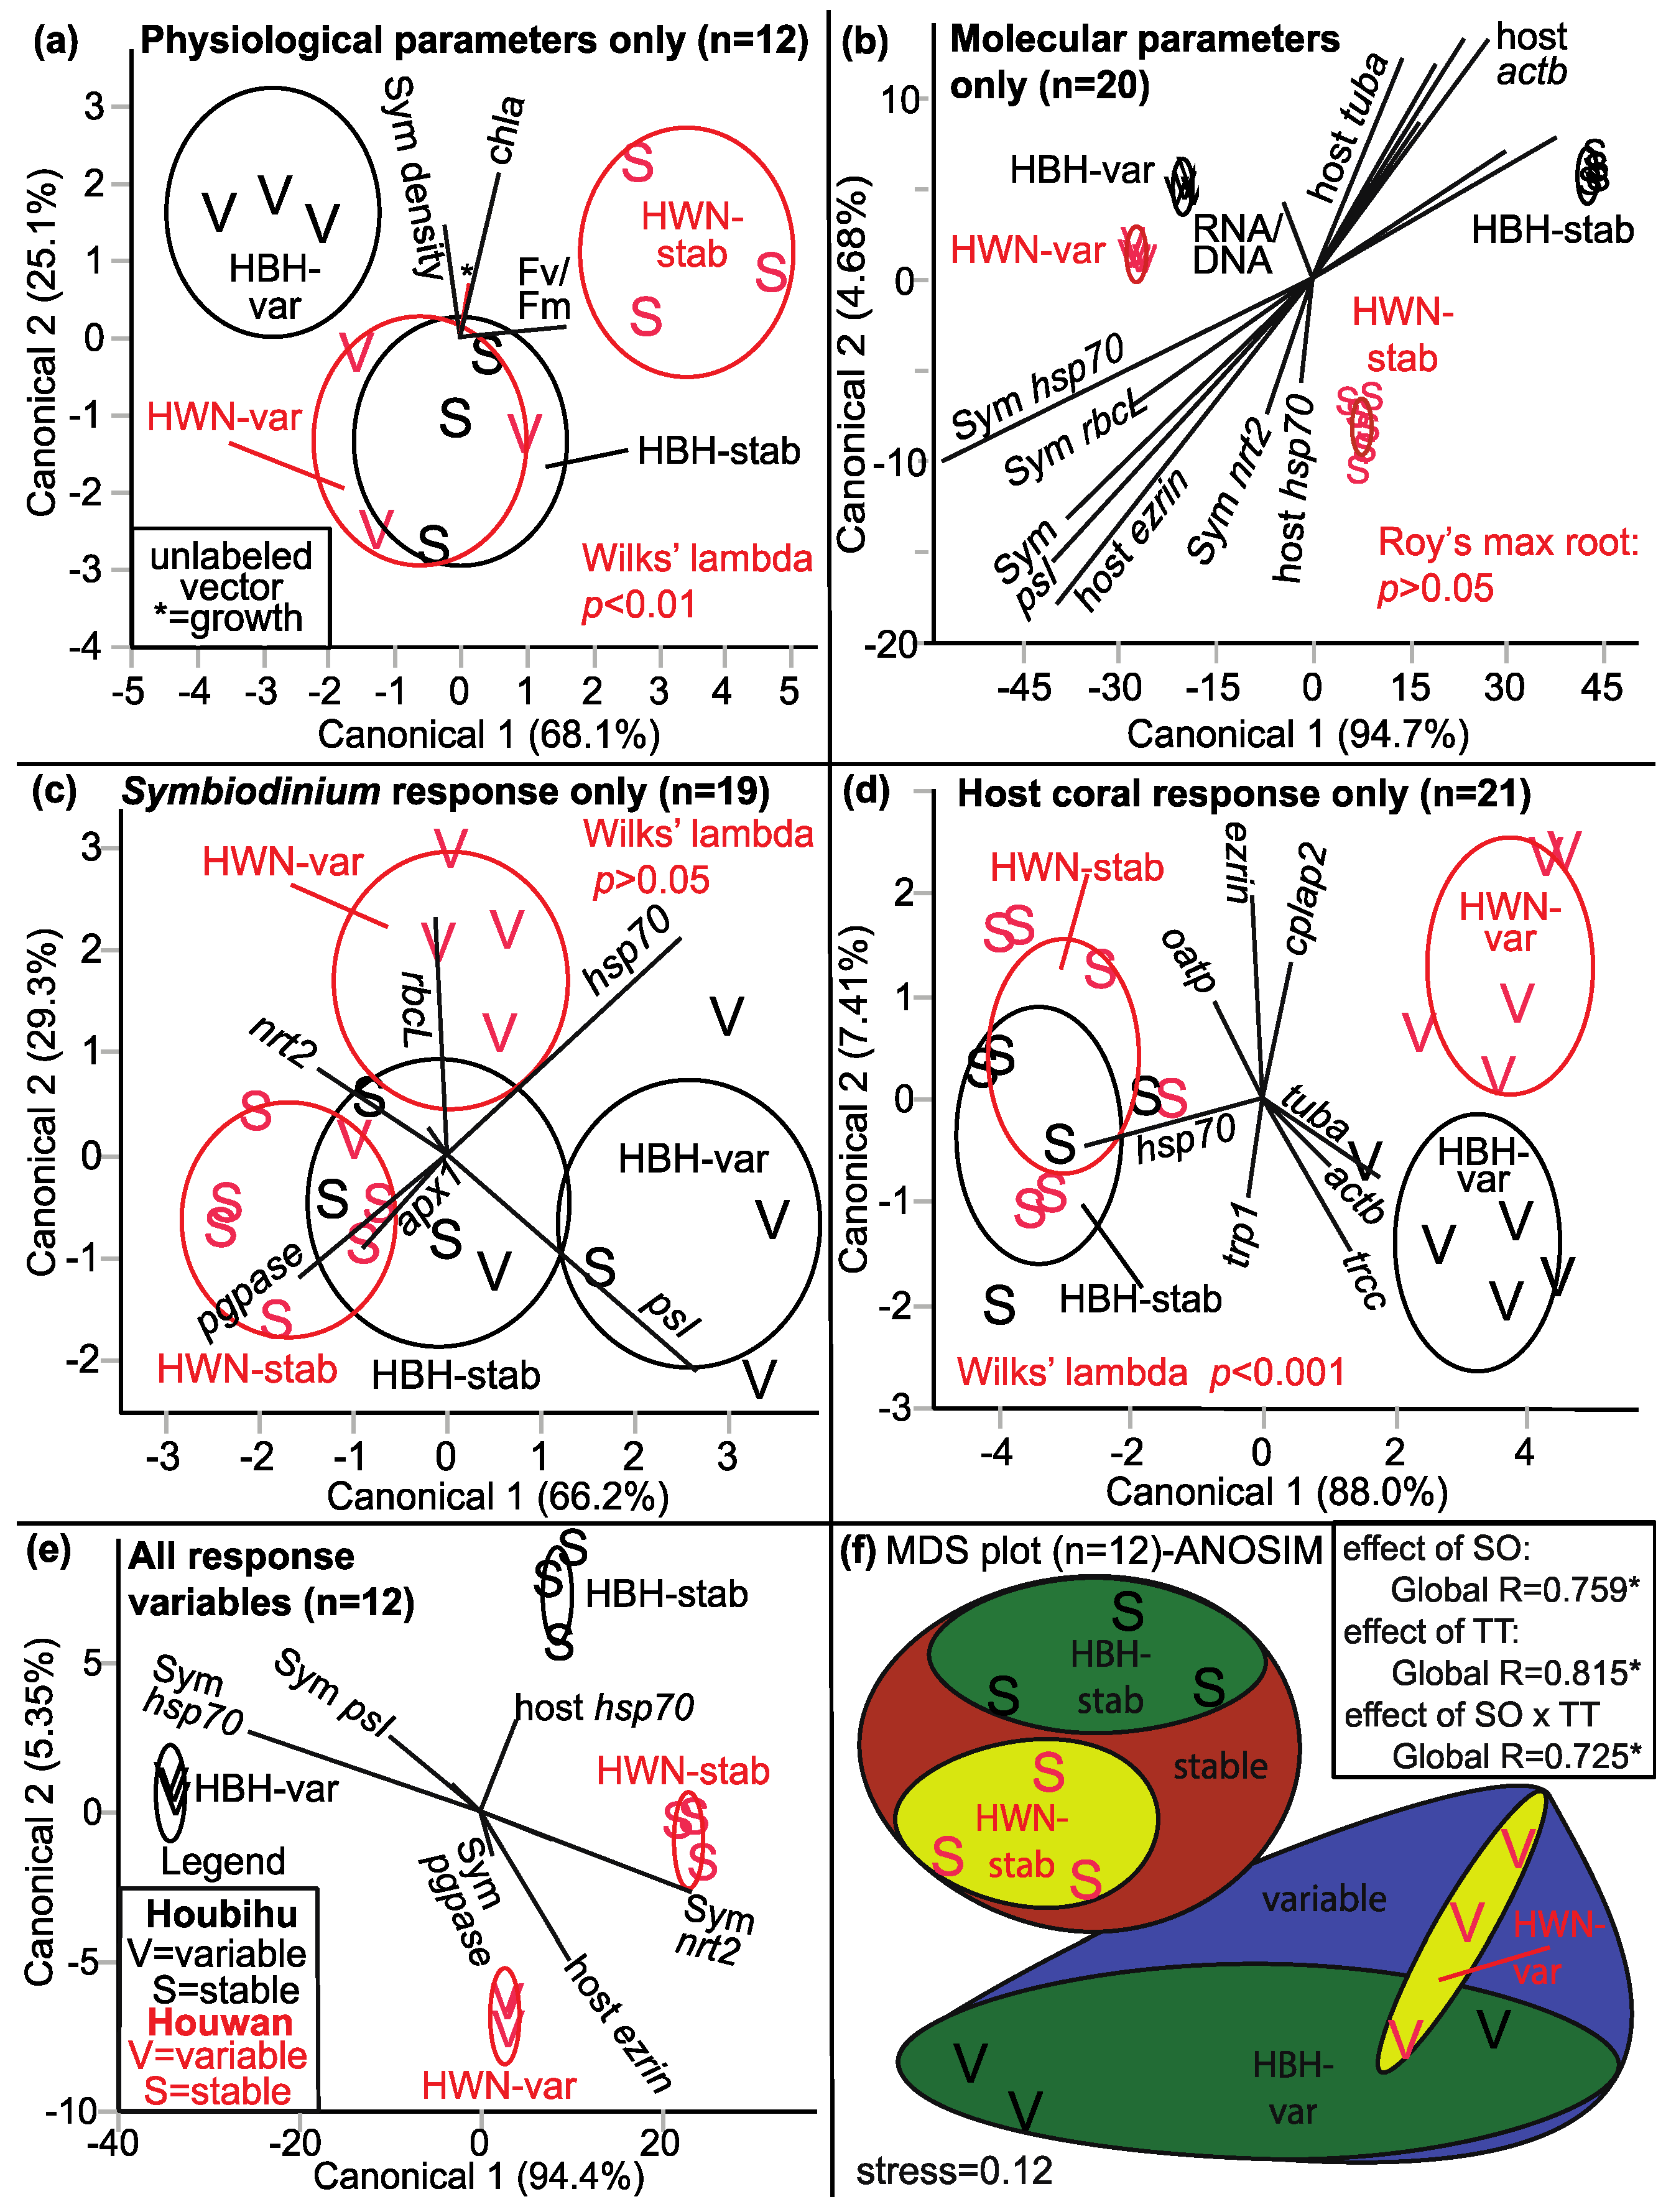
| Discrimination by SO × TT Physiological response only | 6a | 4 | 12 | Two groups are well separated (HBH-var & HWN-stab) * | Fv/Fm |
| Discrimination by SO × TT Molecular response only | 6b | 17 | 20 | Four SO × TT groups are well separated | Negative relationship between host actb & Symbiodinium psI + protein/DNA |
| Discrimination by SO × TT Symbiodinium molecular response | 6c | 7 | 19 | Moderate separation by SO × TT (p = 0.059) | |
| Discrimination by SO × TT Host coral genes only | 6d | 8 | 21 | Two TT are well separated * | Negative relationship between hsp70 & tuba |
| Discrimination by SO × TT All response variables | 6e | 23 | 12 | Four SO × TT groups are well separated b | Negative relationship between Symbiodinium hsp70 & nrt2 |
| Discrimination by SO only Physiological response only | 4 a | 12 | Two SO are somewhat separated | ||
| Discrimination by SO only Molecular response only | 17 a | 20 | Two SO are well separated * | Negative relationship between Symbiodinium pgpase & hsp70 | |
| Discrimination by SO only Symbiodinium molecular response | 7 a | 20 | Panmixia | ||
| Discrimination by SO only Host coral genes only | 8 a | 21 | Panmixia | ||
| Discrimination by SO only All response variables | 23 a | 12 | Two SO are well separated b | Negative relationship between Symbiodinium psI & hsp70 | |
| Discrimination by TT only Physiological response only | 4 a | 12 | Two TT are well separated (p = 0.052) | Fv/Fm | |
| Discrimination by TT only Molecular response only | 17 a | 20 | Two TT are well separated (p = 0.058) | Negative relationship between host tuba & oatp | |
| Discrimination by TT only Symbiodinium molecular response | 7 a | 20 | Two TT are well separated (p = 0.065) | Negative relationship between rbcL + hsp70 & apx1 + pgpase | |
| Discrimination by TT only Host coral genes only | 8 a | 21 | Two TT are well separated * | Negative relationship between hsp70 & actb + tuba + trcc | |
| Discrimination by TT only All response variables | 23 a | 12 | Two TT are well separated b | Negative relationship between host hsp70 & actb | |
| MDS (Figure 6) | 6f | 23 | 12 | Four SO × TT groups are well separated * | Physiological parameters & Symbiodinium psI c |
© 2016 by the author; licensee MDPI, Basel, Switzerland. This article is an open access article distributed under the terms and conditions of the Creative Commons Attribution license ( http://creativecommons.org/licenses/by/4.0/).
Share and Cite
Mayfield, A.B. Uncovering Spatio-Temporal and Treatment-Derived Differences in the Molecular Physiology of a Model Coral-Dinoflagellate Mutualism with Multivariate Statistical Approaches. J. Mar. Sci. Eng. 2016, 4, 63. https://doi.org/10.3390/jmse4030063
Mayfield AB. Uncovering Spatio-Temporal and Treatment-Derived Differences in the Molecular Physiology of a Model Coral-Dinoflagellate Mutualism with Multivariate Statistical Approaches. Journal of Marine Science and Engineering. 2016; 4(3):63. https://doi.org/10.3390/jmse4030063
Chicago/Turabian StyleMayfield, Anderson B. 2016. "Uncovering Spatio-Temporal and Treatment-Derived Differences in the Molecular Physiology of a Model Coral-Dinoflagellate Mutualism with Multivariate Statistical Approaches" Journal of Marine Science and Engineering 4, no. 3: 63. https://doi.org/10.3390/jmse4030063