1. Introduction
Theoretical knowledge of the generation, propagation, dissipation and interaction with coastal and port structures of infragravity waves has been highly developed since the 1950s. The first observations of this type of oscillatory flow (between frequencies of 1/200 Hz and 1/25 Hz) associated with wave groups, initially established analytical relations and shoaling propagation of infragravity waves with wave group celerity, mathematically explaining the genesis of bound long wave energy, related to non-linear, spatial and temporal changes of the momentum flux of the wave trains travelling towards the coast [
1,
2,
3].
The importance of knowing bound long wave characteristics at the coast (long wave height
HLW and lon wave period
TLW) is obvious: (1) for the correct assessment of coastal morphodynamics influenced by long period oscillations [
4,
5,
6]; and for harbor agitation [
7,
8,
9].
HLW and
TLW are defined as follows:
where
S is the spectral energy density,
f the energy frequency and
θ the energy propagation direction.
To conduct such studies, it is therefore necessary to reconstruct the infragravity spectra in the coastal zone, taking into account the non-linear transformation processes, shoaling, reflection and bottom friction dissipation, as well as considering the full spectrum interaction with natural and artificial topography/bathymetry shapes.
Therefore, the aim of the present study is to develop a methodology to infer the infragravity contribution of the wave spectrum in front of Geraldton Harbor, to later propagate it towards the coast and, as an end-product, to transfer this energy into the main basin.
The specific objectives of this work are: (1) to create a new long (12 years) hourly database for the parameters related to the bound long waves travelling from the outer zone of the harbor towards the basin; and (2) to improve the response of the harbor due the action of long waves, proposing different geometric modifications/alternatives.
This study is organized as follows:
Section 2 presents an overview of the methodology for the reconstruction of the infragravity wave statistics at Geraldton and a brief description of the analytical approaches to infer infragravity wave spectra.
Section 3 presents the validation and diagnosis of the results obtained considering the present geometry of the harbor.
Section 4 proposes seven different geometries and the overall discussion of the results.
Section 5 evaluates the long wave current patterns (directions, oscillations and magnitudes) for one of the solutions proposed and for an identified inoperability event (27 August 2007), by means of the use of an advanced numerical tool (Boussinesq-type).
2. Methodology for Long Wave Assessment
2.1. Overview
Considering any available wave numerical reanalysis, the present methodology provides a way to modify, propagate and reconstruct series of wave spectra in the nearshore, improving wave agitation analysis in harbors, including both the short (1/25 Hz and 1 Hz) and infragravity wave energy bands (1/200 Hz and 1/25 Hz). In the present study, the approach is applied to the western coast of Australia, using the 12-year Abrolhos hindcast database (provided by the Mid West Ports Authority (MPWA)) at the so-called Funwave boundary location (114.554199, −28.763599), as the main source of information.
As the first approach, the Funwave location is considered as the release point for the bound long wave. This hypothesis allows a comparison between the long wave data obtained in this location and the Acoustic Wave And Current Profiler (AWAC, Nortek®) measurements. A distance of 1.3 km separates both locations, so changes due to refraction and shoaling should be expected; as the short wave propagates from Funwave to the AWAC location. After several tests, negligible differences were observed.
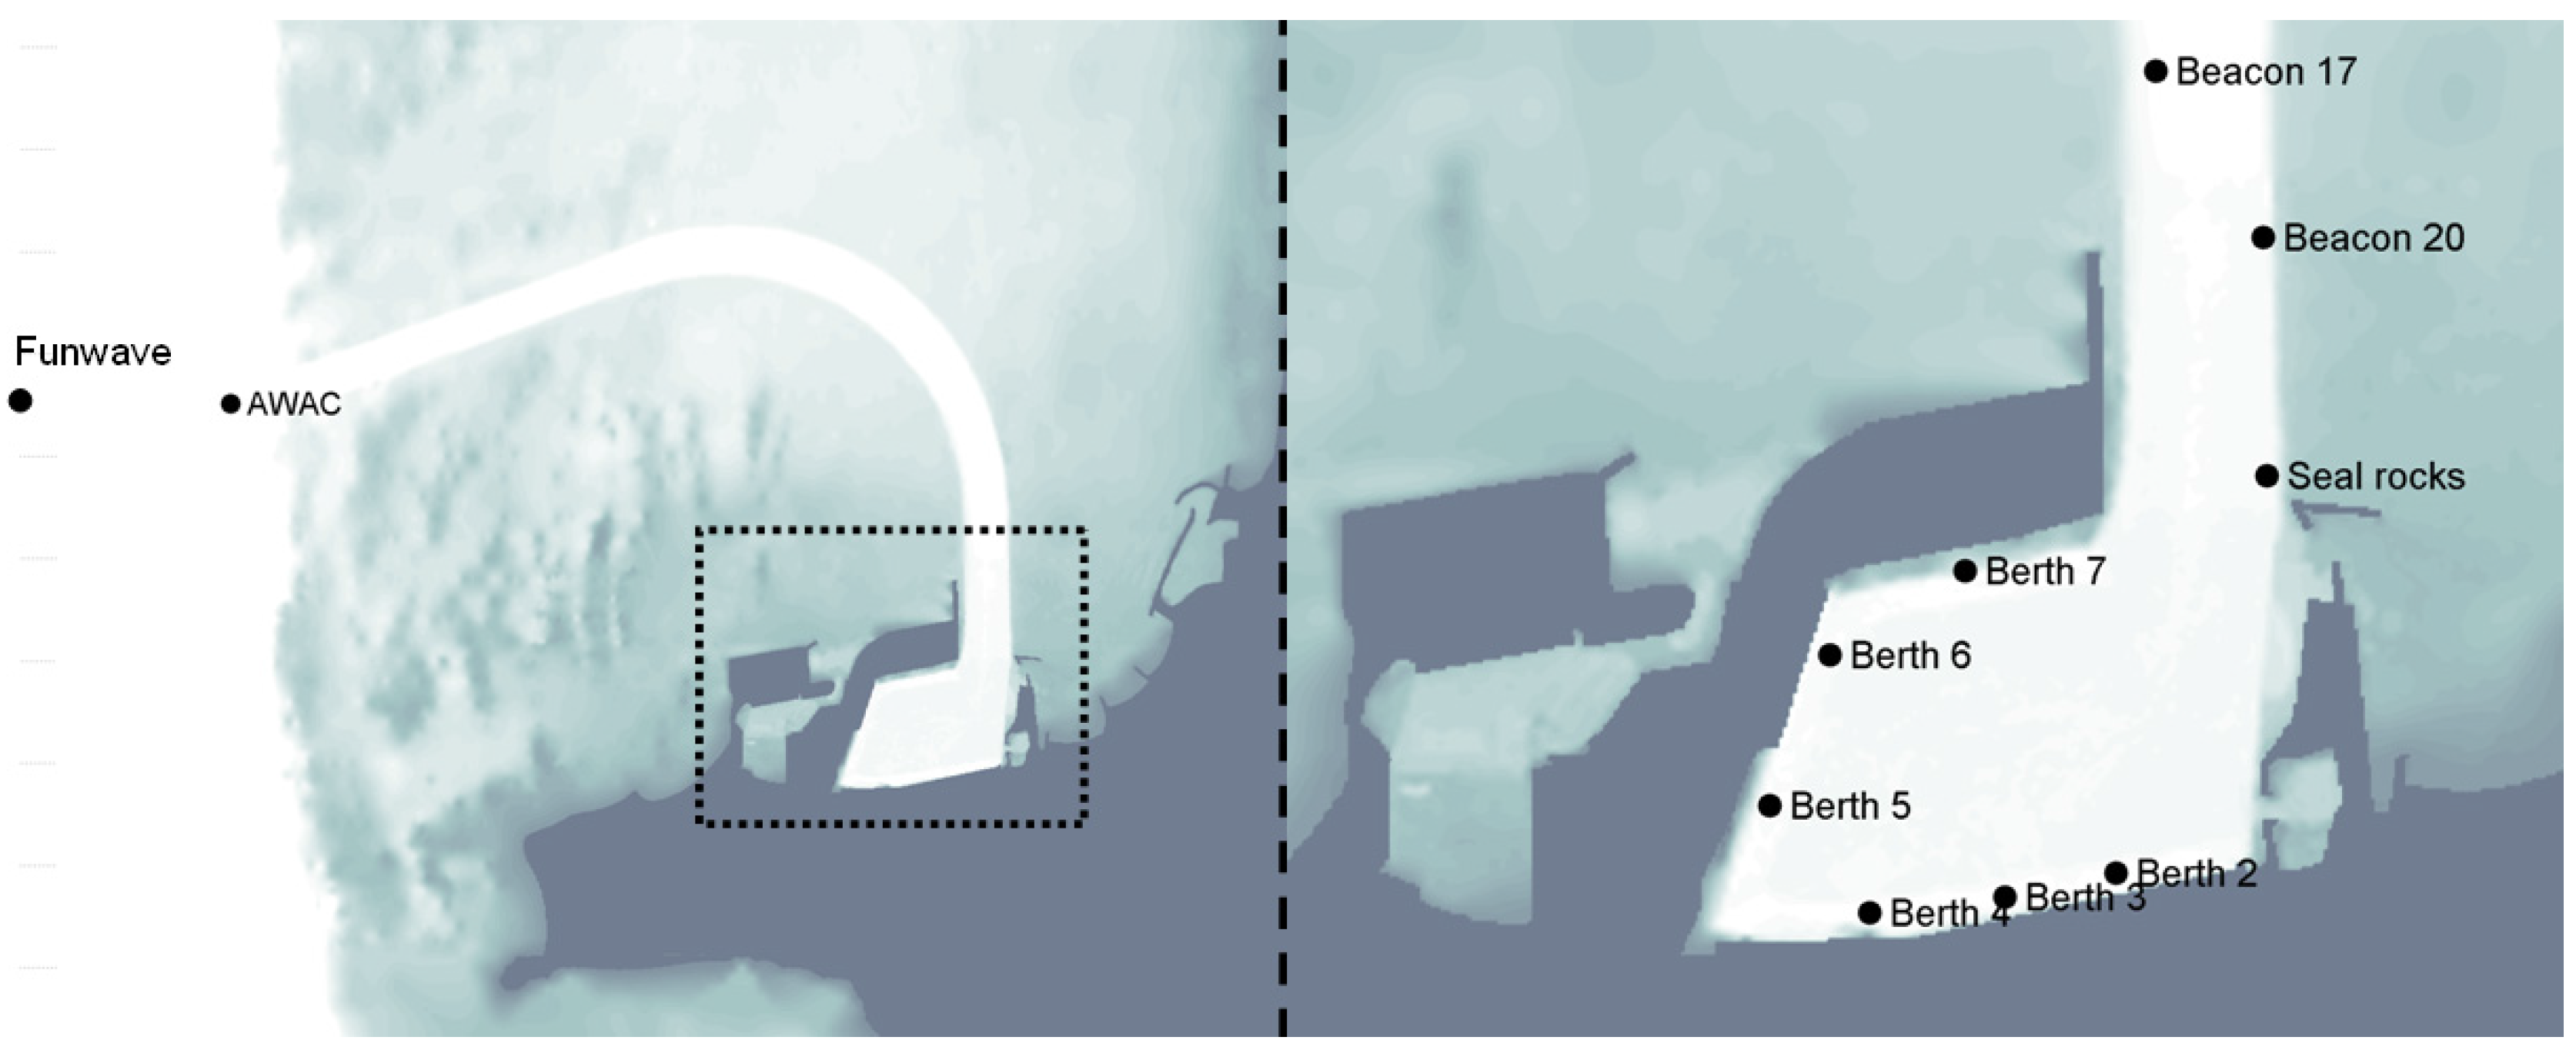
Results are validated with measured data in 8 different locations (Berths 2, 5 and 6 for 2004, 3 and 4 for 2007, 7 for 2009 to 2009 and Beacons 17 and 20 and the Seal Rocks location for the year 2013; see
Figure 1).
Figure 1.
Port Geraldton (Western Australia). Bathymetry and location of gauges used in this study.
Figure 1.
Port Geraldton (Western Australia). Bathymetry and location of gauges used in this study.
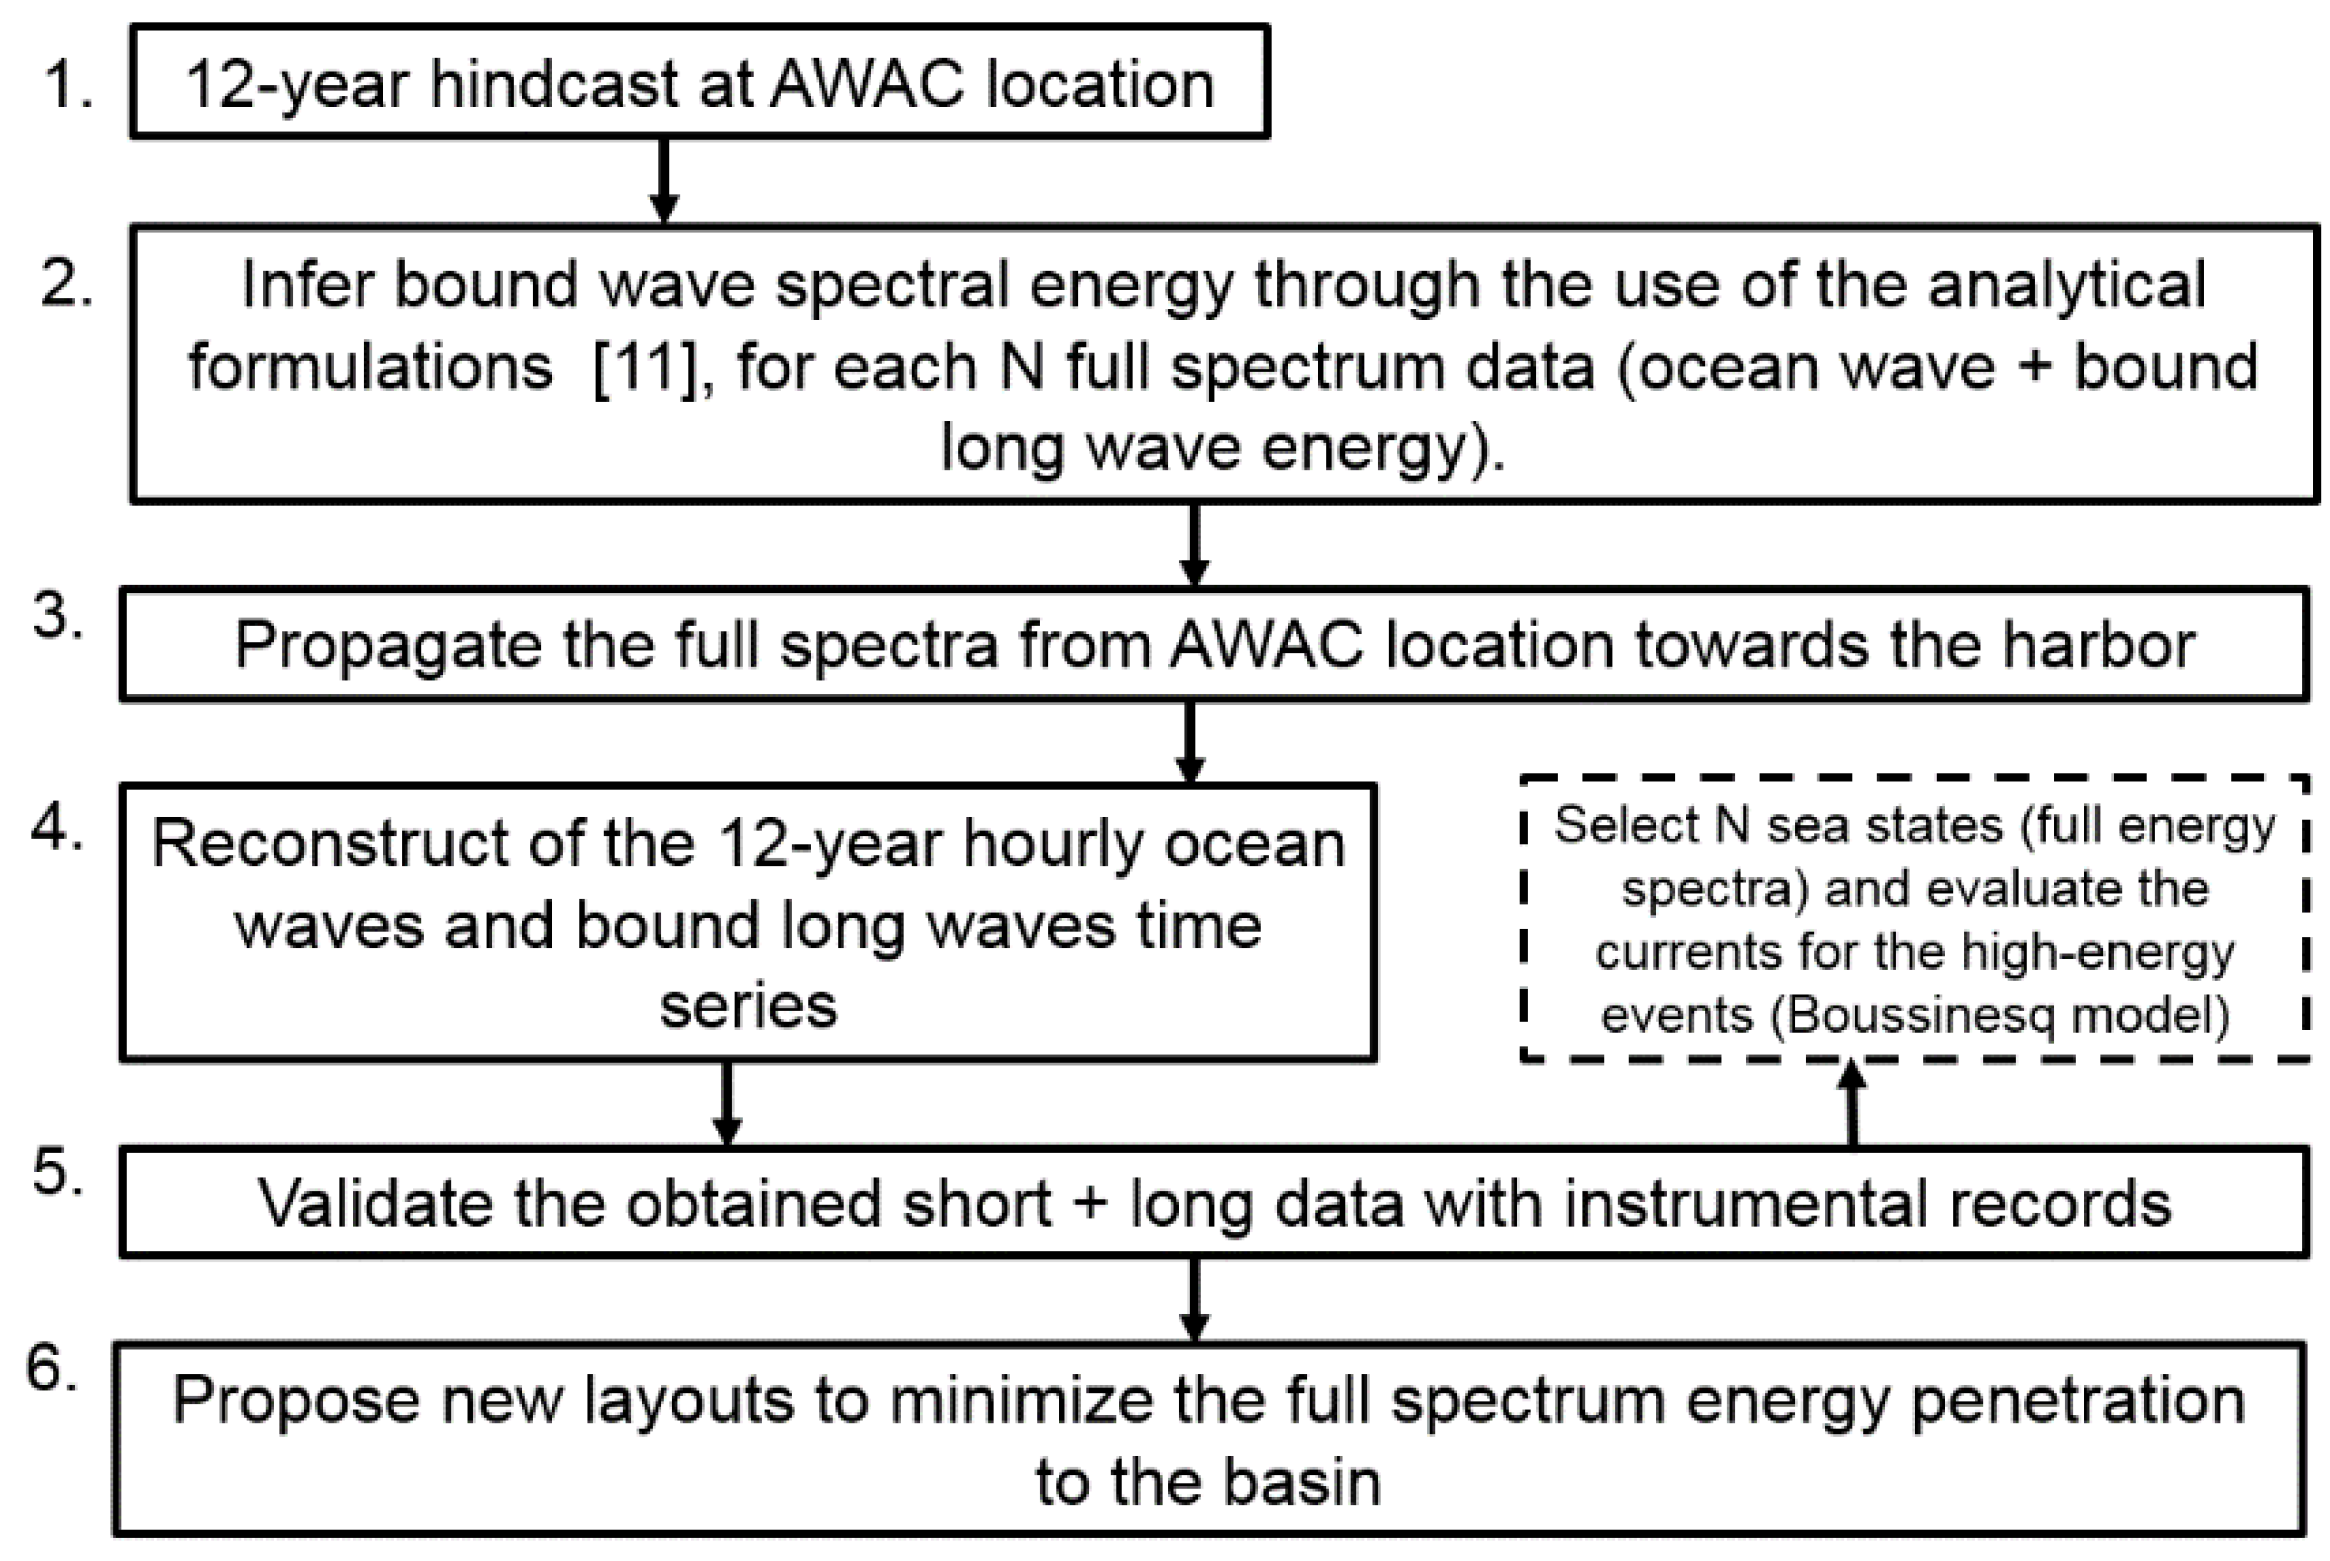
The methodology, outlined in
Figure 2, follows the steps described next: (1) read the hourly hindcast (short wave) spectra provided; (2) modify the energy of each wave spectra to include infragravity energy (obtaining the full spectra); (3) Numerically propagate the modified full spectra for shallow water and coastal areas. Use the hourly full spectral data to force a harbor agitation numerical model (
i.e., elliptic approximation of the mild slope equation or/and a Boussinesq model); (4) Reconstruct the 12-year hourly time series of short and bound long waves inside the harbor; (5) Validation against instrumental observations; (6) Propose new layouts to minimize the full spectrum energy penetration to the basin.
Figure 2.
Methodological framework to assess and reconstruct time series for wave + bound long wave spectrum.
Figure 2.
Methodological framework to assess and reconstruct time series for wave + bound long wave spectrum.
The main hypothesis of the present methodology, applied to Geraldton Harbor, is the release of free long waves due to the breaking processes of short wave groups (bound long waves) above the reef platform. This issue seems to be the triggering problem for long wave propagation towards the harbor [
9], its penetration and interaction with the main basin contours. Once the bound long wave is released, the free long wave hydrodynamics seems to behave independently of the short wave propagation.
2.2. Bound Long Wave Prediction
One of the main steps of this methodology is to analytically obtain an estimation of the low frequency energy fraction in the deep water spectra and its dependency on the spectral shape characteristics. Low-frequency waves associated with the short wave field are forced by the radiation stress gradient, generating low-frequency periods adopt celerities and dimensions directly related to wave grouping [
3].
With the aim of being able to evaluate infragravity wave heights and periods analytically as second order oscillations, early proposed formulas were derived through the application of the Laplace equation [
10,
11]. Low-frequency energy is obtained as a result of the combinations between different frequencies and the mean directions of propagation, of each energy component of the wave spectrum and for each possible pair of frequencies
fn–fm and directions
θq−θr, respectively.
The second-order free surface bound long wave linked to a wave spectrum can be evaluated with the following analytical summation of deep water components, as follows [
11]. It is important to mention that these equations may over-predict long wave heights at the Funwave site, since equations have depth dependency, and the highly non-linear transformations over the steep reef face are not implicit. However, some preliminary tests were made using different depth values, obtaining small changes on long wave height and period.
For all possible combinations of frequency components
n and
m and with their respective directions
q and
r, A represents each individual amplitude of the discrete spectral shape and
Ce is the coupling coefficient for the bound long wave to the wave spectra, defined as:
and for shallow water:
where g is the gravity acceleration constant, in m/s
2;
kn is the wave number for spectral component
n, in 1/m;
km is the wave number for spectral component
m, in 1/m; Δθ is the angular difference between each individual energy component;
kn is the wave number vector associated with the bound long wave, in 1/m; ω
j = ω
n − ω
m is the angular frequency difference for each individual energy component; and
h is the bathymetry depth at each wave spectrum location, in
m.
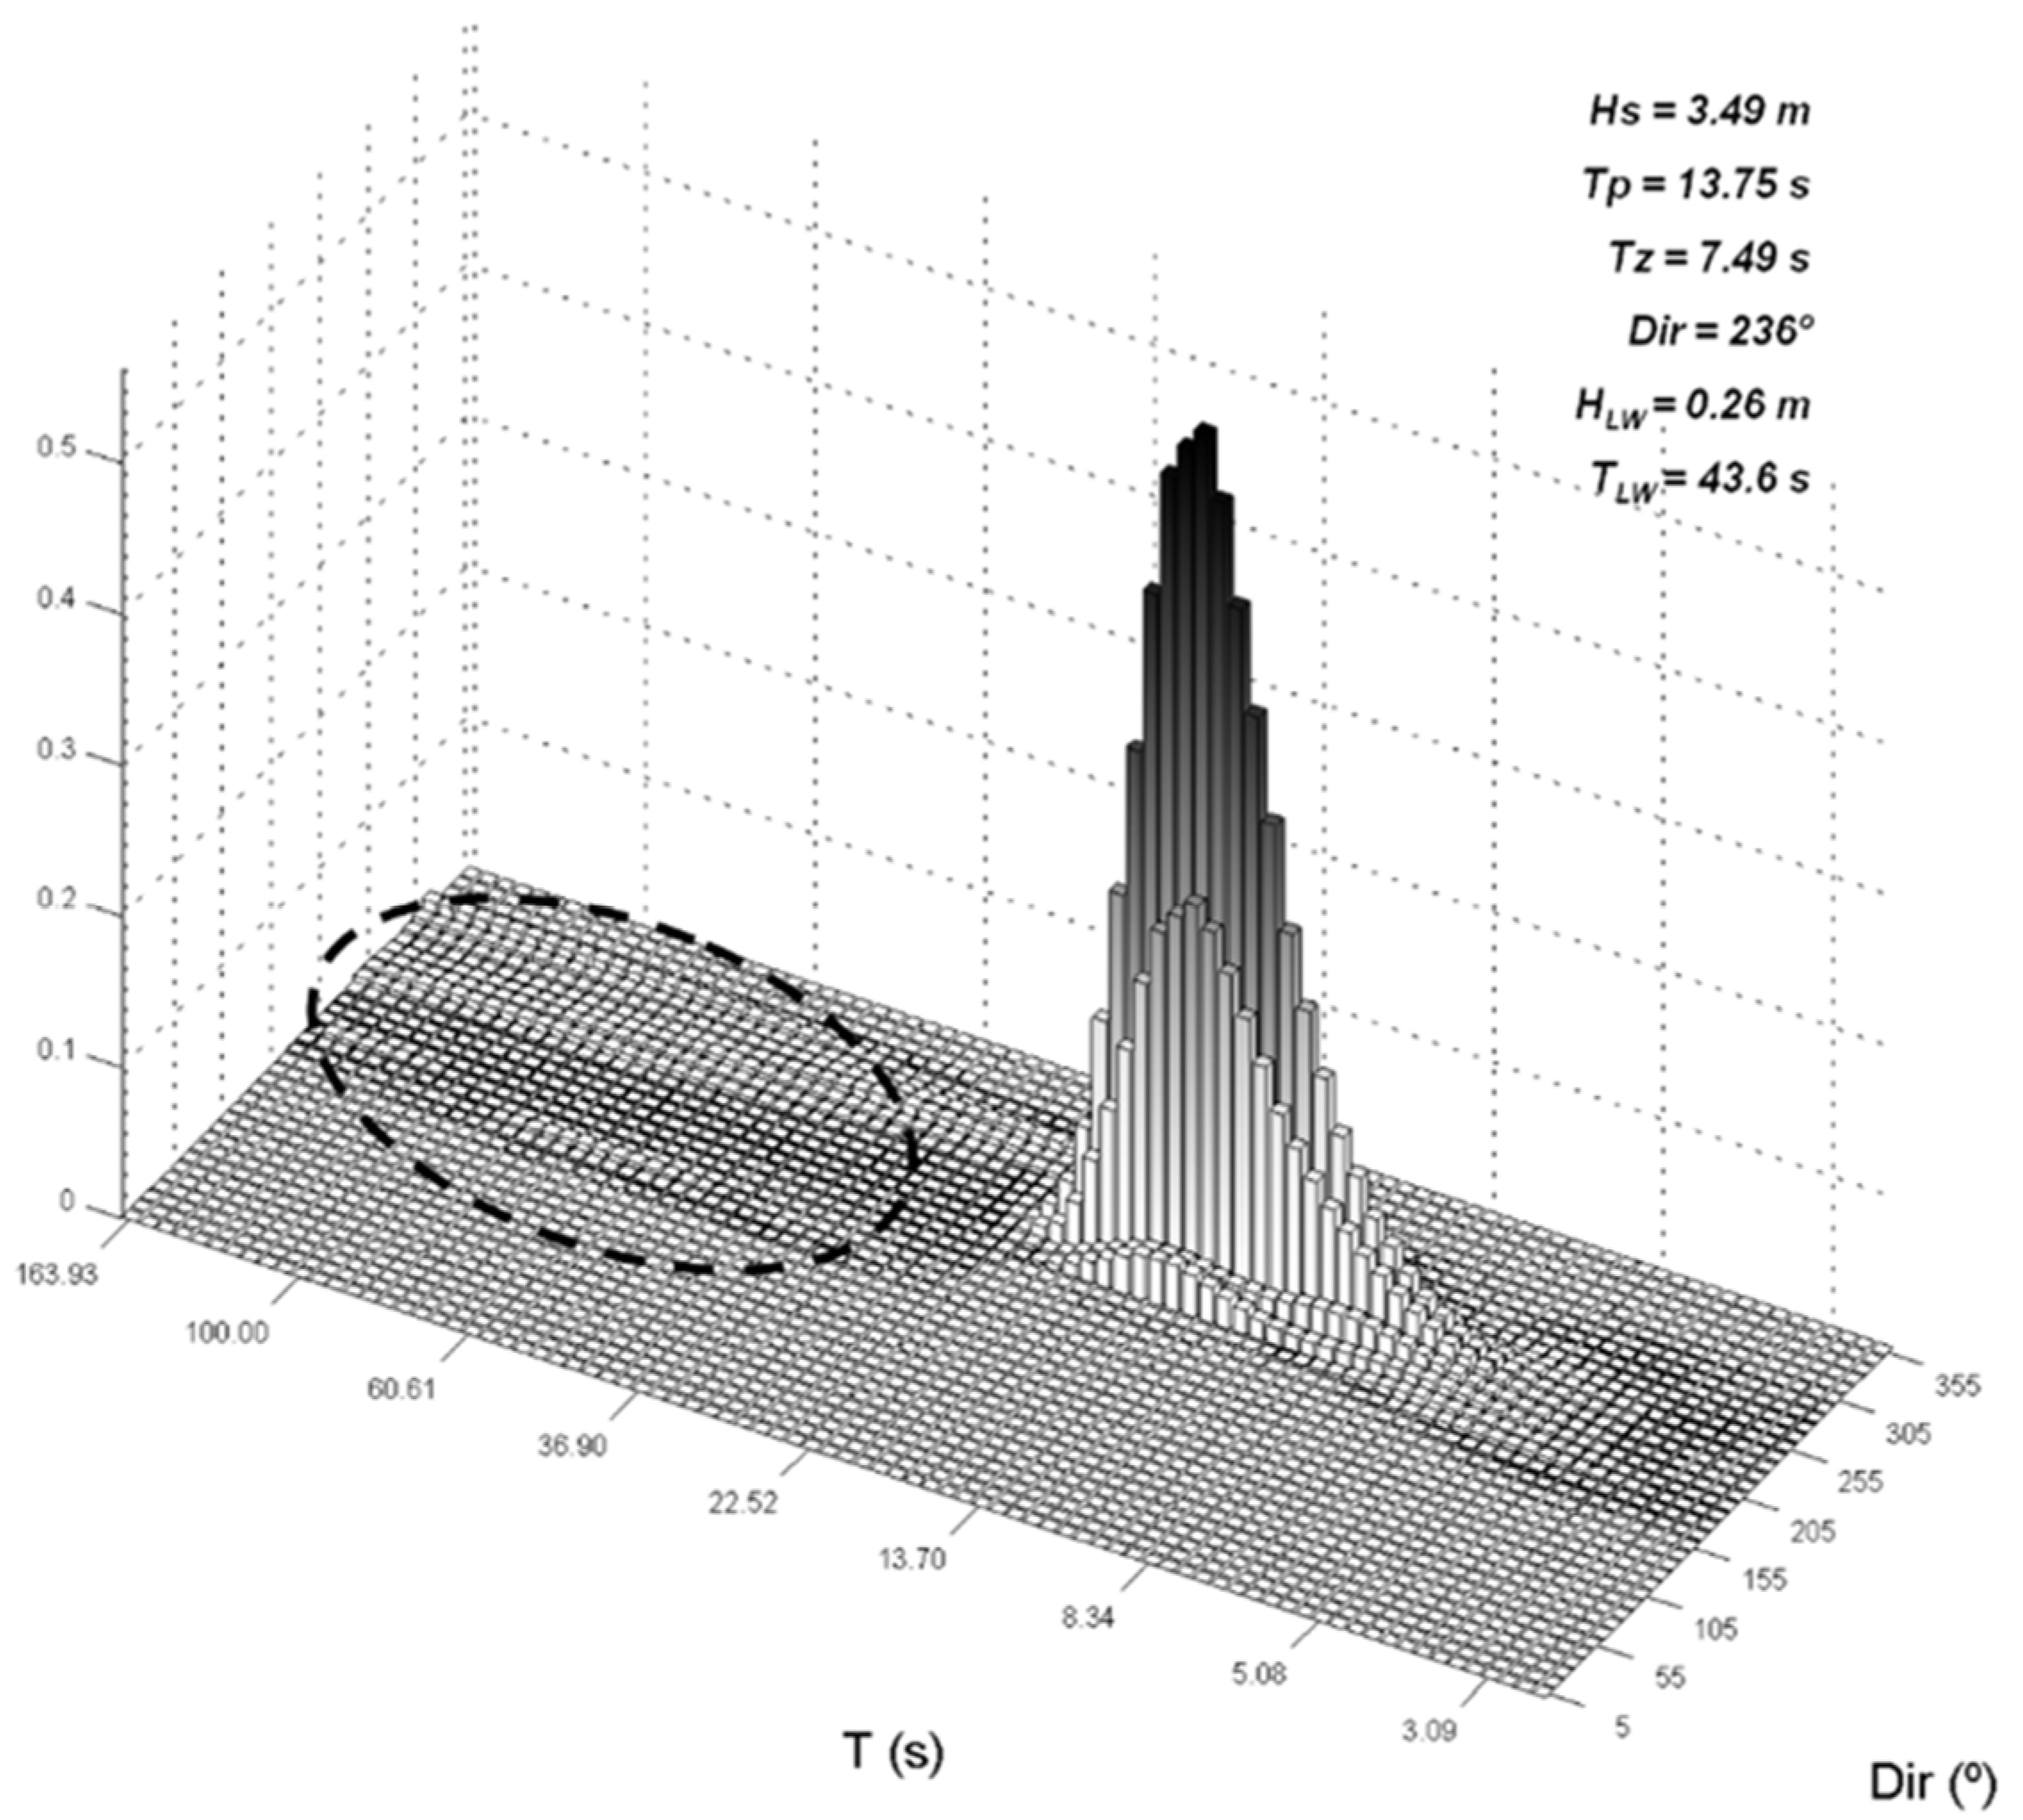
Figure 3 shows an example of the application of the equations described above, combining short wave energy components for a spectrum selected randomly from the 27 August 2007 inoperability event (provided by the MWPA). Initial spectral characteristics are: significant wave height of
Hs = 3.49 m, peak period
Tp = 13.75 s, mean period
Tz = 7.49 s and mean propagation direction (in nautical)
θ = 236°. After applying Equations (1) and (2), the obtained long wave height and mean period are:
HLW = 0.26 m and
TLW = 43 s. This methodology was applied in for the infragravity and resonance wave hindcast in some ports in the north of Spain, obtaining good
HLW and
TLW predictions [
12].
Figure 3.
Modified full amplitude spectra for the 27 August 2007 inoperability event at the AWAC location. Bound long wave energy indicated with a dashed-line circle.
Figure 3.
Modified full amplitude spectra for the 27 August 2007 inoperability event at the AWAC location. Bound long wave energy indicated with a dashed-line circle.
3. Validation and Diagnosis
When waves reach coastal protection structures and harbor facilities, wave diffraction and reflection are the main wave-structure interaction processes that must be taken into account for an adequate agitation study.
At present, models that are based on the elliptic mild slope wave equation are the most commonly used for this type of study. These models offer a practical and effective way to assess harbor agitation, considering real irregular wave forcing interacting with complex bathymetric and structure contours. In this study, the Mild Slope Ports (MSP) model is used [
13,
14], considering a finite element scheme, solved over a 2DH (two-dimensions in the horizontal domain
x-y with vertical integration of the propagation phusics) triangular element and unstructured depth-adaptative mesh. This model allows considering the aforementioned linear wave propagation effects and partial reflection at harbor contours. To run this model, it is necessary to define a numerical domain with a resolution of at least 15 nodes per wavelength, to define the geometry of the port and appropriate boundary conditions, including the outer wave spectral forcing and inner limits of the port, and to set the spectral forcing contour.
The MSP simulations are high CPU time consuming (i.e., one to two days per spectral run on a standard PC). For this reason, a monochromatic component energy reconstruction approach is proposed for this methodology. The hourly spectra at the mouth of the harbors are decomposed into the linear sum of all of the components (monochromatic waves) proposed for the full spectra discretization. Hence, a range of monochromatic waves for different wave periods T and directions θ must be pre-established for each spectral dataset at the mouth of the harbor, considering always a unitary wave height. Therefore, the calculation time is dramatically optimized (i.e., all of the monochromatic components defining each spectrum can be transformed within one week in one standard CPU, including the 12-year post-reconstruction statistics process for each harbor layout). As will be shown, according to the quality of the validation presented next, it seems that the necessary hypothesis of linearity to address this approach is fair enough to achieve the results expected, as can be seen in the validation presented new. It is noteworthy that for this present study and as a preview of a complete one, only long wave energy is simulated and propagated considering reflection coefficients of 100%. After simulating the 12-year hourly full, long wave time series can be obtained at any point inside the harbor. It is also important to point out that in the present study, only spectral free long waves are propagated numerically towards the harbor. Short wave spectra, non-linear effects, vortex dissipation, friction and energy transfer between spectral components have been discarded. Nevertheless this hypothesis seems to be adequate and a good approximation, as can be seen in the next section.
3.1. Validation
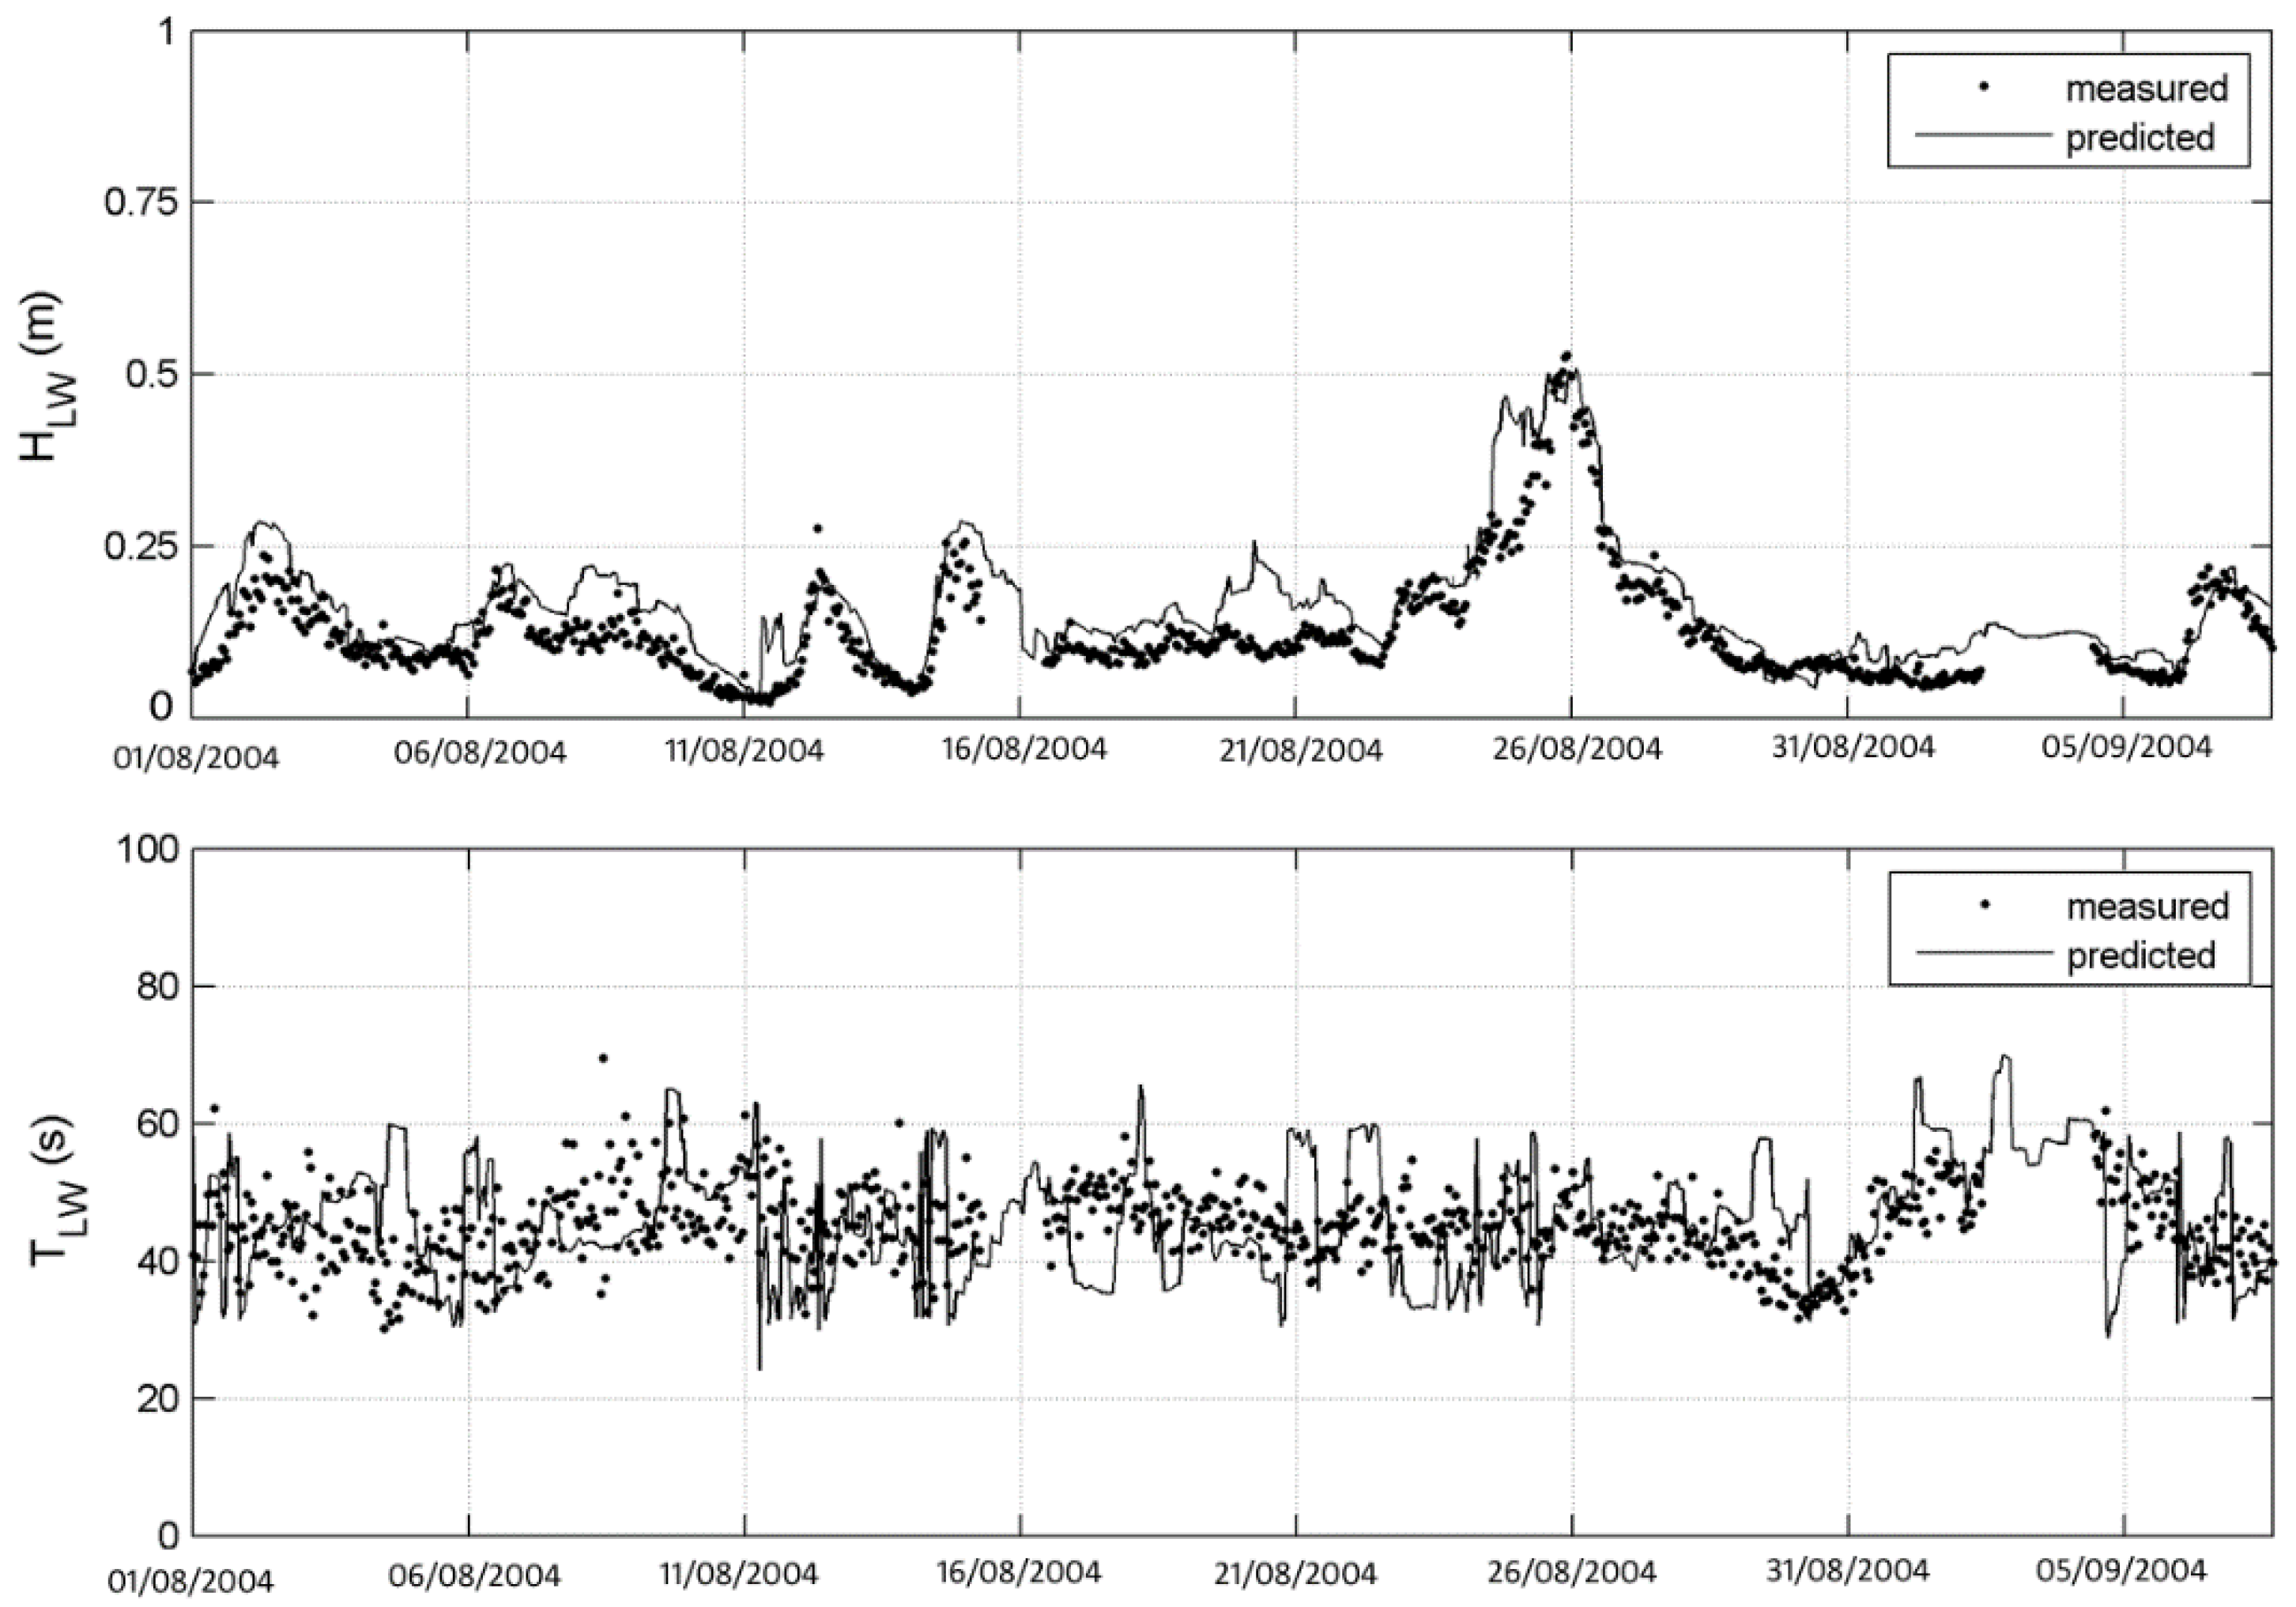
The first step is the validation of the methodology.
Figure 4 presents numerical predictions of the long wave height
HLW and period
TLW. They are compared to data measured during 2004 at the AWAC location (provided by the MWPA; see
Figure 1).
Figure 4.
Comparison of long wave time series obtained for HLW and TLW, for the AWAC location, during August and September 2004. Predicted (line); measured (points).
Figure 4.
Comparison of long wave time series obtained for HLW and TLW, for the AWAC location, during August and September 2004. Predicted (line); measured (points).
At the AWAC location, HLW is well predicted along the whole instrumental record. For TLW, it can be observed that predicted values present a smoother behavior in time, not matching all of the temporal variations shown in the records. Average trends and the general envelope of this variable on time is well predicted by the methodology proposed. Still, TLW predicted results can be considered to be a good approximation taking the advantage of having long-term time series of infragravity waves inside the harbors.
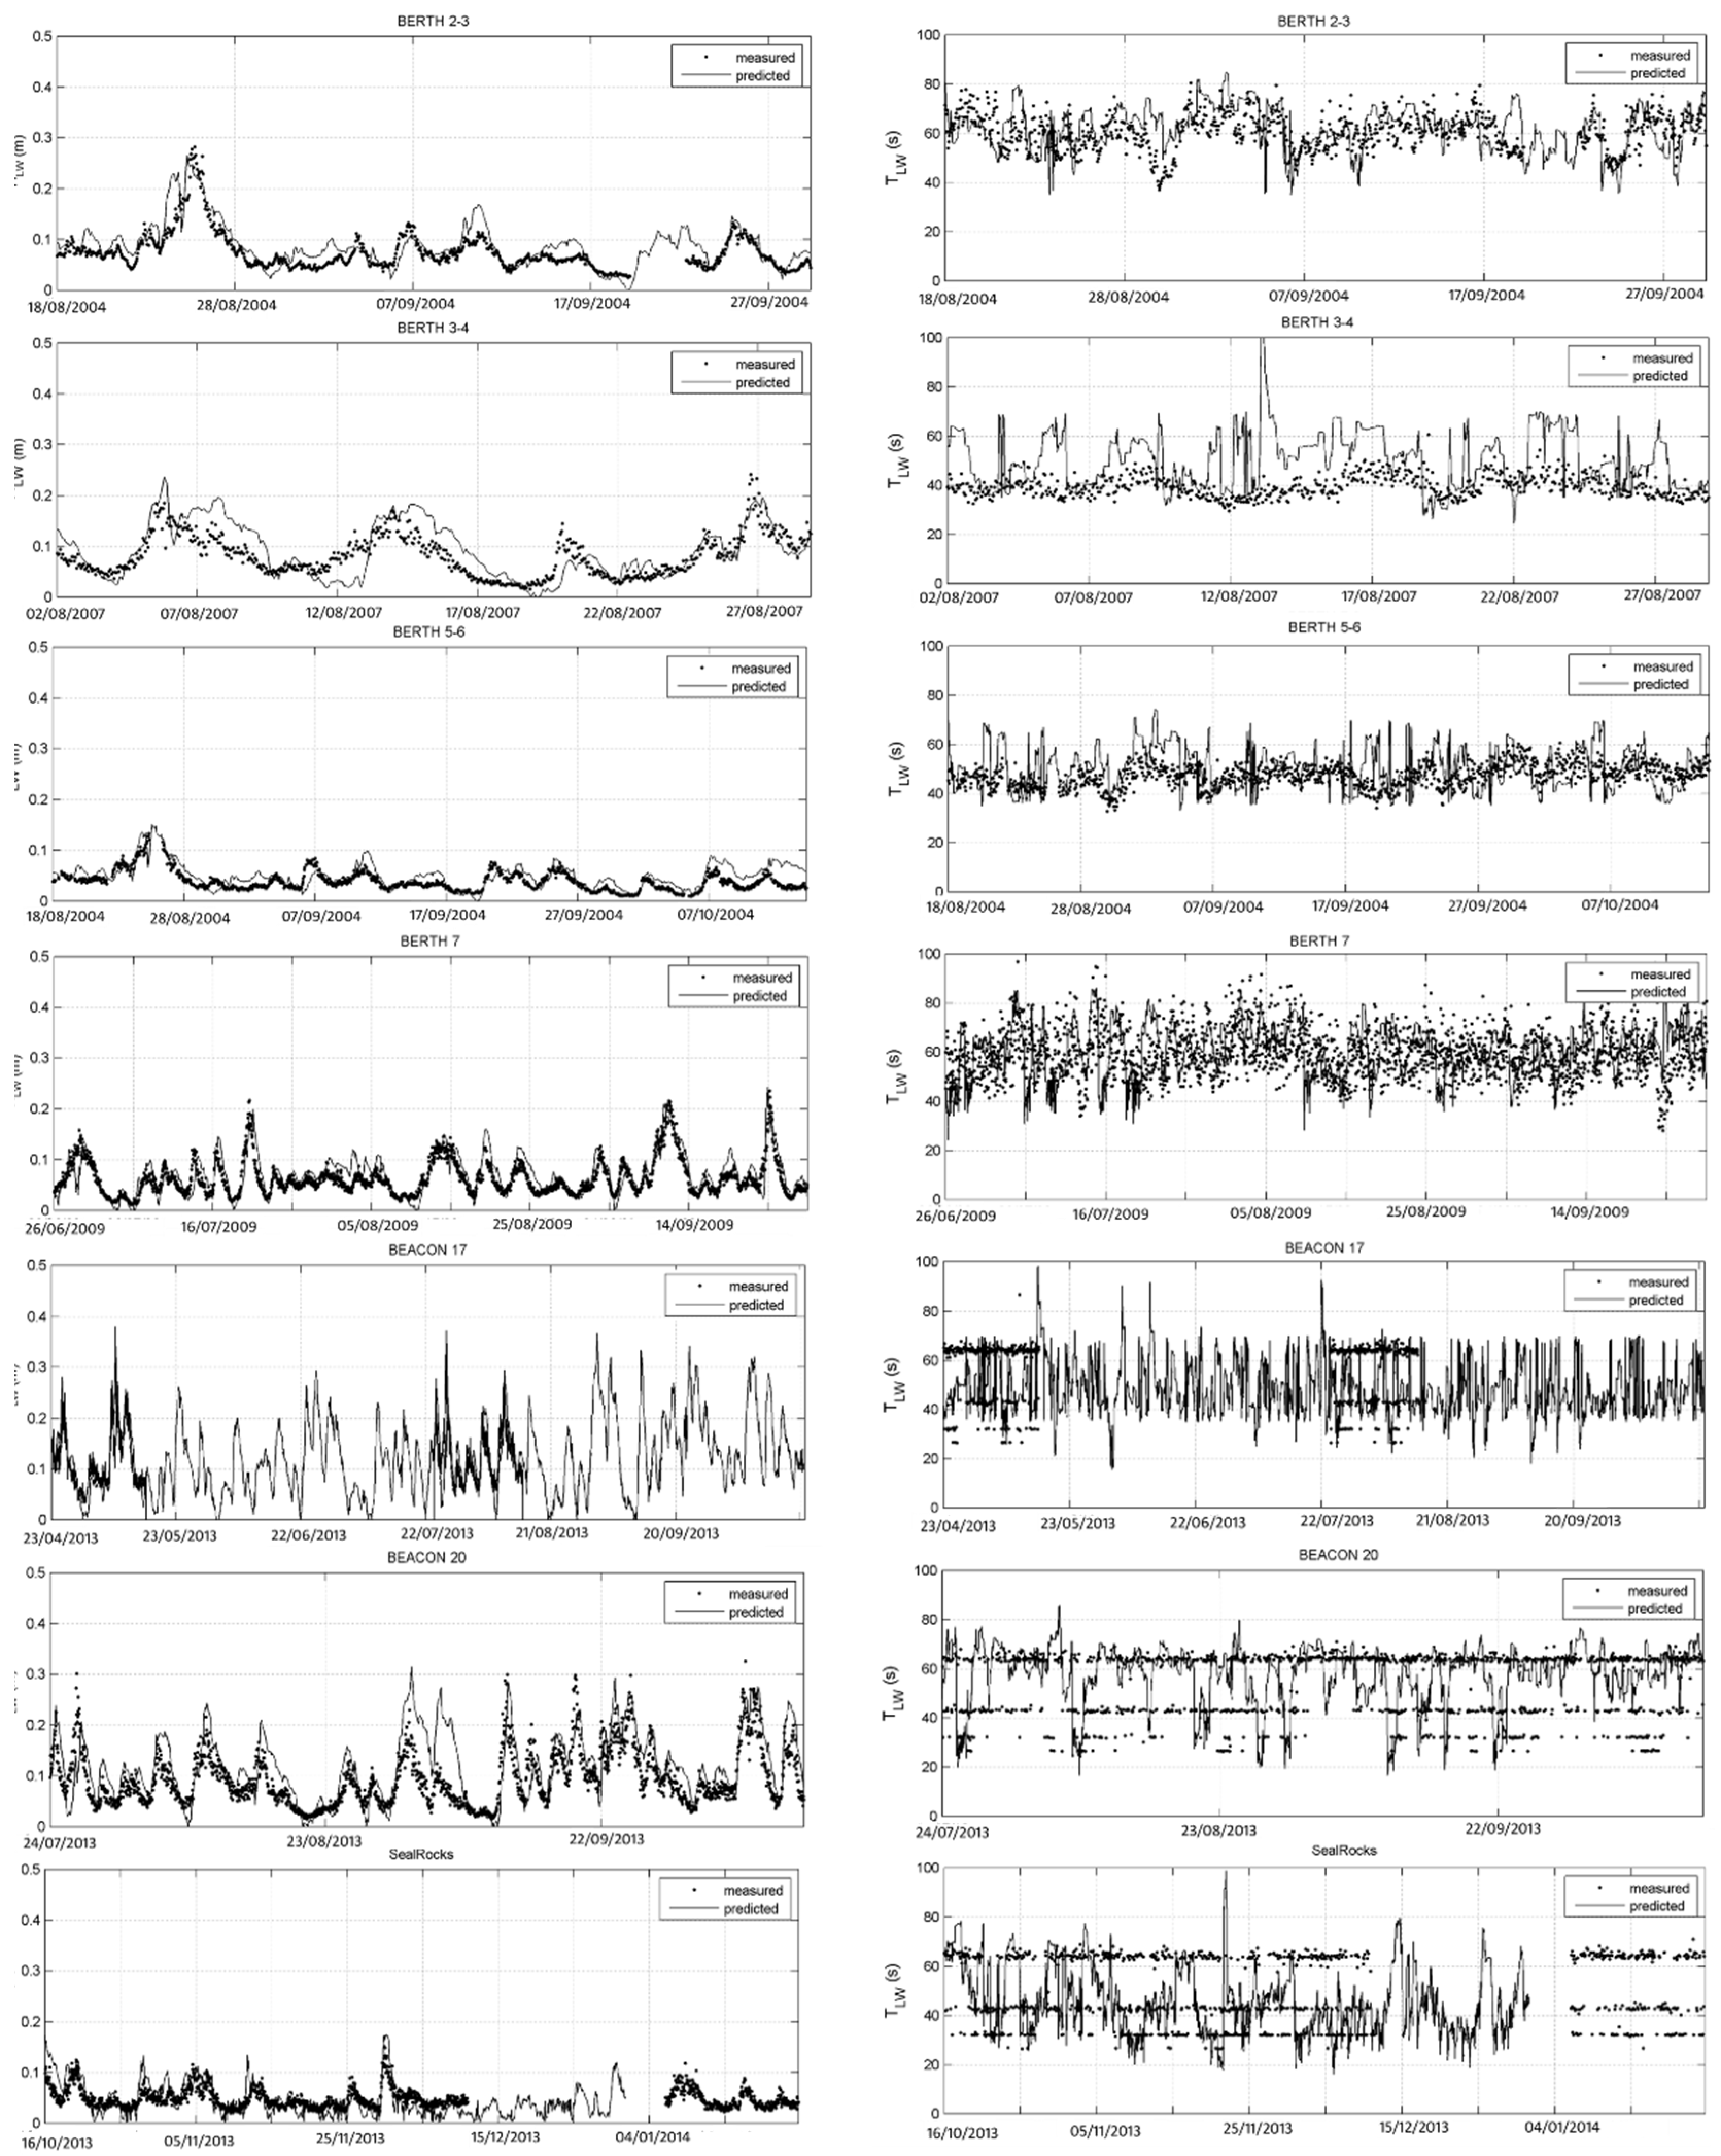
Figure 5 shows the comparison between
HLW and
TLW time series for the following locations: Berths 2 to 3, 3 to 4, 5 to 6 and 7, Beacons 17 and 20 and the Seal Rocks locations (data provided by the MWPA).
It can be seen that the long wave height HLW predictions inside the basin provide appropriate values and similar time evolution. Overall good predictions and trends can be seen, but for some locations, it seems that post-processing for TLW is different from one location to another (measured TLW data would respond to a zero crossing infragravity wave period (25 to 150 s) or to a spectral peak period of infragravity waves (25 to 150 s), according to MWPA information). It is expected that if HLW is well predicted, long wave periods within the full spectra will be realistic.
Figure 5.
Comparison of long wave time series obtained for HLW and TLW for Berths 2 to 3, 3 to 4, 5 to 6 and 7, Beacons 17 and 20 and the Seal Rocks point. Predicted (line); measured (points).
Figure 5.
Comparison of long wave time series obtained for HLW and TLW for Berths 2 to 3, 3 to 4, 5 to 6 and 7, Beacons 17 and 20 and the Seal Rocks point. Predicted (line); measured (points).
3.2. Diagnosis
Historical long wave time series (12 years) inside the port have been obtained and validated with instrumental data. With these data, it is possible to make a diagnosis of the agitation response, paying particular attention to the inoperability events (thresholds) identified by the MWPA.
This historical series, associated with long waves, allows the statistical and probabilistic analysis of long wave variables inside the harbor.
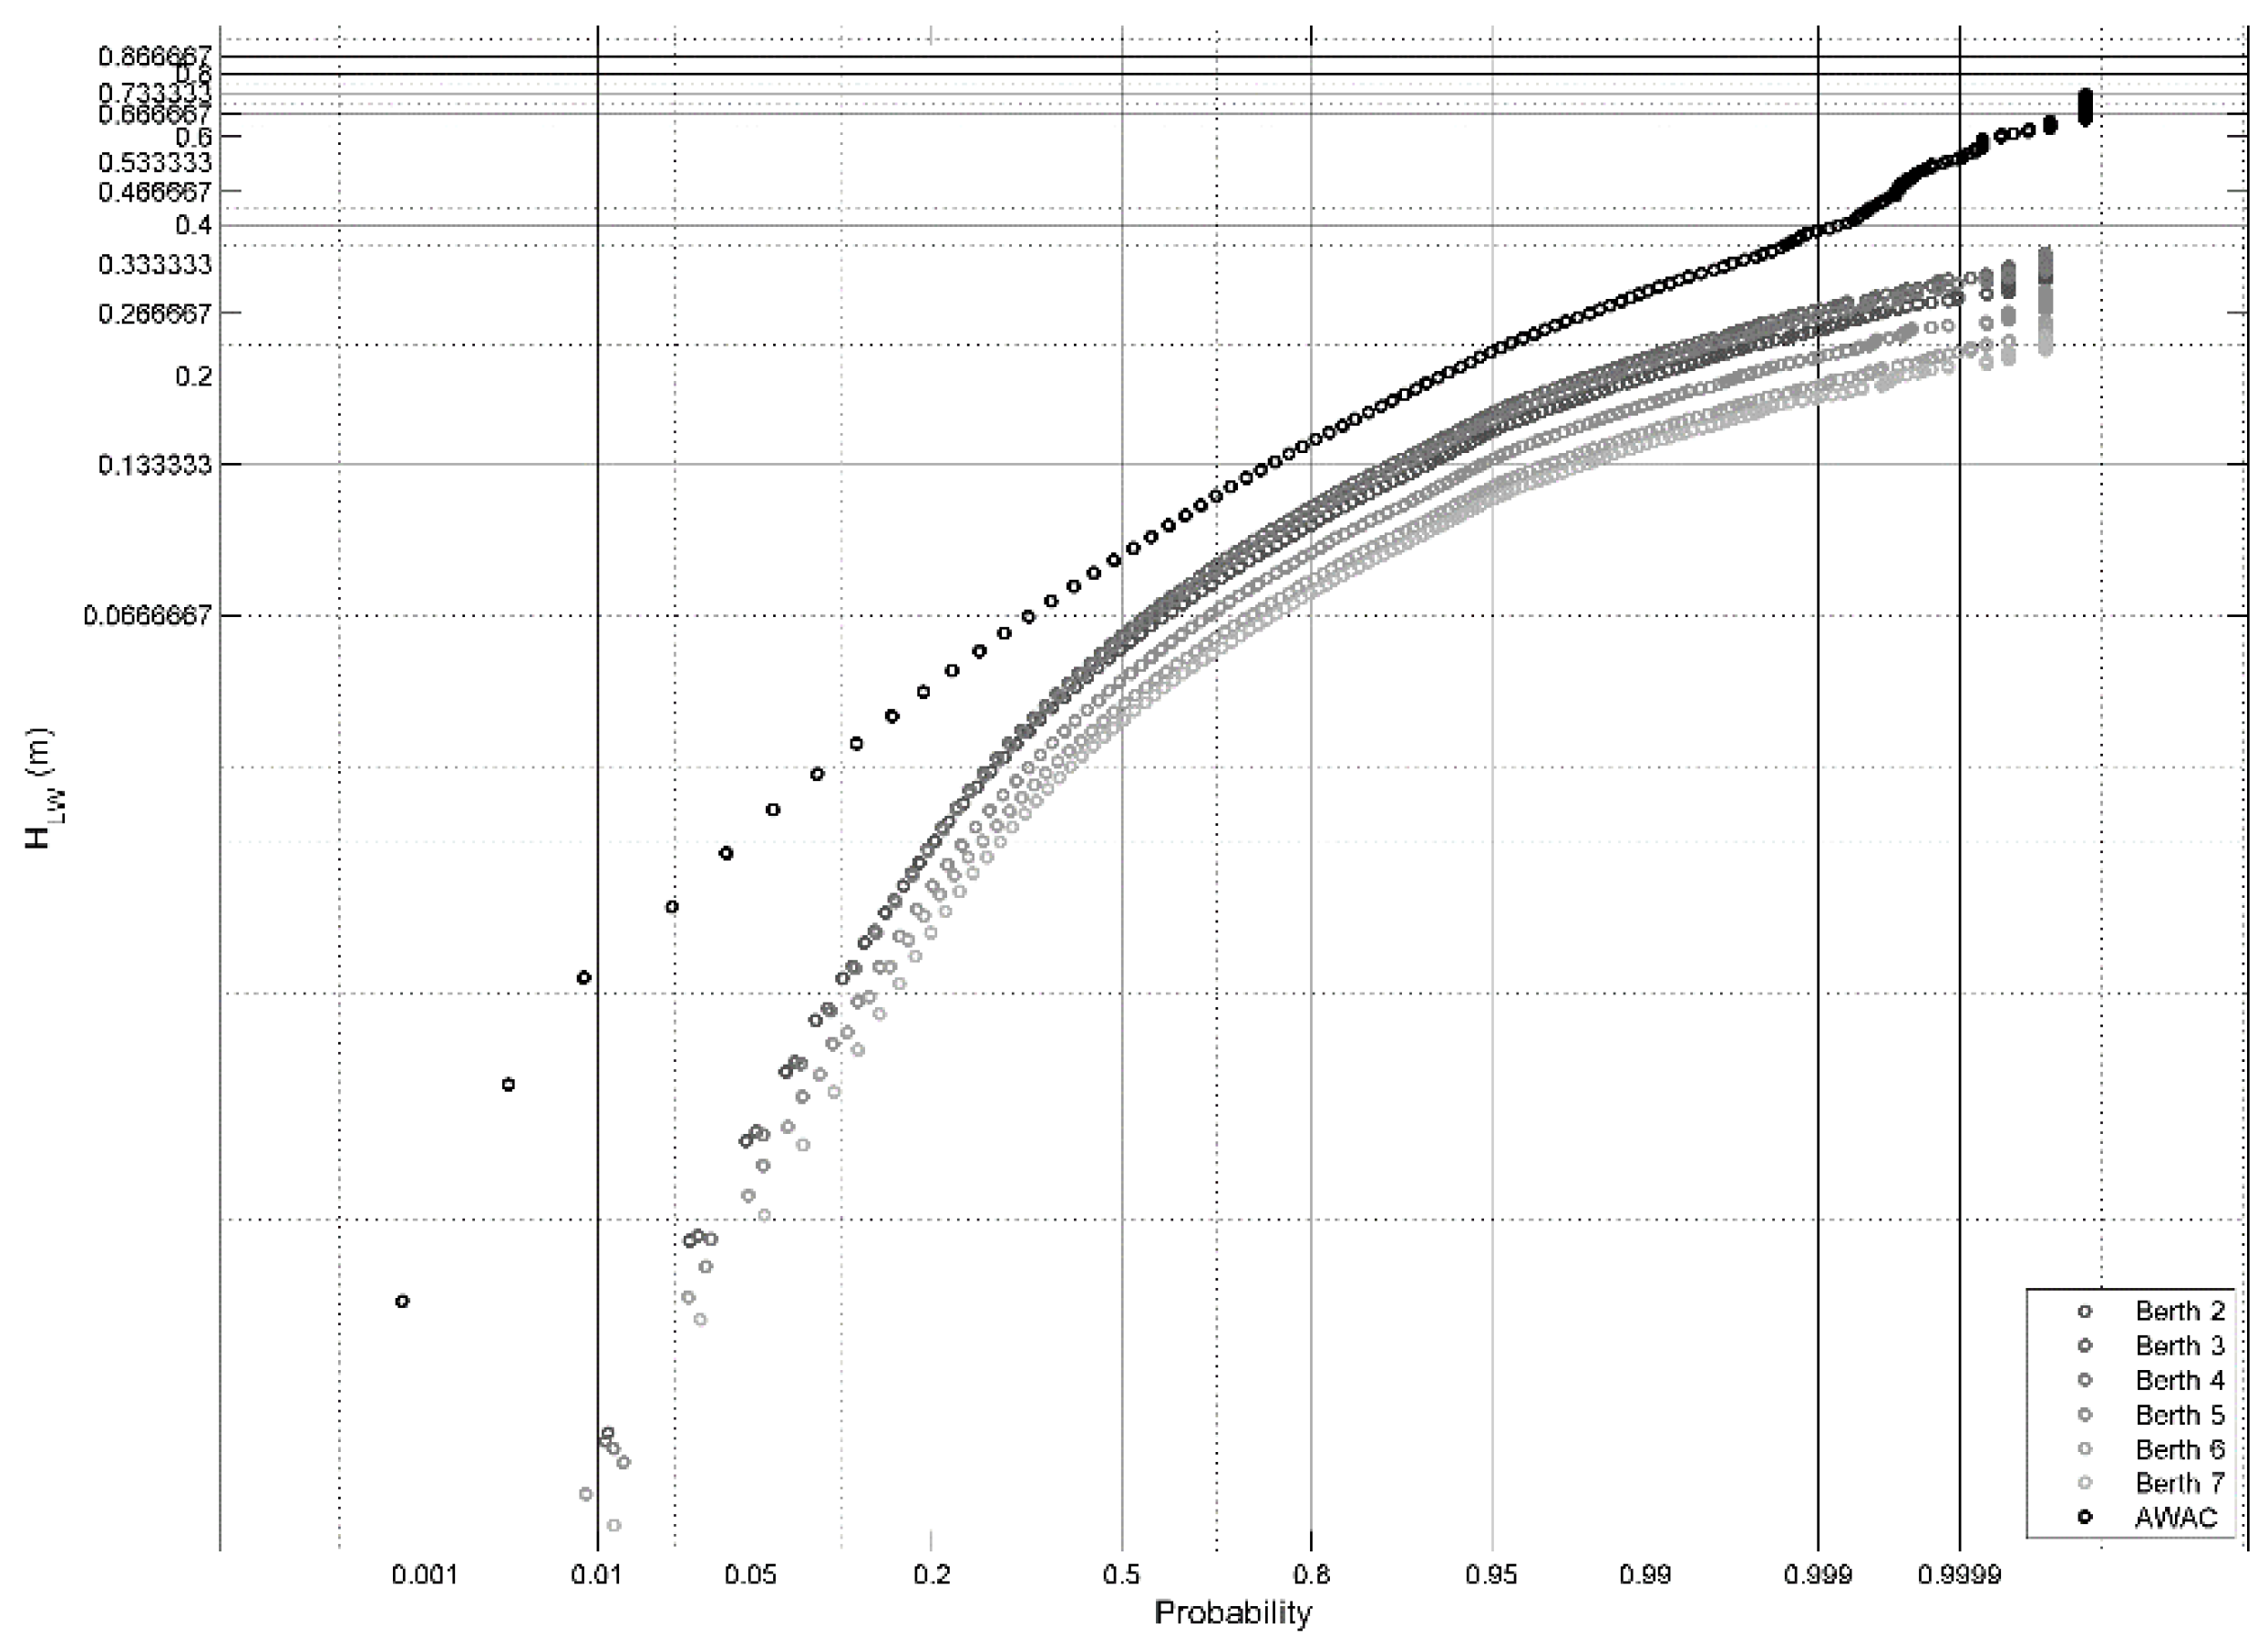
Figure 6 shows the annual mean distribution for
HLW Berth 2 to 7.
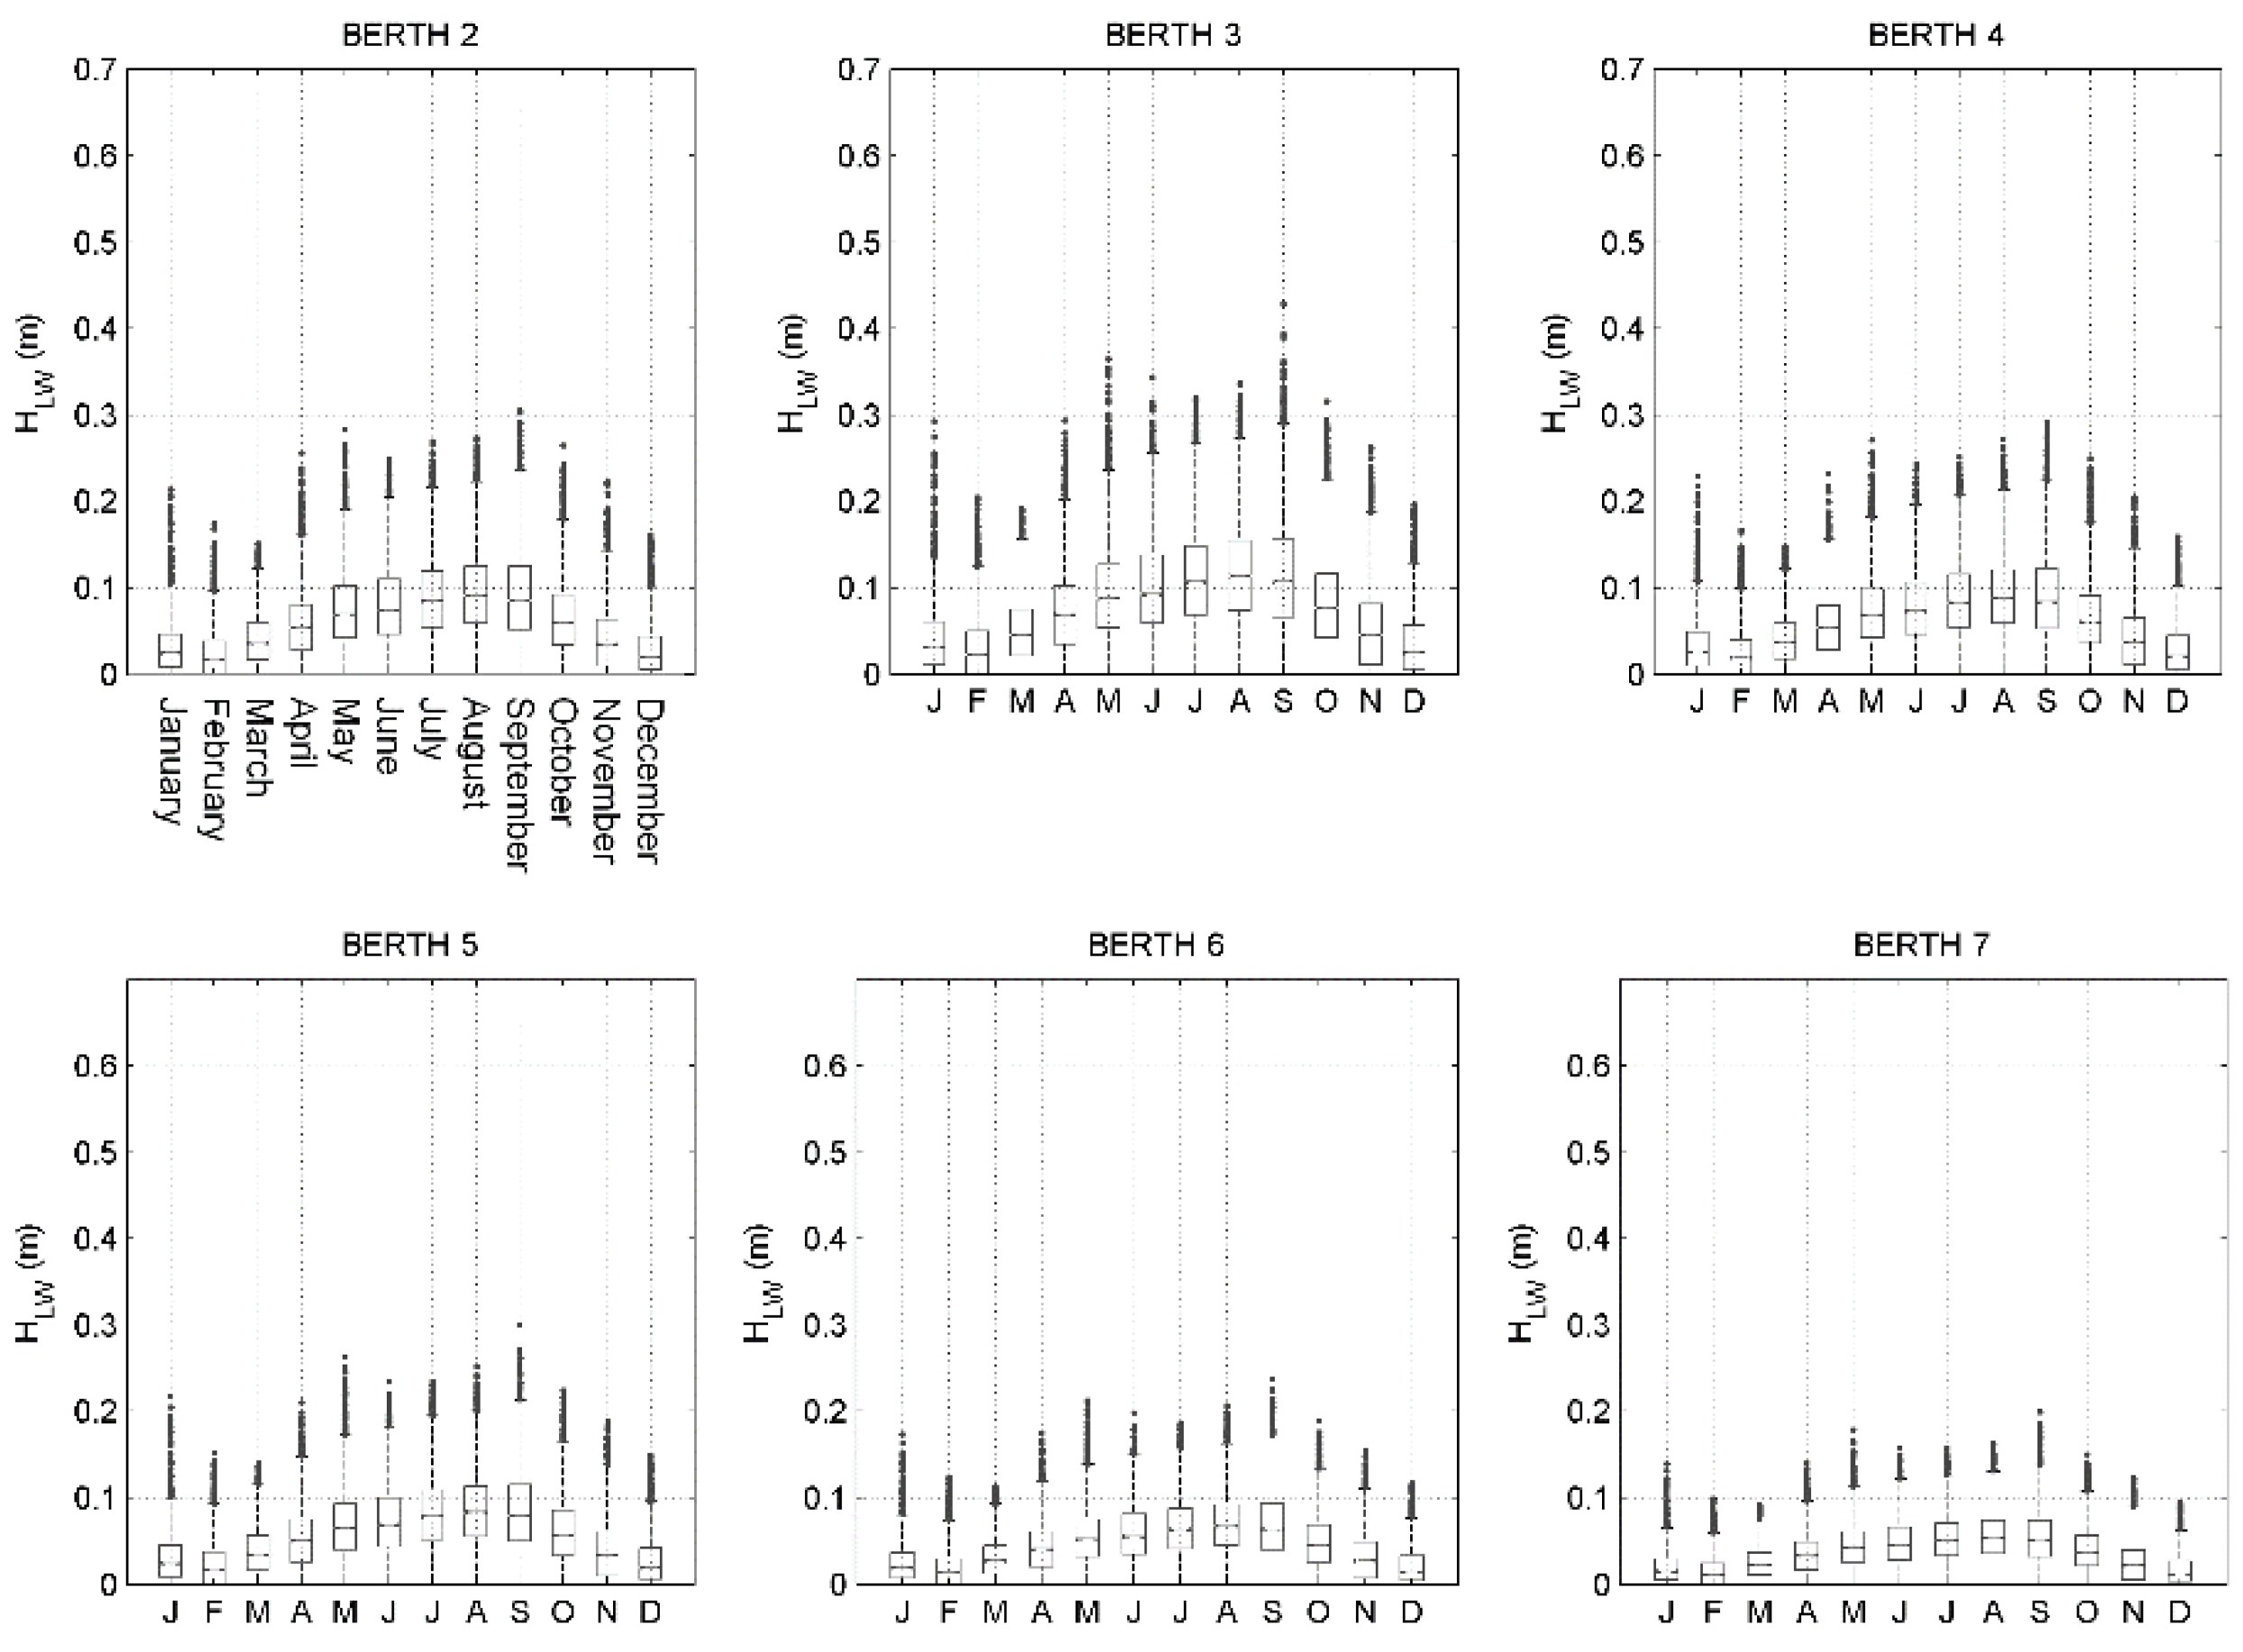
Figure 7 shows a box-plot of the monthly performance of
HLW for the 12 years evaluated at the same points.
Figure 6.
Annual mean distribution for HLW at Berths 2 to 7.
Figure 6.
Annual mean distribution for HLW at Berths 2 to 7.
Figure 7.
Monthly distributed box-plot for HLW for Berths 2 to 7.
Figure 7.
Monthly distributed box-plot for HLW for Berths 2 to 7.
On each box, the central mark is the median; the edges of the box are the 25th and 75th percentiles; the whiskers extend to approximately +/− 2.7σ and 99.3 coverage, to the most extreme data points not considered outliers; and outliers are plotted individually.
After analyzing
Figure 6 and
Figure 7, the following points regarding the diagnosis of the resonant situation in the Geraldton port are presented:
HLW within the port (Berths 2 to 7) is always lower than the external forcing at the AWAC location.
Berths 2 to 7 show a similar agitation response.
Mean values of HLW, from 0.02 m for the months of January to April and November to December, and of 0.05 m for the rest of the year.
Each month, the 12-year analyzed HLW shows values of 0.1 and 0.2 m (75% percentile of between), depending on the season.
Berth 4 is the most vulnerable zone to long wave oscillations, as higher HLW values were presented by the numerical records.
Exceedances at Berth 4 can reach maximum values around 0.4 m.
Approximately 30% of the year (2600 h per year), HLW values are exceeded over 0.1 m (as an average value at all of the berthing locations).
Between 5% and 1% of the year (between 440 and 90 h per year), the threshold exceed 0.2 m (depending on the port area).
Given that the harbor thresholds (MWPA, personal communication) are between 0.07 and 0.1 m to limit the berthing, it can be concluded that the current port configuration for Geraldton has a problem of inoperability of about 3000 h a year (rough estimation).
It is interesting to note that, according to the data obtained, the port response does not seem to be related to a (classical) resonant amplification of long waves. Values of HLW inside the basin never exceed the AWAC records (if this location is considered as the outer boundary forcing). However, a detailed analysis using isolated frequency bands within the spectrum does suggest a modest degree of frequency-specific amplification (not necessarily shown by the total HLW values).
The harbor receives external free long waves incoming from the reef zone that penetrate into the basin and get trapped without being able to dissipate the energy. Only some (few) of the incoming energy of the long waves is deflected or blocked due port structures.
Therefore, for an appropriate solution proposal, the strategy should focus on blocking the long wave trains of the incoming waves, which propagate towards the basin. The construction of barriers to give shelter to the entrance to the port of entry and/or the establishment of outer reflective walls should minimize the problem. As resonance amplification is not the main issue; any change in the internal geometry of the port, by partitioning or breakthrough of port berths, will not be an improvement for the current situation. The next section addresses these ideas.
4. Potential Solutions
Following the diagnosis made in
Section 3, this section presents a proposal of pre-configurations through different geometries as a pre-design guide for the future final solution analysis.
This section is only intended to exemplify the potential of the methodology and to visualize some geometric guidelines for future work for the analysis of potential solutions. The geometries presented here are not conditioned to any construction/economic/operation recommendation.
The aim of this proposal of possible solutions is to confirm the main hypothesis of the study: free long waves are travelling from the beginning of the reef towards the harbor. Free long wave height HLW acts as a forcing of the system, independently of the short wave propagation interaction after the reef.
Figure 8 shows the seven geometric ideas proposed for pre-analysis in this study, based on the actual geometry (A0), described below.
A1, construction of a new oblique breakwater of 400 m connected to the eastern breakwater.
A2, construction of a new oblique, exterior and detached breakwater of 780 m, located 600 m from Geraldton Harbor.
A3, construction of an extension of 1000 m of the eastern breakwater.
A4, construction of a new oblique breakwater of 300 m perpendicular to the mouth of the harbor.
A5, 250 m breakthrough of the eastern breakwater towards the beach.
A6, 150 m breakthrough of Berth Zone 6 towards the fishing boat harbor.
A7, extension of 300 m for the western breakwater.
Figure 8.
Pre-design geometries proposed as the first analysis of possible solutions.
Figure 8.
Pre-design geometries proposed as the first analysis of possible solutions.
Alternatives A1 and A3 are designed to separate the harbor area and the beach zone; it is expected that A1 will not present any change in the long wave agitation inside the basin. Alternative A3 is designed as a trapping element for the incoming free long wave and to propagate it into the basin, so it is expected that this alternative will present the maximum oscillations.
On the other hand, Alternatives A5 and A6 are designed to prove that the long wave agitation issue is not related to any resonant-coupling-amplification phenomena. It is expected that any breakthrough at the basin contour will not affect the actual long wave agitation values. In fact, it is expected that A5 will present an increase in long wave agitation due to the new open entrance of the reflected long wave from the beach towards the harbor (a wider harbor mouth effect).
Finally, Alternatives A2, A4 and, especially, A7 will achieve a better minimization effect for the long wave height inside the basin. It is expected that these alternatives should work as a reflective screen interposing the incoming long wave trains. Alternative A7 is quite similar (50 m less of an extension to the existing breakwater) to the best option to reduce swell and long wave penetration [
9].
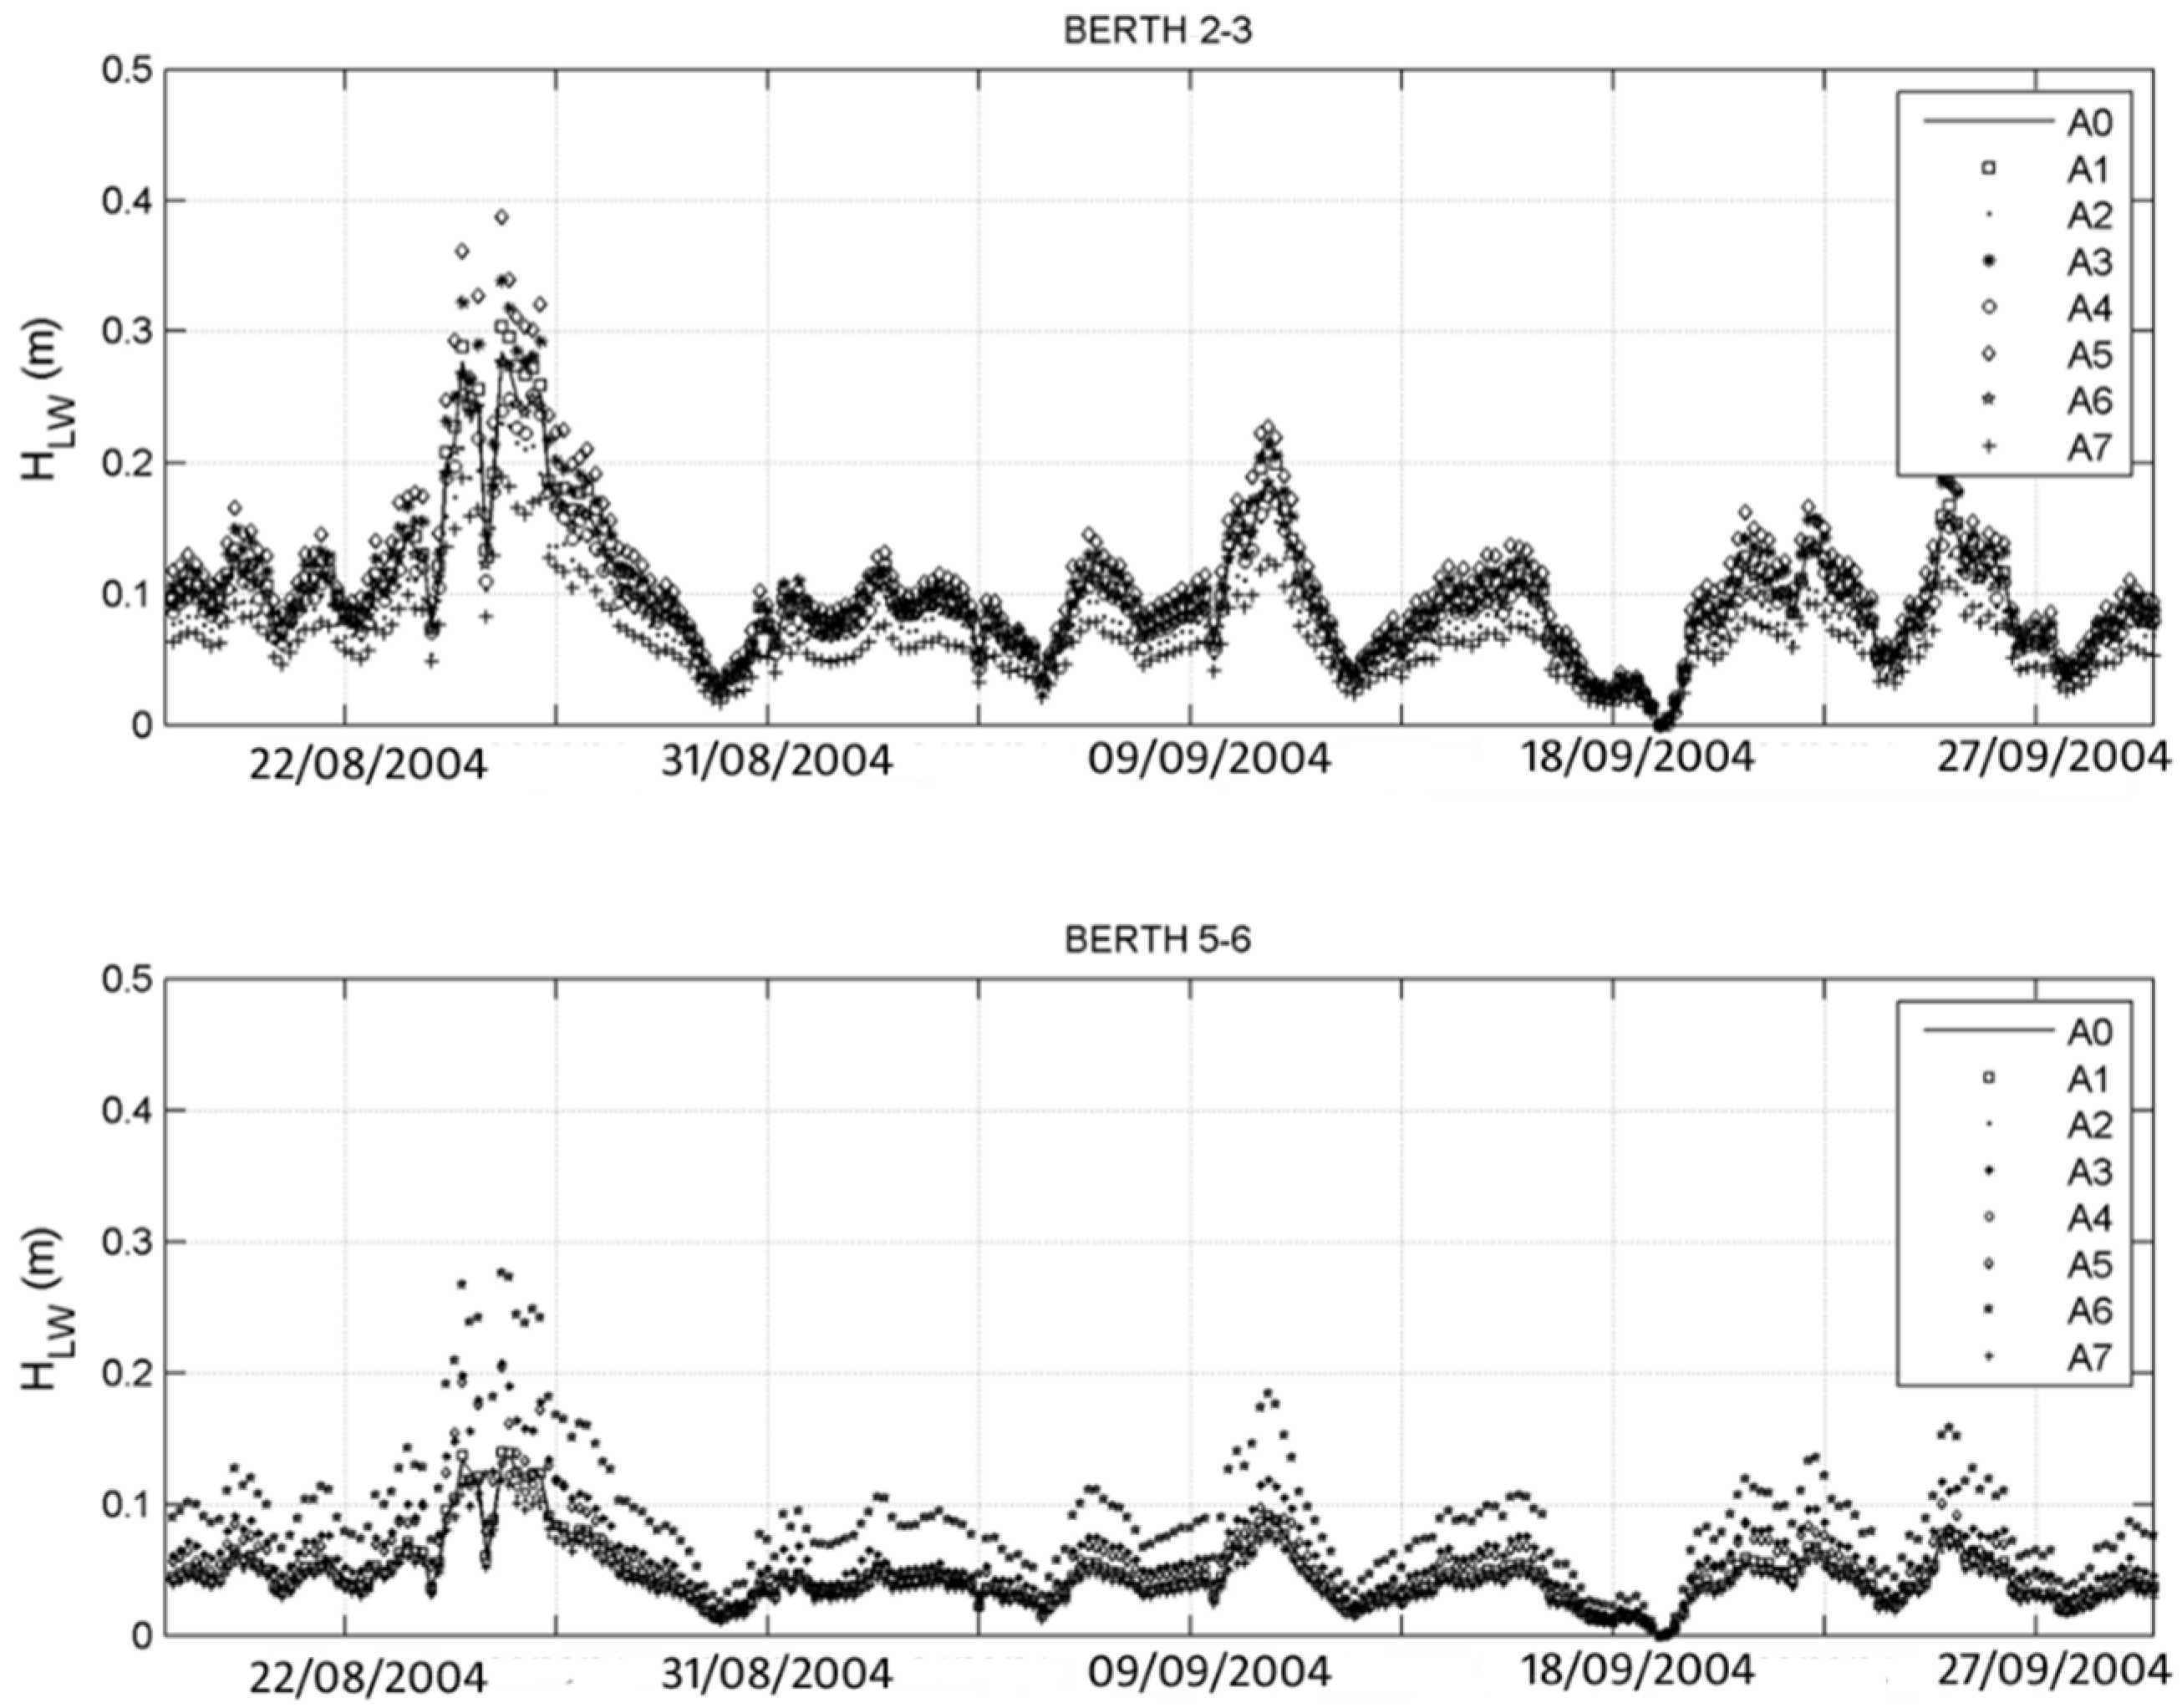
An example of the results obtained with the proposed methodology applied for each geometry is presented.
Figure 9 present the
HLW time series for August to September 2004 for Berths 2 to 3 and Berths 5 to 6 (an inoperability event did occur around 25 August 2004), showing the response of the harbor under each of the alternatives proposed.
Figure 9.
Comparison of HLW for the different harbor layouts proposed for year 2004 at Berths 2 to 3 and 5 to 6. A1, Alternative 1.
Figure 9.
Comparison of HLW for the different harbor layouts proposed for year 2004 at Berths 2 to 3 and 5 to 6. A1, Alternative 1.
Table 1 shows the overall mean percentage reduction of the agitation for each pre-solution proposed, based on the present values of
HLW (for A0).
Table 1.
Overall mean percentage reduction of the agitation for each pre-solution proposed.
Table 1.
Overall mean percentage reduction of the agitation for each pre-solution proposed.
| A1 | A2 | A3 | A4 | A5 | A6 | A7 |
|---|
| 3.8 | −19.2 | 19.1 | −4.1 | 26.7 | 0.7 | −31.2 |
Results for
HLW presented in
Figure 8 show, as expected, that each of the proposed geometries yields a different harbor response, sometimes bigger (A1, A3, A5 and A6) and other times lower (A2, A4 and A7).
Layouts A2 and A7 show the better behavior and an overall mean reduction of the agitation of around 20% to 30% (for the 12 years).
As was expected, those alternatives (A2, A4 and A7) that partially block the incident long waves seem to suggest the best way to solve the problem. However, the final proposal should consider the influence of the new structures in the wave propagation (short wave agitation), morphodynamic changes of the beach, etc.
5. Evaluation of Long Wave-Induced Currents
As a final part of the methodology, an example of the numerical study of current events related to the inoperability of the port is presented.
Currents related to long waves inside harbors are usually related to episodes of inoperability, mainly due to the extraordinary ship movement (moored ships) and to the enhancement of the mooring lines stress. Geraldton Port usually suffers this type of event, related to translational motions of the ships during energetic long wave episodes.
Long waves induce long currents directly proportional to the height of the forcing. An increase is expected in the currents for higher long wave events. These currents present complex movement patterns within ports, with non-stationary and non-linear behavior.
For these reasons, it is necessary to evaluate these currents with a transient and nonlinear model, forced with the full spectral data and realistic geometric conditions.
The numerical Boussinesq-type for Advanced Model NO Linear Waves (MANOLO) is an Enviromental Hydraulics Institute (IHCantabria) model developed under the inner agreement of the: “Development of a model of wave propagation and port agitation whose exploitation rights are under Spanish control”. This model was originally based on modified weakly-nonlinear and weakly-dispersive Boussinesq equations [
15,
16,
17,
18].
They solve the temporal patterns of wave propagation, processing and agitation within numerical domains of complex contours on real bathymetries, using adaptive finite element meshes in resolving two-dimensional patterns (2DH) of speeds, pressures and free surface, considering the processes of shoaling, refraction, diffraction, reflection and radiation from structures.
In addition, the numerical model includes in its formulation processes of energy dissipation by partial or total absorption contours, processes associated with wave breaking, bottom friction and turbulent effects.
In this study, the MANOLO model is used to evaluate the long wave-related currents for an N number of selected cases, related to higher HLW events inside the harbor; 1-hour long sea state.
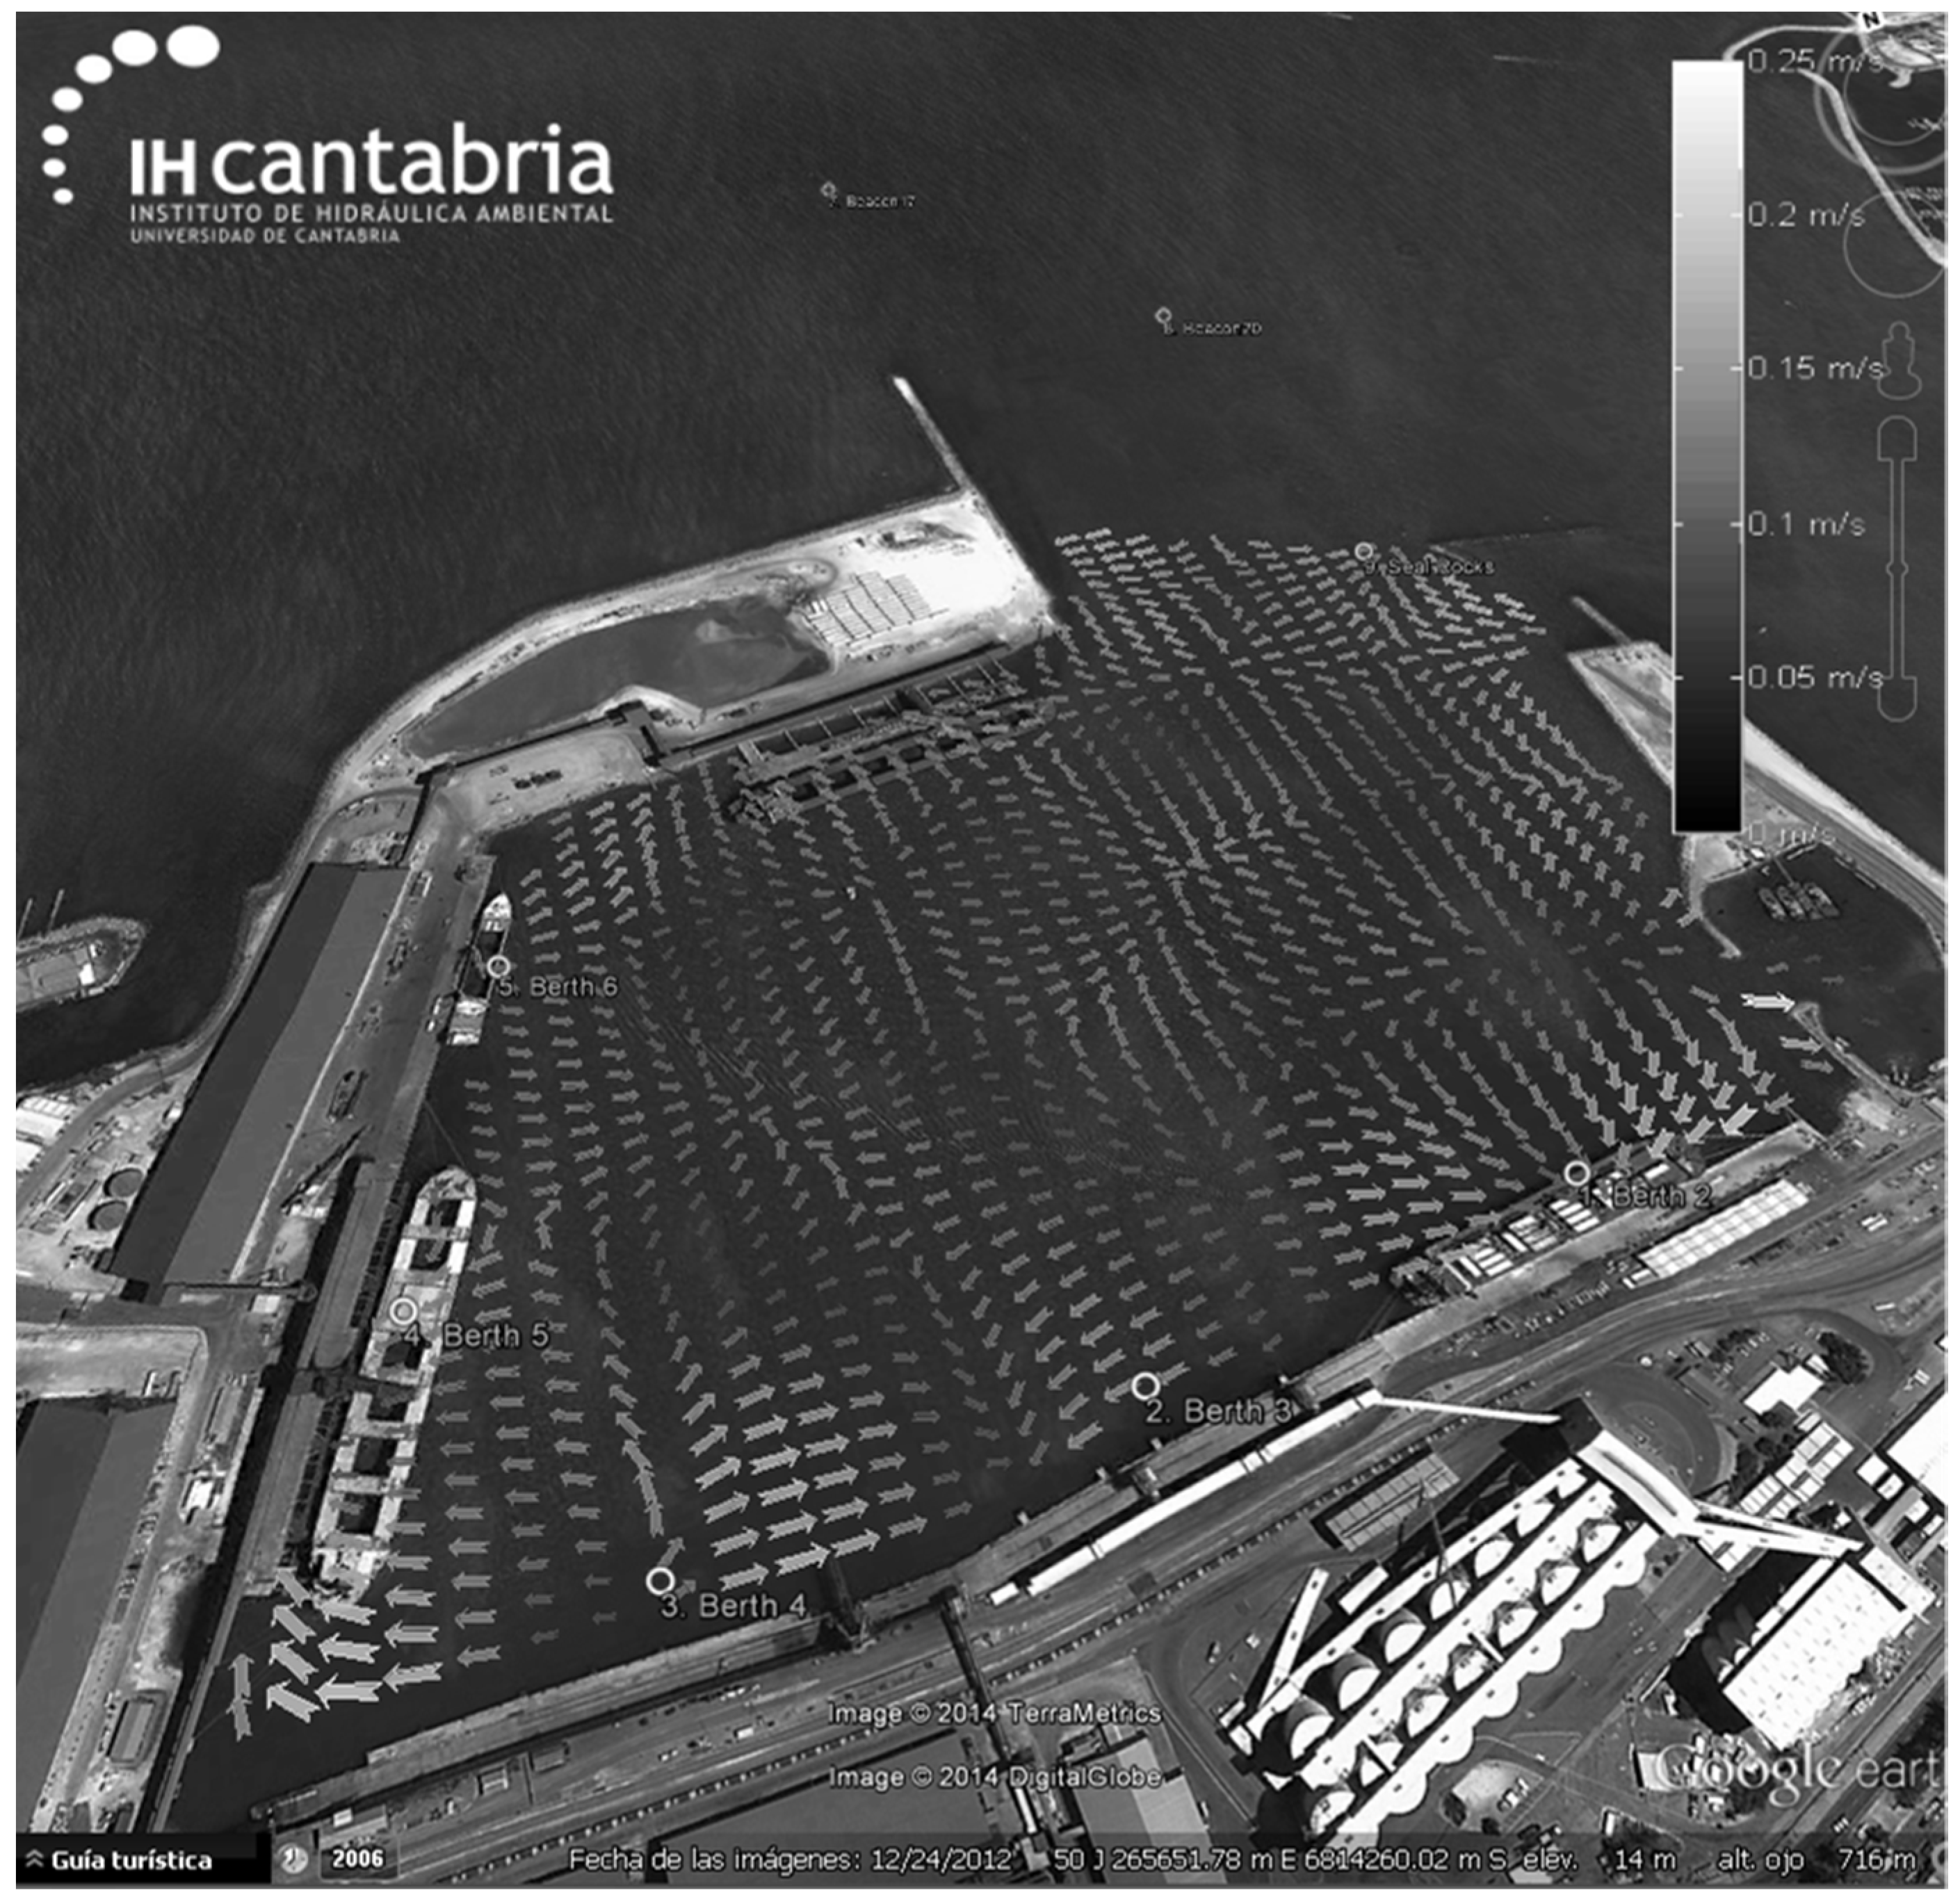
As an example,
Figure 10 shows the snapshot for the maximum current map (within a 1-h run), for the 27 August 2007 inoperability event. This figure shows the flow patterns related to the mentioned event, yielding maximum currents between 0.2 and 0.3 m/s near Berths 4 and 5 and Berth 2 for this specific time step. These currents have values above (>0.1 m/s) the vessel limit operating conditions at quays and jetties for vessel berthing (related to transversal forces, taken from the Recommendations for the Design of Maritime Configurations of Ports of Spain, Approach Channels and Harbor Basins, Recommendation For Maritime Woks ROM 3.1–99).
The election of a small number (
N) of representative sea states, through the application of a maximum dissimilarity algorithm (MDA) is proposed [
19,
20,
21]. Once the
N clusters (sea states) are propagated to the shore, the radial basis functions (RBF) interpolation technique allows the reconstruction of the time series of long waves, with a reduction of the total CPU simulations (1000×) [
22].
This hybrid downscaling methodology allows using a CPU-demanding model, such as a Boussinesq model, to evaluate the hindcast (12 years) for the currents inside the harbor.
Once the complete current statistic is reconstructed at any location inside the harbor, the annual mean distribution can be obtained, and thus, the operability analysis could be completed, as well as an adequate potential solution proposal.
Figure 10.
Snapshot for the maximum long wave-induced current of the 27 August 2007 inoperability event at Geraldton Harbor, obtained with the MANOLO model.
Figure 10.
Snapshot for the maximum long wave-induced current of the 27 August 2007 inoperability event at Geraldton Harbor, obtained with the MANOLO model.
Further work will require a deeper analysis of:
60-year hindcast analysis.
Calibration of the short wave hindcast in the AWAC location.
Simultaneous short + long wave propagation and analysis of alternatives.
Evaluation of the effects of each alternative at the beach and in the near harbors.
Evaluation of the non-linear effects of the energy transfer mechanism from high to low frequencies due to the reef.
Reconstruction of the whole statistics of flow currents using the Boussinesq tool, for the present geometry and for each possible solution proposed.
Evaluation of the statistics, occurrence probability and operability for short and long waves for each of the final solutions evaluated.


