1. Introduction
Ports exposed to high energy long wave conditions can experience significantly reduced berth availability and, consequently, reduced port operability and throughput. The Port of Geraldton is perhaps one of the best known case study sites where the frequent large long wave conditions significantly reduce the economic potential of the port.
At this site, various wave measurement campaigns have shown that the long waves are generated as swell wave groups propagate across a wide, shallow reef area to the north of the port [
1,
2,
3]. The long waves refract on the reef and the side slopes of a dredged port entrance channel, then diffract around an existing breakwater into the port basin. The long waves can induce natural resonance of the basin, resulting in excessive movement of the moored ships and potential for mooring line breakage.
Efforts to mitigate the long wave problem to date have focused on reducing the amplitude of the long waves entering the port by means of various structural solutions. For example, McComb
et al. [
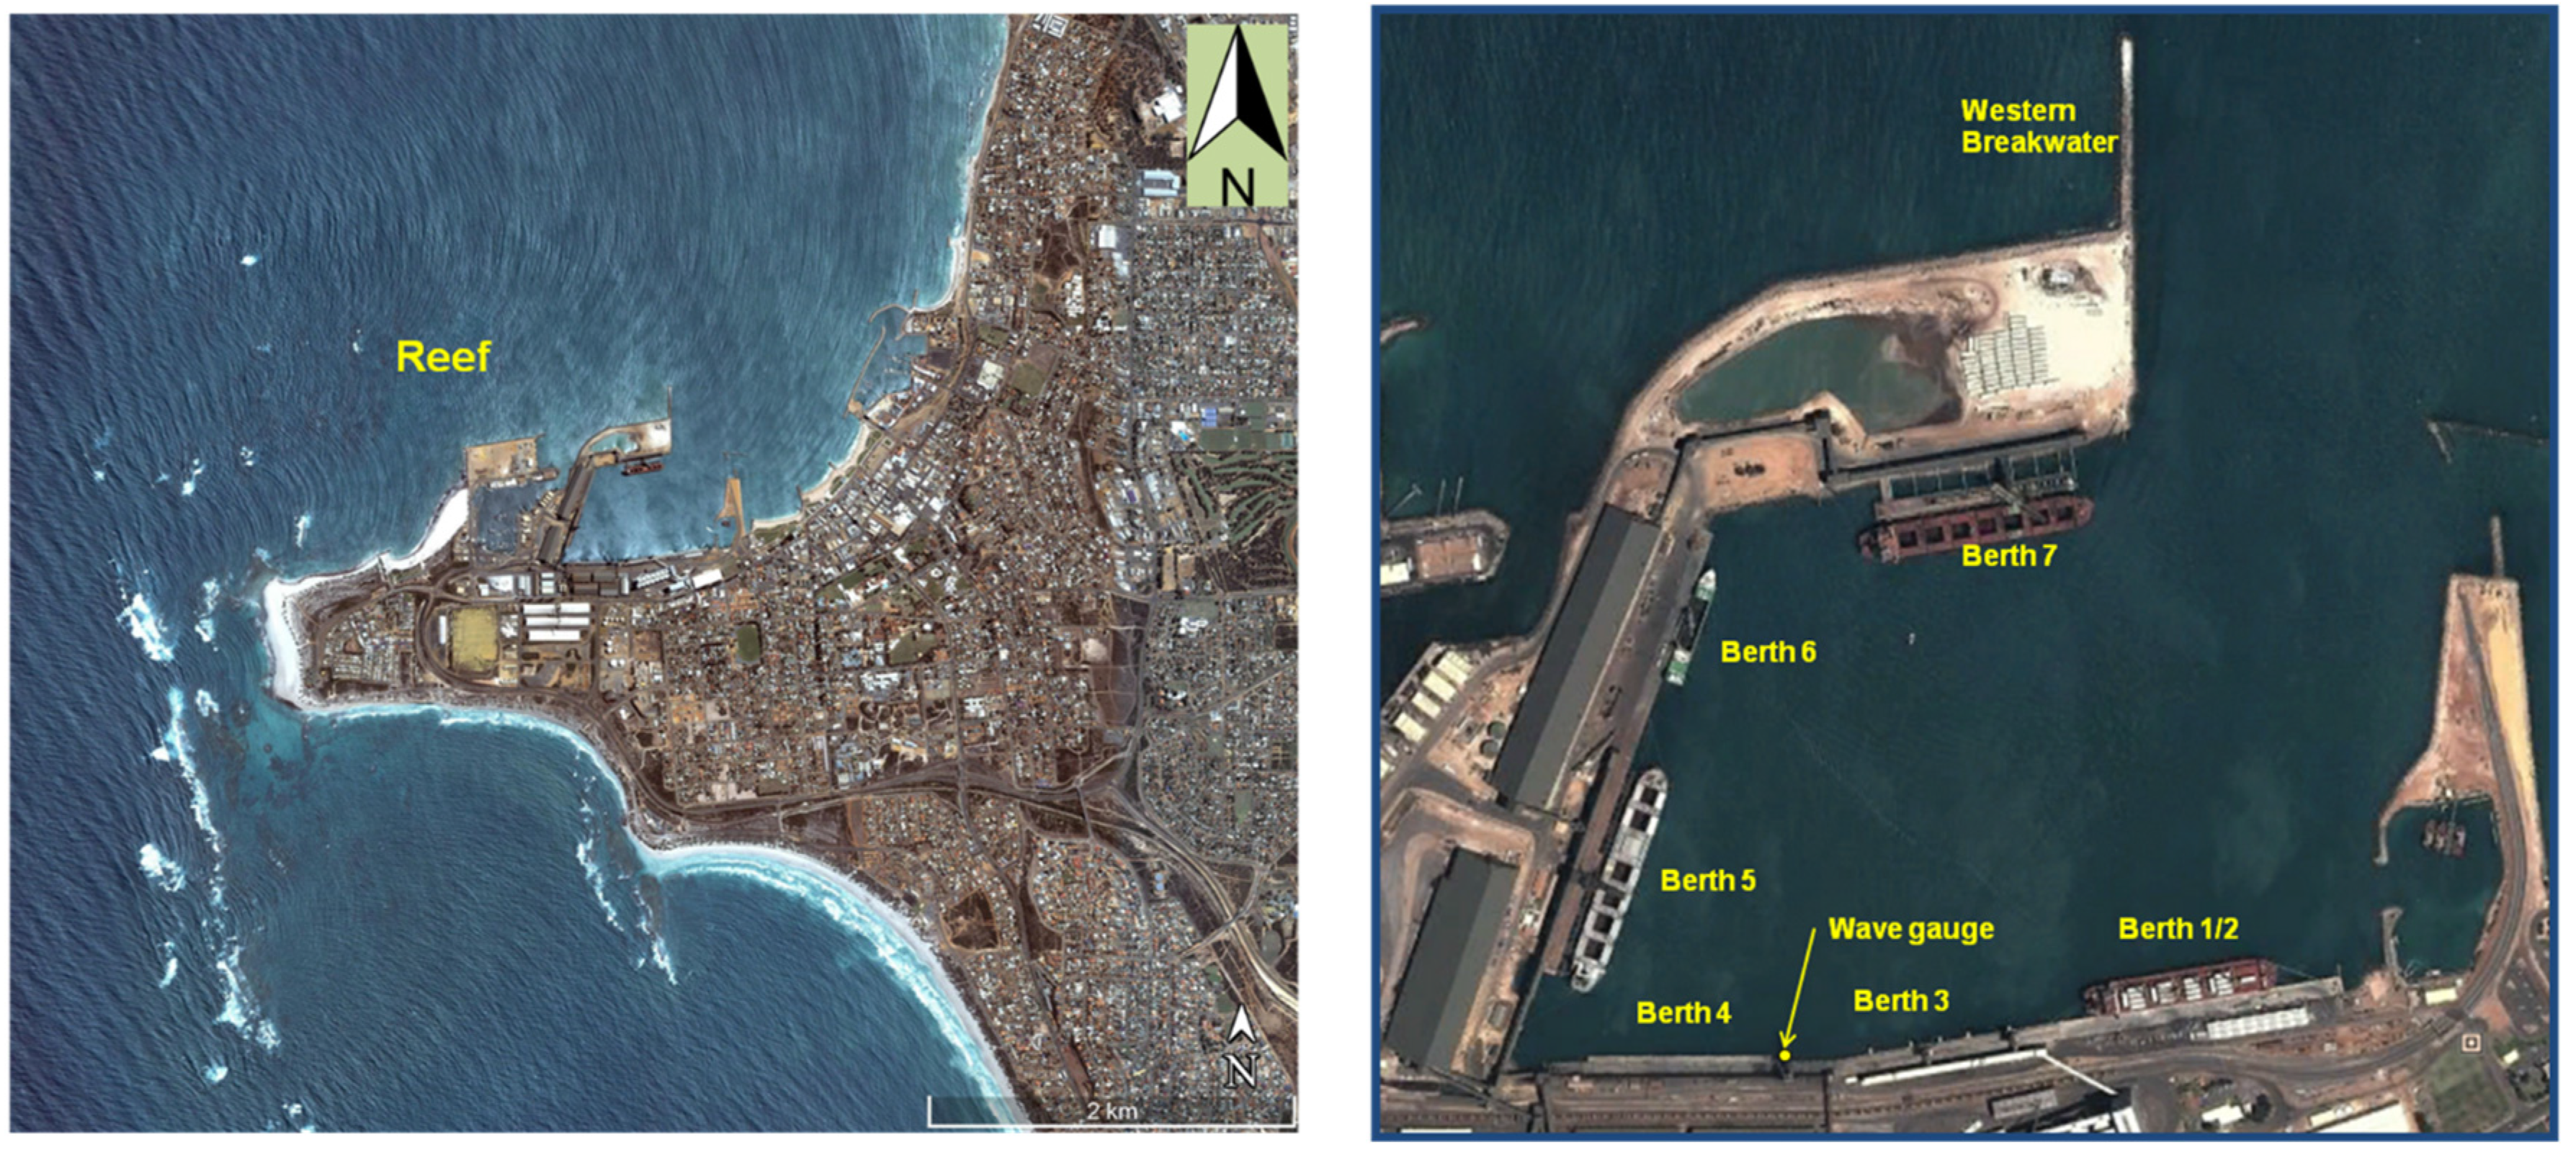
4] identified that a 350 m northward of the existing Western Breakwater, as shown in
Figure 1, can result in a 35% reduction in the long wave heights within the port. The breakwater extension does represent a significant financial investment, and the overall benefit to the port could not be readily quantified.
Long wave problems can also be mitigated through improvement of the vessel mooring configuration. Examples of mooring system modifications applied at other ports include use of soft pneumatic fenders instead of the typical buckling fenders [
5]; the installation of alternative mooring systems such as the MoorMaster
® vacuum mooring system [
6,
7] as manufactured by Cavotec of Christchurch, New Zealand; and the implementation of wharf-based winch systems [
8,
9].
The various mitigation options can vary significantly in terms of capital cost and effectiveness in reducing long wave induced ship motions. It is important to link the financial costs of a technical solution with the economic benefits to the port in terms of increased throughput and reduced shipping costs. Particularly in small regional ports, the technically most effective mitigation option may not provide the optimal or even a favourable economic outcome in comparison to other options which may not be as effective, but which have far better economic metrics.
In a companion paper [
10], various solutions to mitigate the long wave problem were explored, involving potential improvements to the mooring configuration. The various configurations were evaluated using a numerical model of moored ship response. Maximum vessel motions and mooring system loads were estimated for a range of long wave conditions, and compared to pre-defined criteria, such as those published by PIANC [
11]. The numerical modeling showed that a combination of stronger and softer shore-based mooring lines in combination with softer fenders can lead to reduced vessel motions and mooring line loads.
In this paper, the impact of these mooring alternatives on port throughput and economics is examined. As a starting point in the analyses, a detailed assessment of the frequency of occurrence of existing downtime was carried out. Next, a discrete event simulation model of port operations was developed, which reproduced the movement of vessels and loading operations within the port, including the evacuation of ships in advance of long wave events. Such models are increasingly used to understand the operational dynamics of complex ports [
12,
13] and to support economic decision-making [
14].
Following completion of the simulation modeling, the estimated capital cost of the various mooring improvements was estimated and an incremental net present value determined based on the resulting changes in port throughput and delays.
The primary focus of the investigation was on those berths that represent the highest value export products for the port. The model simulations were conducted over a representative one-year period from December 2012 to November 2013, a period in which significant long wave downtime was experienced [
4].
2. Overview of the Port
The Port of Geraldton is located in Western Australia, approximately 375 km north of the city of Perth. The port consists presently of six active berths, as shown in
Figure 1. Berths 1 and 2, which are generally operated as a single berth, are the most wave exposed of the berths and only rarely occupied. Berth 3 is used primarily for grain loading; Berth 4, for bulk mineral sands and concentrates; and Berth 6, for a range of cargo types. Berths 5 and 7 are employed exclusively for iron ore, and are, along with Berths 3 and 6, a primary focus of this study. All of the berths experience downtime due to excessive ship movements and mooring line breakage.
A natural headland and rubblemound breakwater on a north-south alignment protect the port berths from the prevailing southwesterly wave conditions. Ships enter and exit the port via a channel dredged through a shallow reef area to the north of the port. Vessel departures are tidally assisted. That is, laden vessels are required to depart on or near high tide. The departure timing and draft allowance is determined by means of an underkeel clearance management system. Tidal conditions at Geraldton are mixed, mainly-diurnal (one tide per day).
The maximum size of vessel is limited by dredged depths and berth length. Presently the maximum size vessels at the Port are Panamax class, with a 225 m length, a 32.5 m beam and a 12.4 m draft.
The constraining depths for the port and channel vary depending on the offshore swell wave conditions. Typically vessel departure drafts are determined by the dredged depth within the port area (−12.4 m CD). However, when larger swell wave conditions are present offshore, this depth constraint moves to a location in the dredged channel just north of the breakwater where there is a step change in channel depth. This constraint arises as the swells induce greater vessel vertical motion through vessel roll.
The dredged depth constraints are of relevance to the long wave issue at the port as both are impacted by the offshore swells. As will be discussed below, larger offshore swell wave conditions induce long wave problems within the port. These swells also limit the maximum vessel departure draft. Thus, laden or near-laden vessels must depart the port well in advance of potential long wave problems at berth or they risk being confined to the port.
3. Extent of the Long Period Wave Issues
There have been a number of investigations of the long wave issues at the Port of Geraldton by means of measurements and numerical modelling (for example, 1, 2 and 3). These studies have identified that the long waves are generated by swell wave groups propagating over the extensive shallow reef area located to the north of the port, see
Figure 1. There are bound long waves associated with these swell wave groups in the deeper water offshore. As these wave groups propagate into shallow water, there is an energy transfer from the swells to the bound long waves, resulting in their growth. The swell waves subsequently break in shallow water of the reefs, resulting in the release of the long waves as free waves. These long waves then refract on the reef and the side slopes of the channel, and diffract around the Western Breakwater to enter directly into the port.
The long period waves (LPWs) entering the port can drive resonant modes within the enclosed port basin [
4]. As shown in [
10], certain of these modes coincide with the natural frequency of laden and near-laden moored Panamax vessels. As a consequence, marine operations at the Port of Geraldton are frequently disrupted by the LPWs, resulting in excessive vessel motions at berth and frequent mooring line breakages. On average, the port experiences fifty mooring line breakages per year, which is a significant safety hazard.
Short and long period waves are measured on a continuous basis at a pressure sensor gauge located between Berths 3 and 4, as shown in
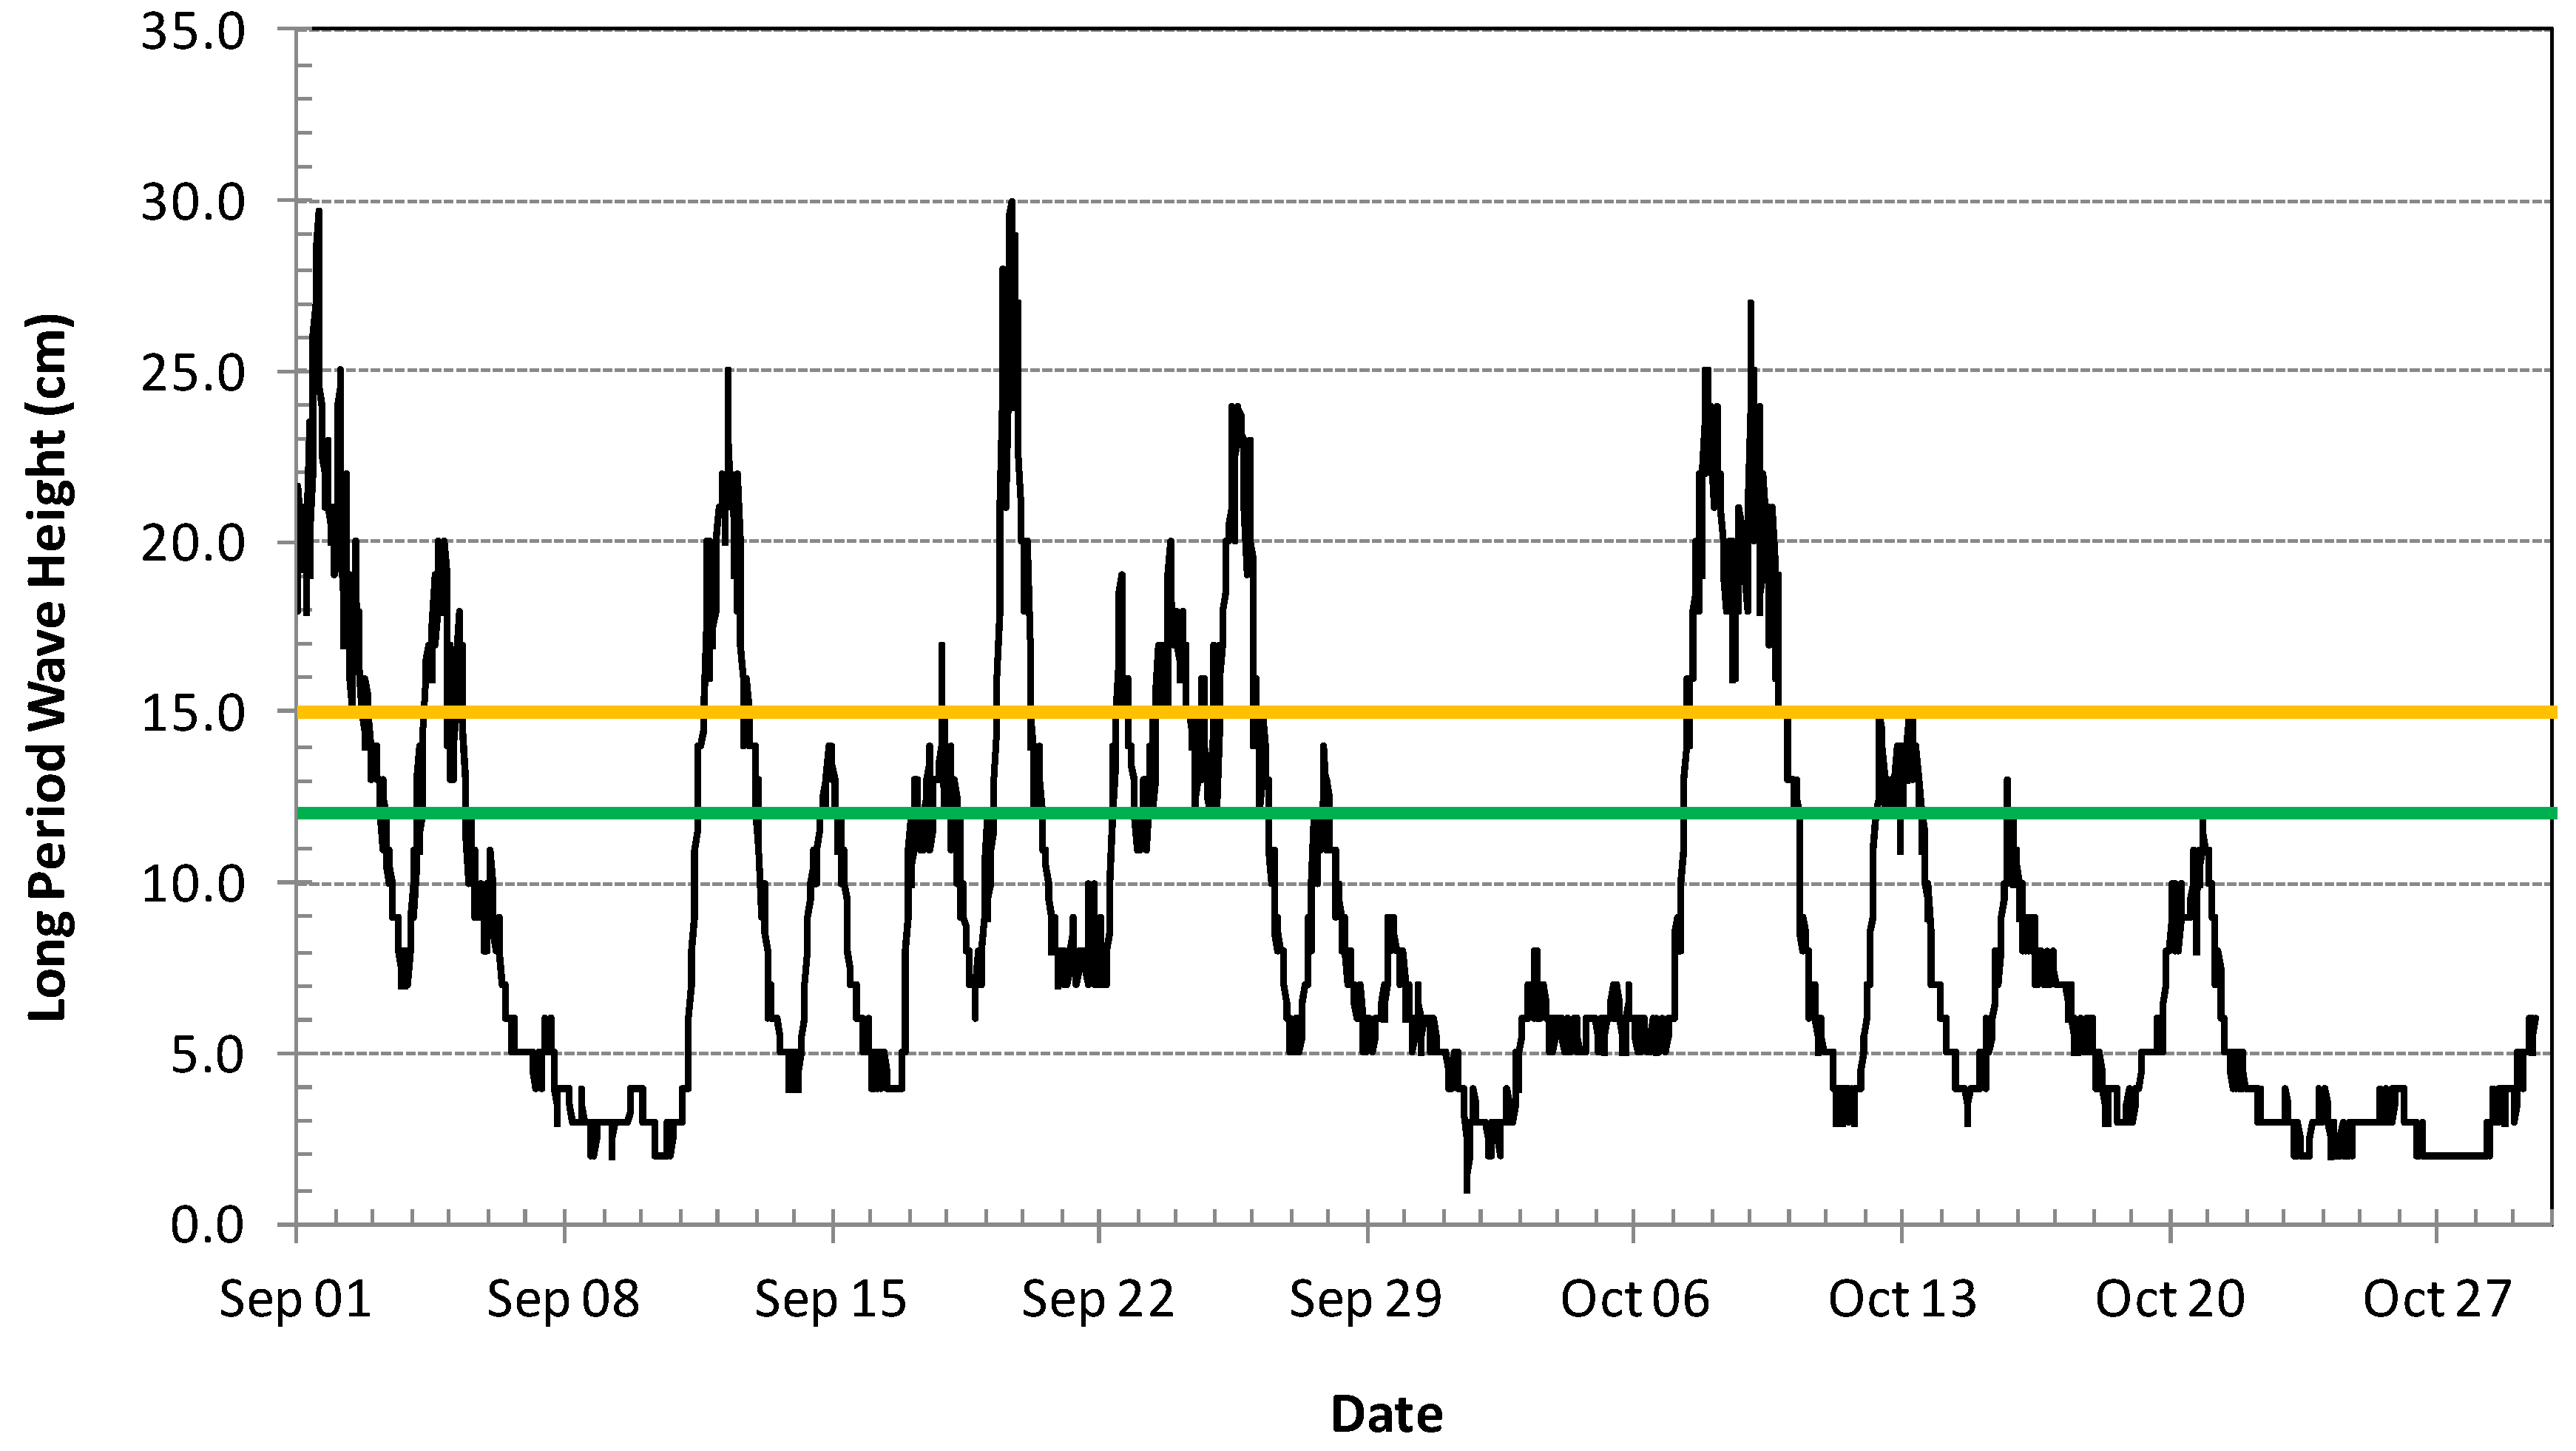
Figure 1. The measured pressure time series were quality controlled then converted to a water level time series. Spectra were computed using Welch’s method. The LPW height was calculated as 4.0 times the square root of the summation of the energy associated with wave periods in the range of 25 to 120 s. Using these measured data, long wave height thresholds have been established by the Geraldton Port Authority for each of the berths based on operational experience, as summarised in
Table 1. Note that these thresholds represent the measured/predicted long wave height at the wave gauge location, not the estimated height at the berths themselves.
A wave forecasting system has been developed by the Geraldton Port Authority in order to predict wave conditions at the wave gauge, and manage vessel transits and berth closures. Presently the practice within the port is to evacuate ships from the berths if the forecast long wave heights (within the period range of 25 to 120 s) exceed the threshold conditions.
Using the historical wave measurement data over the period from December 2012 to November 2013, an analysis was carried out to quantify the frequency and duration by which the berth thresholds were exceeded. It was assumed in this analysis that any threshold exceedances separated by less than the duration of the typical port evacuation period (5 h) were a single continuous event.
Figure 2 provides a plot of the measured long wave height at the Berth 3/4 gauge for September and October 2013, a period in which frequent berth closure was experienced. The closures varied significantly in duration from a few hours to several days. This may also been noted in
Table 2, which provides the number of occurrences of threshold exceedance by threshold value and exceedance duration. At a 12 cm threshold, for example, there are frequent short duration events (<6 h); however, there were also three periods in which the threshold was exceeded for 3 to 5 day duration.
A summary of the berth closures and resulting ship delays over the one-year time period of interest is given in
Table 3. It may be noted that closures had a 10% and 18% average impact on Berths 5 and 7, respectively. The strong seasonality associated with the berth closures may be seen in the table. Berth occupancy during the month of September can be quite limited.
Table 1 indicates that Berths 5 and 7 have an operational threshold of 12 cm. It may be noted in
Table 2 that increasing this threshold by 25%, to 15 cm, would reduce the berth closure hours by almost 50%.
4. Development of the Port Model
In order to better understand the potential impacts of berth closure on port operations and economics, a discrete event simulation model was developed using the Arena Simulation Software as distributed by Rockwell Automation. Discrete event simulation is the process of depicting the behavior of a complex system as a series of well-defined and ordered events. It allows for the analysis of a process or system’s behavior over time, and permits the user to readily explore the impacts of changing the process or system. Arena is one of the most widely used simulation environments of this type with applications in many different industries.
Although Arena has not been widely used for port simulation, recent examples of its use include shipping operations at Catalyst Paper Corporation in British Columbia, Canada [
13], and traffic simulations for the Panama Canal [
12]. Theoretical use of the model for representing complex port operations are given in [
15,
16].
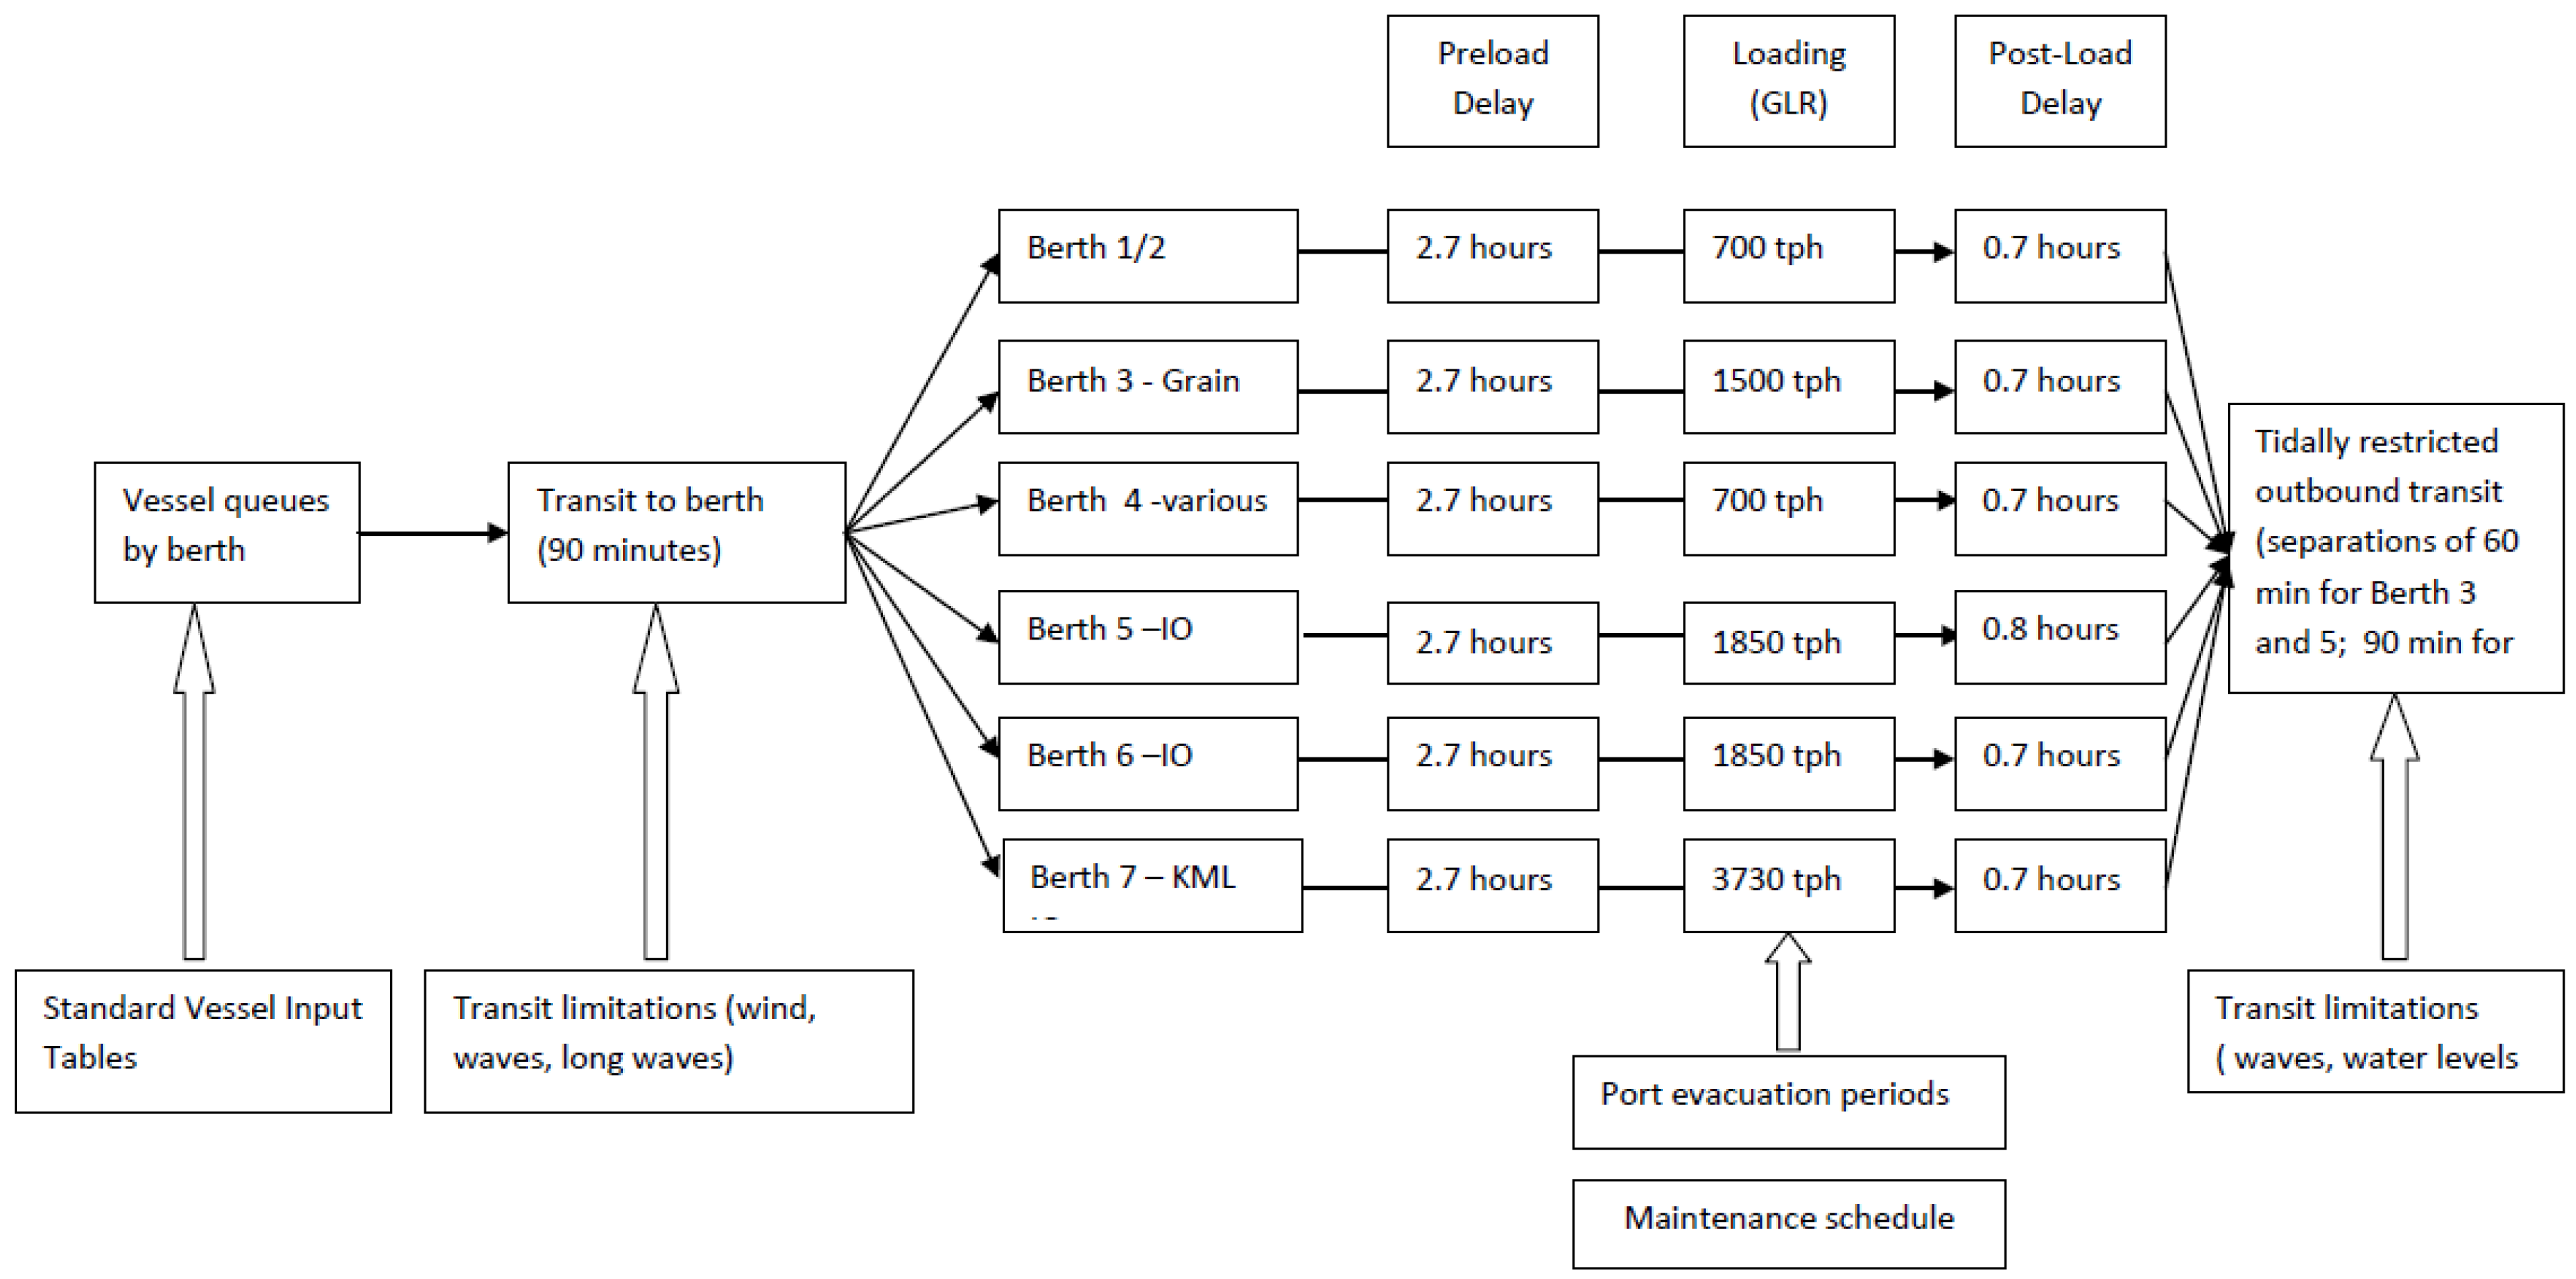
In this case, the Arena model was set up to represent the movements of the tidally restricted vessels visiting the Port of Geraldton (grain and iron ore vessels) including the process of arrival at anchorage, inbound transit and berthing, ship loading, de-berthing and departure.
Figure 3 provides a simplified representation of the model flow diagram.
The key input assumptions made in the model configuration and inputs, as derived from [
17], are summarised in
Table 4.
Vessel size distributions were determined from recent (2012/13) historical data. Vessel arrivals were assumed to occur on a regular schedule with variability.
Maintenance schedules for the shiploaders were input to the model as per the details given in [
17].
Constraints on inbound and outbound transit, and port closures were provided as model input using measured wind and wave (short and long) wave conditions. Inbound vessel transit was limited to conditions when the wind speed was less than 30 knots, significant wave height was less than 3.0 m, and the sea component of significant wave height less than 1.5 m during night time. Outbound transit was limited to the same conditions except for the wind speed restriction.
A simplistic approach was employed for representing tidally-assisted departures with the assumption that a maximum of three laden vessels can depart at high tide. Outbound vessel separations were 60 min for berths 3 and 5, and 90 min for Berth 7.
Port evacuation was triggered by long wave height thresholds at the berths (12 cm at Berths 5 and 7; 15 cm at Berth 3 under existing conditions) as defined by the measurements at the wave gauge located adjacent to Berth 3. Most vessels departed the port and waited out the long wave event at the anchorage. It was assumed that if a ship has more than 50,000 tonnes of displacement that it will depart the area and not re-berth after evacuation. The momentum associated with the berthing of larger displacement vessels would exceed the design load conditions for the fender system and wharf structure.
It was assumed that evacuated vessels waited at anchorage until wind and wave conditions were suitable for re-entry to the port. Vessels would not re-enter if the vessel cannot fully complete its loading prior to the onset of the next long wave event.
The model produced as output detailed summaries of movements and shiploading by individual vessel. These data were aggregated to produce statistics on throughput, vessel turnaround time, berth occupancy, and shiploader utilisation.
5. Simulation of Existing Conditions
The port model was initially configured for simulation of the existing conditions over the period from December 2012 to November 2013.
Table 5 provides an overview of the vessel visits during this time period, and the associated throughput.
Size distributions and arrival schedules for vessels destined for the various berths were assumed as per the historical data. All other parameters were as summarised in
Section 4.
One important distinction in the model setup was associated with Berth 7. The LPW threshold for berthing operations was assumed as 8 cm, differing from the present 12 cm threshold required for evacuation. The berthing threshold was changed to 12 cm in April 2014.
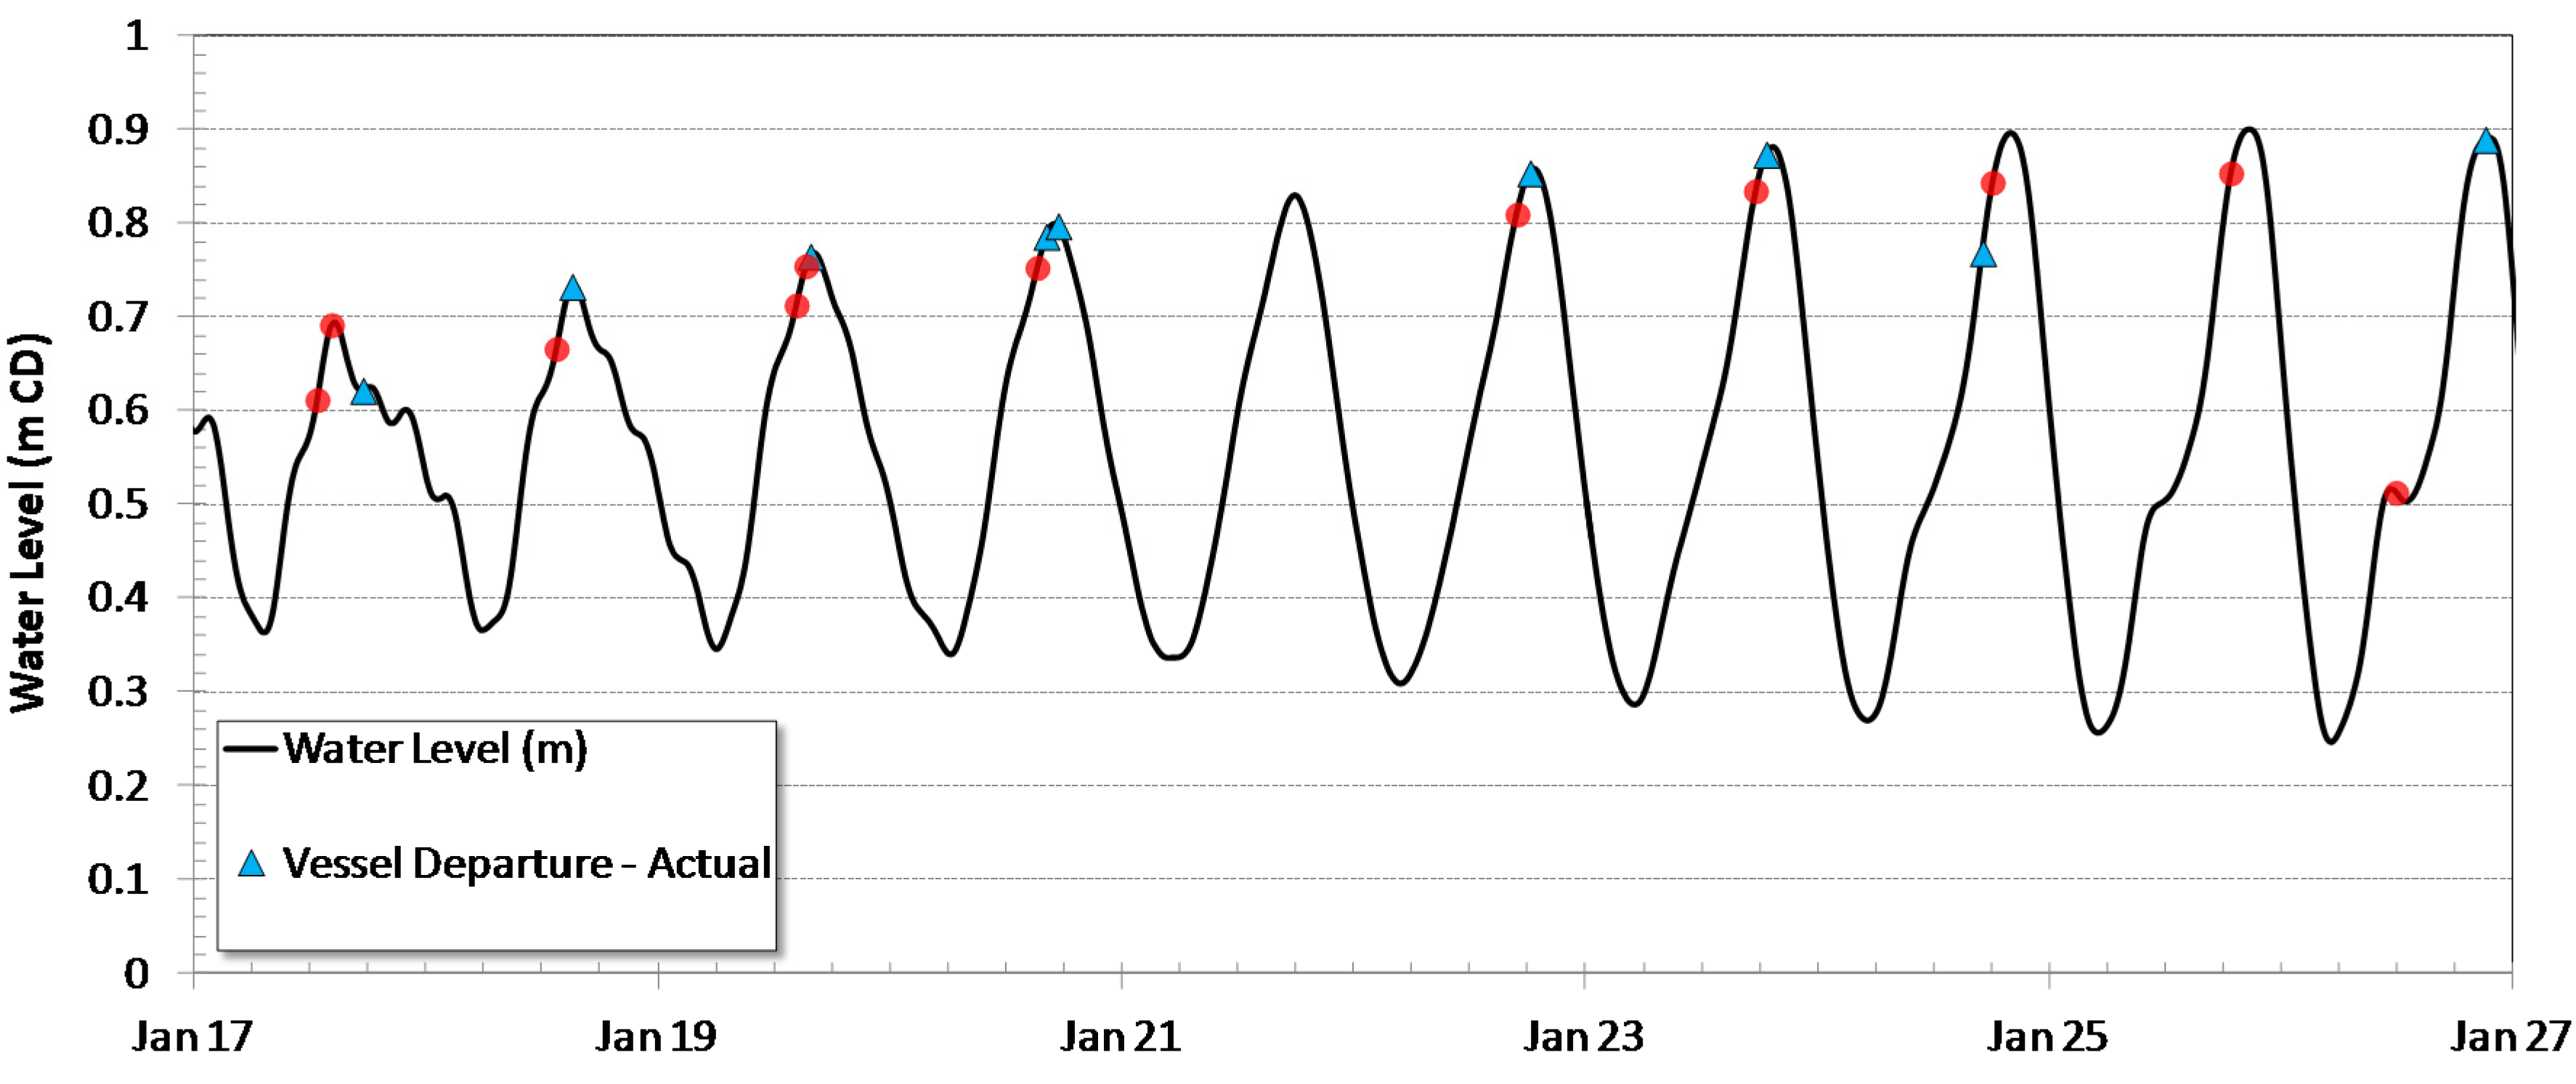
Figure 4 shows a sample comparison of model and recorded vessel departures for a time period in January 2013. As noted previously, vessels requiring tidal assistance for departure left port at or near high tide. Time series plots were reviewed to ensure that departure sequences were suitably represented in the model. Most departures were predicted to close to the actual departure time. A few departures were predicted on a previous or following high tide event.
Table 6 provides a comparison of throughput and berth occupancy. The model yielded slightly less throughput than the recorded data as one vessel at each of Berths 5 and 7 did not depart within one-year period of the simulation. Occupancy was higher at Berth 5 in the model as compared to the historical data; however, the Berth 7 occupancy was significantly lower. The turnaround time (time from vessel arrival at anchorage to departure from the berth) was considerably longer in the model than recorded at Berth 5, and shorter in the model than actual at Berth 7.
The differences in throughput and occupancy at Berths 5 and 7 likely arose due to variation in loading rate and delays during the December 2012 to November 2013 time period from the average values given in
Table 4 used as input to the model. An important consideration is that the primary use of the model for this investigation was to compare the relative economic impact of various measures to mitigate long wave impacts. For this reason, specific differences in throughput at individual berths were not expected to affect the overall findings.
6. Impact of LPW Mitigation
6.1. Mitigation Scenarios
In a companion paper [
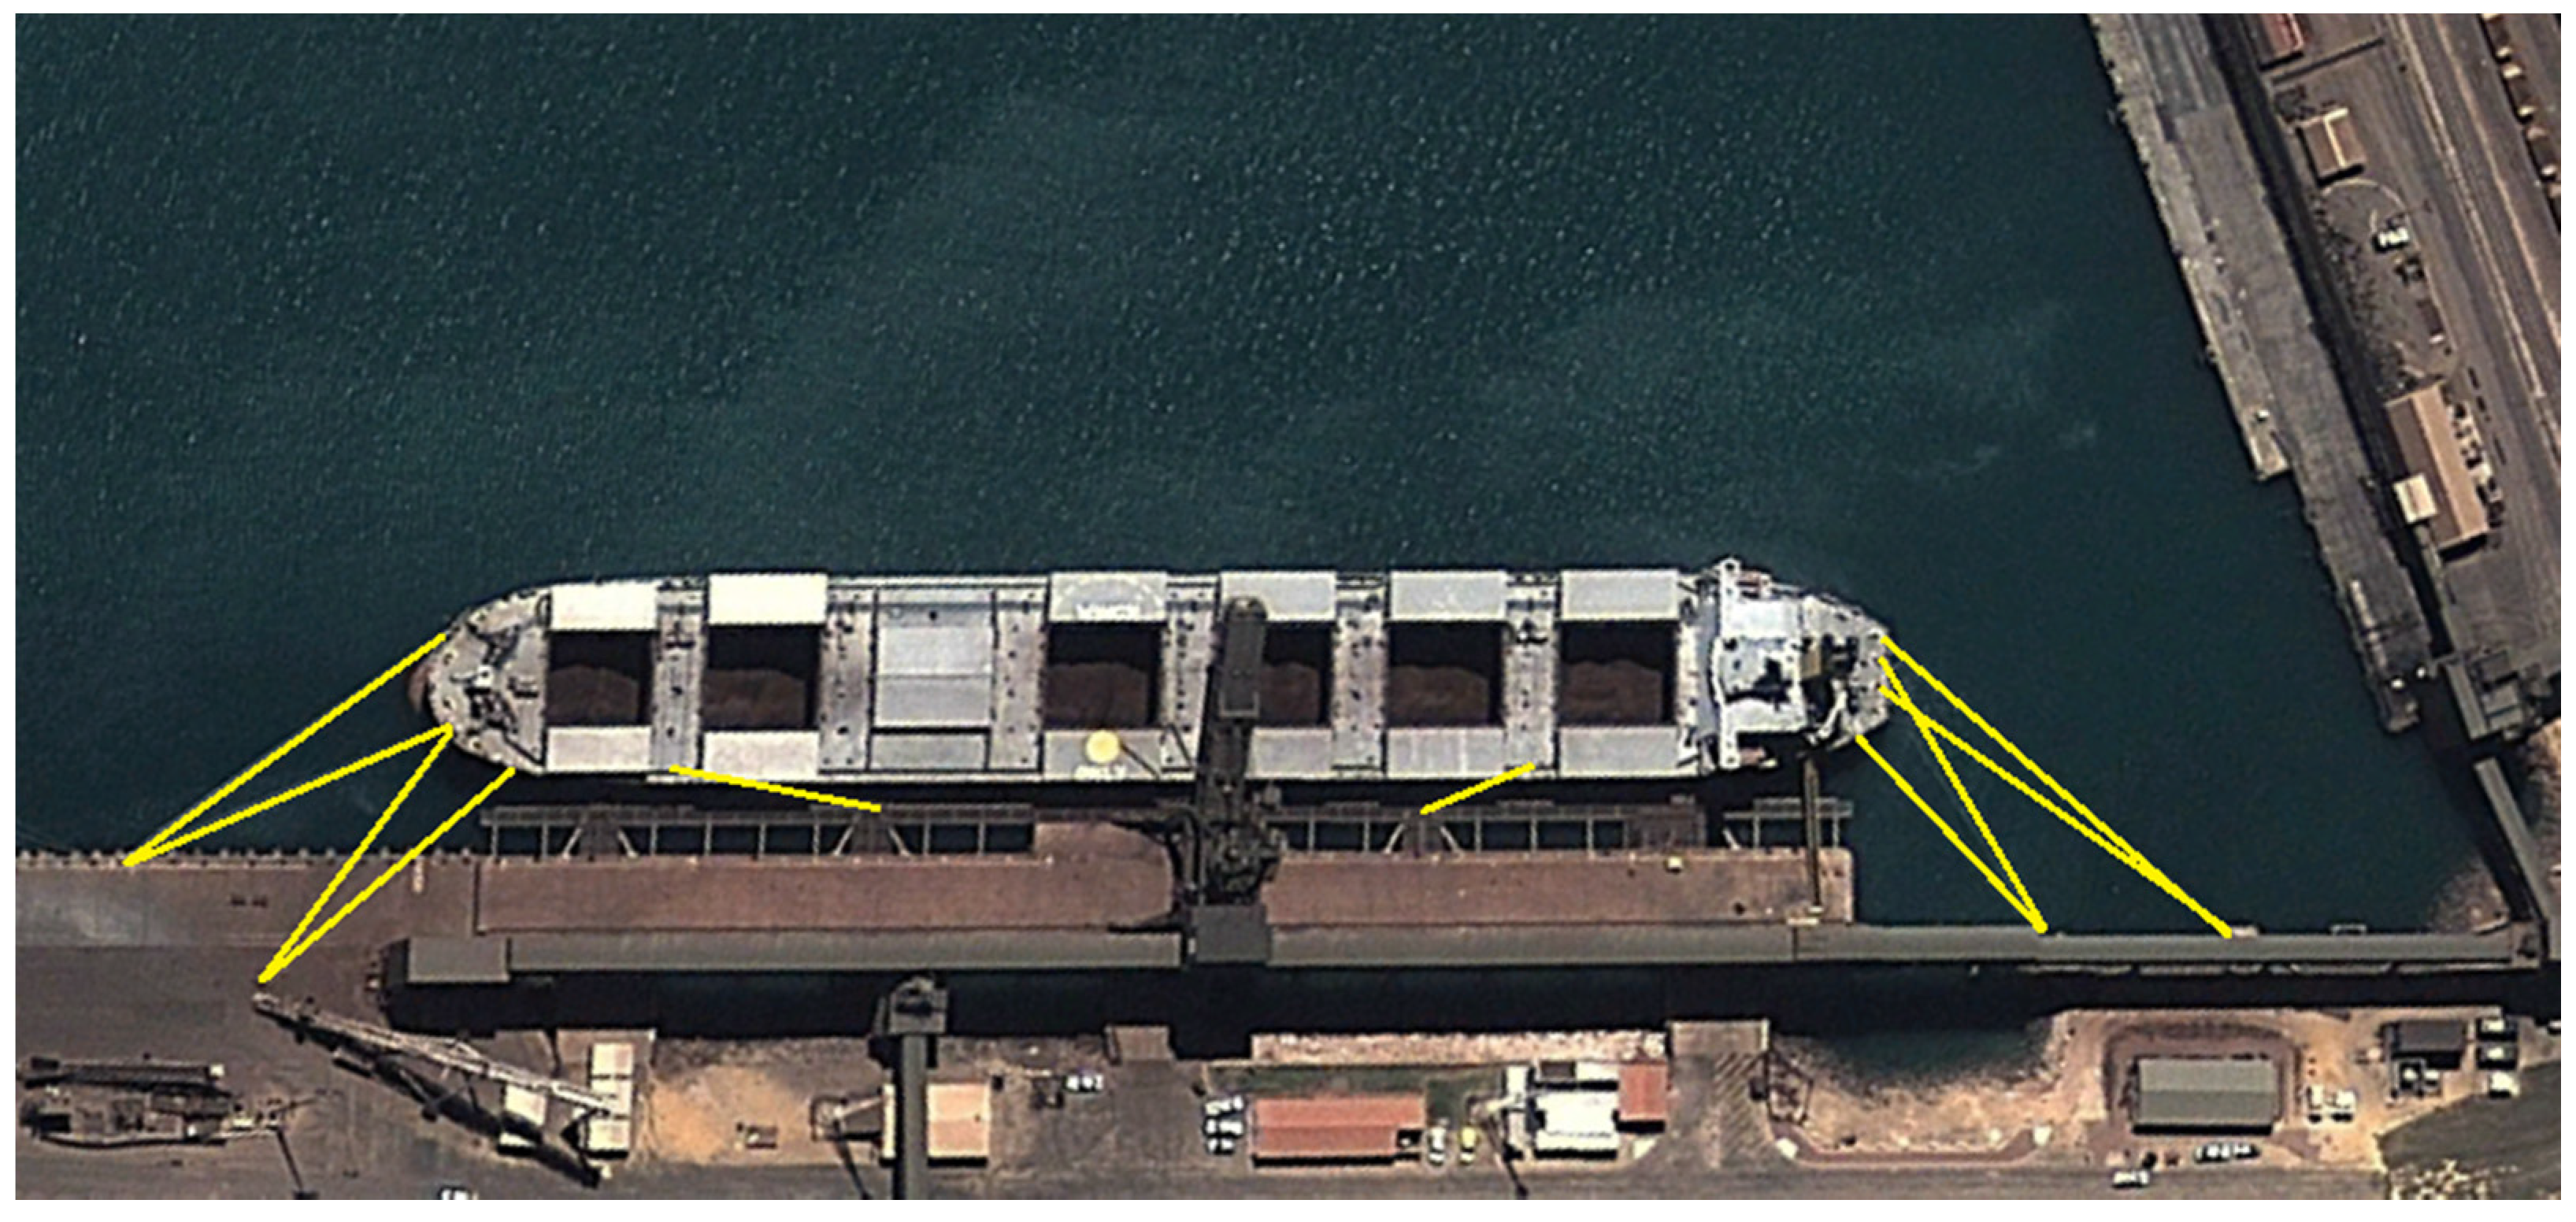
10], various alternatives for mitigating the long wave effects at berth were examined by means of numerical modeling of moored ship response. The models were set up to represent a typical Panamax bulk carrier moored at Berth 5. This berth consists of a deck on piles over a revetment that has a front slope steepness of 1:1.75 (vertical:horizontal).
The model Panamax vessel had an assumed length of 225 m, a beam of 32.2 m and a draft of 12.5 m. The vessel was assumed to carry 14 polypropylene mooring lines with a breaking strength of 607 kN. The mooring layout was 3-2-2 in terms of the number of bow/stern, breast and spring lines, forward and aft, as shown in
Figure 5. All lines were assumed to have 5 t pretension except for the sterns lines, which had 2 t pretension. The Berth 5 fenders are Supercone 1200 E1.1 fenders with a rated energy absorption capacity of 668 kNm and a rated fender force of 1073 kN. There are five fenders on the berth.
A total of eleven mooring configurations were explored, comprised of a Base Case (existing conditions) and ten different mitigation measures, including:
nylon tails,
Dyneema lines with nylon tails,
nylon breast lines,
constant tension winches on breast lines,
pneumatic fenders,
air block fenders,
pneumatic fenders + nylon breast lines,
pneumatic fenders + constant tension winches on breast lines,
air block fenders + constant tension winches on breast lines, and
MoorMaster™.
The details of each of these configurations made are found in [
10].
Ship response simulations were conducted for each of these scenarios for three different long wave events having heights (Hm0, LPW) ranging from 16 to 23 cm. In addition, simulations were carried out for the Base Case configuration (no mooring improvements) but with assumed extensions of the Western Breakwater of 200 and 350 m.
The maximum estimated ship motions, mooring line loads and fender forces in a three hour time period were summarised for each of the ship response simulations.
It was concluded that the best improvement in ship response at Berth 5 could be achieved by applying a combination of pneumatic fenders and constant tension winches set to 30 t, or nylon breast lines with a pretension of 25 t. These two concepts achieve the optimal configuration whereby the vessel is pulled into the soft fenders with a constant large force, and stays in the fenders when the vessel moves in sway and yaw due to long wave action.
6.2. Long Wave Height Thresholds
An additional set of ship response simulations was carried out in order to estimate the long wave height threshold at Berth 5 for the most promising mitigation options.
Table 7 provides a summary of the estimated thresholds at Berth 5. Also provided is an interpretation of the thresholds at Berths 3 and 7 provided the identical mooring arrangement is employed at these berths, and assuming that the thresholds will change proportionally to those at Berth 5.
The details of these preferred mooring arrangements follow.
Nylon Breast Lines: Four nylon breast lines with a breaking strength of 1216 kN on a wharf-based brake winch were assumed supplied by the port and used instead of the ship’s own breast lines. The pretension in the breast lines was set at 25 t, while the pretension in the ship’s own lines remained unchanged.
Constant Tension Winches (CTW): Four strong breast lines on a constant tension winch on the wharf were assumed supplied by the port and used instead of the ship’s own breast lines. The pretension in the constant tension winches was set at 30 t
Pneumatic Fenders: Yokohama pneumatic fenders 2500 × 4000 (diameter × width, mm) with an initial internal pressure of 0.5 bar were used instead of the existing Supercone fenders.
Pneumatic Fenders + Nylon Lines: A combined mitigation measure with the pneumatic fenders and nylon breast lines as above.
Pneumatic Fenders + CTW: A combined mitigation measure with the pneumatic fenders and constant tension winches as above.
The thresholds associated with the various alternatives were input to the Arena port capacity model, and the impact on throughput and vessel turnaround time determined.
6.3. Results of the Port Model Simulations
The preferred mooring arrangements were grouped into different LPW threshold scenarios. The simulation model was then applied to model port arrivals, loading and departures at Berths 3, 5, 6 and 7 for a total of five LPW threshold scenarios, and two alternative demand conditions. The five LPW threshold conditions covered the range of estimated changes in LPW thresholds as a result of the mitigation measures presented in
Section 6.2. The modelled LPW threshold scenarios were as follows:
Scenario 1: Existing conditions (Berth 3 15 cm, Berth 5, 6 and 7 = 12 cm),
Scenario 2: Berth 3 17.5 cm, Berth 5, 6 and 7 = 14 cm),
Scenario 3: Berth 3 18 cm, Berth 5, 6 and 7 = 15 cm),
Scenario 4: Berth 3 22.5 cm, Berth 5, 6 and 7 = 18 cm), and
Scenario 5: No LPW closure
The model was run for two alternative ship queue conditions (Scenarios A and B) which represent different future demand conditions. In demand Scenario A, the ship queue condition for the model was to hold the vessel arrivals constant for each of the scenarios, and examine the impact on ship turnaround time and throughput at Berths 3, 5 and 7. The total iron ore throughput target (from Berths 5 and 7) in this scenario was approximately 22 Mtpa. The purpose of this series of simulations was to examine the resulting reduction in ship turnaround time and incremental increase in port throughput as a result of changes in the LPW thresholds.
Table 8 presents a summary of the results for Scenario A in terms of changes in ship turnaround time and additional port throughput relative to LPW Mitigation Scenario 1 (Base Case). The results indicate that for LPW mitigation scenarios 3 to 5, an additional 0.75 to 1.0 Mtpa of throughput could be achieved as a result of LPW mitigation. The additional input is primarily the result of up to an additional 13 ship movements per year at Berth 7 compared to the base case.
In the second demand scenario (B), the vessel turnaround time was held constant (to the extent possible in the model), and the potential increase in ship arrivals and throughput as a result of increased berth availability was assessed for the various LPW thresholds. The second scenario was run for two sub-cases for the purposes of the economic assessment. The first sub-case scenario (Scenario B1) was a future 22Mtpa demand scenario, similar to Scenario A where only increased throughput from Berths 3, 5 and 7 was included. The second scenario (Scenario B2) included an upgrade of Berth 6 to target a similar iron ore export volume as Berth 5. The total iron ore throughput target for Scenario B2 was approximately 29 Mtpa. This scenario assumes that future demand for iron ore and grain will increase.
The alternative demand Scenarios B1 and B2 results are presented in
Table 9. For these model simulations, an additional 0.75 to 1.0 Mtpa of throughput could be achieved without an upgrade to Berth 6. If Berth 6 was upgraded to target 7.5 Mtpa iron ore throughput, the LPW mitigation measures will permit an additional 0.4 to 0.8 Mtpa of iron ore export capacity as compared to the base case without mitigation.
In reality, ship queue Scenario B represents an assessment of the maximum theoretical potential port throughput benefit from LPW mitigation if there is sufficient demand/supply of export products.
7. Economic Assessment
A preliminary economic assessment was carried out for the various mooring mitigation alternatives. The purpose of the economic assessment was to quantitatively compare the project economics of each scenario, specifically to examine the relationship between capital cost and benefits of the various options. The economic assessment does not represent a comprehensive investment analysis, an exercise that would require a thorough assessment of the Geraldton Port operating budget and how port throughput impacts on operational costs. In the preliminary assessment, the following assumptions were adopted:
Indicative capital costs of the various mooring alternatives as established from background information on other projects in Western Australia and elsewhere.
Indicative capital cost for the breakwater extensions as provided by the Geraldton Port Authority.
Capital costs for the alternatives involving pneumatic fenders included the cost of berthing dolphin strengthening (additional piles and concrete).
All capital costs were increased by 50% to allow for engineering, contingency and owner’s costs.
For scenarios other than the 350m breakwater extension, it was assumed the Berths 3, 5 and 7 had the respective LPW migration measure implemented. For Scenario 2b, LPW mitigation for Berth 6 was included.
Tug and pilotage costs were assumed based on values provided in [
18], pro-rated based on annual hours of berth closure.
A 15 year project life as per [
18].
A discount rate of 10.3% (pre-tax) as per [
18].
Ship charges and ship loading charges as per GPA Schedule of Tariffs.
Operational costs were not included but it is believed these costs would not have a major impact on the comparisons as reasonable assumptions regarding net revenue from additional throughput were adopted (see following point).
Revenue from ship charges as a result of increased throughput were directly assessed as revenue without cost deductions. For ship loading charges from berths with GPA owned infrastructure, the net revenue (less capital and operating costs of the infrastructure) was assumed as 10.3% of the cost charge from the GPA.
Demurrage cost adjustments compared existing scenario were included based on changes to ship delays and proportional adjustment of the LPW Demurrage costs presented in [
18].
Using the results of port capacity model simulations for constant turnaround time, the Net Present Value (NPV) and Internal Rate of Return (IRR) were calculated for the options based on the project life and assumed discount rate, accounting for the impact of port revenue through increased revenue on Berths 3, 5, 6 and 7. In the case of the breakwater extension option, the potential cost savings from reduced berth closure periods at Berths 2, 4 and 6 were included in the assessment.
Table 10 provides a summary of the estimated capital expenditure, NPV and IRR for the various alternatives assuming only Berths 3, 5 and 7 are targeted for LPW mitigation. It should be noted that cost reductions due to reduced closure times for Berths 2, 4 and 6 are included for the breakwater mitigation scenario. Assuming that the total number of ship arrivals remains unchanged, only the first three LPW mitigation options have positive NPV’s for the demand Scenario A (22Mtpa export condition). If additional ships are able to utilise the port following the LPW mitigation, only the breakwater option has a negative NPV. The nylon line option has the highest IRR for the mitigation options targeting Berths 3, 5 and 7. However, it should be noted that for Scenario 2 demand cases, the pneumatic fender solutions offer reasonable investment returns and potentially provide a more robust solution than only adopting nylon lines. In reality, the actual expected economic return for a particular mitigation scenario would be expected to be between the Scenario A and B results.
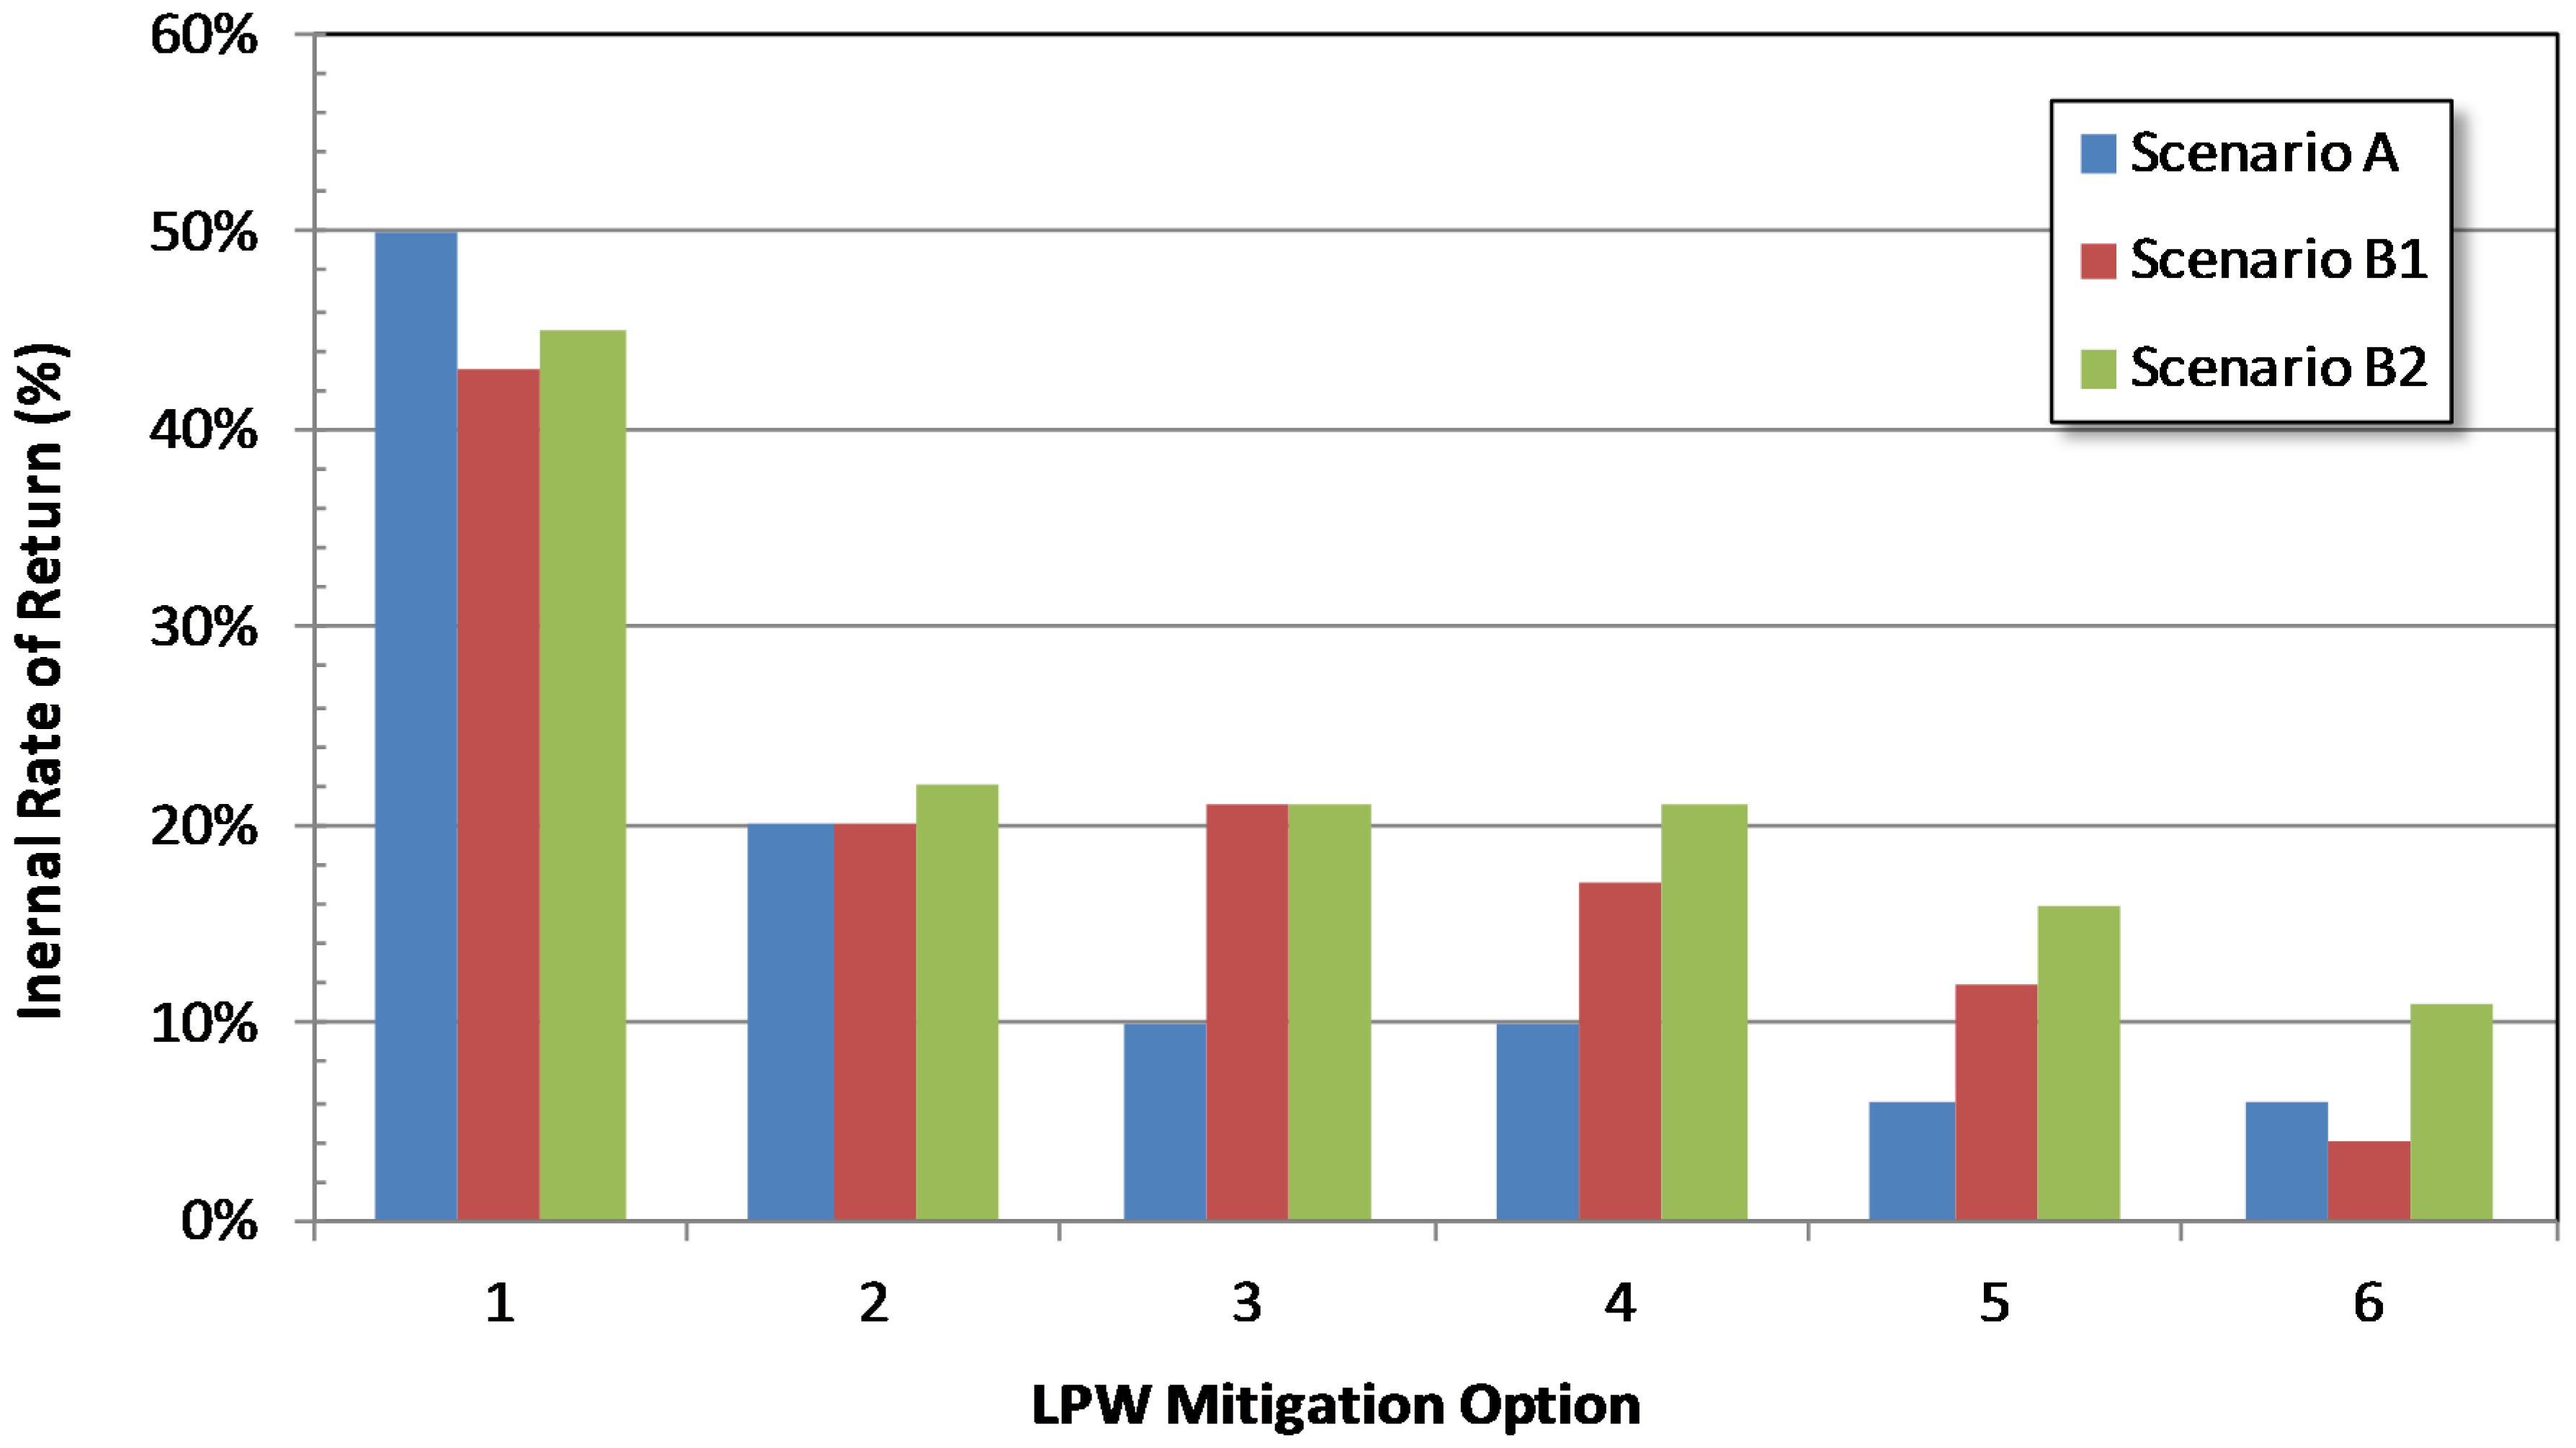
Table 11 presents a summary of the estimated capital expenditure, NPV and IRR for the various alternatives assuming Berths 3, 5, 6 and 7 are targeted for LPW mitigation. In this scenario the port is target an additional 7.5 Mtpa of iron ore export through Berth 6. For this demand condition, LPW mitigation Options 1 to 6 are all NPV positive. The nylon line option with brake winches has the highest IRR in
Table 11. However, it should be noted that for Scenario B demand cases, the pneumatic fender solutions offer reasonable investment returns and potentially provide a more robust solution than only adopting nylon lines.
Figure 6 presents the IRR as a function of the demand scenarios and the various LPW mitigation alternatives.
8. Conclusions
Marine operations at the Port of Geraldton are frequently disrupted by the long period waves, resulting in excessive vessel motions at berth and frequent mooring line breakages. A number of alternatives have been examined which have the potential to reduce long wave downtime, and reduce the number and duration of vessel evacuations from the port.
Two different future demand scenarios and six different long wave mitigation approaches were modelled using a discrete event simulation model of port operations. The output data generated by these simulations were then employed to assess the relative economics of the long wave mitigation options.
It was concluded from the results of this analysis that:
If the demand for iron ore and grain increases in the future, there is a net positive economic gain for implementation of one or more of the proposed mooring alternatives.
Mooring configurations involving the use of port-supplied nylon breast lines in conjunction with brake winches on the wharf appear to provide among the most favourable economic return, particularly if the current fender system is changed for use of pneumatic fenders.
A mooring configuration consisting of pneumatic fenders, port-supplied nylon breast lines and constant tension winches on the wharf is more costly and yields slightly less favourable economics. However, this solution may provide a more robust mooring solution with a lower functional risk profile compared to the solution without pneumatic fenders.
Extending the existing breakwater by 350 m was identified as the least favourable alternative due to its high cost and the limited improvement (25%) provided over existing LPW thresholds. The breakwater does, however, have the advantage of improving mooring conditions at all berths simultaneously. The mooring configuration alternatives only improve conditions at specific berths, but can be implemented in a staged manner.
It is important to recognise that the economic assessment does not represent a comprehensive investment analysis, but was undertaken to examine the relationship between capital cost and benefits of the various options for LPW mitigation.


