Article

Ocean-Atmosphere CO2 Fluxes in the North Atlantic Subtropical Gyre: Association with Biochemical and Physical Factors during Spring

1
CACYTMAR, Departamento de Quimica-Fisica, Facultad de Ciencias del Mar y Ambientales, Universidad de Cadiz, Puerto Real, Cadiz 11510, Spain
2
Institute of Marine Sciences of Andalusia (CSIC), Campus Rio San Pedro, s/n 11510, Puerto Real, Cadiz 11510, Spain
*
Author to whom correspondence should be addressed.
These authors contributed equally to this work.
J. Mar. Sci. Eng. 2015, 3(3), 891-905; https://doi.org/10.3390/jmse3030891
Submission received: 17 April 2015 / Accepted: 4 August 2015 / Published: 13 August 2015
(This article belongs to the Special Issue Air–Sea Gas Exchange Process and Impact Factors)

Abstract

:
Sea surface partial pressure of CO2 (pCO2) was measured continuously in a transect of the North Atlantic subtropical gyre between Santo Domingo, Dominican Republic (18.1° N, 68.5° W) and Vigo, Spain (41.9° N, 11.8° W) during spring 2011. Additional biogeochemical and physical variables measured to identify factors controlling the surface pCO2 were analyzed in discrete samples collected at 16 sites along the transect at the surface and to a depth of 200 m. Sea surface pCO2 varied between 309 and 662 μatm, and showed differences between the western and eastern subtropical gyre. The subtropical gyre acted as a net CO2 sink, with a mean flux of −5.5 ± 2.2 mmol m−2 day−1. The eastern part of the transect, close to the North Atlantic Iberian upwelling off the Galician coast, was a CO2 source with an average flux of 33.5 ± 9.0 mmol m−2 day−1. Our results highlight the importance of making more surface pCO2 observations in the area located east of the Azores Islands since air-sea CO2 fluxes there are poorly studied.

1. Introduction

Ocean-atmosphere CO2 fluxes (FCO2) are significantly controlled by the partial pressure of CO2 (pCO2) distribution at the surface of the ocean. Sea surface pCO2 is governed by biological and physical factors, e.g., uptake/release of CO2 by marine biota, linked to the availability of nutrients (photosynthesis/respiration) [1], change of sea surface temperature (SST) [2], and entrainment of deeper water enriched in CO2 [3]. In order to understand how the changing global environment may be altering the carbon cycle, it is necessary to examine further the physicochemical and biological processes that determine the flux across the air-sea boundary [4].
Strong vertical stratification of the water column in the subtropical gyres limits the supply of nutrients from below the thermocline to the euphotic layer. The upwelling of nutrients from deeper waters supports new primary production, which reduces surface CO2. However, the input of CO2-enriched deeper waters also leads to oversaturation of CO2 with respect to the atmosphere [5]. These two processes associated with upwelling have antagonistic effects on ocean-atmosphere CO2 fluxes and can cause large regional and temporal changes in the net air-sea CO2 fluxes in the vicinity of upwelling regions.
The North Atlantic Ocean is a major sink for global atmospheric CO2: it accounts for about 25% of the total anthropogenic CO2 absorbed by all the oceans [6]. Evidence suggests that the efficiency of this sink has decreased during recent decades [7,8,9,10]. Takahashi et al. [6] established that the average rate of sea surface pCO2 increase in the North Atlantic Ocean basin has been 1.8 ± 0.4 μatm year−1, from 1972 to 2006. The North Atlantic subtropical gyre has shown an average annual pCO2 increase of 1.6 ± 0.5 μatm year−1 between the years 1990 to 2006; this is similar to the rate of increase of atmospheric pCO2 [2]. Santana-Casiano et al. [11] found a pCO2 increase of 1.5 μatm year−1 in the eastern subtropical gyre at the European Station for Time Series in the Ocean (ESTOC) near the Canary Islands. Observations at the Bermuda Atlantic Time Series (BATS) site, in the western zone of the gyre, show average rates of pCO2 increase in surface water of 1.4 ± 1.1 μatm year−1 between 1988 and 1998 [12], 1.5 ± 0.1 μatm year−1 between 1983 and 2001 [13], and 1.8 ± 0.1 μatm year−1 between 1983 and 2011 [10]. In the more eutrophic northeast Atlantic, at 30°–60° N, there is no comparable time-series station, and the understanding of biogeochemical processes in this region is currently based on short term studies (e.g., [14,15,16]) and multiyear composites of such studies [17]. Observations and modelling studies can only partly compensate for this lack of true time series data.
One of the current challenges for the scientific community is to make an accurate evaluation of the ocean surface CO2 distribution, together with its temporal and spatial variability, and to identify the processes controlling this distribution [18,19,20]. With such data, the ocean’s role as either sink or source of CO2 can be more reliably estimated, and future atmospheric CO2 levels predicted. However, knowledge about this role of the oceans is still limited [8].
In order to improve the description of CO2 fluxes in the North Atlantic subtropical gyre, we studied pCO2 variability in the surface waters during the spring season of 2011. Data presented in this paper highlights the importance of the sea surface pCO2 distribution in controlling CO2 fluxes between the ocean and the atmosphere. Our paper estimates the spatial variability of the flux during spring, and we describe the main processes controlling sea surface pCO2.

2. Material and Methods

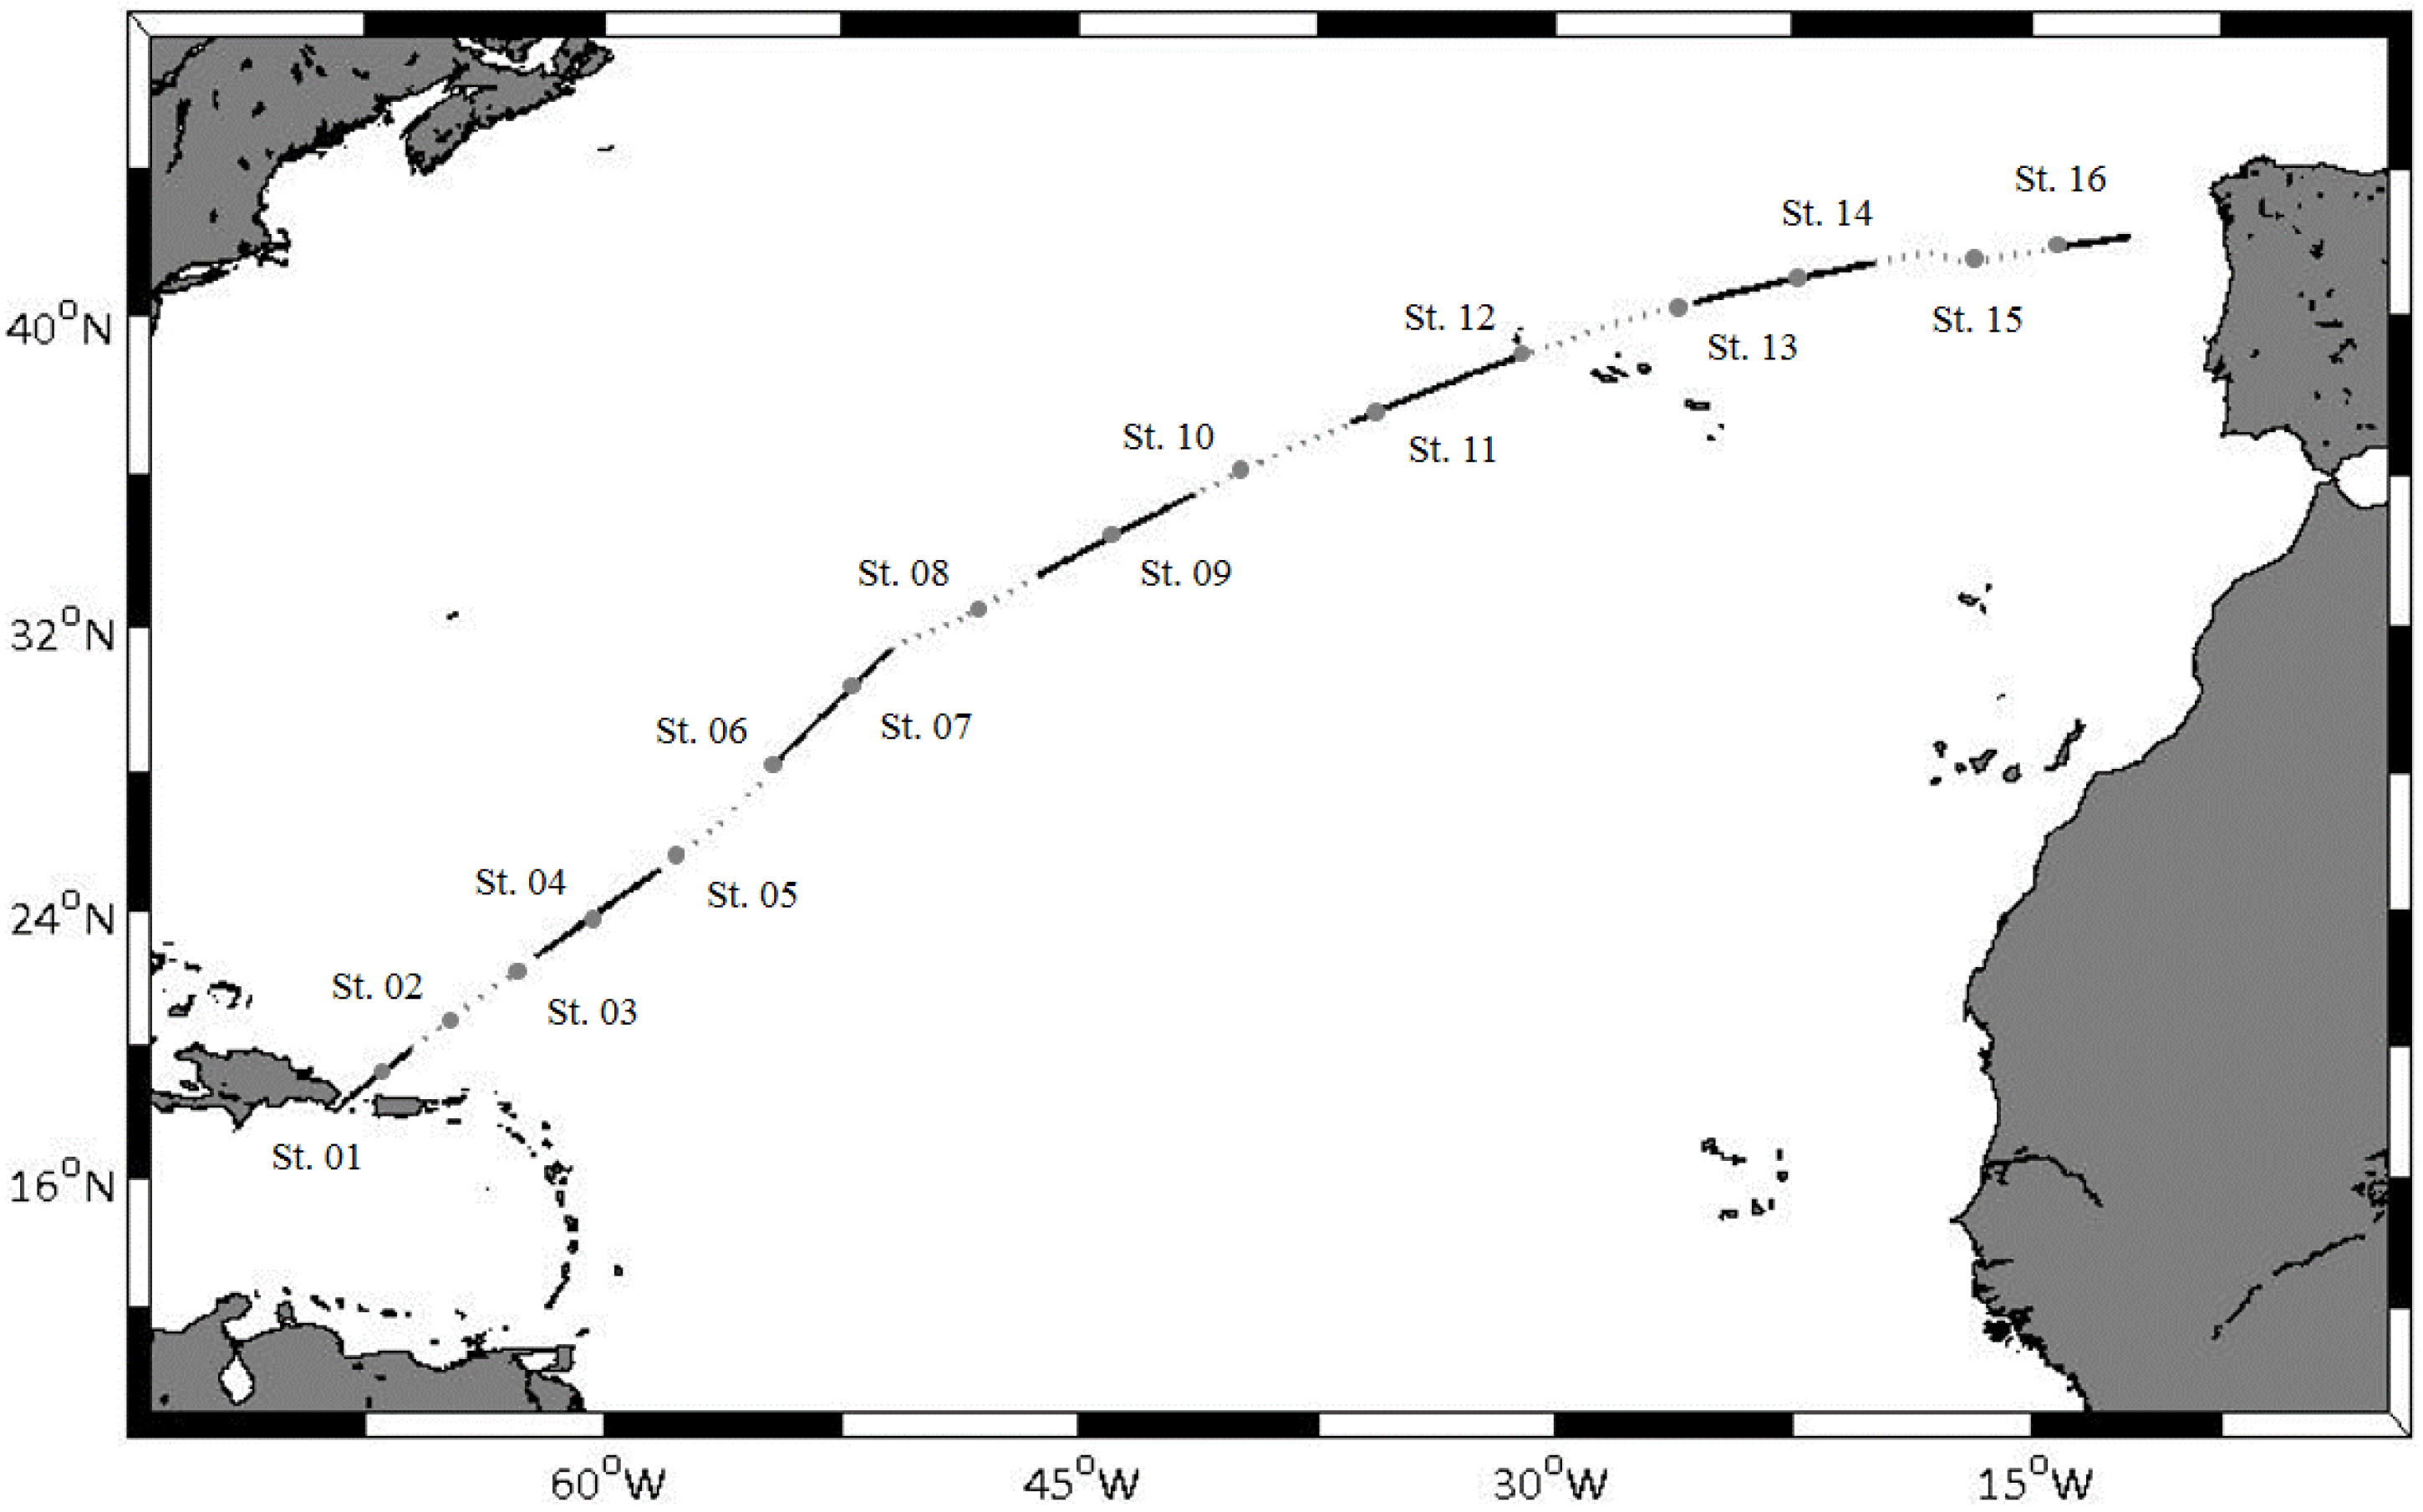
2.1. Study Area and Field Sampling

The campaign was carried out along a 6300 km long transect (Figure 1) crossing the North Atlantic subtropical gyre between Santo Domingo, Dominican Republic (18.1° N, 68.5° W) and Vigo, Spain (41.9° N, 11.8° W). The subtropical gyre comprises two biogeochemical provinces, differentiated in respect of their ecology; the western subtropical gyre (WSTG) and the eastern subtropical gyre (ESTG) [21,22,23].
Figure 1. Transect of the study cruise on board the Research Vessel “Sarmiento de Gamboa”, and locations of sampling stations. Each dotted and solid line corresponds to 500 km.
Jmse 03 00891 g001
Data were collected between 24 March and 8 April 2011 on board the R/V Sarmiento de Gamboa. Sea surface partial pressures of CO2 (pCO2) were measured continuously with an automated pCO2 measuring system (General Oceanics 8050,General Oceanics, Miami, FL, USA; Pierrot et al., 2009, [24]), in which sensors of dissolved oxygen (DO) and pH are integrated. Sea surface temperature (SST) and salinity were sampled with a thermosalinograph (SBE21, SeaBird, Bellevue, WA, USA), and fluorescence was determined using a fluorimeter (Turner Designs 10AU, Turner Designs, Inc., Sunnyvale, CA, USA), connected to the seawater intake system of the ship. Sensor signals were calibrated using discrete samples collected three times per day for DO, chlorophyll, pH and total alkalinity (TA) determinations. At 16 sampling stations (Figure 1), vertical profiles of temperature, salinity, DO and fluorescence were measured in the first 200 m of the water column, using a CTD (SBE9 plus, SeaBird, Bellevue, WA, USA). Coordinates of the sampling station locations are given in Table 1. The CTD was mounted in a rosette sampler equipped with Niskin bottles (SeaBird, Bellevue, WA, USA), used to sample seawater for DO, chlorophyll, nitrate (NO3) and phosphate (HPO42−).
Table 1. Sampling station location and daily mean values of sea surface pH, total alkalinity (TA), dissolved inorganic carbon (DIC), partial pressure of CO2 (pCO2), ocean-atmosphere pCO2 gradient (ΔpCO2), wind speed (WS) and sea-air CO2 fluxes (FCO2).
StationLocation (N, W)pHTA (mM)DIC (mM)pCO2 (μatm)ΔpCO2 (μatm)WS (m s−1)FCO2 (mmol m−2 day−1)
0119.3°, 66.9° 8.09--354.4−38.69.20−8.5
0220.9°, 64.7°8.12----348.1−44.95.22−3.9
0322.4°, 65.2°8.122.411.93346.6−46.44.02−2.1
0424.0° 59.4°8.102.451.99343.7−49.35.12−3.3
0526.5°, 56.3°8.082.471.94341.2−51.85.58−4.1
0629.0°, 53.7°8.052.371.99347.9−45.16.73−5.3
0731.6°, 50.4°8.032.372.01344.2−48.88.05−8.3
0833.1°, 46.8°8.072.472.16336.6−56.57.49−8.2
0934.7°, 43.3°8.062.442.08338.3−54.75.73−4.7
1036.3°, 39.3°8.032.472.12343.2−49.85.83−4.5
1137.8°, 35.1°7.962.482.20343.1−49.97.49−7.4
1239.1°, 30.7°7.942.402.16342.2−50.97.31−7.2
1340.3°, 25,6°7.942.402.16329.5−63.59.19−14.1
1441.0°, 21.8°7.922.362.15345.0−48.05.60−4.0
1541.2°, 17.1°7.922.362.16431.138.110.379.3
1641.6°, 14.7°7.962.362.14591.0197.9 8.7336.9

2.2. Analytical Methods

For pCO2 determinations, seawater was sprayed into an equilibration chamber at a flow rate of 2 L min1. The headspace gas was circulated through the condenser and a Permapure membrane dryer before flowing through an infrared analyser (Li-7000, LICOR, Lincoln, NE, USA), where CO2 and H2O mole fractions were measured [24]. A set of CO2 gas standards with concentrations of 0, 200, 400 and 600 ppm (certified by Carbagas–Air Liquide) were analysed every two hours to calibrate the infrared analyser. Seawater pCO2 was calculated following Dickson et al. [25], with corrections for vapour water pressure [26] and warming between the sea surface and equilibrator [27].
The Winkler method was applied for DO analyses [28] by means of potentiometric endpoint titration (Metrohm 808, Metrohm, Herisau, Switzerland). Apparent oxygen utilization (AOU) was calculated using the solubility expression proposed by Weiss [29]. Chlorophyll determinations were made by filtering seawater through glass fibre filters (Whatman GF-F 0.7 μm, Cole-Parmer, Vernon Hills, IL, USA), which were then frozen at −20 °C. An acetone 90% extraction was used to extract the pigment and chlorophyll, which was analysed using a spectrofluorometer (LS-5, Perkin Elmer, Waltham, MA, USA). A chlorophyll standard (C6144-1 mg) was used for the spectrofluorometer calibration. Method accuracy was ±0.05 mg m−3. Spectrophotometric seawater pH was determined in 10 cm chambers (Lambda 850, Perkin Elmer, Waltham, MA, USA) using an m-cresol purple indicator dye [30]. Total alkalinity was obtained by endpoint potentiometric titration (Metrohm 808) using HCl 0.1 M [31]. The accuracy of the TA measurement was ±1.4 μM, and was checked daily using certified reference material provided by Andrew Dickson of the Scripps Institute of Oceanography (BATCH #107). Dissolved inorganic carbon (DIC) was calculated from the pH and TA with the carbonic acid and boric acid dissociation constants of Lueker et al. [32]. Nutrient analyses (nitrate and phosphate) were carried out in a segmented-flow autoanalyzer (San Plus, Skalar, Breda, The Netherlands) based on classic spectrophotometric methods [28]. The measurement precisions were: ±0.5 μmol kg−1 for dissolved oxygen; ±0.003 pH units for spectrophotometric pH; ±0.02 μM for nitrate and ±0.02 μM for phosphate.

2.3. Flux Calculation

Net sea-air CO2 flux (FCO2) was estimated using the following expression:
FCO2 = α k (ΔpCO2)sea-air
where α is the solubility of CO2 in seawater [33] (mol L−1 atm−1), k is the CO2 gas transfer velocity (cm h−1) and ΔpCO2 (μatm) is the sea-air CO2 partial pressure difference. The k dependence on wind speed has been calculated using the relationship formulated by Wanninkhof [34]. Wind speed was measured from the vessel’s meteorological station situated 10 m above the ocean surface and daily mean values were used for FCO2 calculations. ΔpCO2 was calculated as the difference between the sea surface pCO2 and an atmospheric pCO2 mean value of 396.5 μatm, obtained from the Mace Head Station for March and April 2011 [35]. A negative (positive) flux indicates the direction of transfer of CO2 between the atmosphere and the ocean; that is, the ocean is acting as an atmospheric sink (source) for CO2.

3. Results

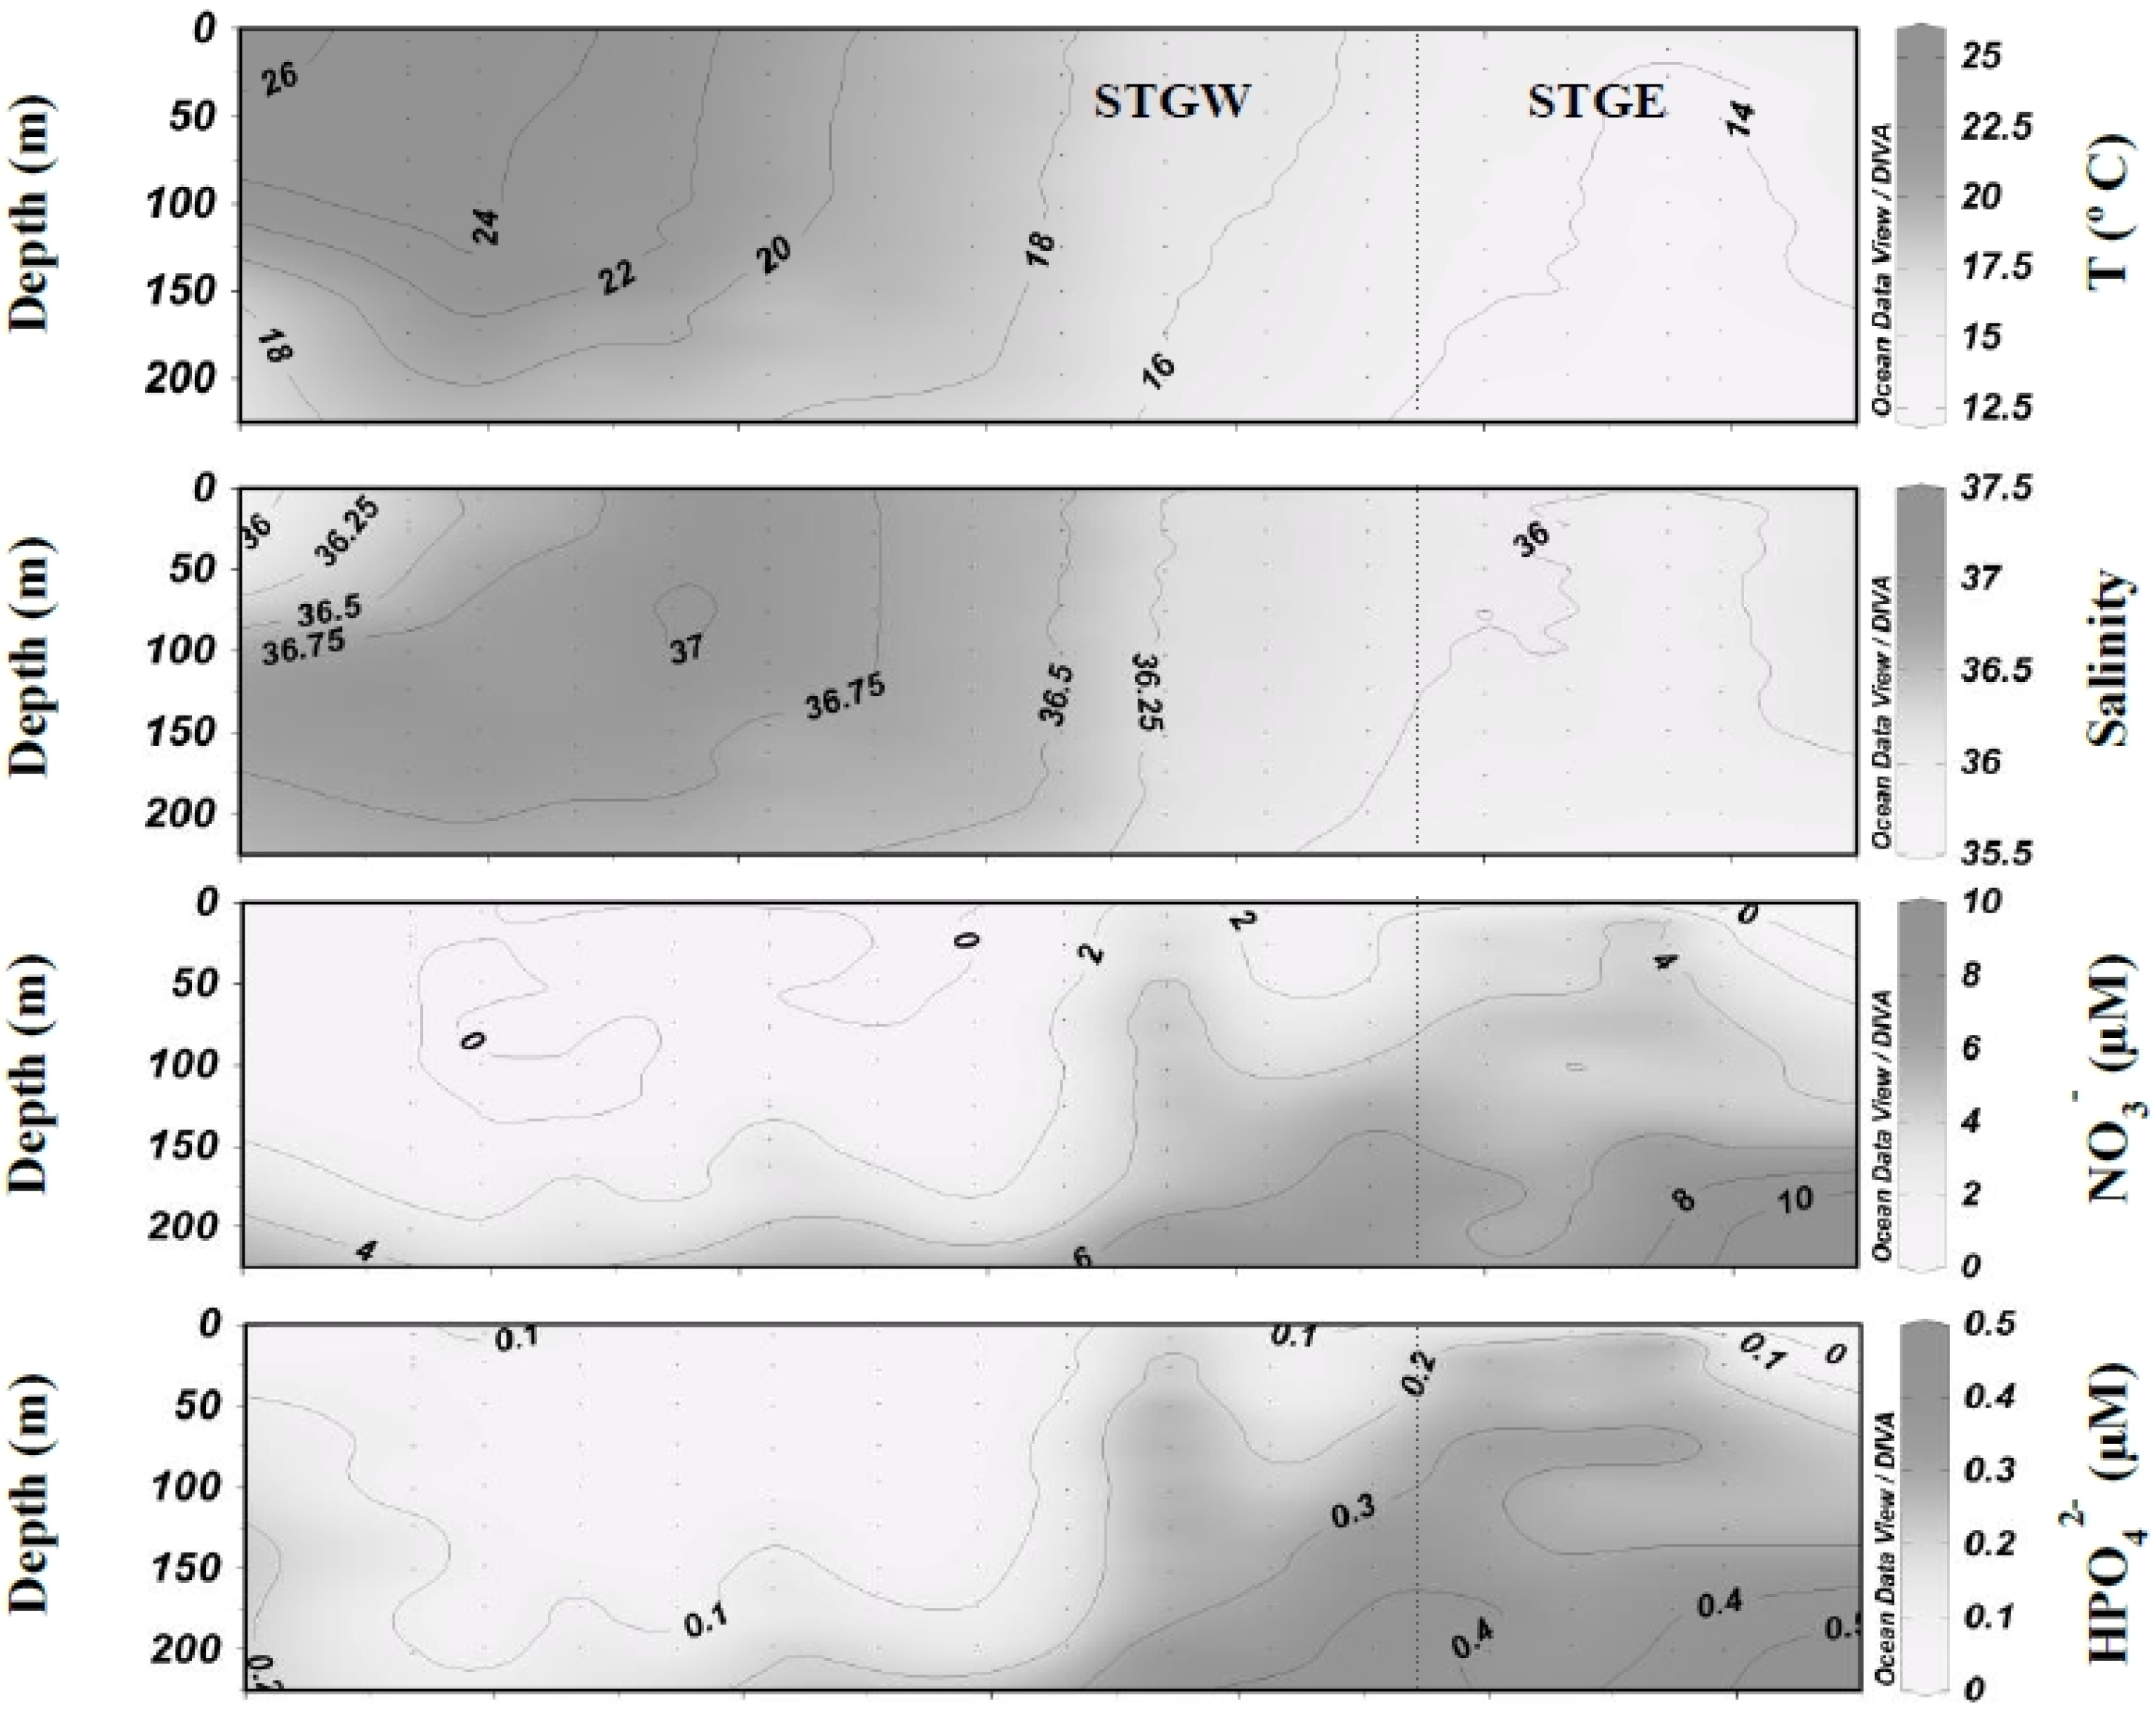
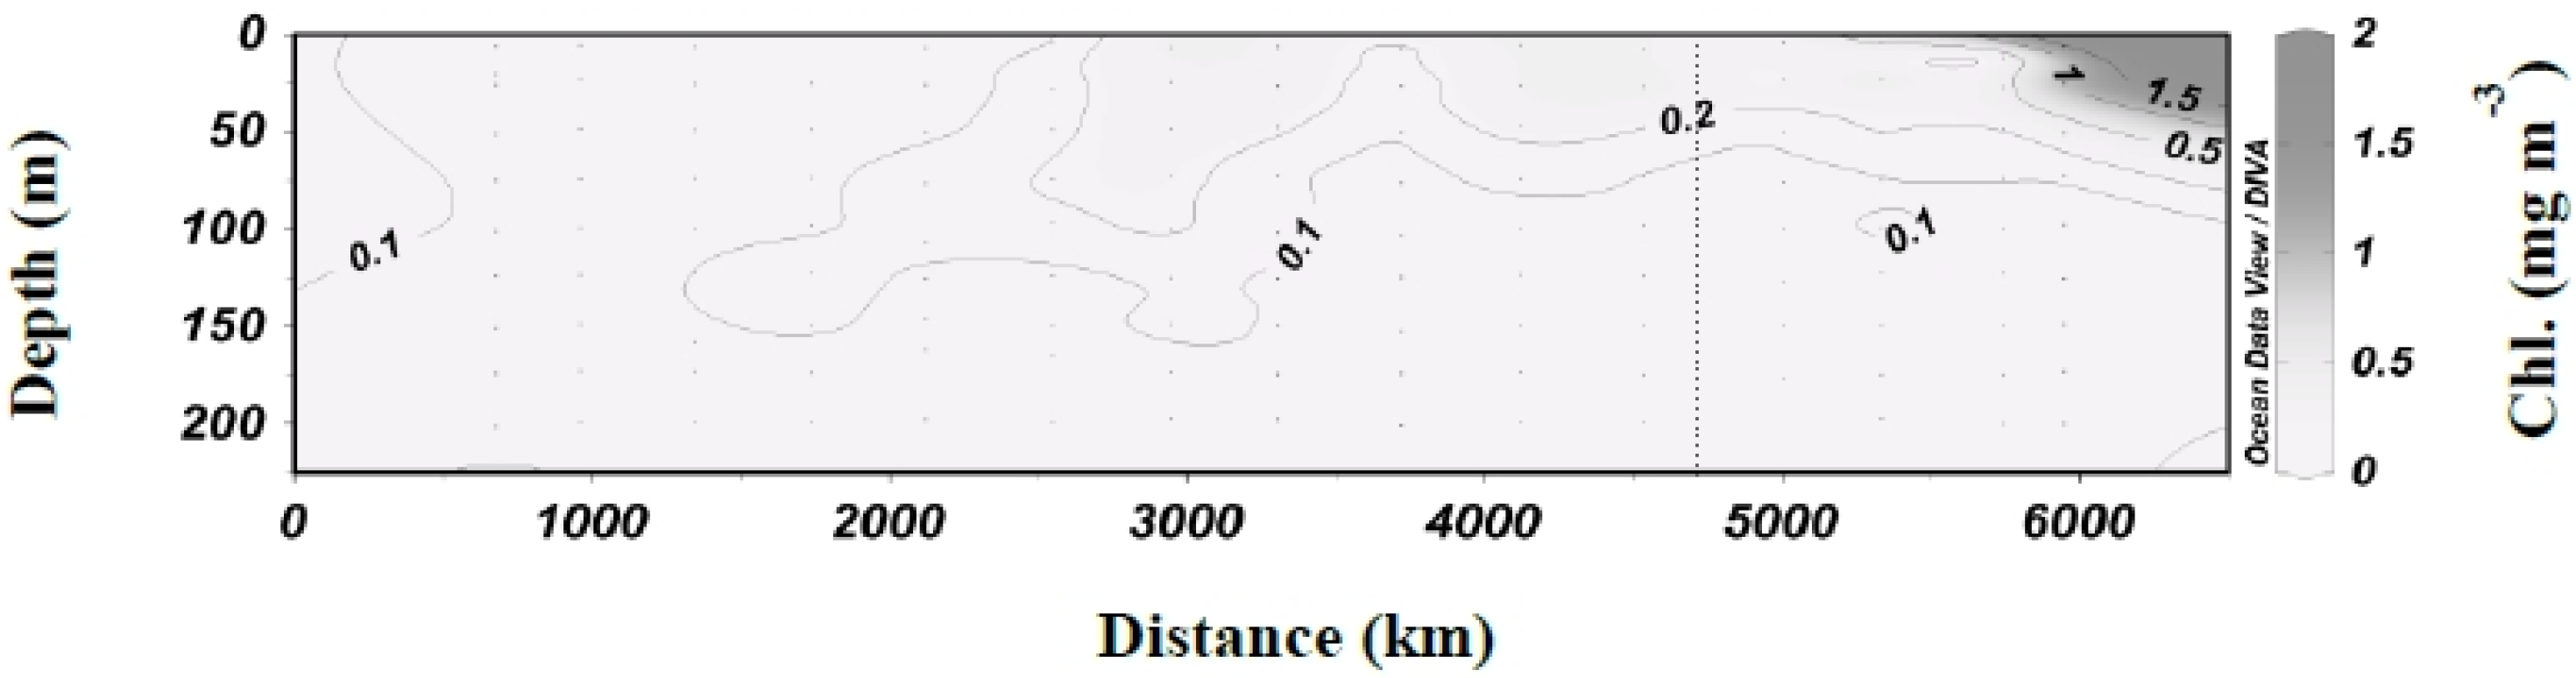
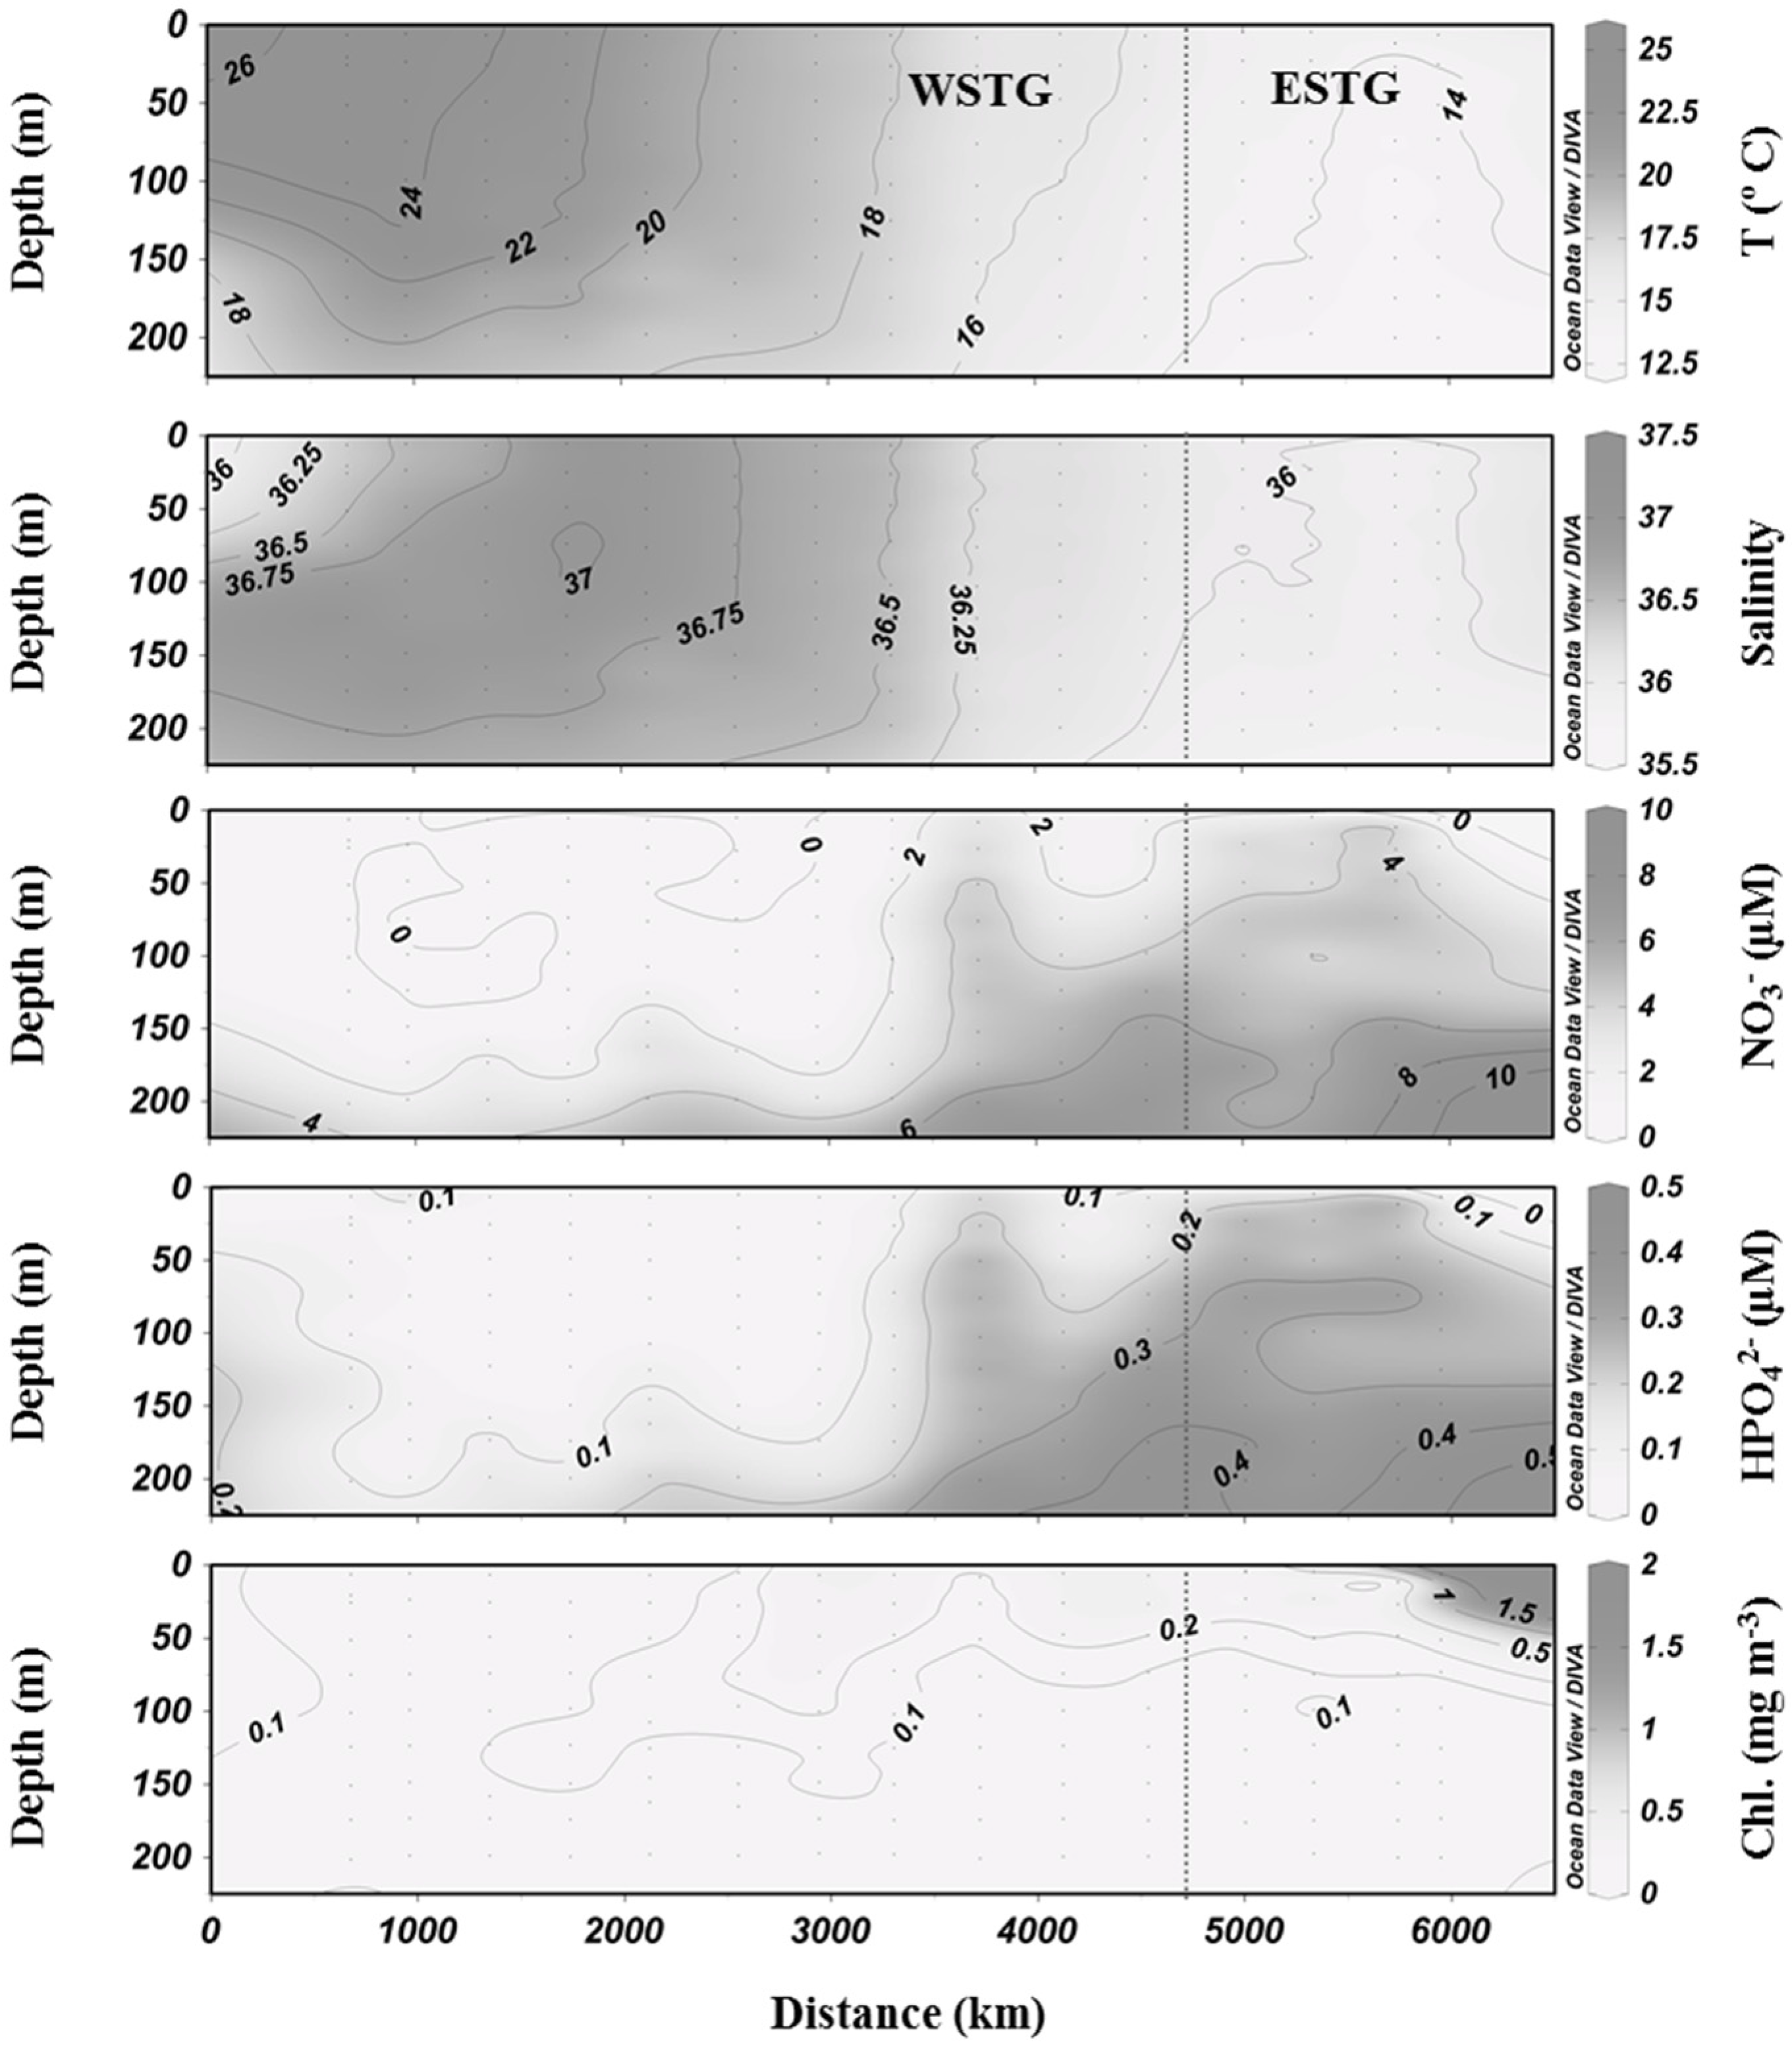
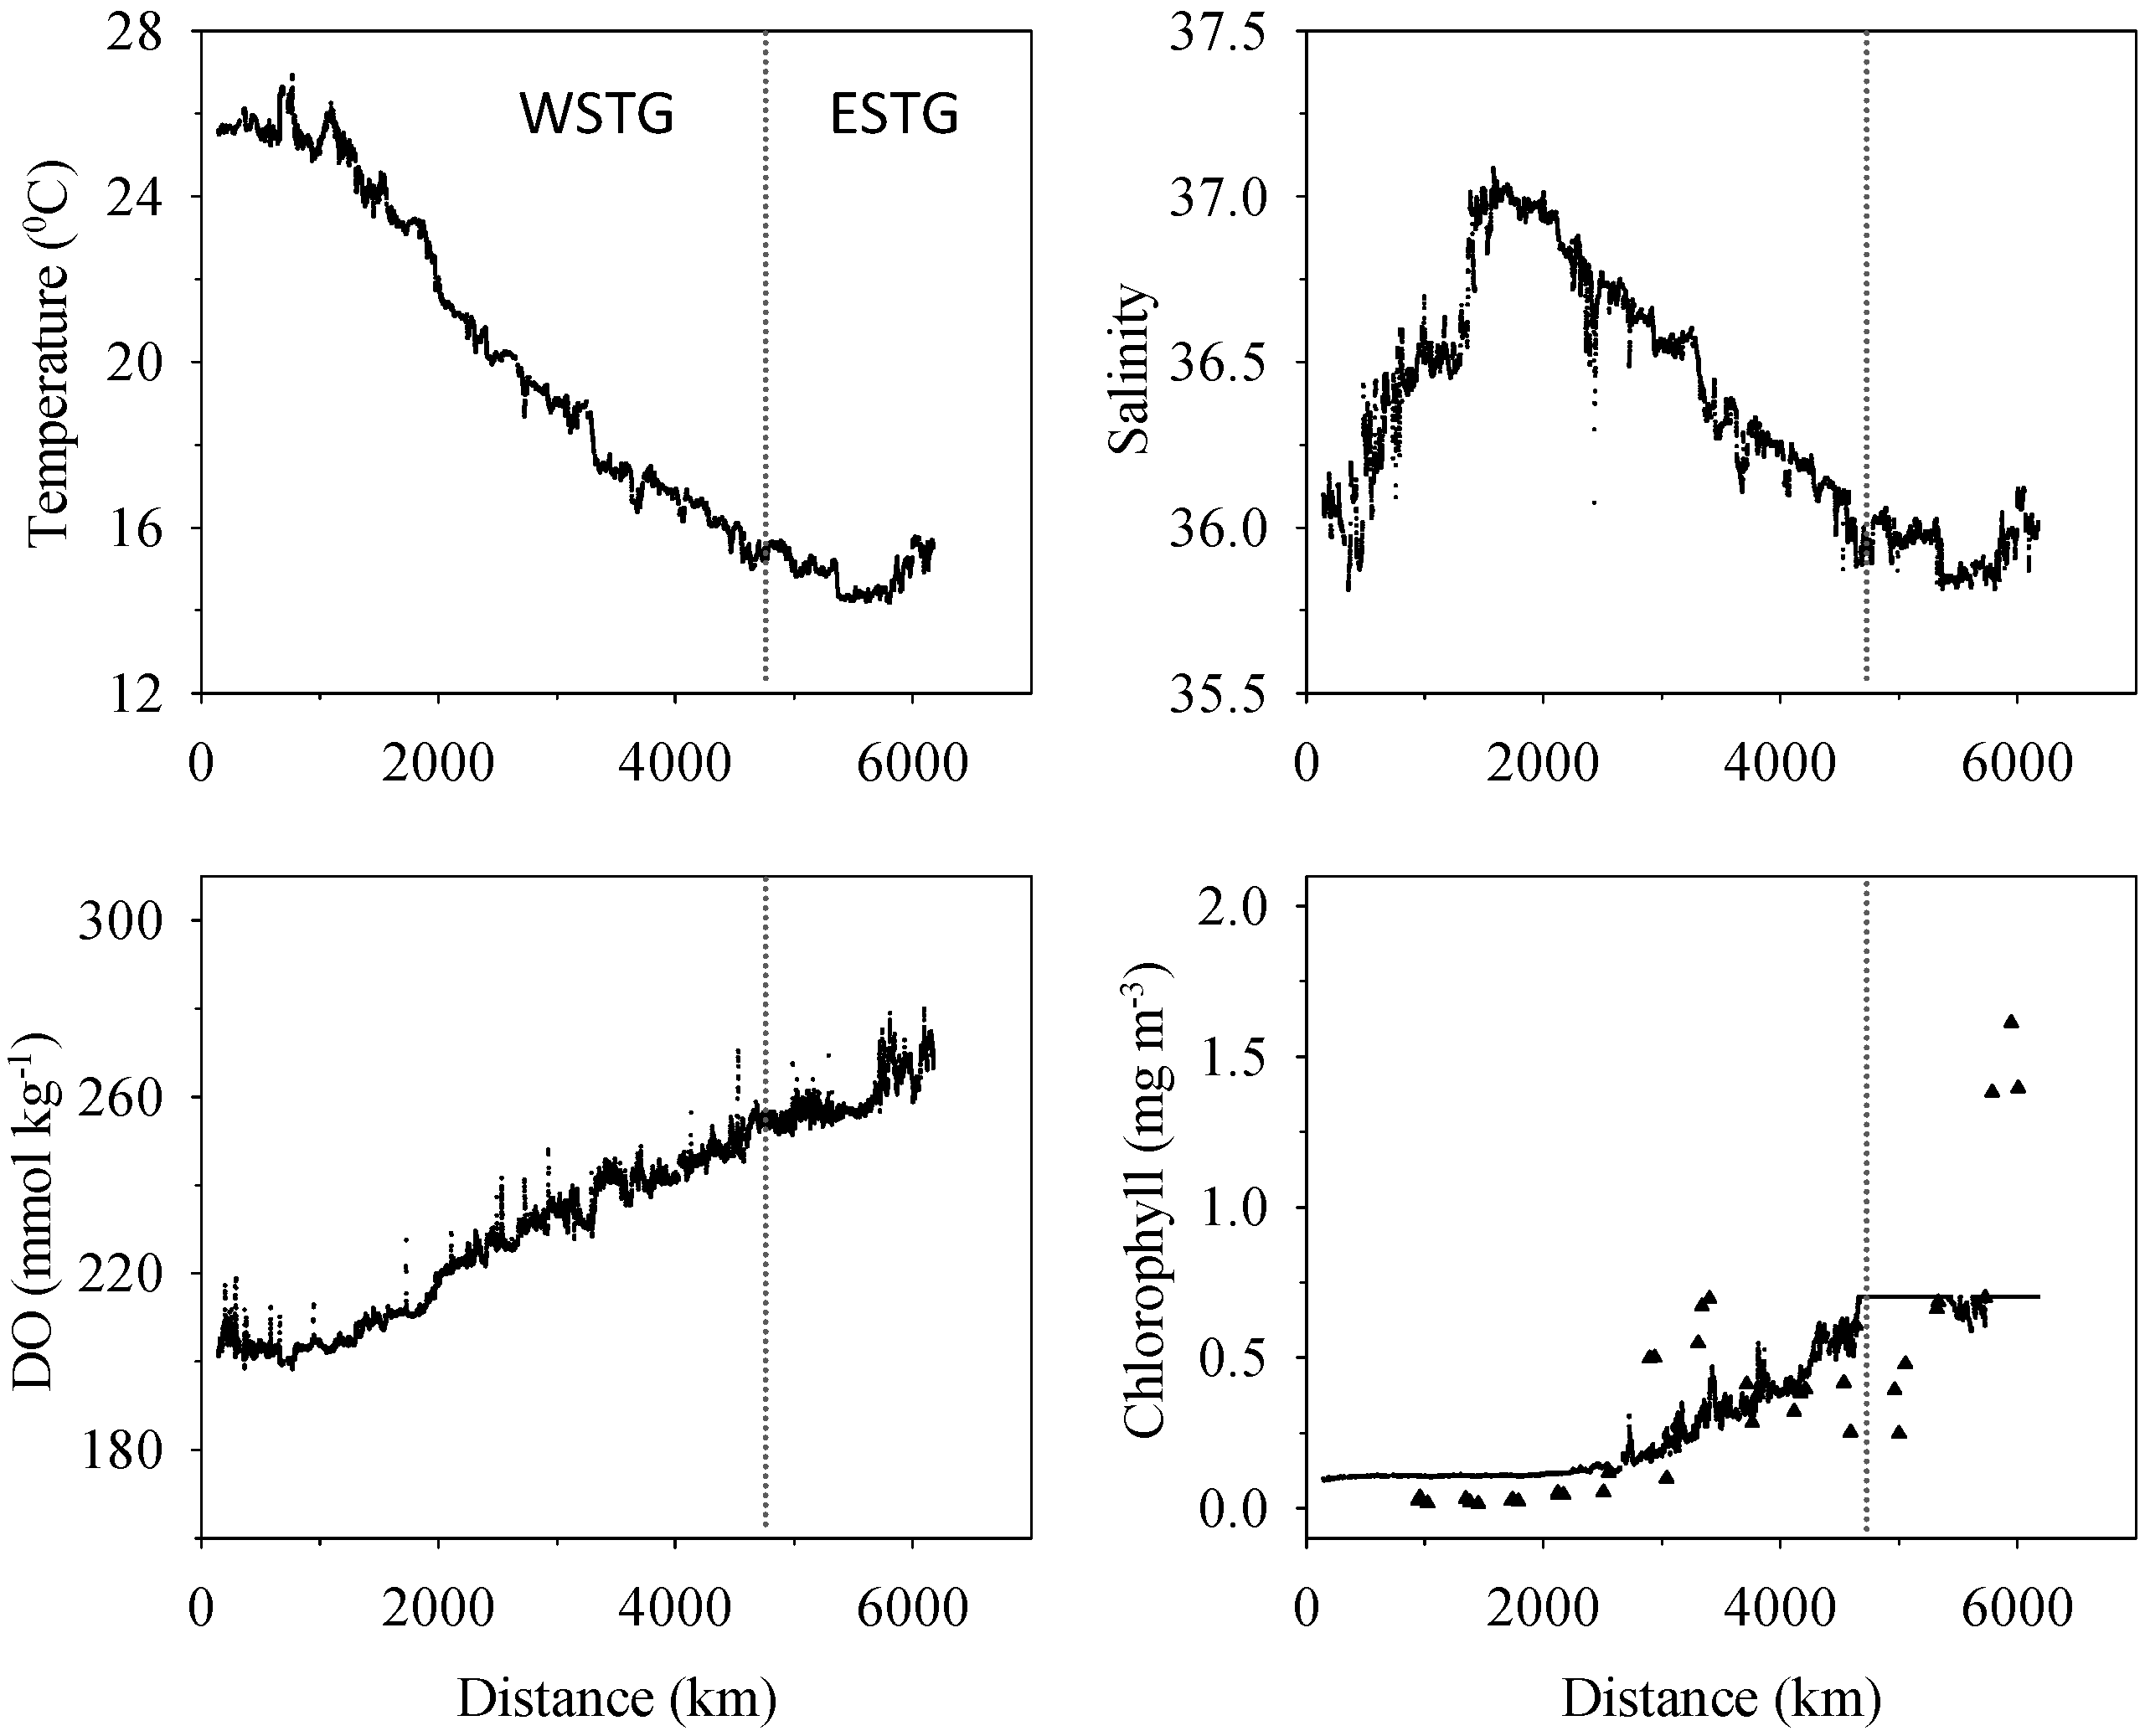
3.1. Biogeochemical Variables

Figure 2 shows sea surface evolution of temperature, salinity, DO and chlorophyll along the ship’s track. SST decreased from more than 25 °C in the Sargasso Sea, where stations are located in latitudes around 20° N, to near 14 °C at latitude 40° N. Salinity ranged between 36 and 37. DO increased from the western to the eastern part of the gyre, ranging between 197.9 and 279.6 μM.
Mixed layer chlorophyll (triangles, Figure 2) measured in discrete samples from the Sargasso Sea was below the detection limit of the fluorescence sensor (i.e., less than 0.05 mg m−3). The chlorophyll concentrations increased until near the Azores Islands in the ESTG, where the fluorescence sensor became saturated at chlorophyll concentrations above 0.7 mg m−3. Nevertheless, chlorophyll in the ESTG was measured in discrete samples, which show a mean concentration of 1.5 mg m−3.
Cross sections of temperature, salinity, nutrients and chlorophyll are plotted in Figure 3. Temperature and salinity values are consistent with those obtained in the surface waters. Both parameters show a typically stratified water column in the Sargasso Sea, while isolines were almost vertical in the eastern part of the gyre. NO3 and HPO42− were very low in the WSTG, with little variations in the first 200 m of the water column (range 0–2 μM and 0.1–0.2 μM for NO3 and HPO42−, respectively). Nutrient concentrations were higher in the ESTG below 50 m depth, reaching concentrations of 10 μM for NO3 and 0.5 μM for HPO42−. However, surface waters were depleted of both nutrients indicating nutrient consumption, and in good agreement with the chlorophyll values, which reached a maximum of 1.5 mg m−3 in the surface waters of the ESTG. Chlorophyll was very low at the other sampling stations.
Figure 2. Changes in sea surface temperature, salinity, dissolved oxygen (DO) and chlorophyll during the campaign. Triangles show the chlorophyll concentration in discrete samples. In each graph the dotted line demarcates the western and eastern parts of the subtropical gyre (WSTG and ESTG).
Jmse 03 00891 g002
Figure 3. Cross section of sea water temperature, salinity, nitrate (NO3), phosphate (HPO42−) and chlorophyll content, from CTD data in the upper 200 m of the water column. In each graph, the dotted line demarcates the western and eastern parts of the subtropical gyre (WSTG and ESTG).
Jmse 03 00891 g003aJmse 03 00891 g003b

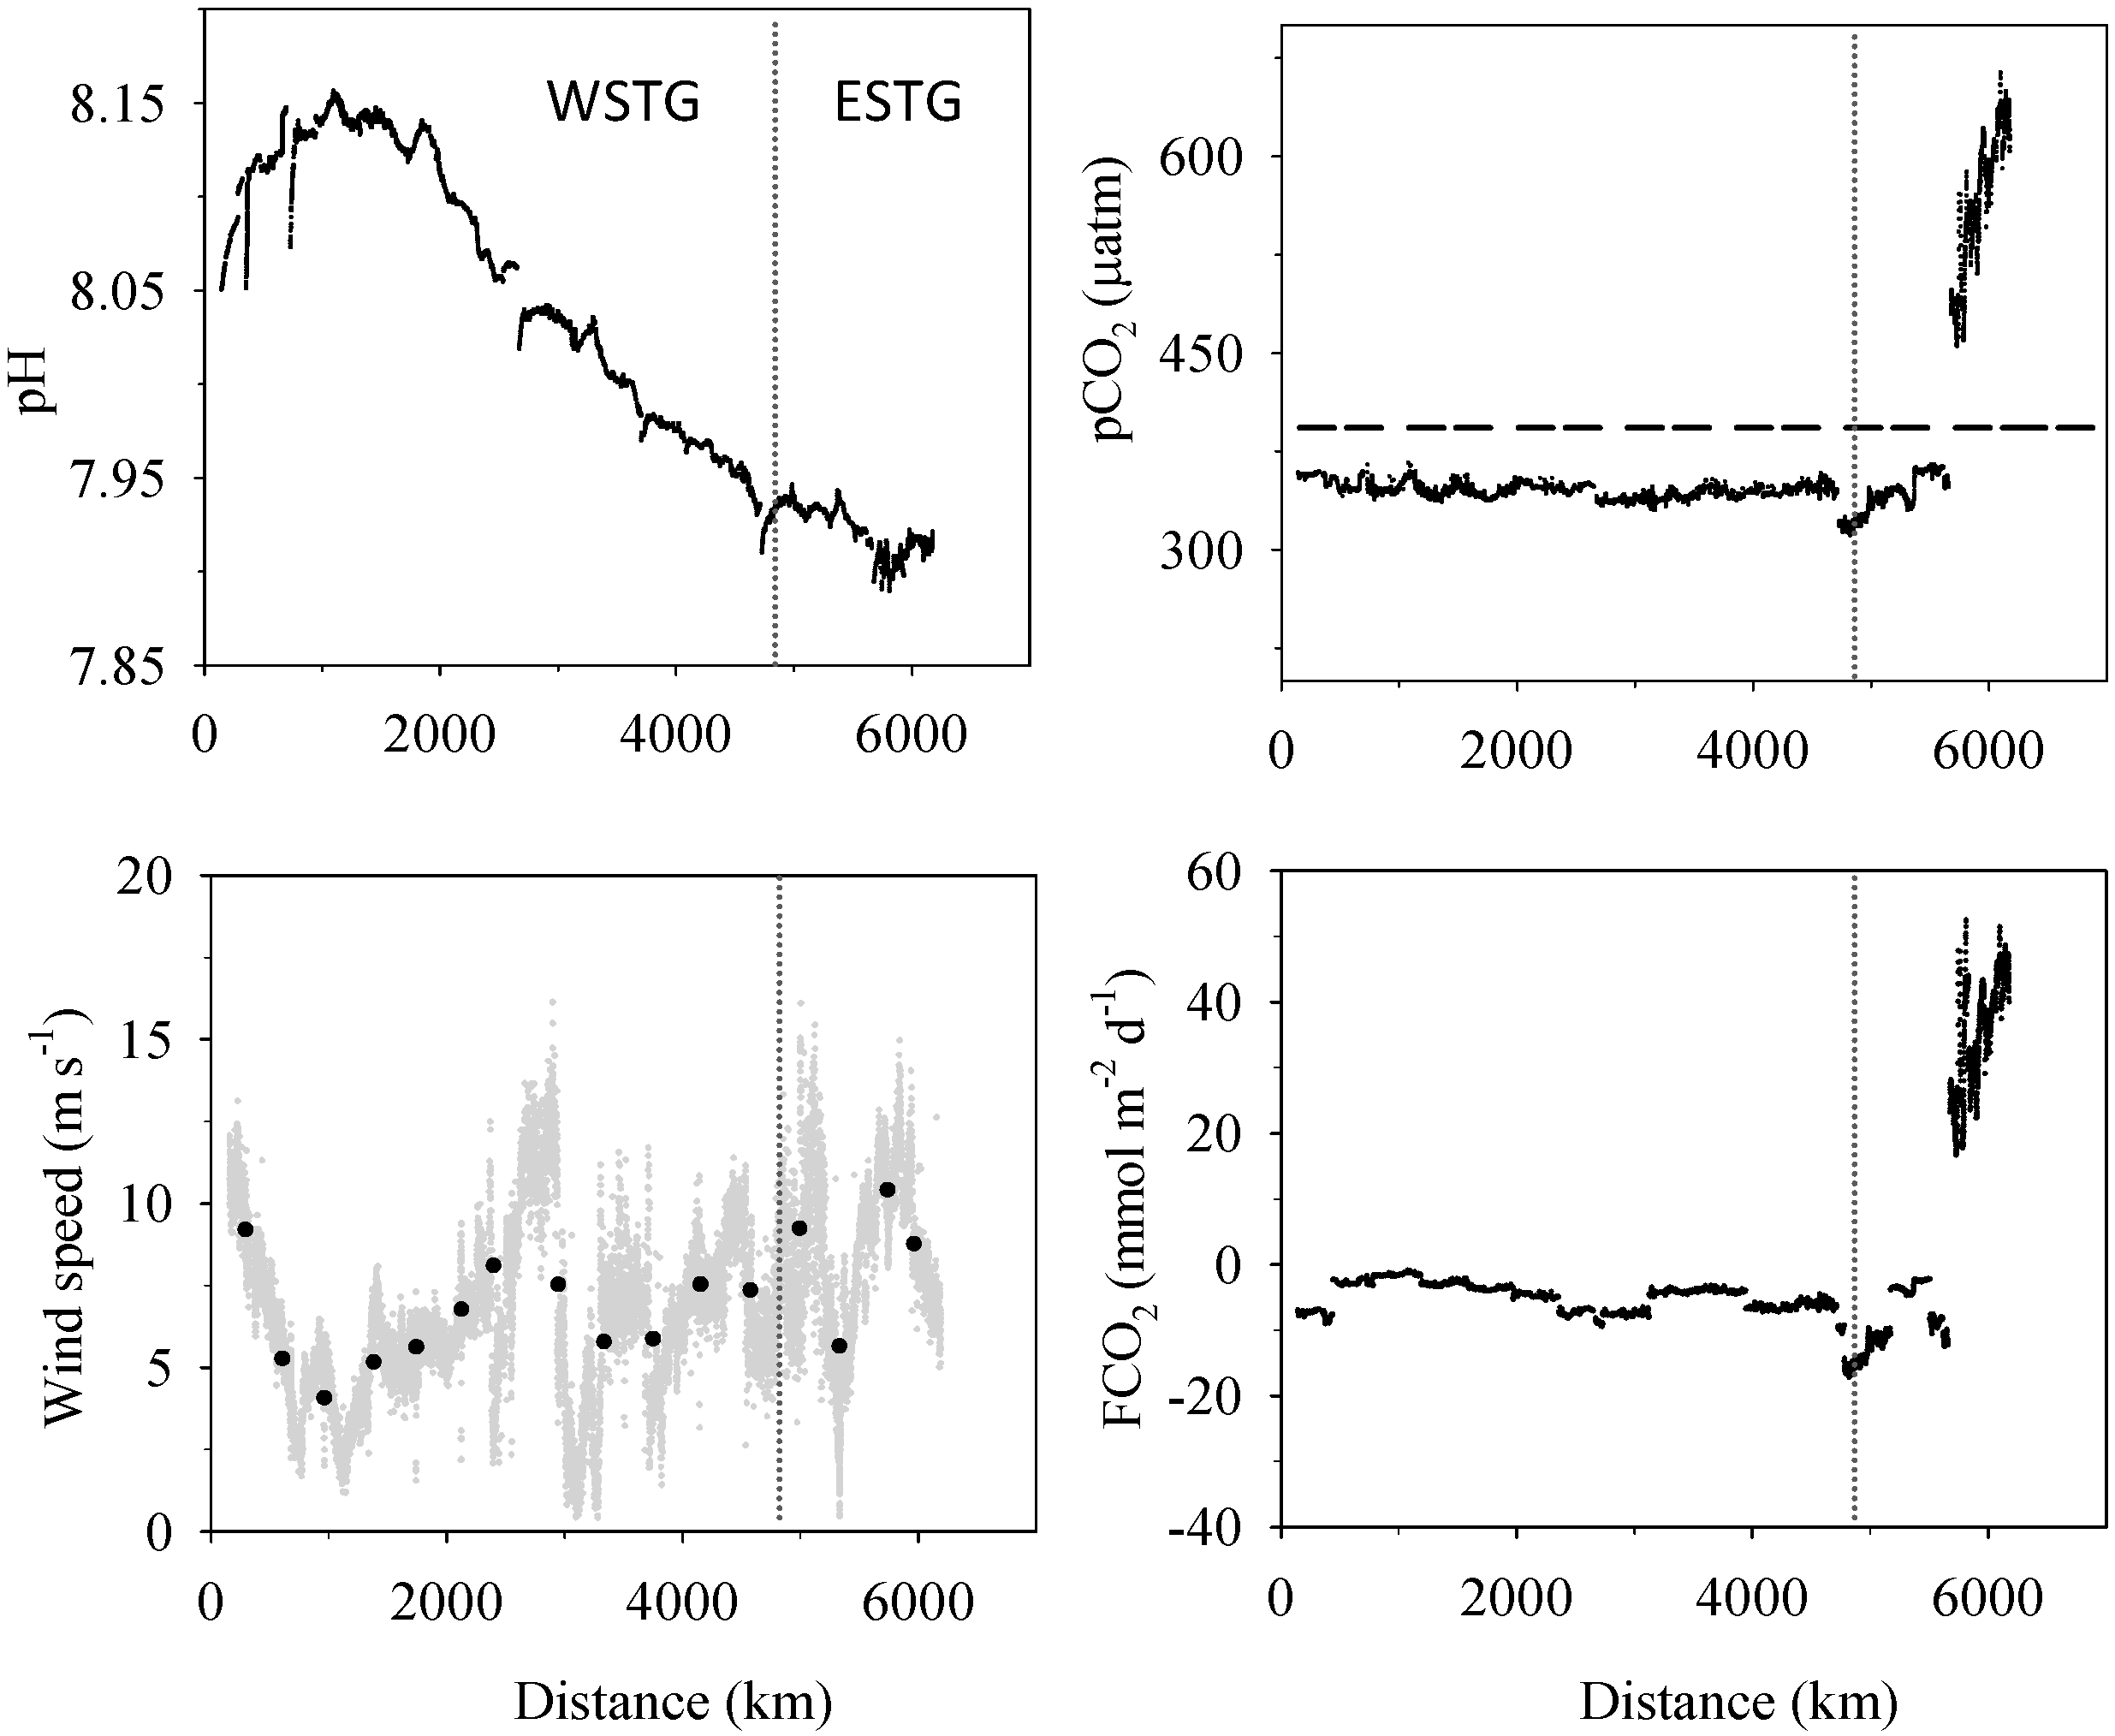
3.2. Inorganic Carbon System and Atmospheric Fluxes

Table 1 summarizes daily mean values of the experimental variables associated with the inorganic carbon system. In general terms, total alkalinity and pH were higher in the WSTG than in the ESTG, ranging between 2.48 to 2.36 and 8.12 to 7.92 mM, respectively. Surface pH distribution is also shown in Figure 4. In contrast, DIC was lower in the western part (although increasing from 1.93 mM in the Sargasso Sea to 2.16 mM near the Azores Islands) than in the ESTG, where values remained between 2.14 and 2.16 mM.
Figure 4. Changes in sea surface pCO2, sea-air CO2 flux, pH and wind speed with distance along then transect. The dashed horizontal line is the mean atmospheric pCO2 value during the campaign (396.5 μatm). Round dots indicate mean daily wind speed values (used for flux calculations). In each graph the dotted line demarcates the western and eastern parts of the subtropical gyre (WSTG and ESTG).
Jmse 03 00891 g004
Surface pCO2 was relatively constant at 343.0 ± 8.2 μatm, and was below the atmospheric value of 396.5 μatm, except at the eastern end of the transect where pCO2 increased to 661.8 μatm. As a result, the ocean-atmosphere pCO2 gradient (ΔpCO2) was negative and relatively constant (−50.1 ± 8.2 μatm), except for the last two stations, where ΔpCO2 changed to positive values, and reached an average of 197.9 μatm (Table 1). FCO2 and wind speed daily means are shown in Table 1 and continuous values are plotted in Figure 4. Wind speed was variable and daily mean values were used for CO2 flux calculations (ranging between 4.0 and 10.4 m s−1). Atmospheric fluxes were negative in the subtropical gyre (mean: −6.1 and range: −18.2 to −1.2 mmol m−2 day−1), and positive for the most eastern part of the survey (mean: 23.6 and range: 15.4 to 51.3 mmol m−2 day−1).

4. Discussion

Results show typical oligotrophic features in the western subtropical gyre (WSTG) (characterized by low nutrient and chlorophyll concentrations) and relatively constant sea surface pCO2 values. The eastern part of the gyre (ESTG) showed greater nutrient and chlorophyll concentrations and a heterogeneous pCO2 distribution. Biogeochemical processes in the North Atlantic subtropical gyre have been associated with the North Atlantic Oscillation (NAO) index through modelling [36]. The NAO index was positive for 2011 and the mixed layer depth is expected to be shallower in the subtropical than in the subpolar gyre [36]. Consequently, nutrients do not reach surface layers in the subtropical gyre, which is in good agreement with our results. When the NAO is positive, models predict an increase of pCO2 in surface layers, and hence a decrease in the ocean’s capacity for absorbing atmospheric CO2.
NO3 and chlorophyll concentrations show significant differences between the two basins (p < 0.001) and their respective processes governing sea surface pCO2: consequently sea-air fluxes are discussed separately for the two parts of the North Atlantic subtropical gyre.

4.1. Western North Atlantic Subtropical Gyre

This region spans stations 1 to 12 (19.3°–39.1° N, 66.9°–30.7° W), which are located west of the mid-Atlantic Ridge, and are oligotrophic waters. The N:P ratio in surface waters was 14.5, below the Redfield value [37], indicating that nitrogen is limiting primary production [38,39]. Surface waters were NO3 depleted down to a depth of 150 m, beyond which concentrations increased to 4.0 μM (Figure 3). This result agrees with observations at the BATS site [40]. Primary production in the WSTG is maintained by the input of new nutrients to the euphotic zone, which reach surface waters by diffusive and advective transport, with the occasional occurrence of eddies being the main physical process [40].
Surface pCO2 values in the WSTG were less than atmospheric values (Figure 2) and are within the range of previous springtime observations in the region (Table 2). Therefore, the WSTG was acting as an atmospheric sink, with a mean ocean-atmosphere flux of −5.5 ± 2.2 mmol m−2 day−1 during this springtime survey.
The averaged net flux into the ocean is greater than previously reported values, most likely due to higher wind speeds (Table 1). Mean DIC and pH in this region were 2.07 mM and 8.02 mM, respectively, which agree with values measured in recent years of the BATS time series data [41].
Table 2. Comparison of pCO2, sea surface temperature (SST) and CO2 fluxes (FCO2) between this work and other studies located in the North Atlantic subtropical gyre.
PeriodLocationpCO2 (μatm)SST (°C)FCO2 (mmol m−2 d−1)Reference
1988–1998BATS site350 ± 50--Bates (2001) [12]
1994–1995Atl 20°–50° N330 ± 20-−2.7 ± 4.1Schuster & Watson (2007) [7]
1984–2000BATS site350 ± 50-−0.7 ± 2.0Gruber et al., (2002) [13]
2002–2005Atl 20°–50° N370 ± 10-−1.2 ± 1.5Schuster & Watson (2007) [7]
2005UK-Caribbean--−1.8 ± 0.1Watson et al., (2009) [8]
Spring 1970–2006Atl 14°–50° N310 ± 30-−2.7 ± 2.7Takahashi et al., (2009) [6]
Spring 2004–2006Atl 14°–50° N340 ± 4014.5 ± 14.4-Telszwski et al., (2009) [42]
Spring 2000–2008Atl 27°–39° N-18.6 ± 0.9−4.9 ± 3.3Padín et al., (2010) [43]
Spring 2011SGTW343 ± 819.8 ± 4.1−5.5 ± 2.2This work

4.2. Eastern North Atlantic Subtropical Gyre

The four last stations of this campaign are in this region east of the mid-Atlantic Ridge (40.3°–41.6° N, 25.6°–14.7° W). NO3 and chlorophyll distributions in the first 200 m depth are similar to those found by Boye et al. [44] during spring in the same region (40°–42° N, 17°–23° W). The results show this area to be autotrophic, in good agreement with previous studies in the ESTG [45,46].
Daily mean values of the net air-sea CO2 fluxes for the ESTG increased eastward from −18.2 up to 45.7 mmol m−2 day−1 (Table 1). The large spatial differences between the air-sea flux values are mainly controlled by the distribution of pCO2 at the sea surface, which increased from 329.5 up to 591.0 μatm. Most likely, the processes controlling the surface pCO2 distribution are the increased chlorophyll, which increased by a factor of 4, and the upwelling of deeper waters.
Surface pCO2 values between stations 13 and 14 on the eastern edge of the gyre near the Azores Islands (Table 1) are at the upper limit of the range found by Davila et al. [45] in the eastern North Atlantic Ocean (39°–45° N, 16°–21° W). The authors found that pCO2 decreased north-south from 342 to 310 μatm, the DIC concentration averaged 2.10 mM and the CO2 flux ranged between −1 and −16 mmol m−2 day−1, which agrees with our CO2 flux range. The average CO2 flux estimated from Davila et al. [45] was −6.7 mmol m−2 day−1, which is slightly lower than our mean of −9.3 mmol m−2 day−1, due to differences in the wind speed and the ΔpCO2. They related the negative CO2 fluxes to primary production events that, in turn, were associated with the presence of fronts.
From April to October, winds induce upwelling onto the continental shelf of nutrient-rich subpolar Eastern North Atlantic Water (ENAW), with a cycle of upwelling and relaxation characterized by a period of 14 (±4) days [47]. The highest chlorophyll level was found near stations 15 and 16 (Figure 4); this coincided with high surface pCO2, which was 118 μatm, on average, and greater than the atmospheric value, which may be attributed to the upwelling of CO2 and nutrient-rich deeper waters. The density contour in Figure 5 shows well-mixed waters in the first 200 m. The region off the Galician coast is close to the North Atlantic Iberian upwelling, which is seasonally dependent on the displacement of the Azores anticyclone [48]. The upwelling index (Iw), which gives an estimation of the upwelled water flow per kilometre of coast, has been computed following Cobo-Viveros et al. [49] for stations 15 and 16. The Iw was determined using the wind speed at those stations, the Coriolis parameter, and the wind speed component parallel to the coast. Positive (negative) values of Iw correspond to upwelling (downwelling) conditions. An averaged Iw for the previous fortnight (Iw’) was used as the upwelling indicator [49] and Iw’ values of 98.2 and 96.52 m3 km−1 s−1 for stations 15 and 16, respectively, indicate upwelling conditions for the region. Preformed nutrients present in surface waters (Figure 5) are additional evidence of upwelling, since they are transported from deeper waters [50]. Negative AOU values in the surface layer are consistent with O2 production from photosynthesis, while positive values in the subsurface layers show organic matter degradation (Figure 5). Weekly composites of colour satellite images show the wind-induced upwelling that may be a regional-scale process over the chlorophyll distribution.
Figure 5. Cross section of sea water density (ρ), apparent oxygen utilization (AOU), preformed nitrate (NO3 pref.) and preformed phosphate (PO4 pref.) in the upper 200 m of the water column. In each graph the dotted line demarcates the western and eastern parts of the subtropical gyre (WSTG and ESTG).
Jmse 03 00891 g005
High pCO2 in surface waters due to the upwelling of CO2-rich waters has been determined in previous observations [5,6,51,52] and in simulations [36,53]. Borges and Frankignoulle [5] found a surface pCO2 range between 265 and 415 μatm in the upwelling system off the Galician coast during the upwelling season. Perez et al. [51] showed values up to 430 μatm in the same area, whereas values even higher than our maximum pCO2 of 660 μatm have been reported in other upwelling systems; for instance, 800 μatm has been measured in upwelled waters off the coast of Oregon [52].
Kötzinger et al. [54] identify an early bloom situation when chlorophyll and NO3 concentrations are within the interval 0.3–1.6 mg m−3 and 2.6–4.6 μM, respectively; those ranges are similar to our findings. Therefore, it is reasonable to assume that we sampled during the early bloom when surface pCO2 values and nutrient concentrations were still high. When the bloom is well-developed, chlorophyll increases in surface waters to between 1.6 and 3.4 mg m−3, and nutrient depletions have been described previously [54]. Stratification takes place in the North Atlantic Iberian upwelling region during April [49], and nutrients brought to the surface waters by the upwelling help to support a seasonal phytoplankton bloom in the euphotic layer [55].

5. Conclusions

The North Atlantic subtropical gyre was an atmospheric CO2 sink during this spring 2011 campaign, with a mean flux of −5.5 ± 2.2 mmol m−2 day−1. In contrast, the eastern limit of the gyre, close to the North Atlantic Iberian upwelling off the Galician coast, was a CO2 source of up to 33.5 ± 9.0 mmol m−2 day−1. The main factor governing the ocean-atmosphere CO2 exchange is the sea surface pCO2 distribution, which in turns depends on the physical and biological processes in the water column. Surface pCO2 was fairly constant, at 343.0 ± 8.2 μatm, in the oligotrophic gyre, where surface waters were depleted in nutrients, and chlorophyll was very low due to water column stratification. In contrast, CO2-rich upwelled waters resulted in high pCO2 values in surface waters to the east: 514.0 ± 97.9 μatm. Nutrient and chlorophyll concentrations suggest early bloom conditions in this region; therefore the phytoplankton was not growing enough to reduce surface CO2 and consume all nutrients. Data presented here is for a single transect and highlights the significance of the region east of the Azores Islands as a relatively high biomass and source region for atmospheric CO2.

Acknowledgments

The authors would like to thank those responsible for the two projects Proyecto Buque Escuela de Oceanografía 2011 (Research Project CTM 2009-08399-E/MAR) and the Malaspina Circumnavigation Expedition 2010 (Research Project Consolider-Ingenio, CSD 2008-00077), both funded by the Spanish Government. Their collaboration made this study possible. The authors would also like to thank J. Gómez-Enri and G. Navarro for their help with the satellite images.

Author Contributions

All authors have contributed to the manuscript structure and discussion of the results. Nevertheless, each author has worked on a specific part of this paper, which is detailed in the following.
Measurements related to the inorganic carbon system and CO2 flux calculations were done by Macarena Burgos. She is also the corresponding author so she wrote this manuscript. Marta Sendra sampled and measured all biogeochemical parameters. Teodora Ortega and Rocio Ponce worked on the results, calculated derived parameters, and they were the supervisors of this work. Abelardo Gomez-Parra and Jesus M. Forja planned the campaign; Jesus M. Forja was the scientific head of the cruise. They also supervised the measurements being made on board the ship.

Conflicts of Interest

The authors declare no conflict of interest.

References

  1. Behrenfeld, M.J.; O’Malley, R.T.; Siegel, D.A.; McClain, C.R.; Sarmiento, J.L.; Feldman, G.C.; Milligan, A.J.; Falkowski, P.G.; Letelier, R.M.; Boss, E.S. Climate-driven trends in contemporary ocean productivity. Nature 2006, 444, 752–755. [Google Scholar] [CrossRef] [PubMed]
  2. Schuster, U.; Watson, A.J.; Bates, N.R.; Corbiere, A.; Gonzalez-Davila, M.; Metzl, N.; Pierrot, D.; Santana-Casiano, M. Trends in North Atlantic sea-surface fCO2 from 1990 to 2006. Deep Sea Res. II Top. Stud. Oceanogr. 2009, 56, 620–629. [Google Scholar] [CrossRef]
  3. Körtzinger, A.; Send, U.; Lampitt, R.S.; Hartman, S.; Wallace, D.W.R.; Karstensen, J.; Llinás, O.; Villagarcia, M.G.; DeGrandpre, M.D. The seasonal pCO2 cycle at 49° N/16.5° W in the northeastern Atlantic Ocean and what it tells us about biological productivity. J. Geophys. Res. Oceans 2008, 113, 1–15. [Google Scholar] [CrossRef]
  4. Benson, N.U.; Osibanjo, O.O.; Asuquo, F.E.; Anake, W.U. Observed trends of pCO2 and air-sea CO2 fluxes in the North Atlantic Ocean. Int. J. Mar. Sci. 2014, 4, 1–7. [Google Scholar]
  5. Borges, A.V.; Frankignoulle, M. Distribution of surface carbon dioxide and air-sea exchange in the upwelling system off the Galician coast. Glob. Biogeochem. Cycles 2002, 16, 13-1–13-13. [Google Scholar] [CrossRef]
  6. Takahashi, T.; Sutherland, S.C.; Wanninkhof, R.; Sweeney, C.; Feely, R.A.; Chipman, D.W.; Hales, B.; Friederich, G.; Chavez, F.; Sabine, C.; et al. Climatological mean and decadal change in surface ocean pCO2, and net sea-air CO2 flux over the global oceans. Deep Sea Res. II Top. Stud. Oceanogr. 2009, 56, 554–577. [Google Scholar] [CrossRef] [Green Version]
  7. Schuster, U.; Watson, A.J. A variable and decreasing sink for atmospheric CO 2 in the North Atlantic. J. Geophys. Res. 2007, 112, C11006. [Google Scholar] [CrossRef]
  8. Watson, A.J.; Schuster, U.; Bakker, D.C.E.; Bates, N.R.; Corbière, A.; González-Dávila, M.; Friedrich, T.; Hauck, J.; Heinze, C.; Johannessen, T.; et al. Tracking the variable North Atlantic sink for atmospheric CO2. Science 2009, 326, 1391–1393. [Google Scholar] [CrossRef] [PubMed]
  9. Le Quéré, C.; Takahashi, T.; Buitenhuis, E.T.; Rödenbeck, C.; Sutherland, S.C. Impact of climate change and variability on the global oceanic sink of CO2. Glob. Biogeochem. Cycles 2010, 24. [Google Scholar] [CrossRef]
  10. Bates, N.R. Multi-decadal uptake of carbon dioxide into subtropical mode water of the North Atlantic Ocean. Biogeosciences 2012, 9, 2649–2659. [Google Scholar] [CrossRef]
  11. Santana-Casiano, J.M.; González-Dávila, M.; Rueda, M.J.; Llinás, O.; González-Dávila, E.F. The interannual variability of oceanic CO2 parameters in the northeast Atlantic subtropical gyre at the ESTOC site. Glob. Biogeochem. Cycles 2007, 21, 1–16. [Google Scholar] [CrossRef]
  12. Bates, N.R. Interannual variability of oceanic CO2 and biogeochemical properties in the Western North Atlantic subtropical gyre. Deep Sea Res. II Top. Stud. Oceanogr. 2001, 48, 1507–1528. [Google Scholar] [CrossRef]
  13. Gruber, N.; Keeling, C.D.; Bates, N.R. Interannual variability in the North Atlantic Ocean carbon sink. Science 2002, 298, 2374–2378. [Google Scholar] [CrossRef] [PubMed]
  14. Savidge, G.; Turner, D.R.; Burkill, P.H.; Watson, A.J.; Angel, M.V.; Pingree, R.D.; Leach, H.; Richards, K.J. The BOFS 1990 spring bloom experiment: Temporal evolution and spatial variability of the hydrographic field. Prog. Oceanogr. 1992, 29, 235–281. [Google Scholar] [CrossRef]
  15. Ducklow, H.W.; Harris, R.P. Introduction to the JGOFS North Atlantic bloom experiment. Deep Sea Res. II Top. Stud. Oceanogr. 1993, 40, 1–8. [Google Scholar] [CrossRef]
  16. Boyd, P.W.; Pomroy, A.; Bury, S.; Savidge, G.; Joint, I. Micro-algal carbon and nitrogen uptake in post-coccolithophore blooms in the northeast Atlantic, July 1991. Deep Sea Res. I Oceanogr. Res. Pap. 1997, 44, 1497–1517. [Google Scholar] [CrossRef]
  17. Koeve, W. C:N stoichiometry of the biological pump in the North Atlantic: Constraints from climatological data. Glob. Biogeochem. Cycles 2006, 20. [Google Scholar] [CrossRef]
  18. González-Dávila, M.; Santana-Casiano, J.M.; Rueda, M.J.; Llinás, O. The water column distribution of carbonate system variables at the ESTOC site from 1995 to 2004. Biogeosciences 2010, 7, 3067–3081. [Google Scholar] [CrossRef]
  19. McKinley, G.A.; Fay, A.R.; Takahashi, T.; Metzl, N. Convergence of atmospheric and North Atlantic carbon dioxide trends on multidecadal timescales. Nat. Geosci. 2011, 4, 606–610. [Google Scholar] [CrossRef]
  20. Andersson, A.J.; Krug, L.A.; Bates, N.R.; Doney, S.C. Sea-air CO2 flux in the North Atlantic subtropical gyre: Role and influence of Sub-Tropical Mode Water formation. Deep Sea Res. II Top. Stud. Oceanogr. 2013, 91, 57–70. [Google Scholar] [CrossRef]
  21. Sathyendranath, S.; Longhurst, A.; Caverhill, C.M.; Platt, T. Regionally and seasonally differntiated primary production in the North Atlantic. Deep Res. 1995, 42, 1773–1802. [Google Scholar] [CrossRef]
  22. Longhurst, A.; Sathyendranath, S.; Platt, T.; Caverhill, C. An estimate of global primary production in the ocean from satellite radiometer data. J. Plankton Res. 1995, 17, 1245–1271. [Google Scholar] [CrossRef]
  23. Marañón, E. Phytoplankton growth rates in the Atlantic subtropical gyres. Limnol. Oceanogr. 2005, 50, 299–310. [Google Scholar] [CrossRef]
  24. Pierrot, D.; Neill, C.; Sullivan, K.; Castle, R.; Wanninkhof, R.; Lüger, H.; Johannessen, T.; Olsen, A.; Feely, R.A.; Cosca, C.E. Recommendations for autonomous underway pCO2 measuring systems and data-reduction routines. Deep. Res. II Top. Stud. Oceanogr. 2009, 56, 512–522. [Google Scholar] [CrossRef]
  25. Dickson, A.G.; Sabine, C.L.; Christian, J.R. Guide to Best Practices for Ocean CO2 Measurements; North Pacific Marine Science Organization: Sidney, BC, Canada, 2007; Volume 3, p. 191. [Google Scholar]
  26. Millero, F.J. Seawater as A Multicomponent Electrolyte Solution; DTIC: Fort Belvoir, VA, USA, 1974. [Google Scholar]
  27. Takahashi, T.; Olafsson, J.; Goddard, J.G.; Chipman, D.W.; Sutherland, S.C. Seasonal variation of CO2 and nutrients in the high-latitude surface oceans: A comparative study. Glob. Biogeochem. Cycles 1993, 7, 843–878. [Google Scholar] [CrossRef]
  28. Grasshoff, K.; Ehrhardt, M. Automated chemical analysis. In Methods of Seawater Analysis; Springer-Verlag: Berlin, Germany, 1983; pp. 263–289. [Google Scholar]
  29. Weiss, R.F. The solubility of nitrogen, oxygen and argon in water and seawater. Deep Sea Res. Oceanogr. Abstr. 1970, 17, 721–735. [Google Scholar] [CrossRef]
  30. Clayton, T.D.; Byrne, R.H. Spectrophotometric seawater pH measurements: Total hydrogen results. Deep Sea Res. I Oceanogr. Res. Pap. 1993, 40, 2115–2129. [Google Scholar] [CrossRef]
  31. Perez, F.F.; Fraga, F. A precise and rapid analytical procedure for alkalinity determination. Mar. Chem. 1987, 21, 169–182. [Google Scholar] [CrossRef] [Green Version]
  32. Lueker, T.J.; Dickson, A.G.; Keeling, C.D. Ocean pCO2 calculated from dissolved inorganic carbon. Mar. Chem. 2000, 70, 105–119. [Google Scholar] [CrossRef]
  33. Weiss, R.F. Carbon dioxide in water and seawater: The solubility of a non-ideal gas. Mar. Chem. 1974, 2, 203–215. [Google Scholar] [CrossRef]
  34. Wanninkhof, R. Relationship between wind speed and gas exchange over the ocean. J. Geophys. Res. Ocean. 1992, 97, 7373–7382. [Google Scholar] [CrossRef]
  35. NOAA-ESRL Global Monitoring Division Station. Available online: http://www.macehead.org (accessed on 19 May 2015).
  36. Keller, K.M.; Joos, F.; Raible, C.C.; Cocco, V.; Frölicher, T.L.; Dunne, J.P.; Gehlen, M.; Bopp, L.; Orr, J.C.; Tjiputra, J.; et al. Variability of the ocean carbon cycle in response to the North Atlantic Oscillation. Tellus B 2012, 1, 1–25. [Google Scholar] [CrossRef]
  37. Redfield, A.C.; Ketchum, B.K.; Richards, F.R. The Influence of Organism on the Composition of Sea-Water. The Composition of Seawater. Comparative and Descriptive Oceanography. The Sea: Ideas and Observations on Progress in the Study of the Seas; Interscience Publishers: New York, NY, USA, 1963. [Google Scholar]
  38. Menzel, D.W.; Ryther, J.H. Nutrients limiting the production of phytoplankton in the Sargasso Sea, with special reference to iron. Deep Sea Res. 1961, 7, 276–281. [Google Scholar] [CrossRef]
  39. Sowell, S.M.; Wilhelm, L.J.; Norbeck, A.D.; Lipton, M.S.; Nicora, C.D.; Barofsky, D.F.; Carlson, C.A.; Smith, R.D.; Giovanonni, S.J. Transport functions dominate the SAR11 metaproteome at low-nutrient extremes in the Sargasso Sea. ISME J. 2008, 3, 93–105. [Google Scholar] [CrossRef] [PubMed]
  40. Cianca, A.; Helmke, P.; Mouriño, B.; Rueda, M.J.; Llinás, O.; Neuer, S. Decadal analysis of hydrography and in situ nutrient budgets in the western and eastern North Atlantic subtropical gyre. J. Geophys. Res. Ocean. 2007, 112, 1–18. [Google Scholar] [CrossRef]
  41. Bates, N.R.; Best, M.H.P.; Neely, K.; Garley, R.; Dickson, A.G.; Johnson, R.J. Detecting anthropogenic carbon dioxide uptake and ocean acidification in the North Atlantic Ocean. Biogeosciences 2012, 9, 2509–2522. [Google Scholar] [CrossRef]
  42. Telszewski, M.; Chazottes, A.; Schuster, U.; Watson, A.J.; Moulin, C.; Bakker, D.C.E.; González-Dávila, M.; Johannessen, T.; Krtzinger, A.; Lüger, H.; et al. Estimating the monthly pCO2 distribution in the North Atlantic using a self-organizing neural network. Biogeosciences 2009, 6, 1405–1421. [Google Scholar] [CrossRef] [Green Version]
  43. Padin, X.A.; Vázquez-Rodríguez, M.; Castaño, M.; Velo, A.; Alonso-Pérez, F.; Gago, J.; Gilcoto, M.; Álvarez, M.; Pardo, P.C.; de la Paz, M.; et al. Air-Sea CO2 fluxes in the Atlantic as measured during boreal spring and autumn. Biogeosciences 2010, 7, 1587–1606. [Google Scholar] [CrossRef]
  44. Boye, M.; Aldrich, A.; van den Berg, C.M.G.; de Jong, J.T.M.; Nirmaier, H.; Veldhuis, M.; Timmermans, K.R.; de Baar, H.J.W. The chemical speciation of iron in the north-east Atlantic Ocean. Deep Sea Res. I Oceanogr. Res. Pap. 2006, 53, 667–683. [Google Scholar] [CrossRef]
  45. González Dávila, M.; Santana-Casiano, J.M.; Merlivat, L.; Barbero-Muñoz, L.; Dafner, E.V. Fluxes of CO2 between the atmosphere and the ocean during the POMME project in the northeast Atlantic Ocean during 2001. J. Geophys. Res. C Ocean. 2005, 110, 1–14. [Google Scholar] [CrossRef]
  46. Kähler, P.; Oschlies, A.; Dietze, H.; Koeve, W. Oxygen, carbon, and nutrients in the oligotrophic eastern subtropical North Atlantic. Biogeosciences 2010, 7, 1143–1156. [Google Scholar] [CrossRef] [Green Version]
  47. Alvarez-Salgado, X.A.; Rosón, G.; Pérez, F.F.; Pazos, Y. Hydrographic variability off the Rías Baixas (NW Spain) during the upwelling season. J. Geophys. Res. Ocean. 1993, 98, 14447–14455. [Google Scholar] [CrossRef]
  48. Álvarez-Salgado, X.A.; Nieto-Cid, M.; Gago, J.; Brea, S.; Castro, C.G.; Doval, M.D.; Pérez, F.F. Stoichiometry of the degradation of dissolved and particulate biogenic organic matter in the NW Iberian upwelling. J. Geophys. Res. 2006, 111, C07017. [Google Scholar] [CrossRef]
  49. Cobo-Viveros, A.M.; Antonio Padin, X.; Otero, P.; de la Paz, M.; Ruiz-Villarreal, M.; Ríos, A.F.; Pérez, F.F. Short-term variability of surface carbon dioxide and sea-air CO2 fluxes in the shelf waters of the Galician coastal upwelling system. Sci. Mar. 2013, 77, 37–48. [Google Scholar] [CrossRef]
  50. Hales, B.; Takahashi, T.; Bandstra, L. Atmospheric CO2 uptake by a coastal upwelling system. Glob. Biogeochem. Cycles 2005, 19, 1–11. [Google Scholar] [CrossRef]
  51. Pérez, F.F.; Castro, C.G.; Ríos, A.F.; Fraga, F. Chemical properties of the deep winter mixed layer in the Northeast Atlantic (40°–47° N). J. Mar. Syst. 2005, 54, 115–125. [Google Scholar] [CrossRef]
  52. Harris, K.E.; Degrandpre, M.D.; Hales, B.R. Continuous Time-Series of Carbonate System Dynamics in the Coastal Oregon Upwelling System. In Proceeding of the 2010 AGU Fall Meeting, San Francisco, CA, USA, 2010; Volume 1, p. 1568.
  53. Mahadevan, A.; Lévy, M.; Mémery, L. Mesoscale variability of sea surface pCO2: What does it respond to? Glob. Biogeochem. Cycles 2004, 18, 127–142. [Google Scholar] [CrossRef]
  54. Körtzinger, A.; Koeve, W.; Kähler, P.; Mintrop, L. C :N ratios in the mixed layer during the productive season in the northeast Atlantic Ocean. Deep. Res. I Oceanogr. Res. Pap. 2001, 48, 661–688. [Google Scholar] [CrossRef]
  55. Backhaus, J.O.; Wehde, H.; Hegseth, E.N.; Kämpf, J. “Phyto-convection”: The role of oceanic convection in primary production. Mar. Ecol. Prog. Ser. 1999, 189, 77–92. [Google Scholar] [CrossRef]

