
The Dynamics, Ecological Variability and Estimated Carbon Stocks of Mangroves in Mahajamba Bay, Madagascar


 ,
,
Abstract
:1. Introduction
2. Experimental Section
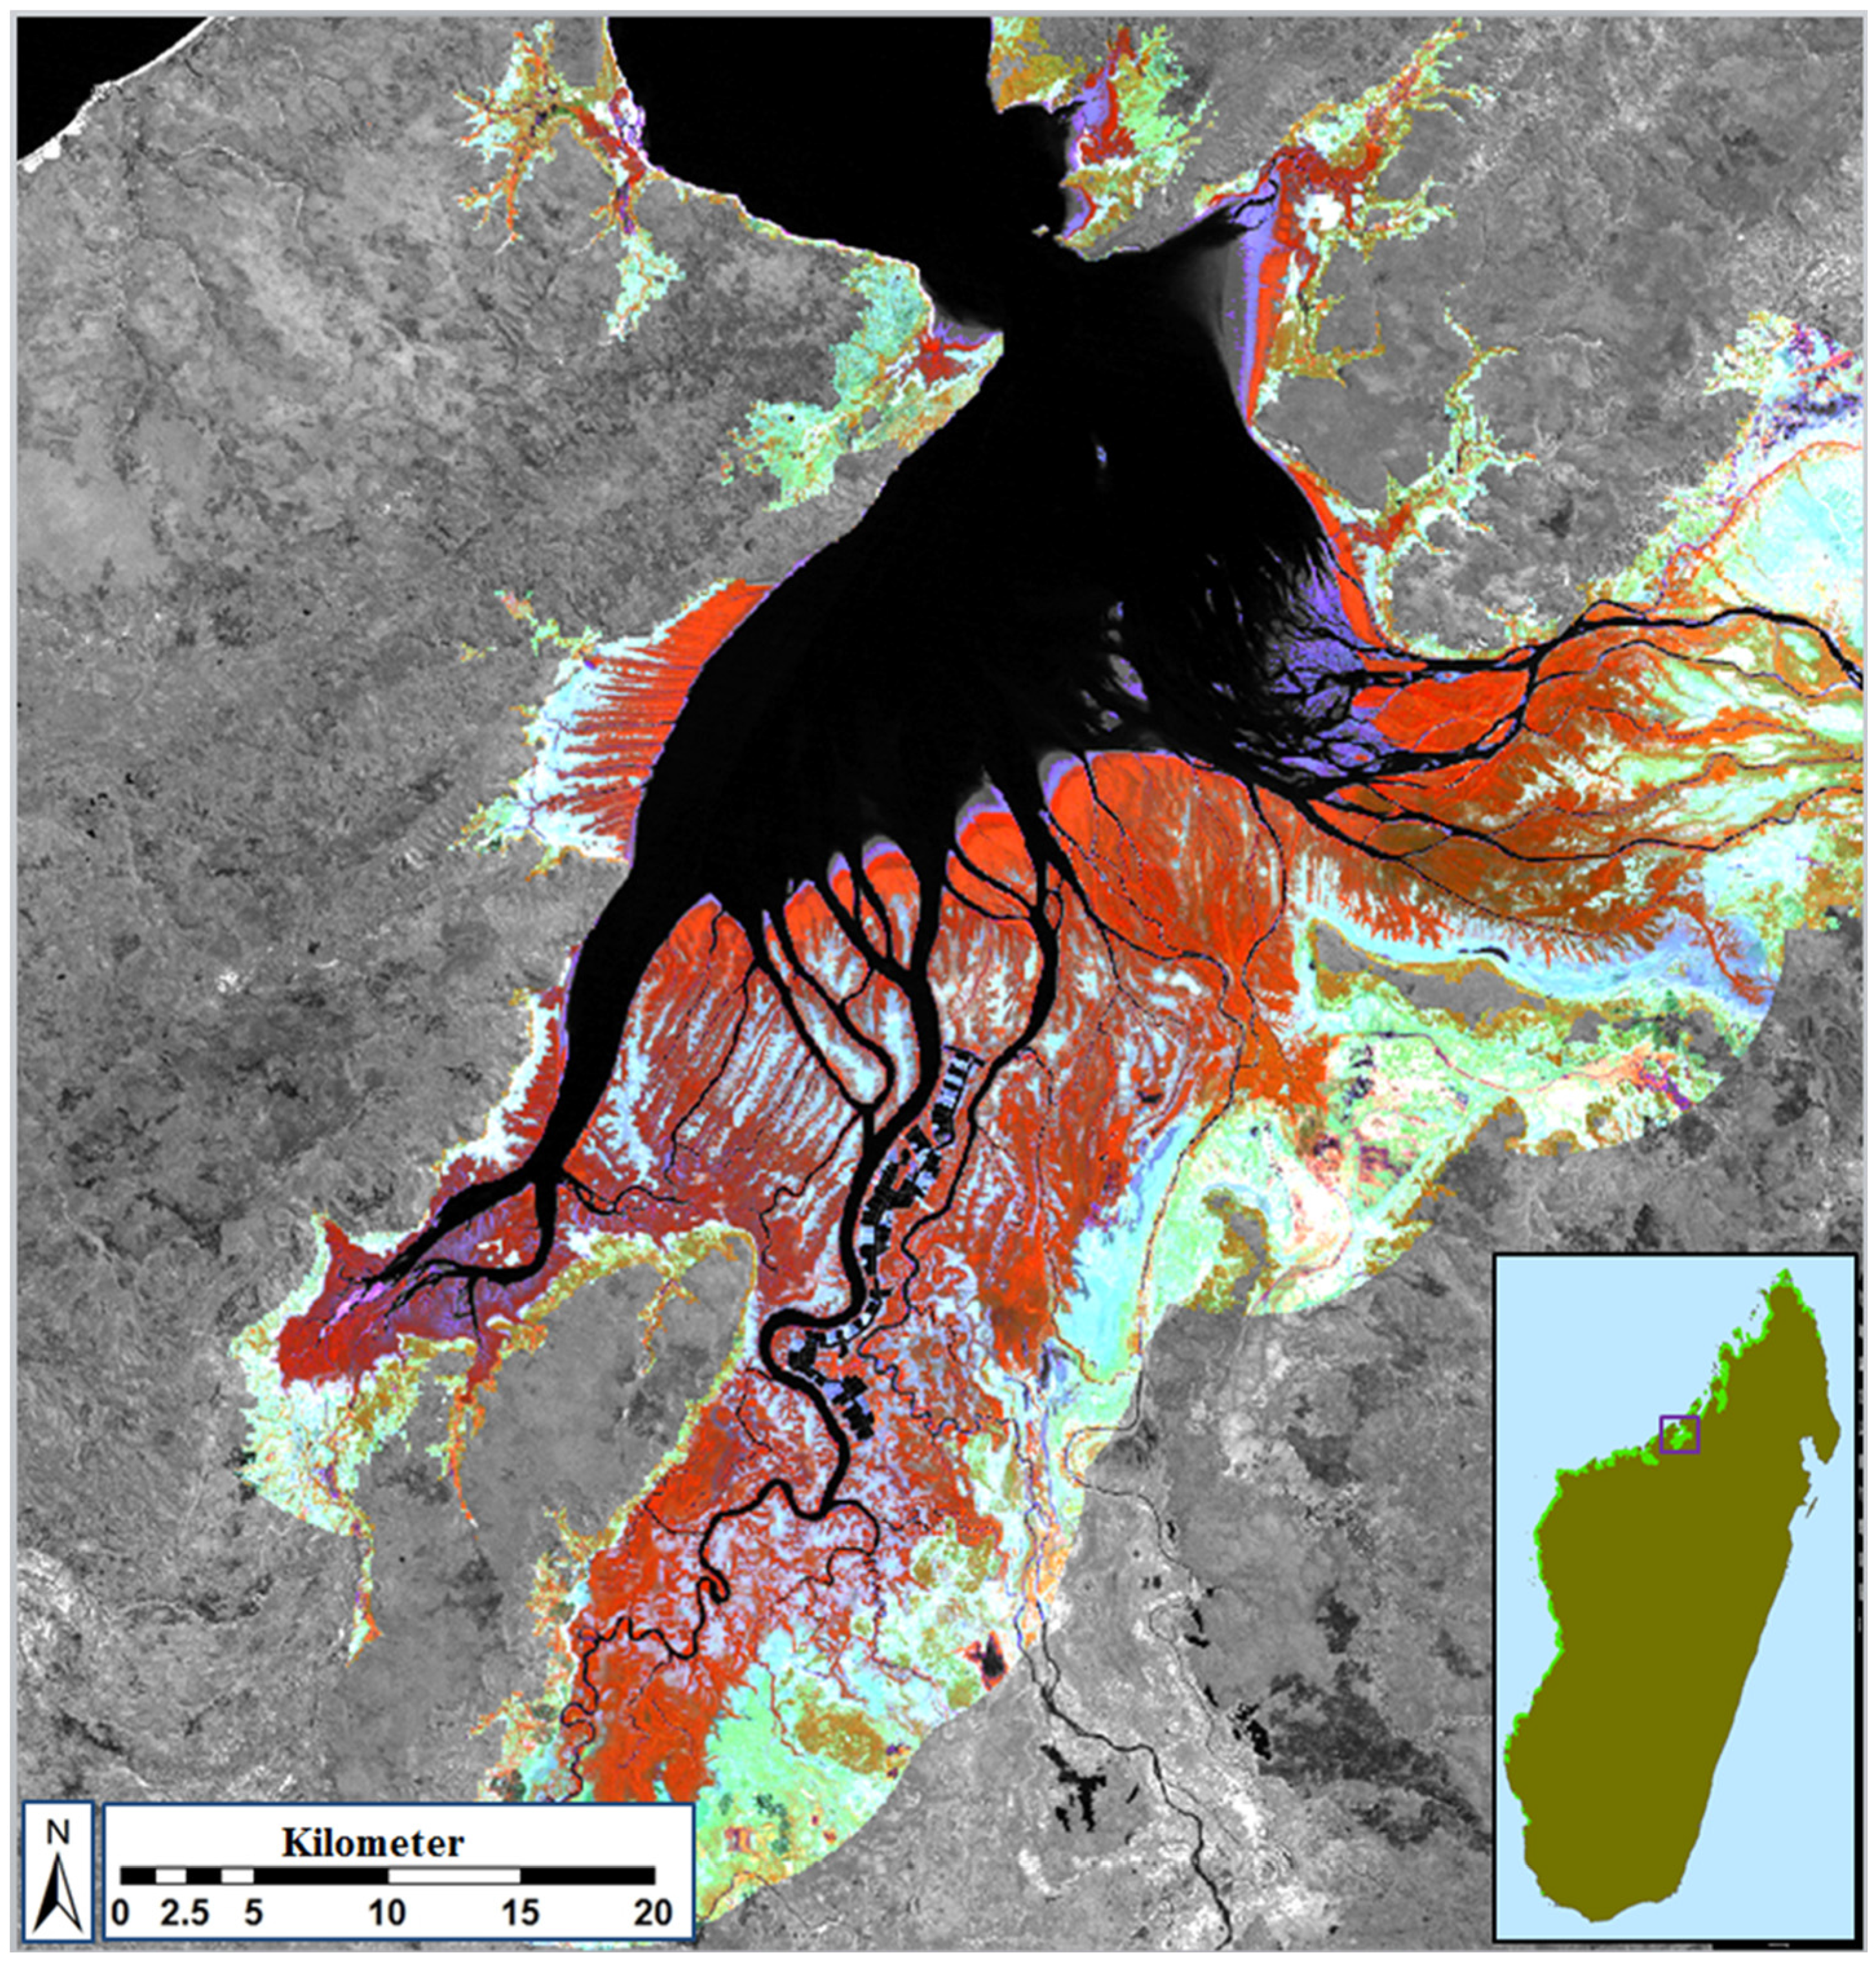
2.1. Study Area
2.2. Review of Existing Maps and Calculation and Contextualization of Mangrove Dynamics
2.3. Remotely Sensed Data: Acquisition and Pre-Processing

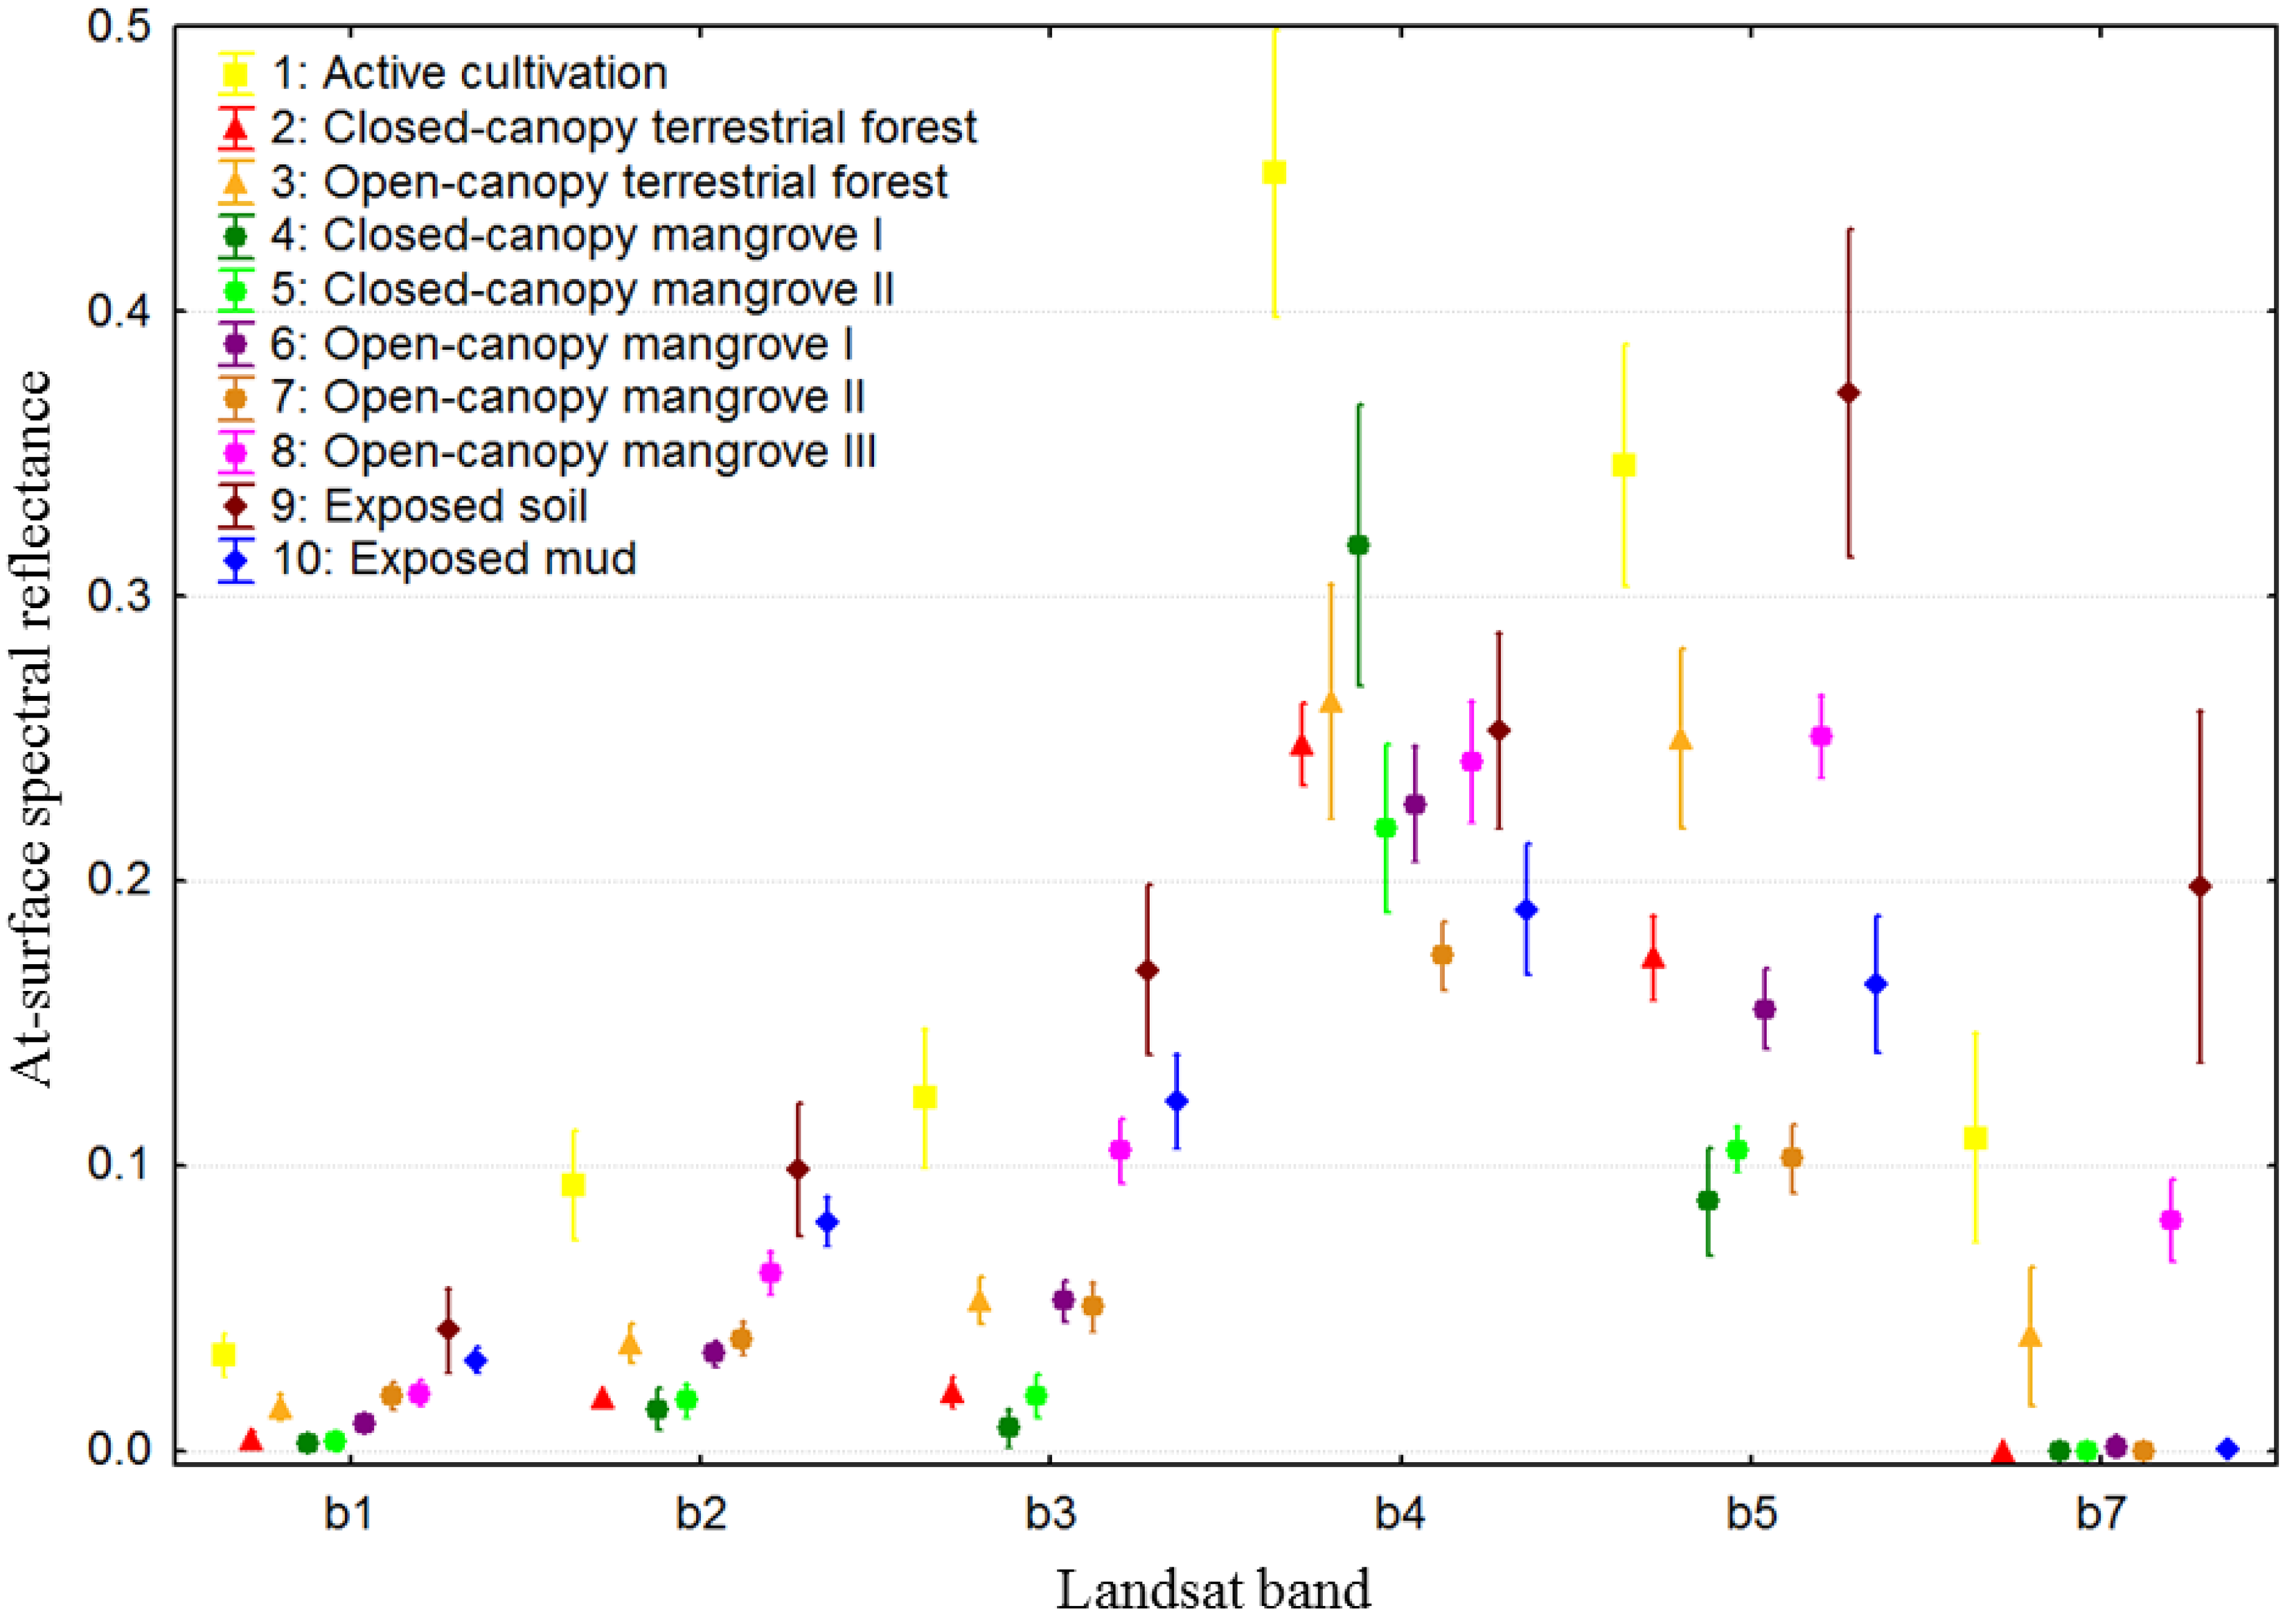
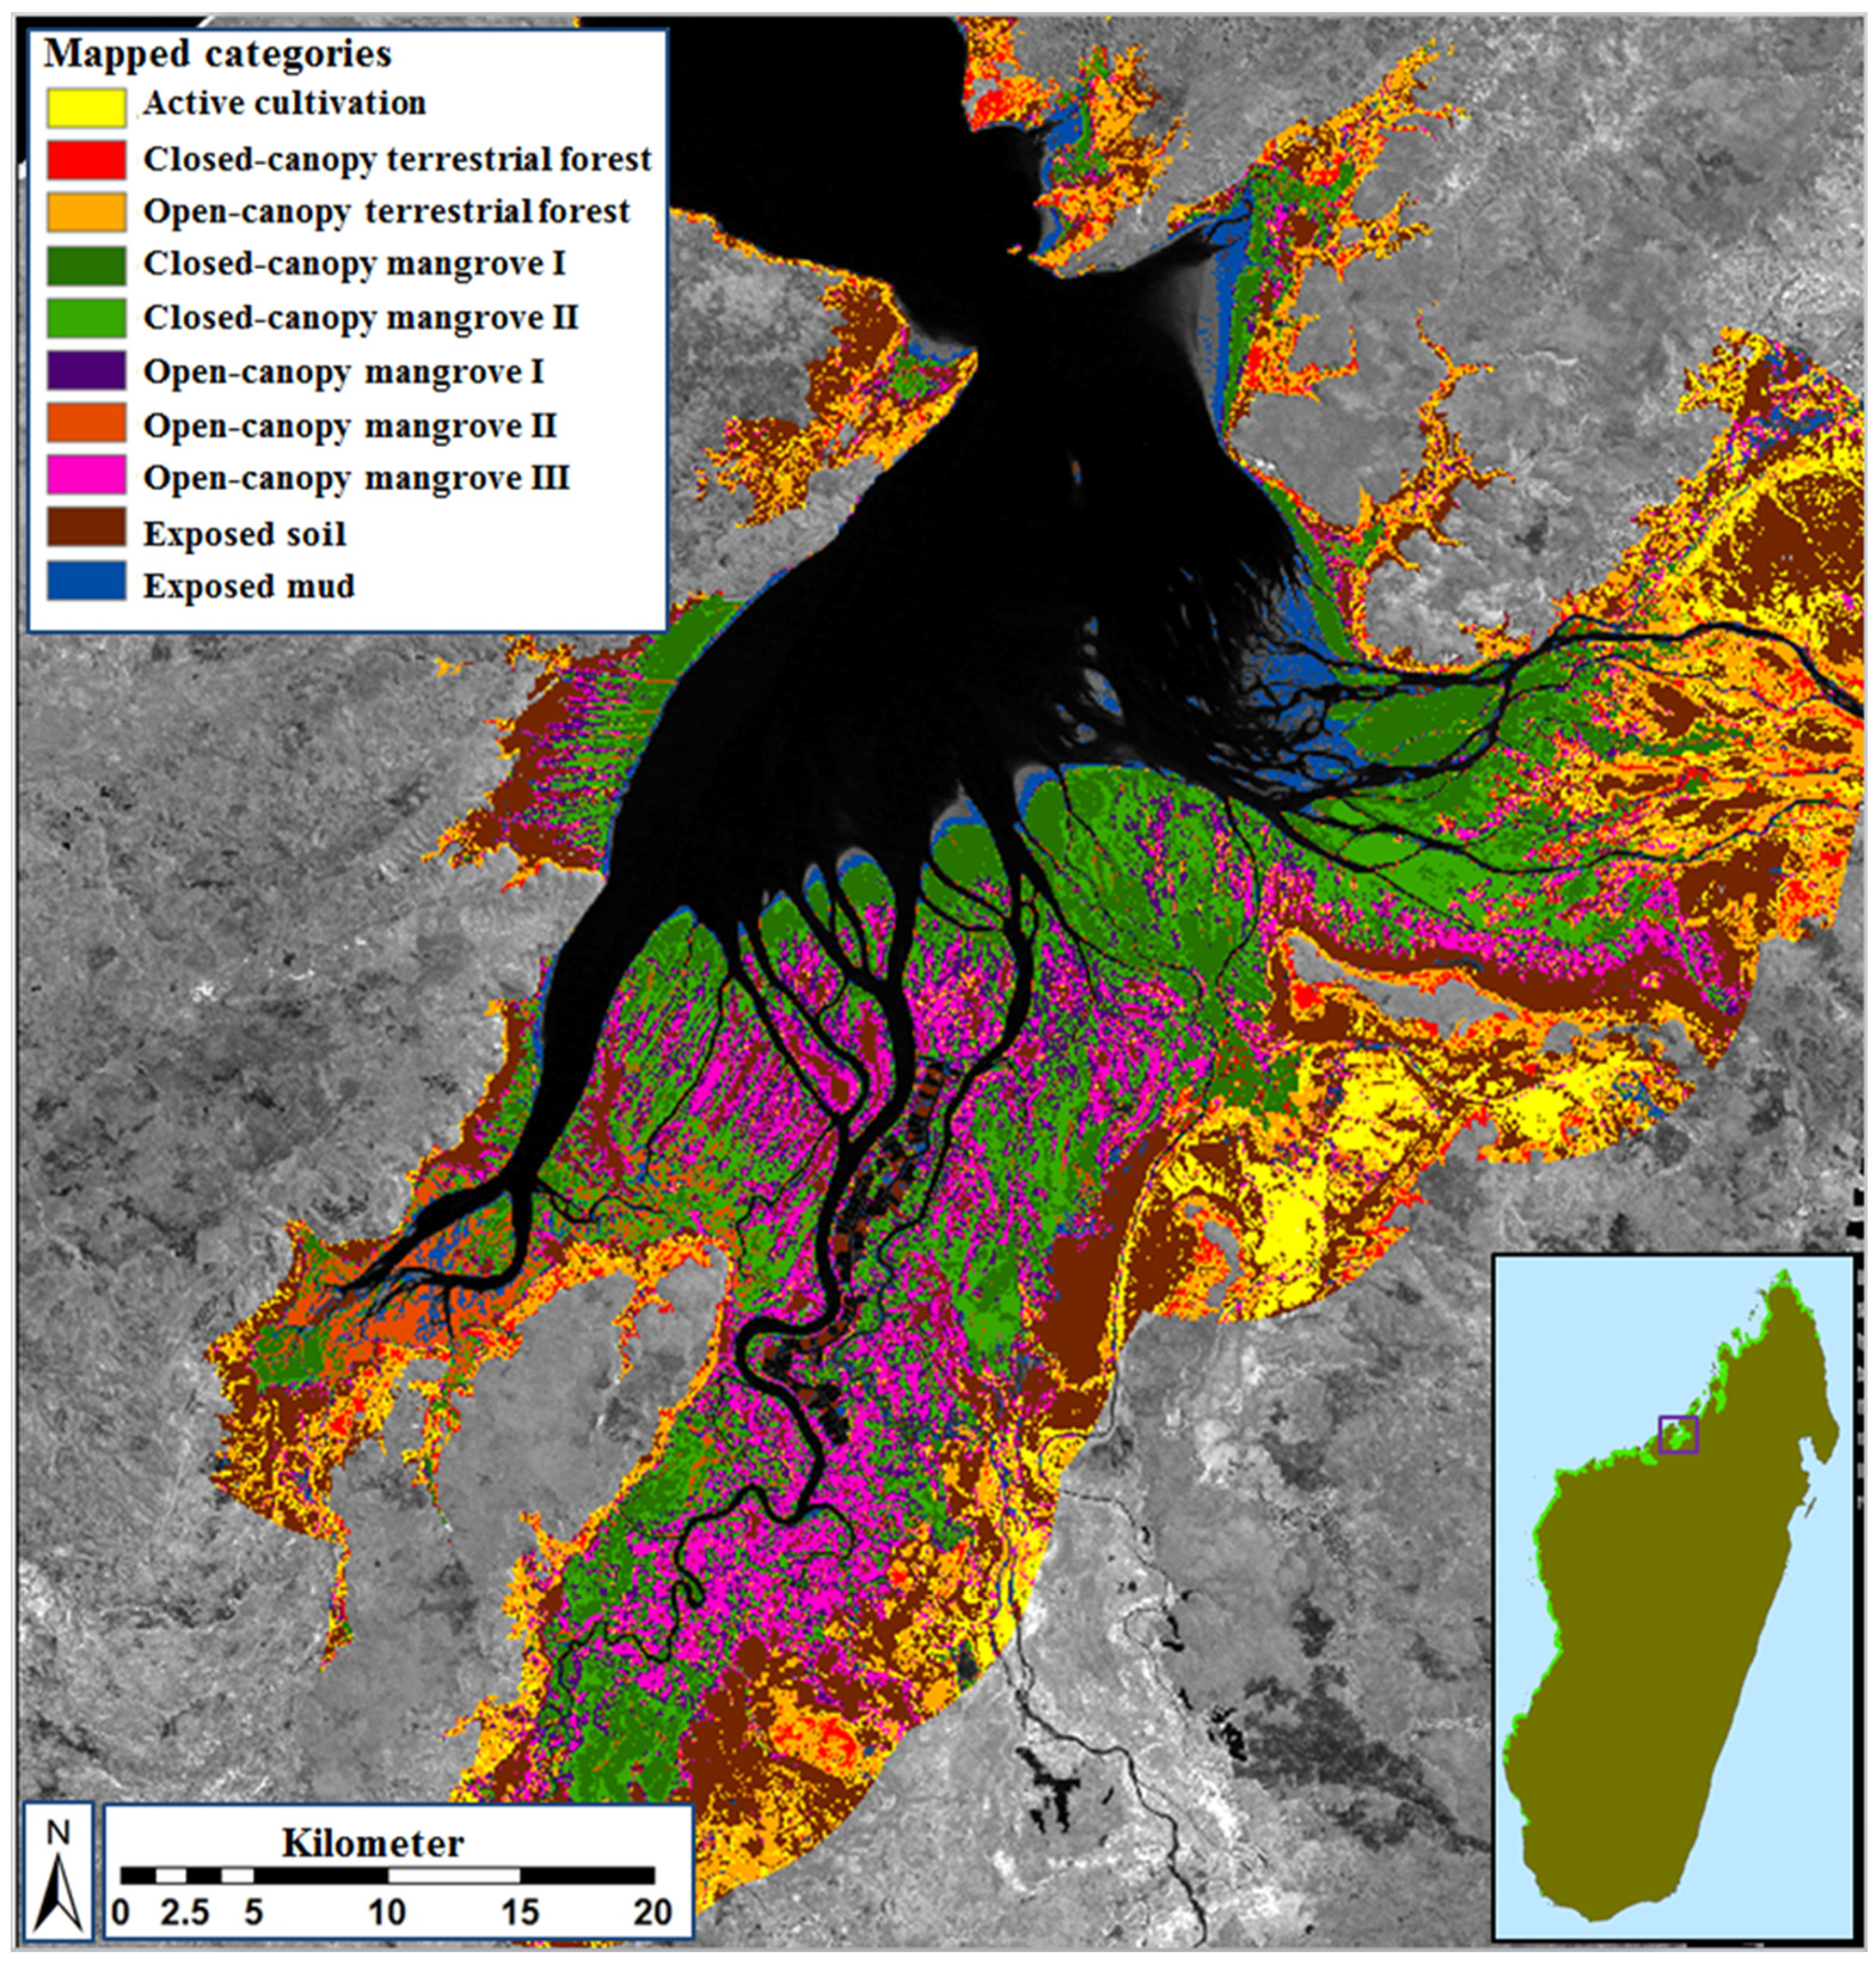
| Class | Description of Typical Constituents | Calibration | Validation |
|---|---|---|---|
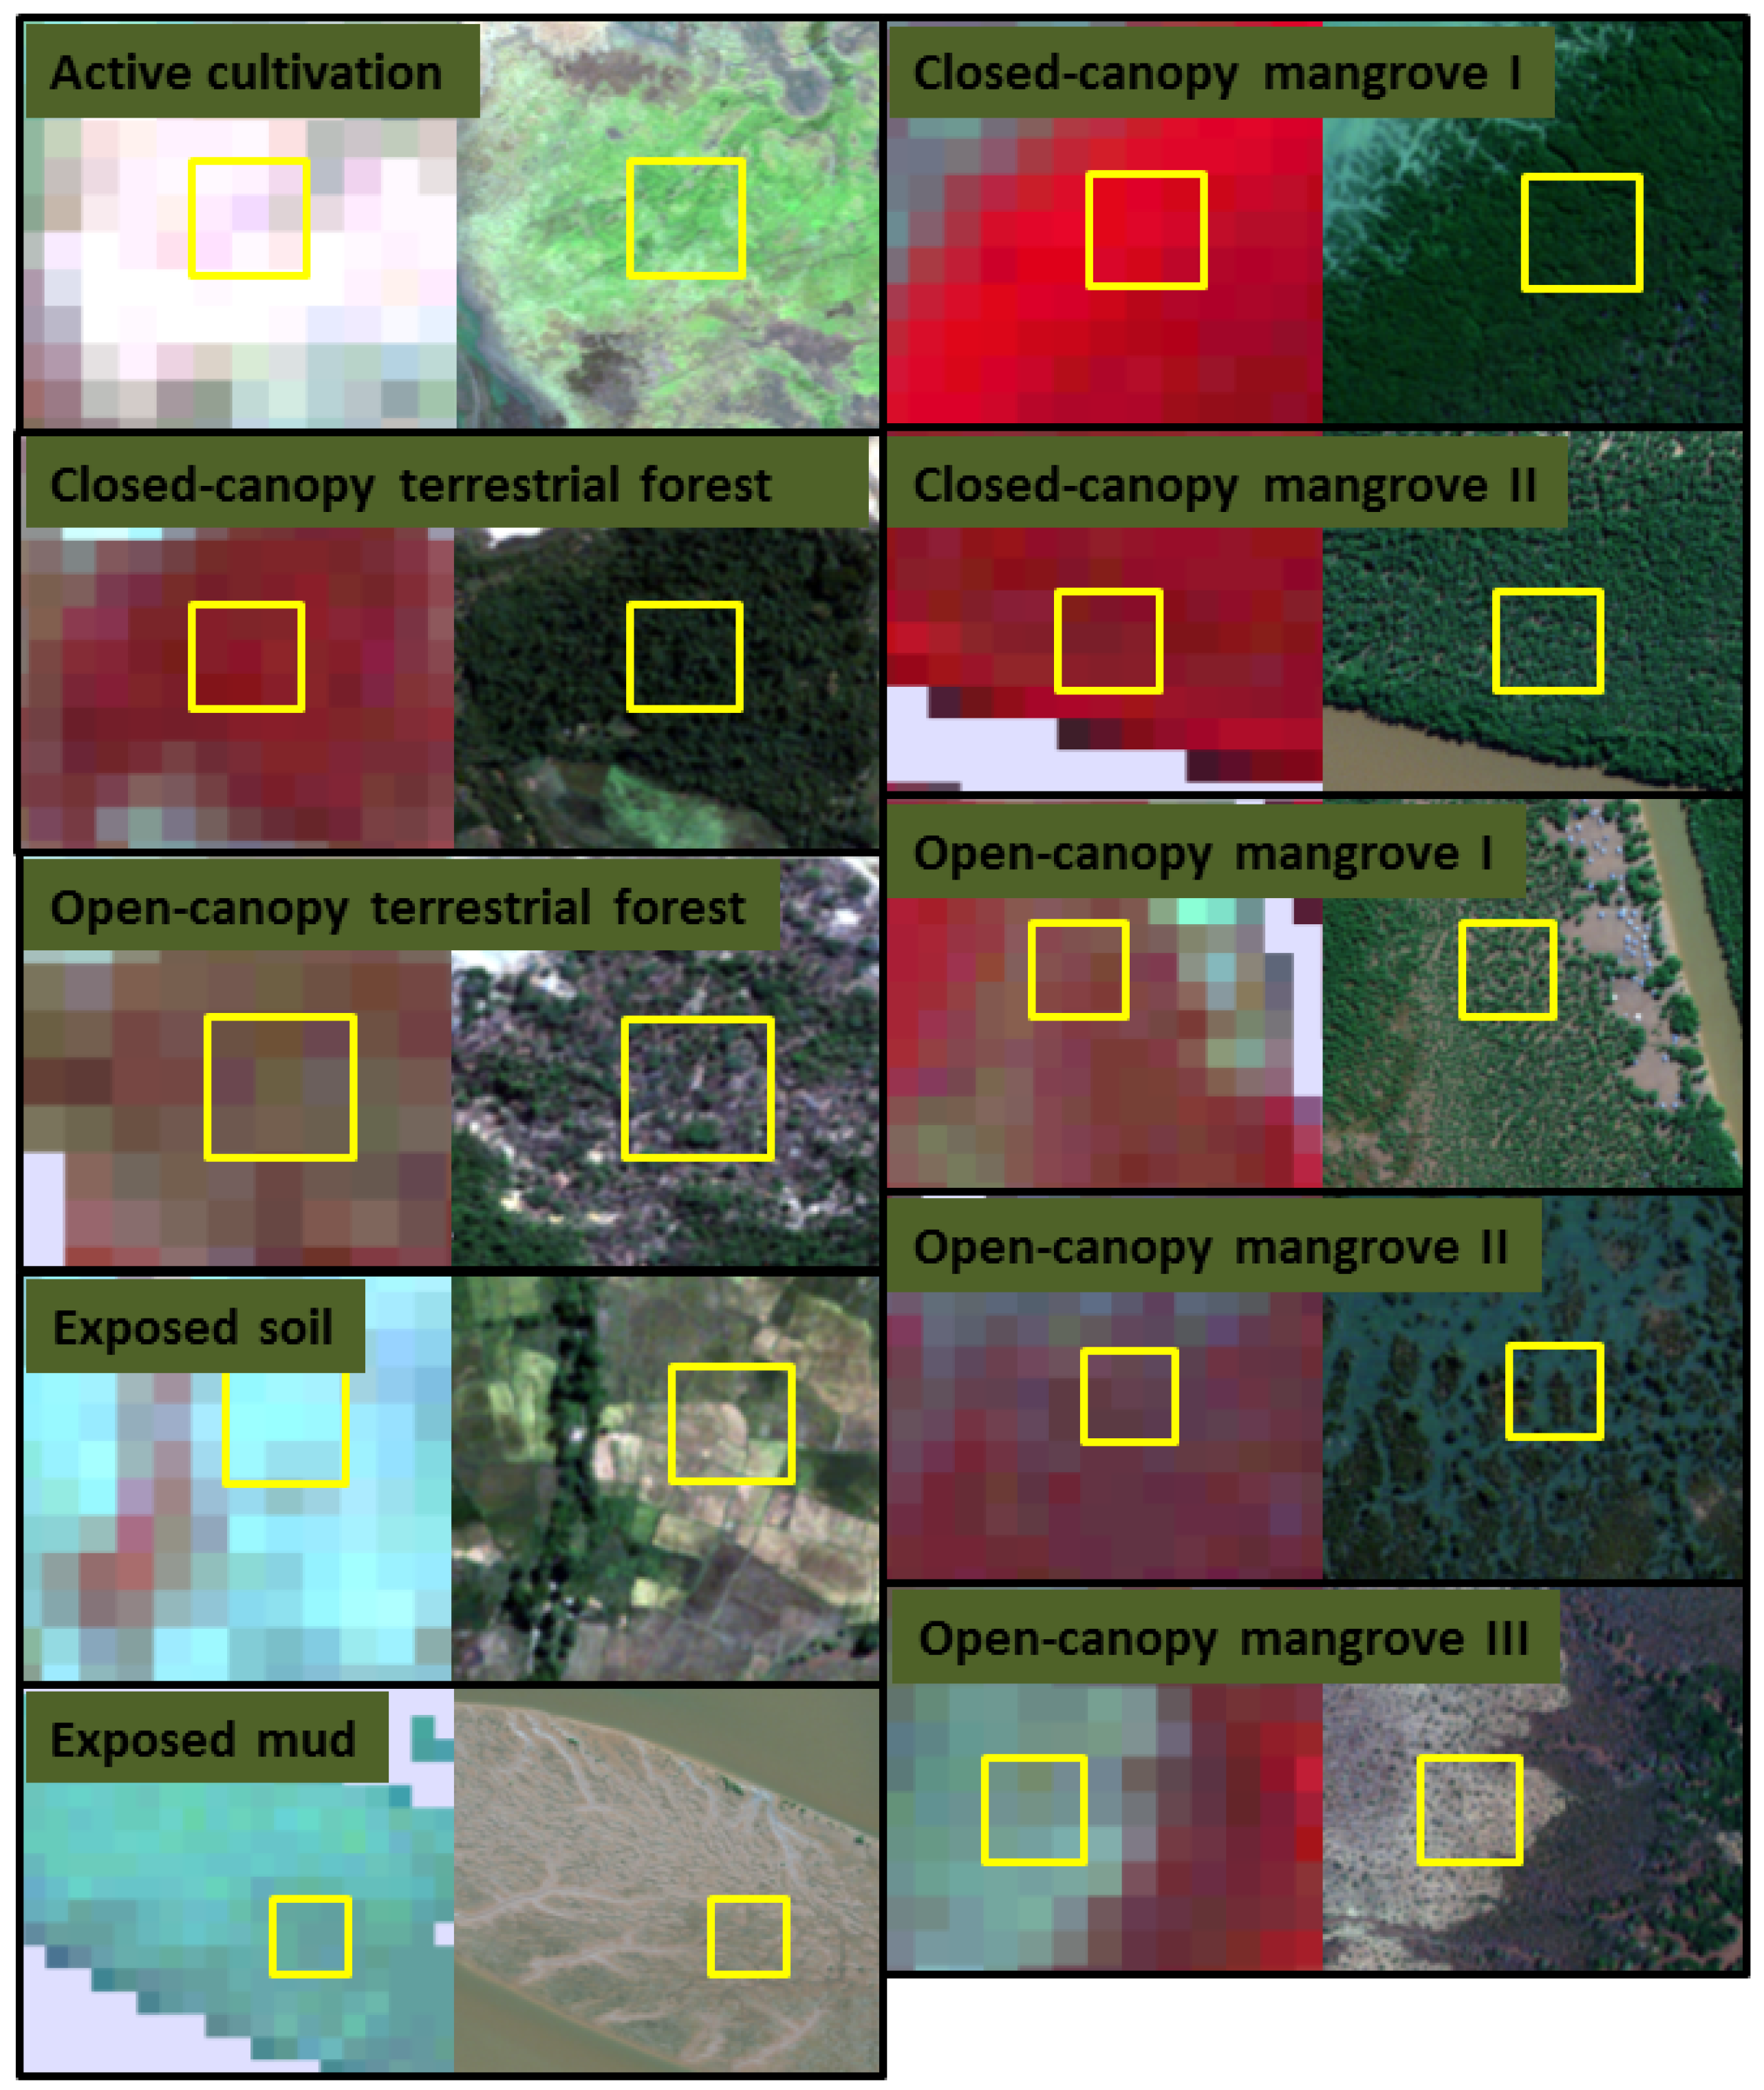
| Active cultivation | dominated by active agriculture (e.g., rice) | 14 | 7 |
| Closed-canopy terrestrial forest | closed-canopy terrestrial forest; canopy >60% closed | 14 | 7 |
| Open-canopy terrestrial forest | open-canopy terrestrial forest; canopy 30%–70% closed; mosaics of trees, shrubs, grass | 16 | 8 |
| Closed-canopy mangrove I | tall, mature stands of trees; canopy >80% closed | 22 | 10 |
| Closed-canopy mangrove II | tall mature stands of trees; canopy >60% closed | 22 | 10 |
| Open-canopy mangrove I | short-medium stands of trees/shrubs; canopy 30%–70% closed; moderately influenced by background soil/mud | 14 | 7 |
| Open-canopy mangrove II | short-medium stands of trees/shrubs; canopy 30%–70% closed; significantly influenced by background soil/mud | 12 | 7 |
| Open-canopy mangrove III | stunted, short stands, shrub-dominant, very sparse; canopy <30% closed; dominated by exposed soil/mud | 14 | 7 |
| Exposed soil | dry inactive agri/aquacultural areas; dry tannes (mudflats); sparsely vegetated soil-dominated areas | 21 | 10 |
| Exposed mud | mangrove/ocean interface; river sediment; wet tannes (mud-flats); inactive aquacultural ponds | 14 | 7 |
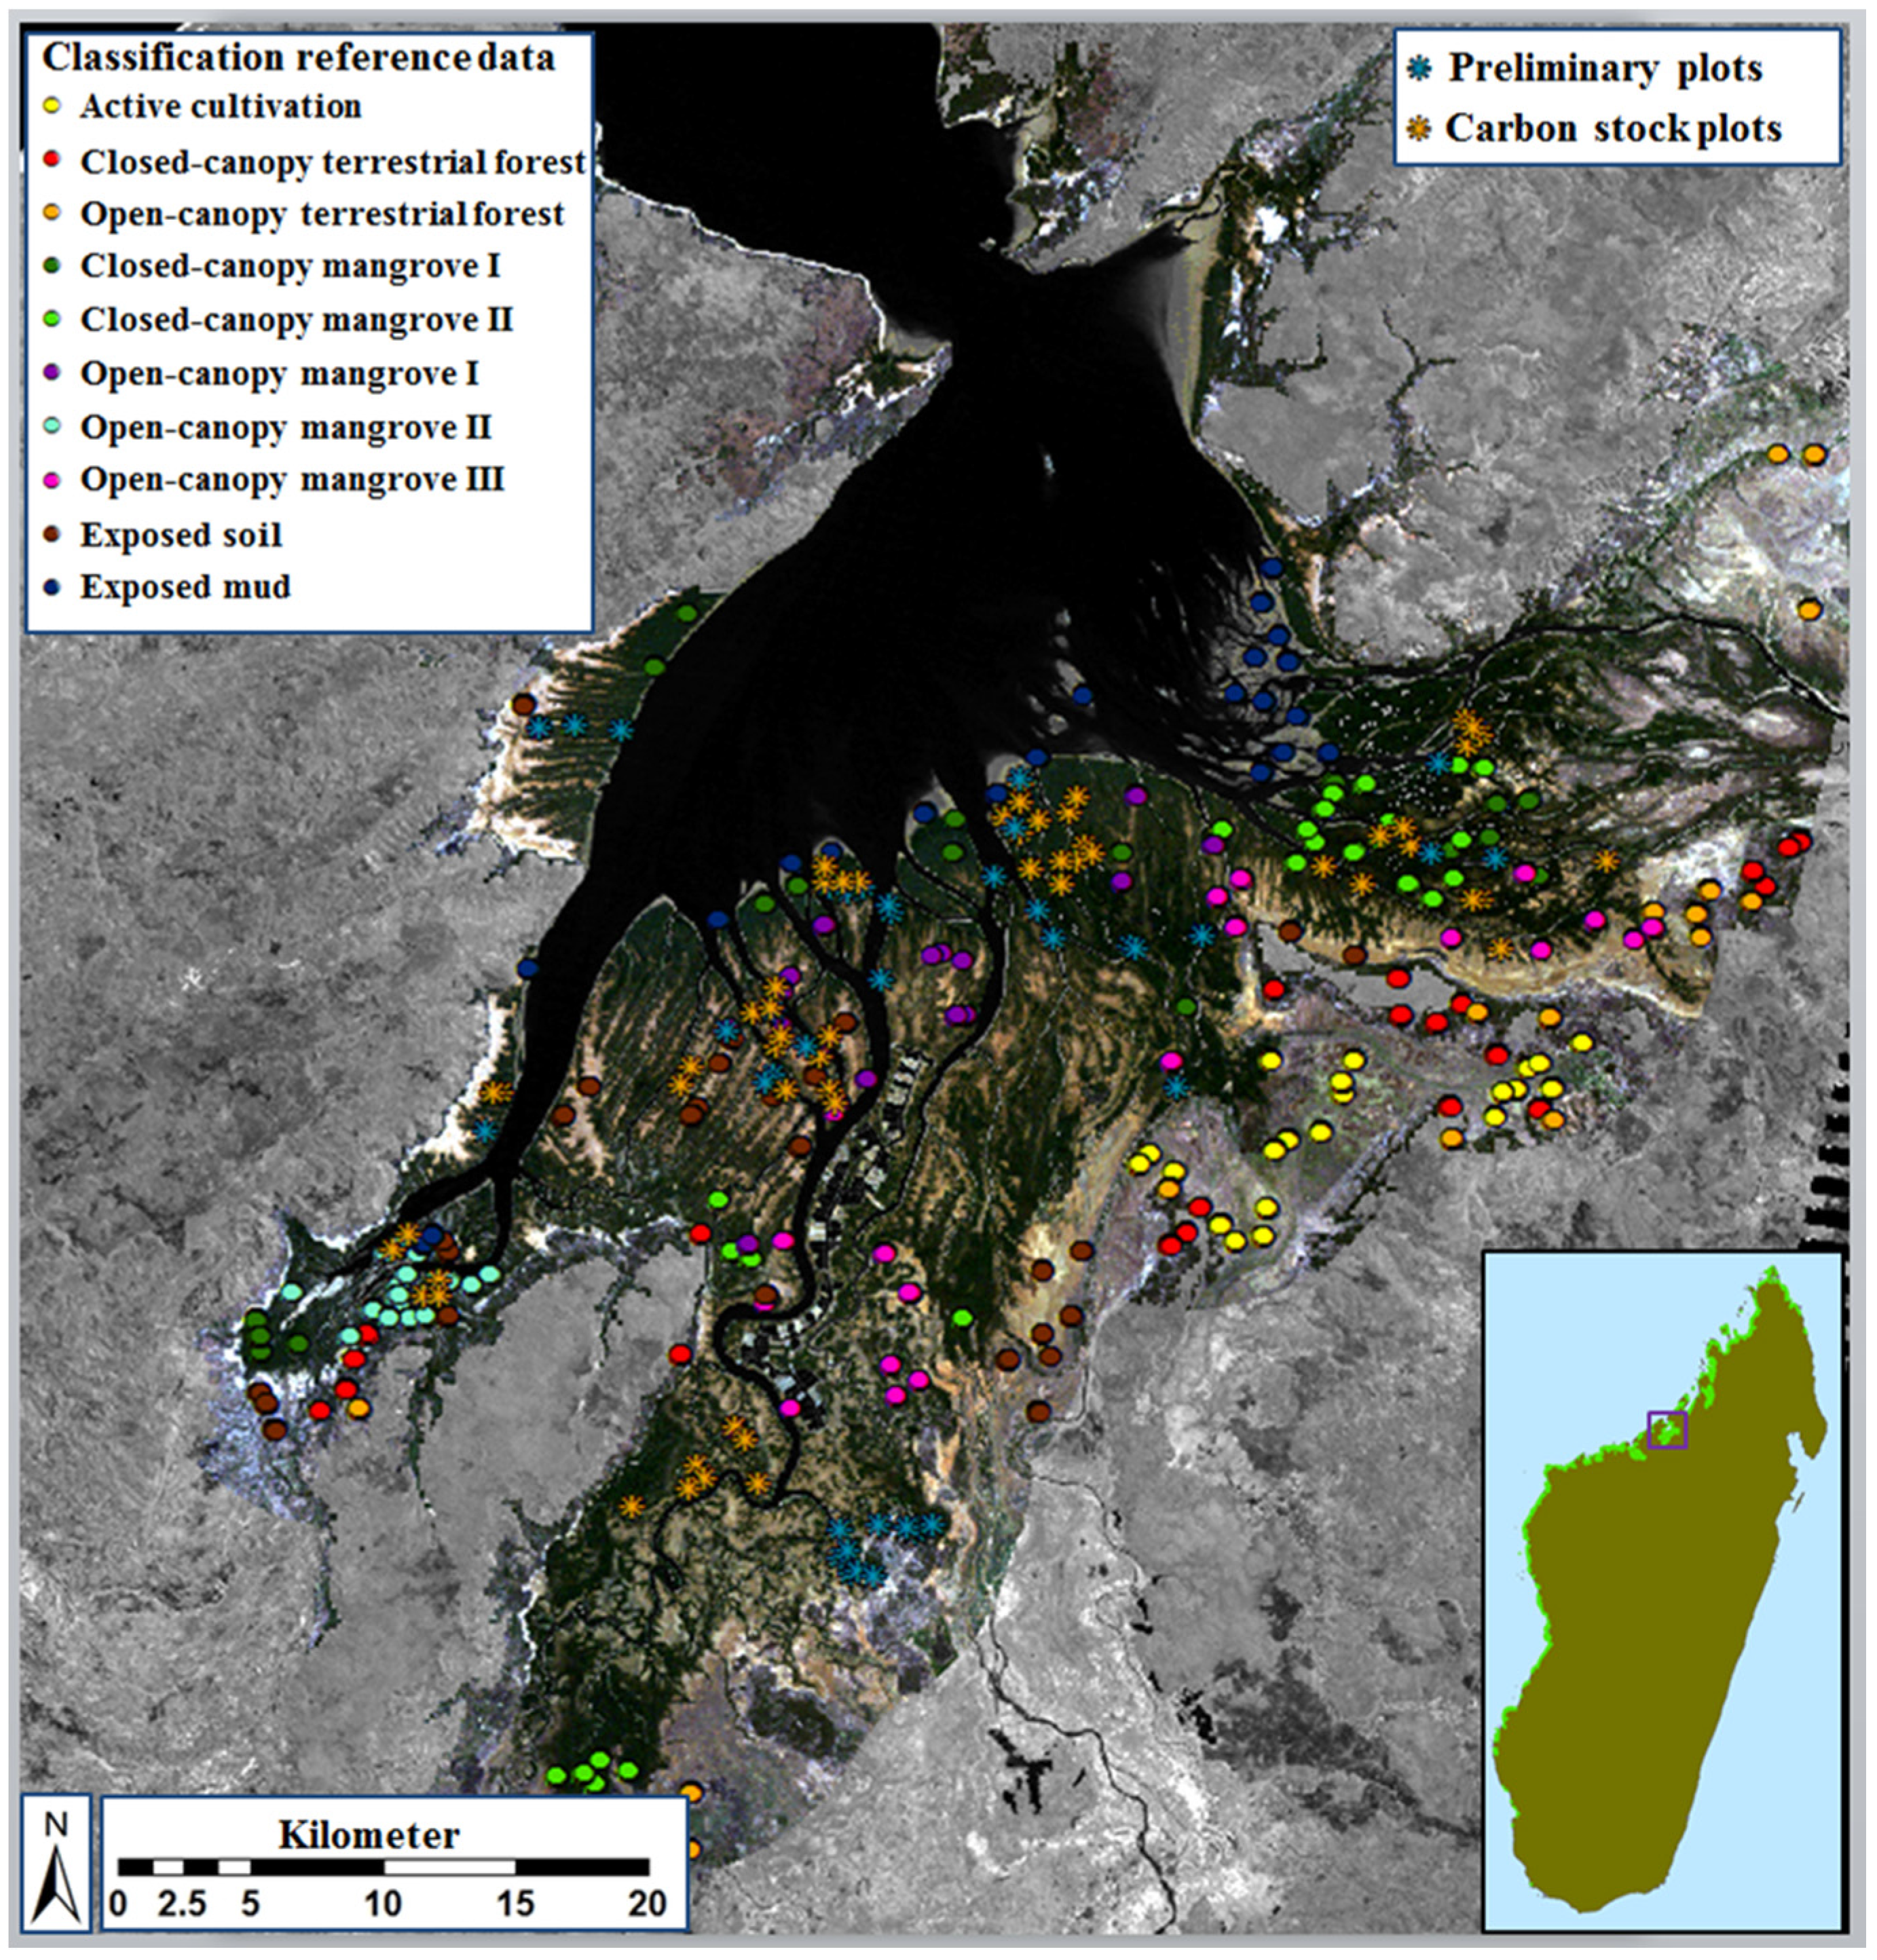
2.4. Definition and Refinement of Mangrove and Surrounding Land-Cover Types


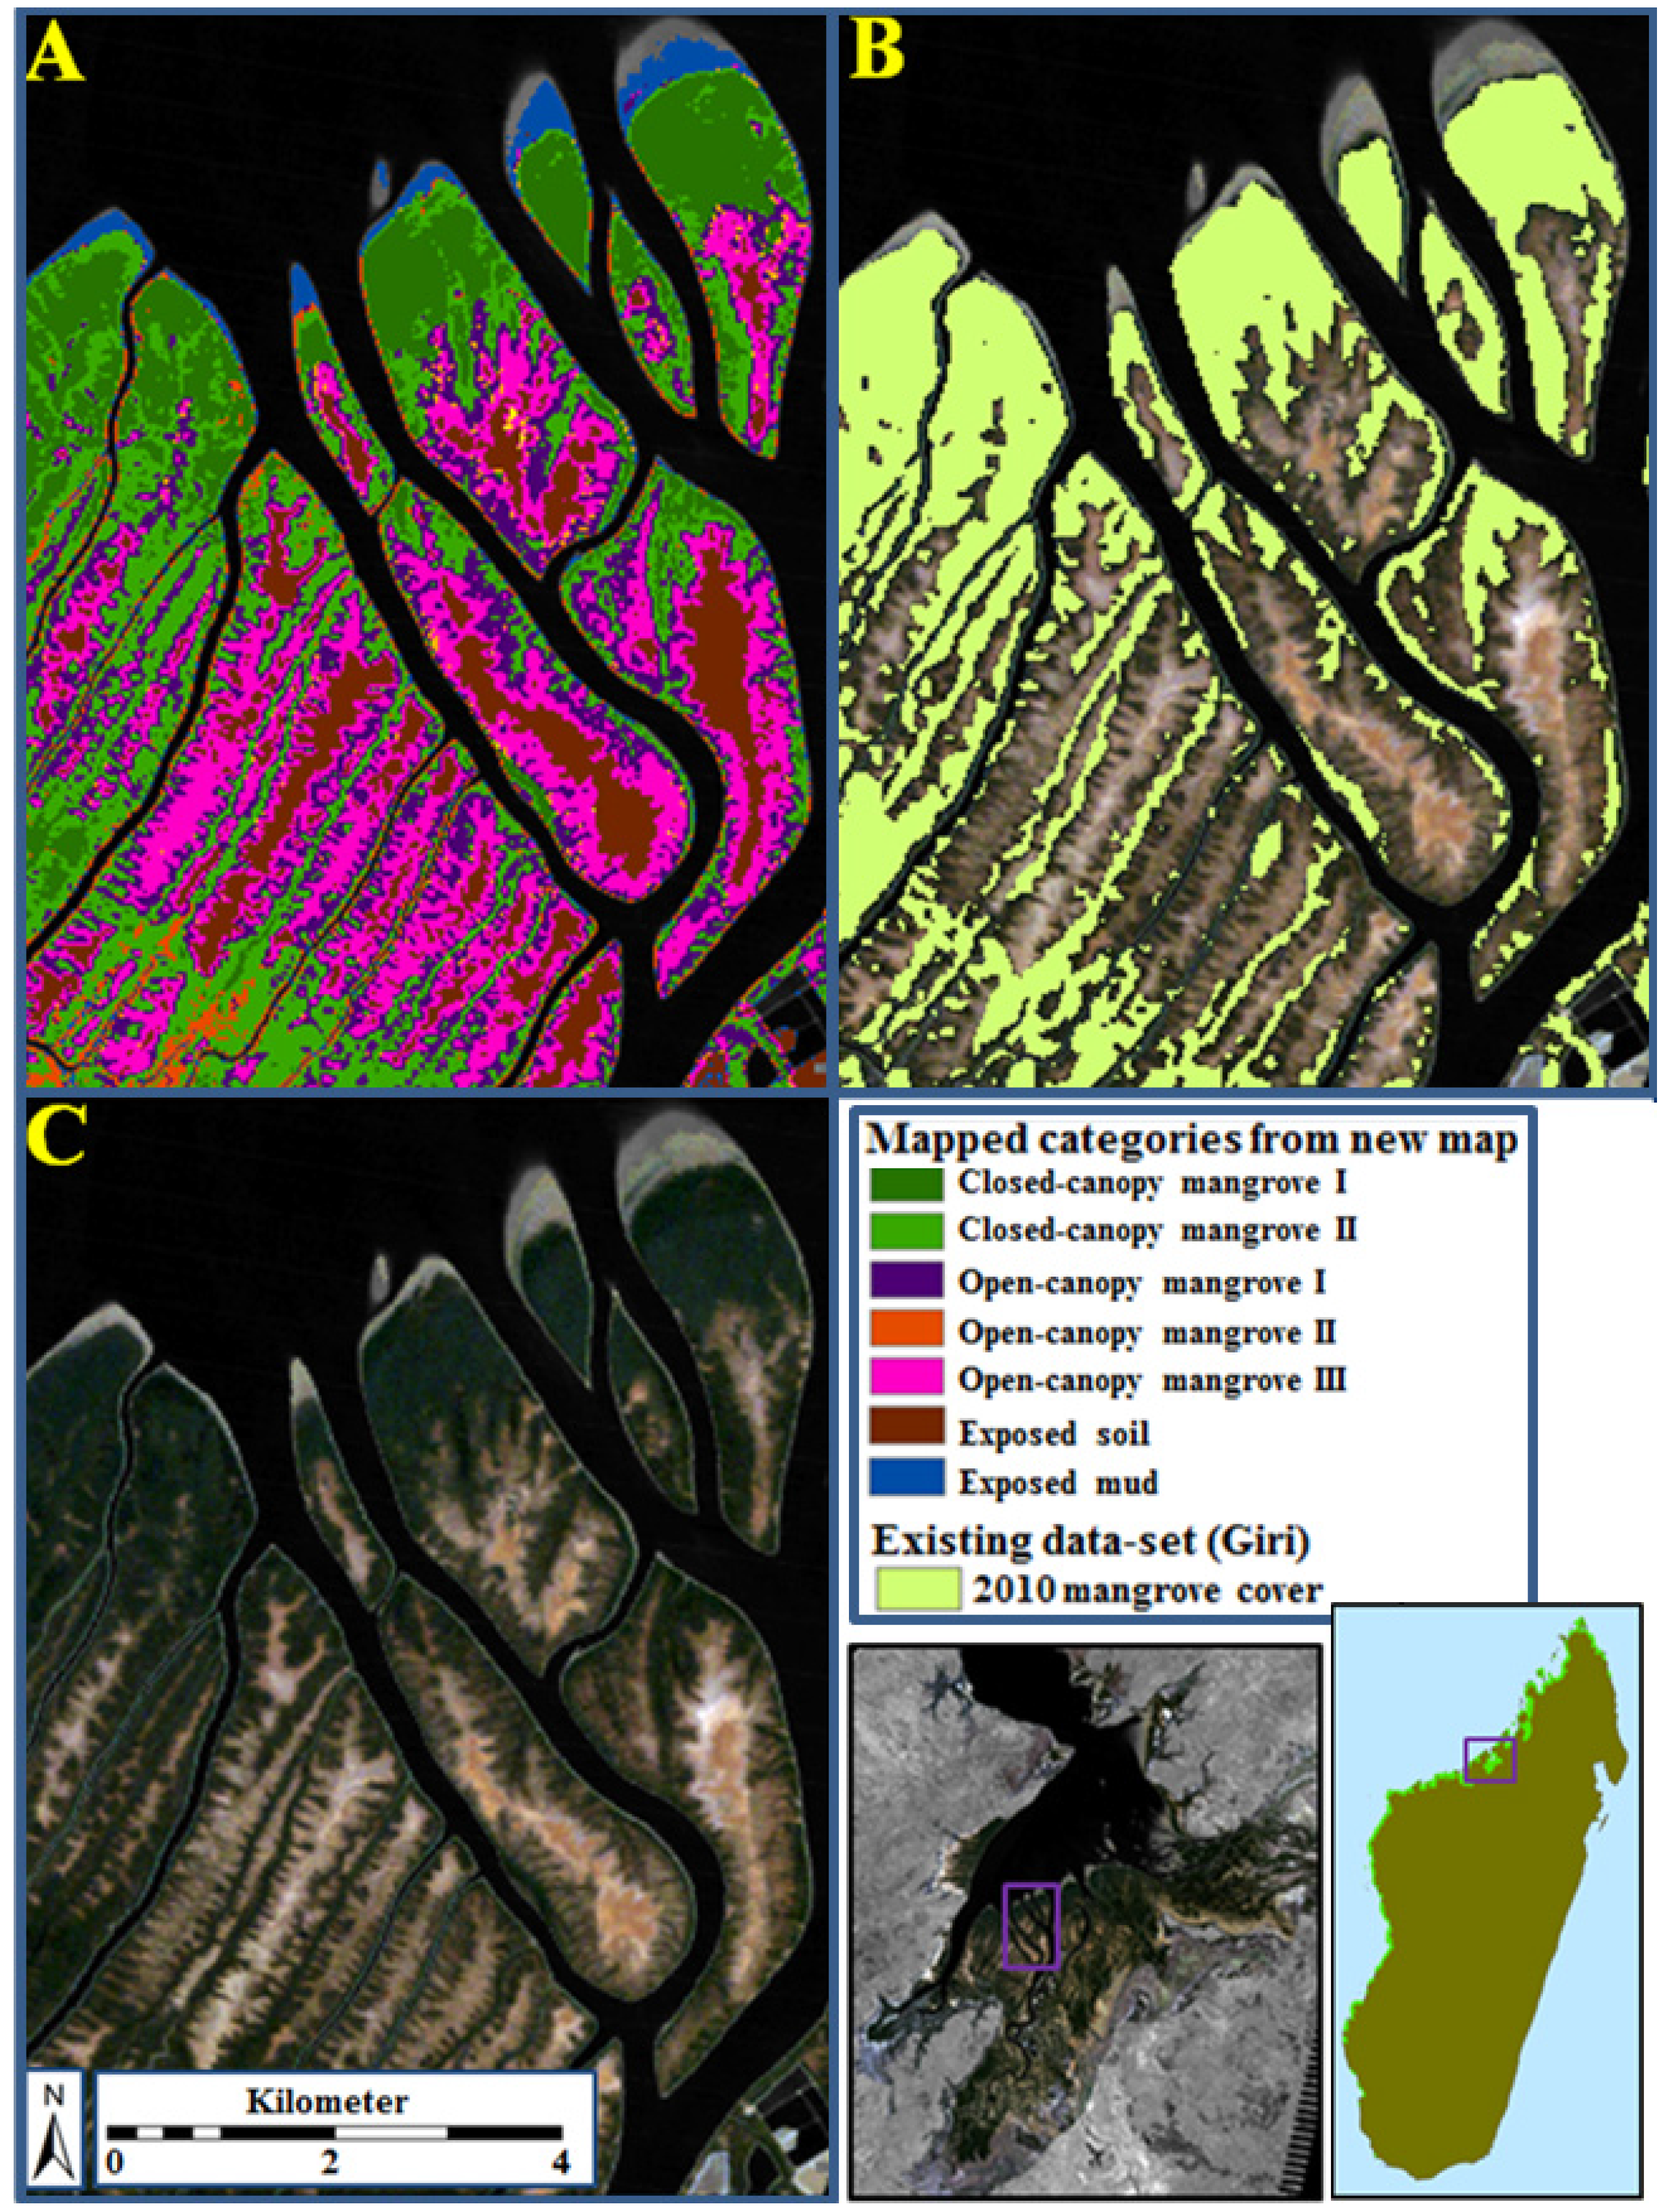
2.5. Image Classification and Map Production
2.6. Mangrove Carbon Stocks
| Live Above-Ground Biomass (AGB) | ||||
|---|---|---|---|---|
| Species | Equation | ρ | Source | |
| Avicennia marina | B = 0.1848 × dbh 2.3524 | 0.661 | Dharmawan and Siregar (2008) [90] | |
| Bruguiera gymnorrizha | (leaves) | B = 0.0679 × dbh 1.4914 | 0.741 | Clough & Scott (1989) [91] |
| (stem) | B = 0.0464 × (dbh 2 × H) 0.94275 × ρ | 0.741 | Kauffman & Donato (2012) [86]; | |
| Chave et al. (2005); [92] | ||||
| Cole et al. (1999) [93] | ||||
| Ceriops tagal | (dbh: 2–18 cm) | B = 10 −0.7247 × dbh 2.3379 | 0.803 | Clough & Scott (1989) [91] |
| (dbh: 18–25 cm) | B = 10 −0.494 × dbh 2.056 | 0.803 | Comley & McGuiness (2005) [94] | |
| Heritiera littoralis | (leaves) | B = 0.0679 × dbh 1.4914 | 1.074 | Clough & Scott (1989) [91] |
| (stem) | B = 0.0464 × (dbh 2 × H) 0.94275 × ρ | 1.074 | Kauffman & Donato (2012) [86]; | |
| Chave et al. (2005); [92] | ||||
| Cole et al. (1999) [93] | ||||
| Lumnitzeria racemosa | B = 0.0214 × (dbh 2 × H) 1.05655 × ρ | 0.565 | Kauffman & Donato (2012) [86]; | |
| Chave et al. (2005); [92] | ||||
| Cole et al. (1999) [93] | ||||
| Rhizophora mucronata | (leaves) | B = 0.0139 × D 2.1072 | 0.867 | Clough & Scott (1989) [91] |
| (root) | B = 0.0068 × dbh 3.1353 | 0.867 | Clough & Scott (1989) [91] | |
| (stem) | B = 0.0311 × (dbh 2 × H)1.00741 × ρ | 0.867 | Kauffman & Donato (2012) [86]; | |
| Chave et al. (2005); [92] | ||||
| Cole et al. (1999) [93] | ||||
| Sonneratia alba | B = 0.0825 × (dbh 2 × H) 0.89966 × ρ | 0.78 | Kauffman & Donato (2012) [86]; | |
| Chave et al. (2005); [92] | ||||
| Cole et al. (1999) [93] | ||||
| Xylocarpus granatum | B = 0.0830 × (dbh 2 × H) 0.89806 × ρ | 0.7 | Kauffman & Donato (2012) [86]; | |
| Chave et al. (2005); [92] | ||||
| Cole et al. (1999) [93] | ||||
| Other Equations | ||||
| Below-ground biomass: | B = 0.199 × ρ 0.899 × dbh 2.22 | Komiyama et al. (2005) [88] | ||
| Live and dead roots | (where ρ = species-specific wood density, as above) | |||
| Dead tree: Decay status 1 | B = 0.975× AGB | Kauffman & Donato (2012) [86] | ||
| Dead tree: Decay status 2 | B = 0.8× AGB | Kauffman & Donato (2012) [86] | ||
3. Results and Discussion
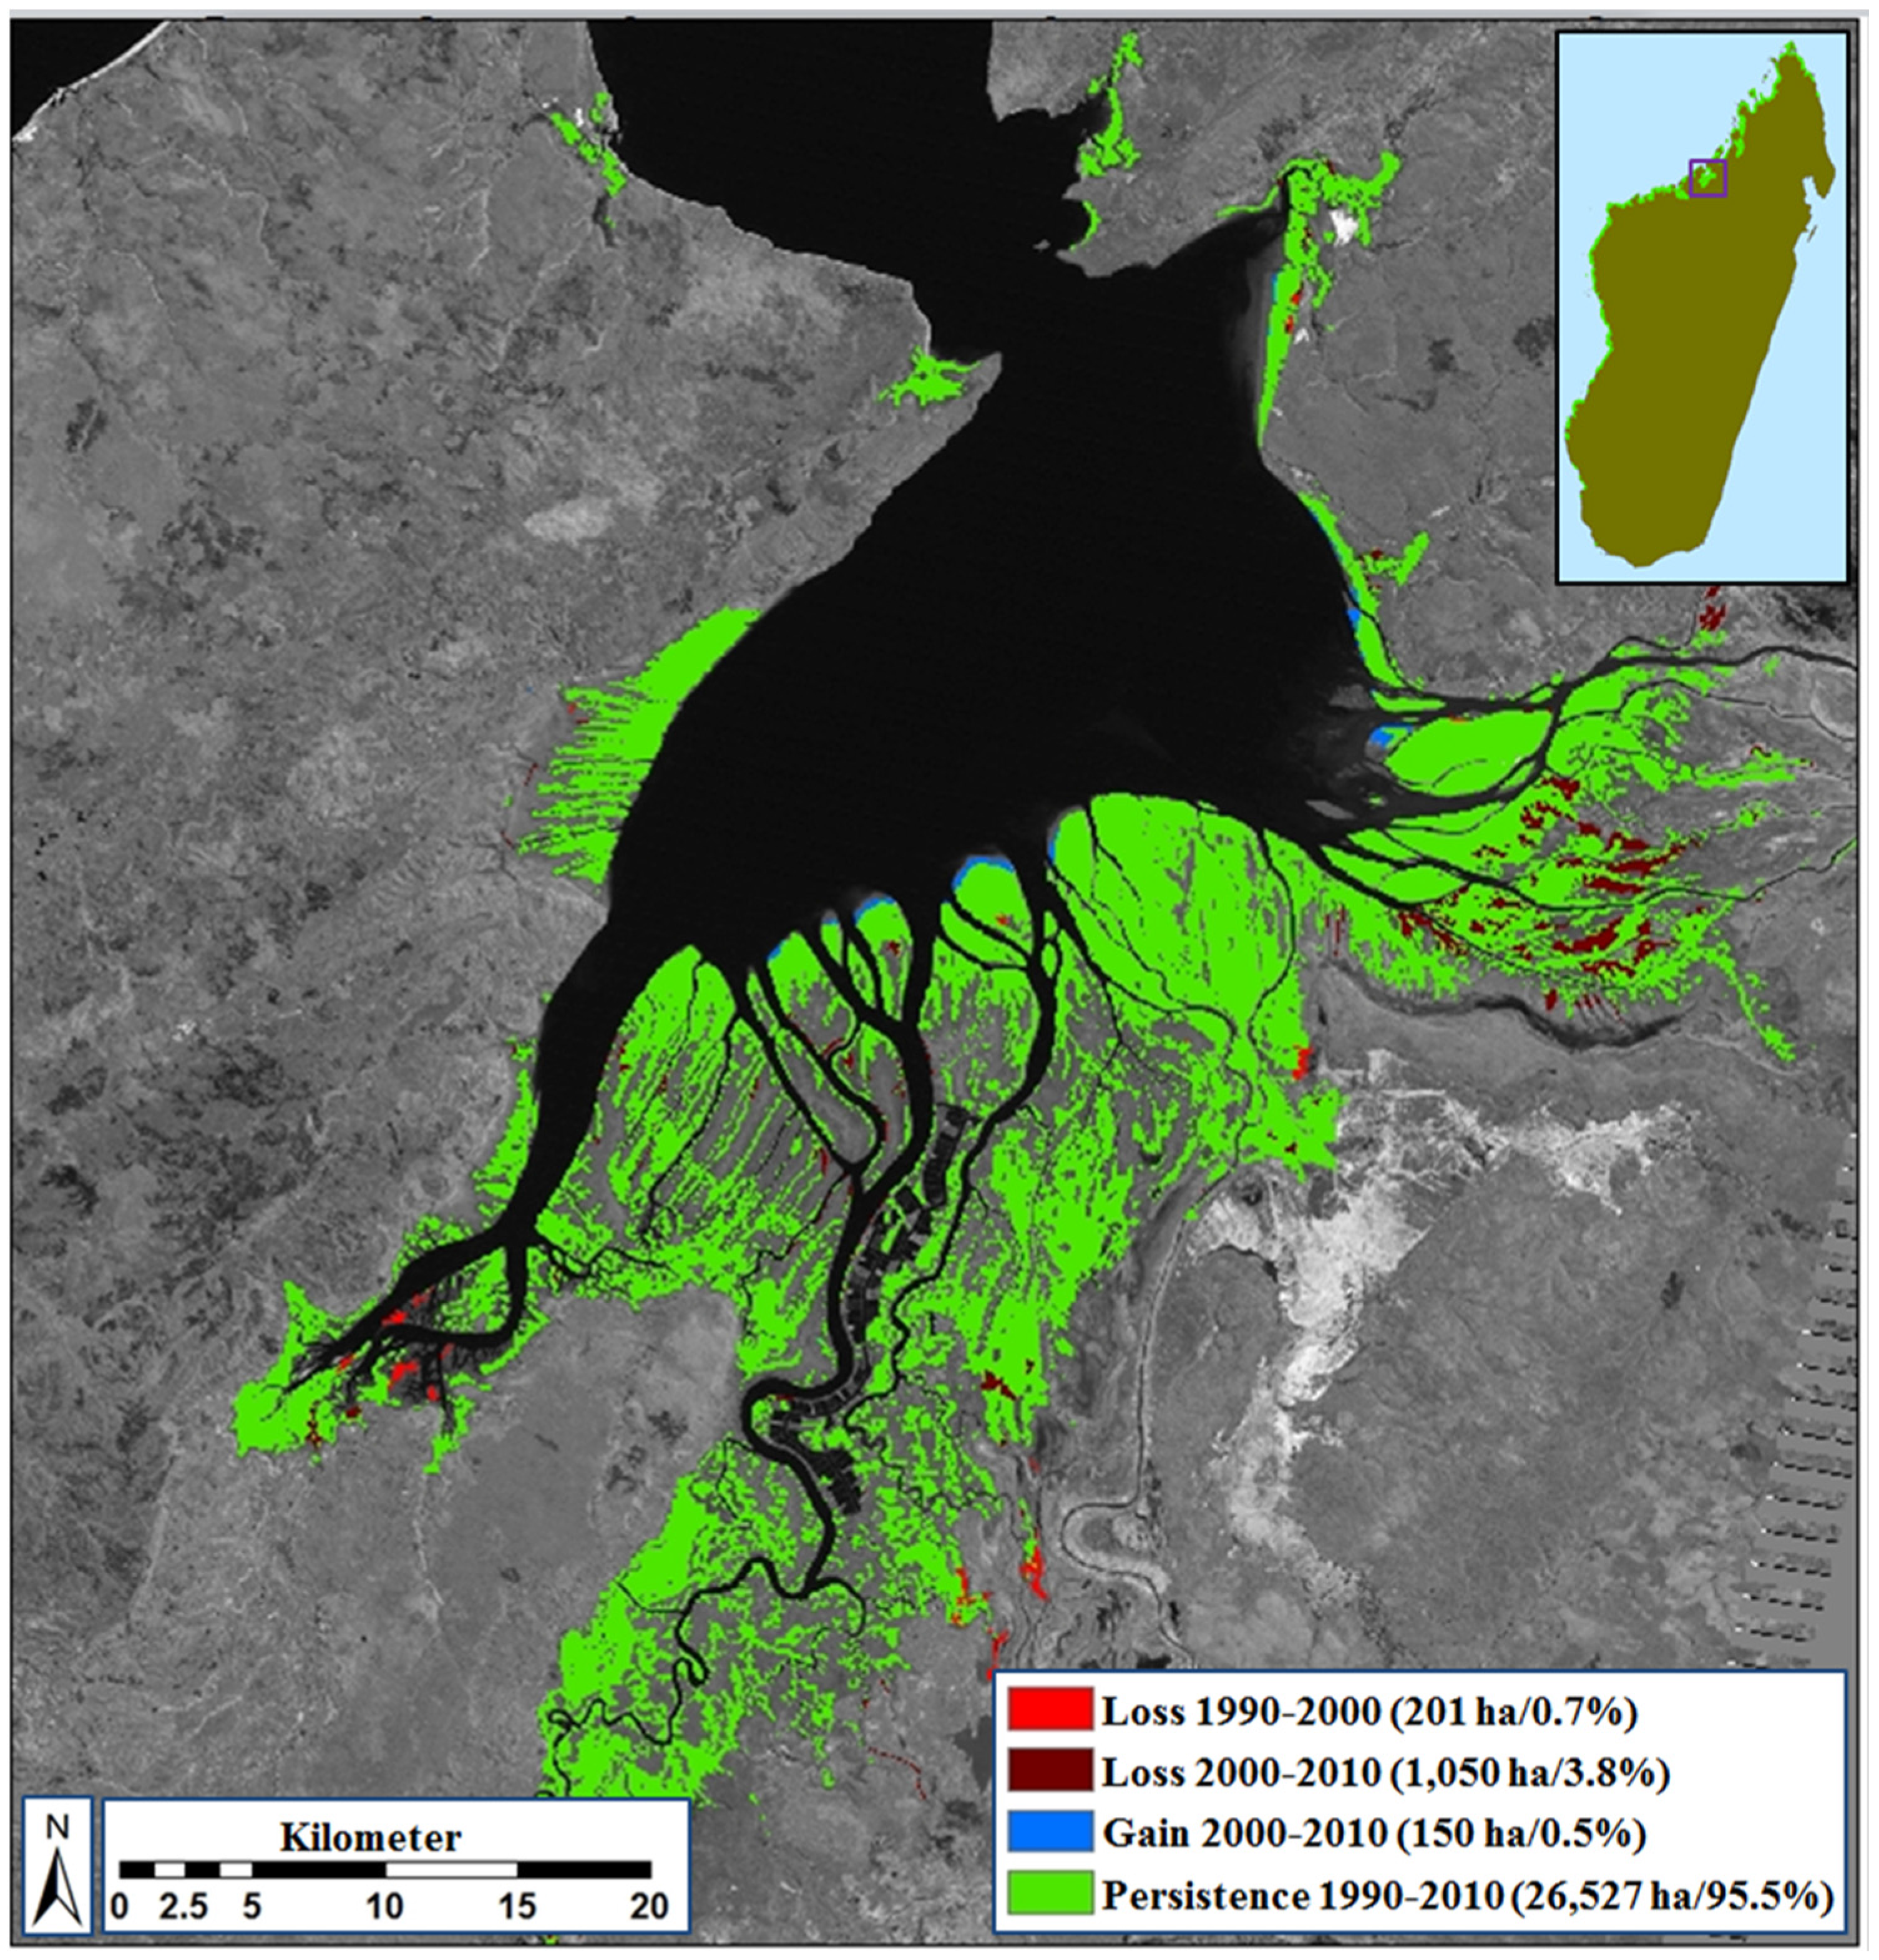
3.1. Overview of Existing Mangrove Coverage and Assessment of Long-Term Dynamics

3.2. Class Separability and Image Classification Results

| 1 | 2 | 3 | 4 | 5 | 6 | 7 | 8 | 9 | 10 | Total | User’s (%) | Commission (%) | |
|---|---|---|---|---|---|---|---|---|---|---|---|---|---|
| Active cultivation (1) | 63 | 0 | 0 | 0 | 0 | 0 | 0 | 0 | 0 | 0 | 63 | 100 | 0 |
| Closed-canopy terrestrial forest (2) | 0 | 62 | 0 | 0 | 0 | 0 | 0 | 0 | 0 | 0 | 62 | 100 | 0 |
| Open-canopy terrestrial forest (3) | 0 | 1 | 72 | 0 | 0 | 3 | 0 | 1 | 0 | 0 | 77 | 94 | 6 |
| Closed-canopy mangrove I (4) | 0 | 0 | 0 | 90 | 2 | 0 | 0 | 0 | 0 | 0 | 92 | 98 | 2 |
| Closed-canopy mangrove II (5) | 0 | 0 | 0 | 0 | 88 | 0 | 0 | 0 | 0 | 0 | 88 | 100 | 0 |
| Open-canopy mangrove I (6) | 0 | 0 | 0 | 0 | 0 | 60 | 0 | 0 | 0 | 0 | 60 | 100 | 0 |
| Open-canopy mangrove II (7) | 0 | 0 | 0 | 0 | 0 | 0 | 60 | 0 | 0 | 0 | 60 | 100 | 0 |
| Open-canopy mangrove III (8) | 0 | 0 | 0 | 0 | 0 | 0 | 0 | 62 | 0 | 0 | 62 | 100 | 0 |
| Exposed soil (9) | 0 | 0 | 0 | 0 | 0 | 0 | 0 | 0 | 90 | 0 | 90 | 100 | 0 |
| Exposed mud (10) | 0 | 0 | 0 | 0 | 0 | 0 | 3 | 0 | 0 | 63 | 66 | 95 | 5 |
| Total | 63 | 63 | 72 | 90 | 90 | 63 | 63 | 63 | 90 | 63 | 720 | ||
| Producer’s (%) | 100 | 98 | 100 | 100 | 98 | 95 | 95 | 98 | 100 | 100 | Overall | 98.6 | |
| Omission (%) | 0 | 2 | 0 | 0 | 2 | 5 | 5 | 2 | 0 | 0 | Kappa | 0.9 |
3.3. Ecological Characteristics of Mapped Mangrove Types

| Class | Code | Description | Species Dominance | N | Average tree height (m) | Average dbh (cm) | Average number of trees (ha−1) |
|---|---|---|---|---|---|---|---|
| Closed-canopy mangrove I | CC I | Tall, mature stands of trees; canopy >80% closed | A. marina | 7 | 10.24 ± 0.52 | 13.68 ± 1.01 | 1571 ± 255 |
| R. mucronata | 2 | 5.62 ± 0.55 | 7.27 ± 1.69 | 4900 ± 1500 | |||
| S. alba | 1 | 9.39 | 8.31 | 5100 | |||
| Mixed species | 3 | 12.48 ± 1.40 | 18.18 ± 1.56 | 1108 ± 208 | |||
| Closed-canopy mangrove II | CC II | Tall mature stands of trees; canopy >60% closed | A. marina | 10 | 7.68 ± 0.56 | 12.95 ± 1.26 | 895 ± 102 |
| Mixed species | 2 | 7.74 ± 0.04 | 12.45 ± 0.08 | 1412 ± 12 | |||
| Open-canopy mangrove I | OC I | Short-medium stands of trees/shrubs; canopy 30–70% closed; moderately influenced by background soil/mud | A. marina | 6 | 3.32 ± 0.16 | 4.85 ± 0.43 | 1417 ± 226 |
| R. mucronata | 1 | 3.21 | 7.39 | 2200 | |||
| X. granatum | 1 | 5.41 | 10.84 | 1300 | |||
| Mixed species | 5 | 4.33 ± 0.44 | 7.62 ± 0.86 | 1185 ± 237 | |||
| Open-canopy mangrove II | OC II | Short-medium stands of trees/shrubs; canopy 30–70% closed; significantly influenced by background soil/mud | C. tagal | 2 | 3.39 ± 0.18 | 6.18 ± 0.12 | 963 ± 238 |
| R. mucronata | 4 | 4.63 ± 0.30 | 7.85 ± 1.66 | 1388 ± 449 | |||
| Open-canopy mangrove III | OC III | Stunted, short stands, shrub-dominated, very sparse; canopy <30% closed; dominated by exposed soil/mud | A. marina | 7 | 2.31 ± 0.17 | 3.96 ± 0.18 | 1089 ± 134 |
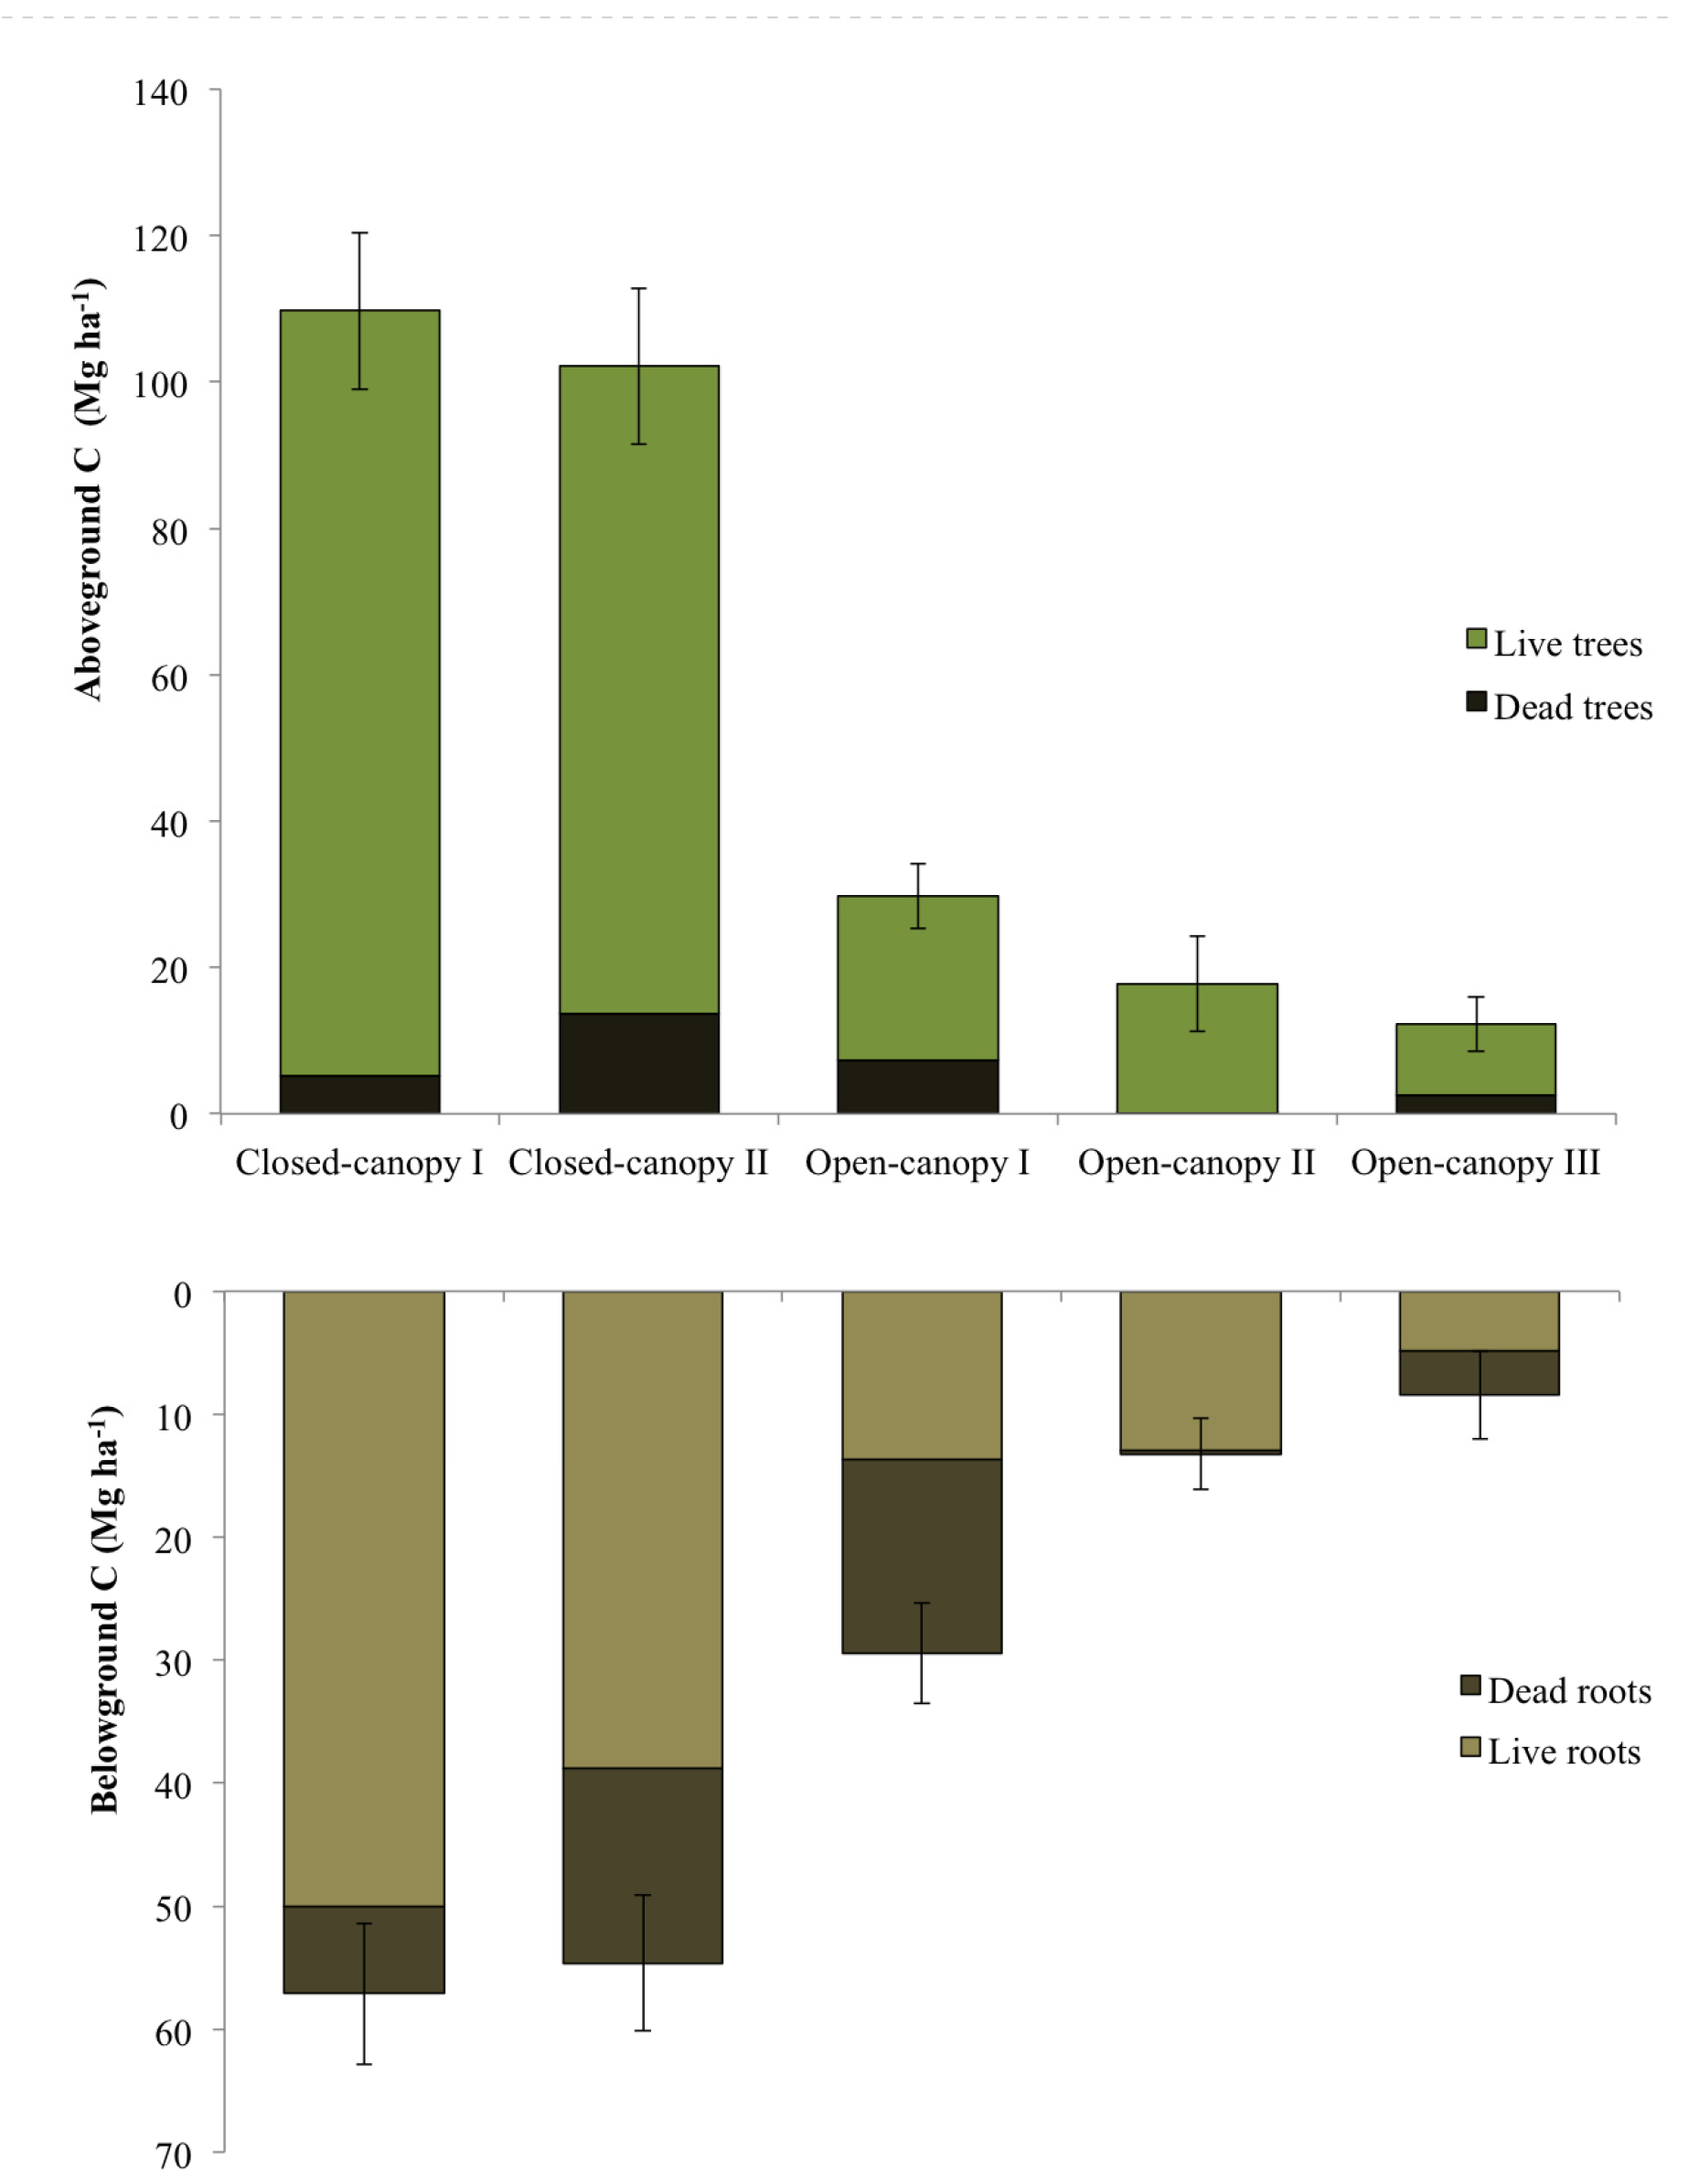
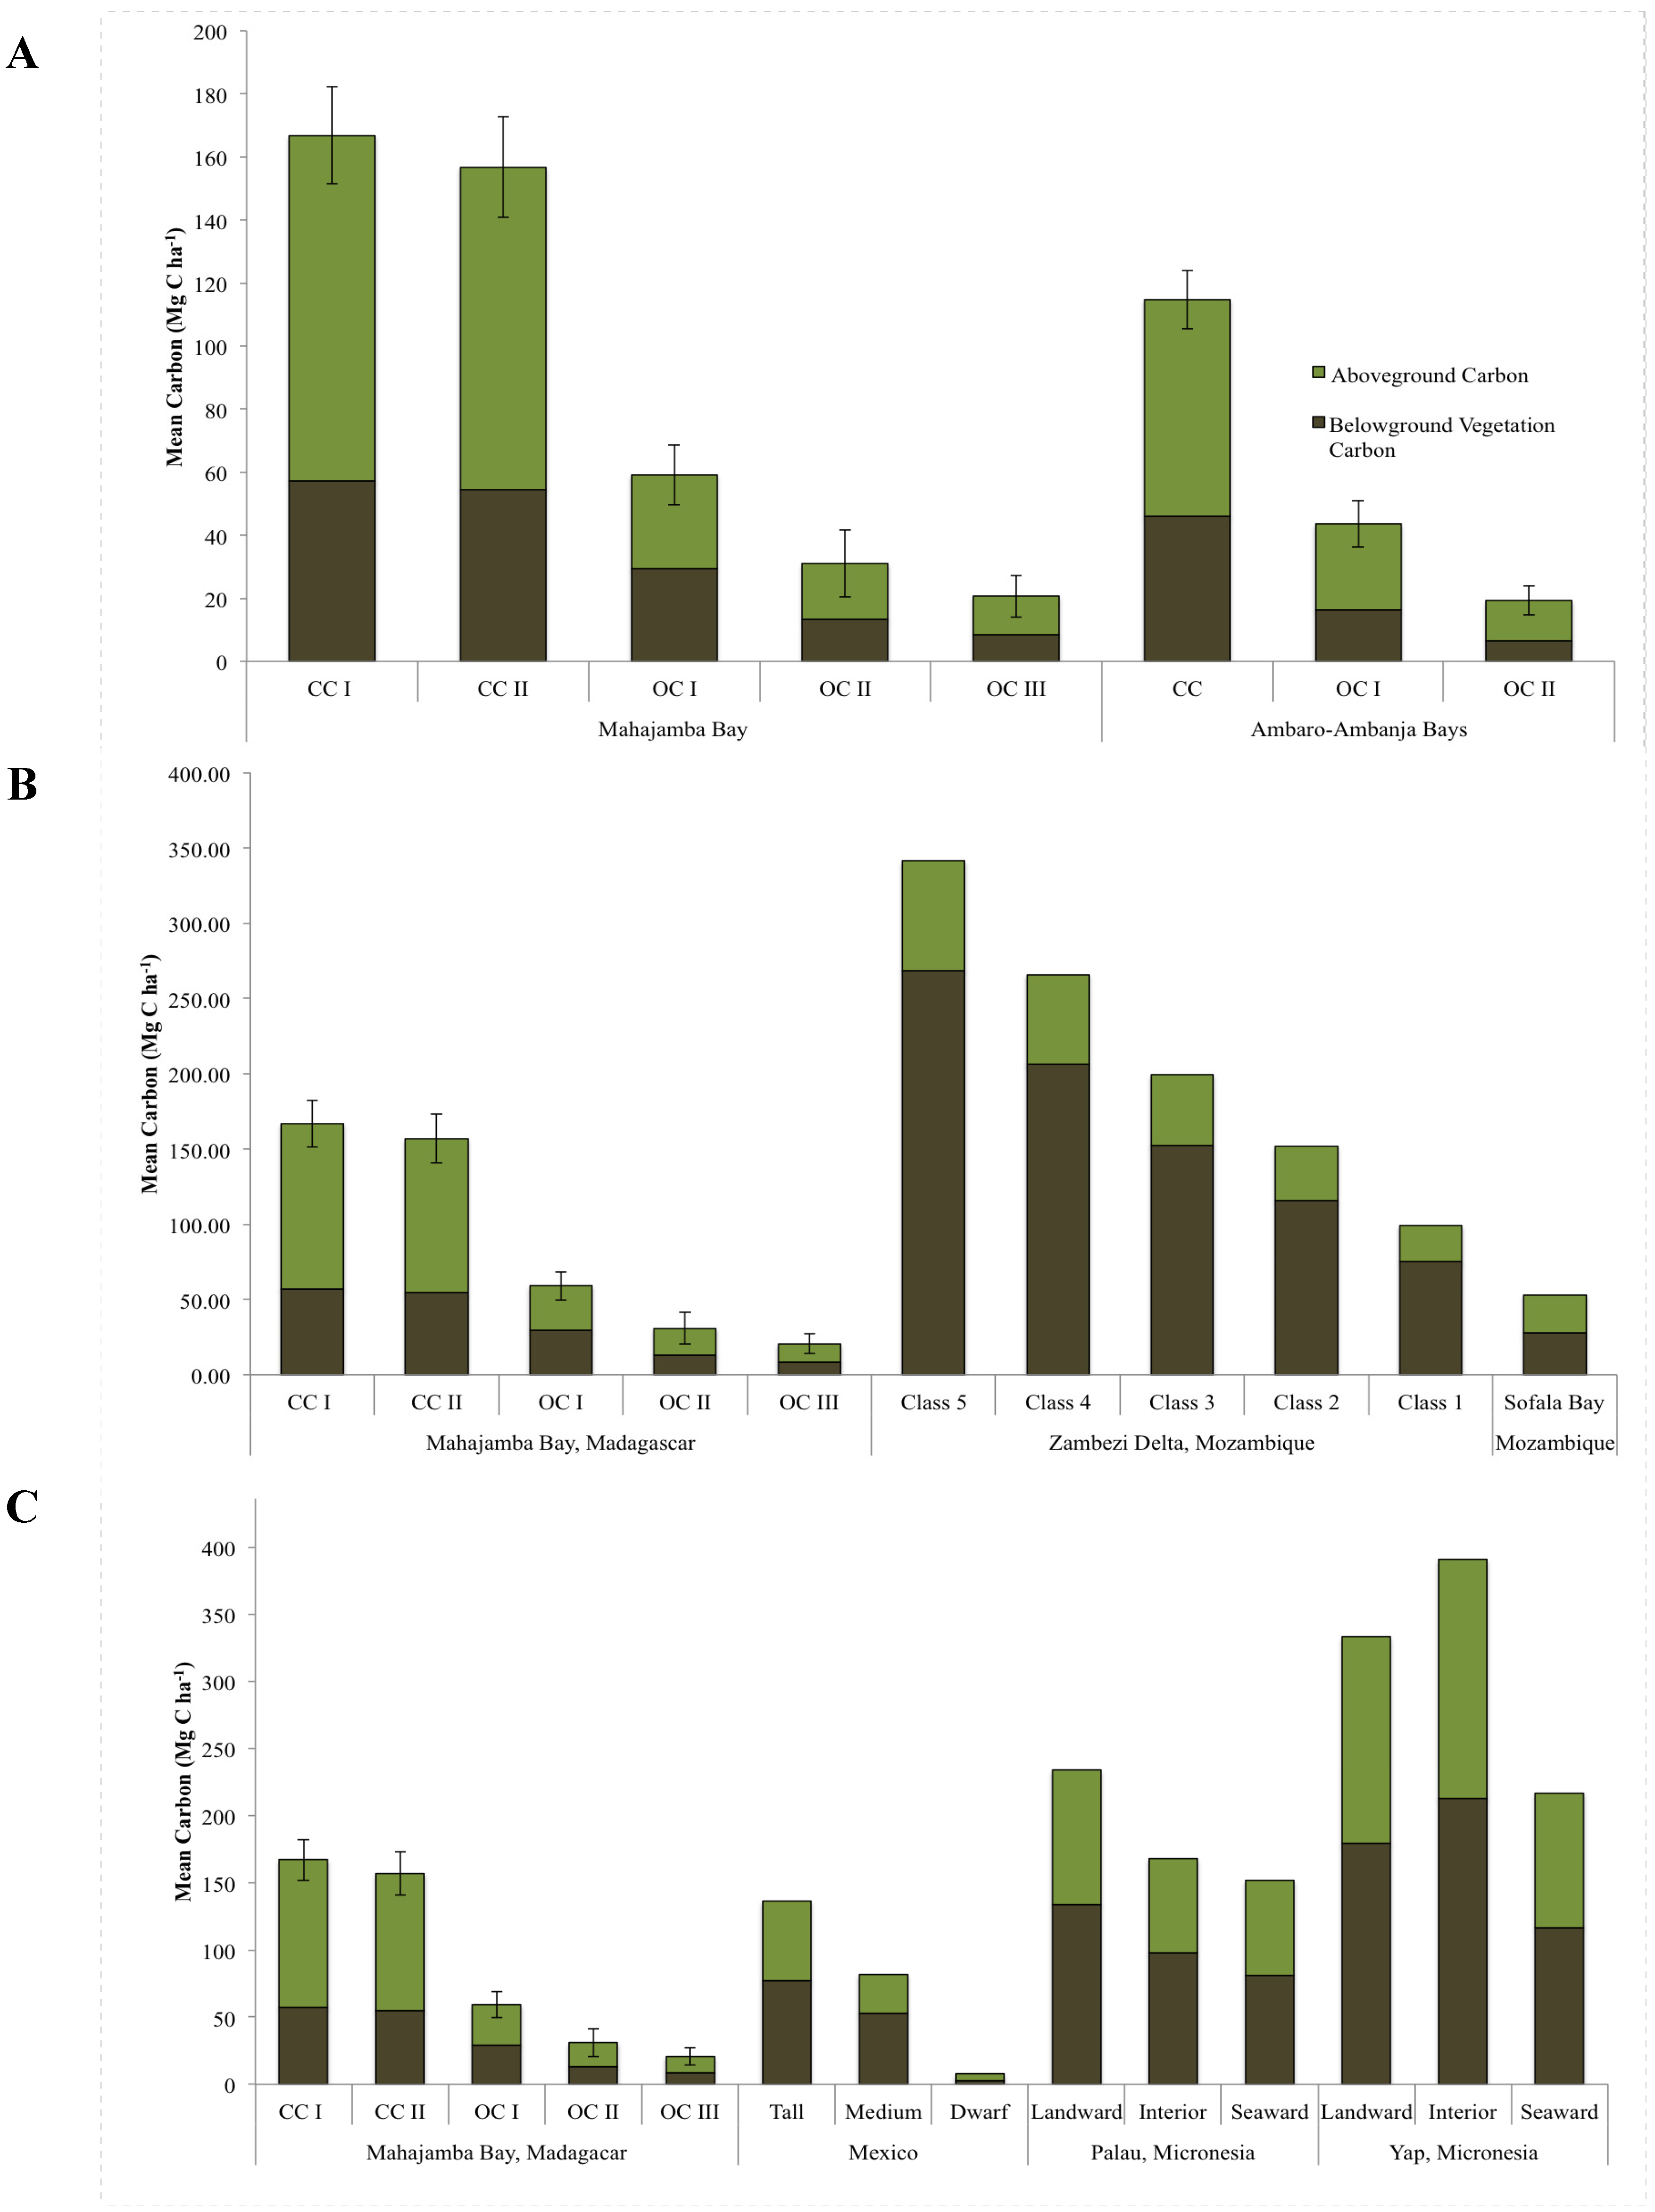
3.4. Carbon Stock Estimates of Mapped Mangrove Types
| Mangrove class | N | Above-ground vegetation carbon (Mg C ha−1) | Below-ground vegetation carbon (Mg C ha−1) | Total vegetation carbon (Mg C ha−1) | ||
|---|---|---|---|---|---|---|
| Live | Dead | Live | Dead | |||
| CC I | 13 | 104.54 ± 11.23 | 5.16 ± 1.55 | 50.07 ± 5.56 | 7.05 ± 1.86 | 166.82 ± 15.38 |
| CC II | 12 | 88.50 ± 9.77 | 13.66 ± 2.66 | 38.82 ± 4.07 | 15.80 ± 3.05 | 156.77 ± 15.98 |
| OC I | 13 | 22.45 ± 3.45 | 7.27 ± 1.93 | 13.69 ± 2.51 | 15.72 ± 4.24 | 59.13 ± 9.48 |
| OC II | 6 | 17.66 ± 6.53 | 0.12 ± 0.06 | 12.90 ± 4.14 | 0.33 ± 0.18 | 31.01 ± 10.55 |
| OC III | 7 | 9.68 ± 2.72 | 2.54 ± 1.1 | 4.87 ± 1.38 | 3.57 ± 1.55 | 20.66 ± 6.61 |


4. Conclusions
Acknowledgments
Author contributions
Conflicts of Interest
References
- Lugo, A.E.; Snedaker, S.C. The ecology of mangroves. Annu. Rev. Ecol. Syst. 1974, 5, 39–64. [Google Scholar] [CrossRef]
- Blasco, F.; Bellan, M.F.; Chaudhury, M.U. Estimating the extent of floods in Bangladesh—Using SPOT data. Remote Sens. Environ. 1992, 39, 167–178. [Google Scholar] [CrossRef]
- Marshall, N. Mangrove conservation in relation to overall environmental considerations. Hydrobiologia 1994, 285, 303–309. [Google Scholar] [CrossRef]
- Primavera, J.H. Socio-economic impacts of shrimp culture. Aquac. Res. 1997, 28, 815–827. [Google Scholar] [CrossRef]
- Kathiresan, K.; Bingham, B. Biology of mangroves and mangrove ecosystems. Adv. Mar. Biol. 2001, 40, 81–251. [Google Scholar]
- Alongi, D.M. Present state and future of world’s mangrove forest. Environ. Conserv. 2002, 29, 331–349. [Google Scholar] [CrossRef]
- Mumby, P.J.; Edwards, A.J.; Arias-Gonzáles, E.; Lindeman, K.C.; Blackwell, P.G.; Gall, A.; Gorczynska, M.I.; Harborne, A.R.; Pescod, C.L.; Renken, H.; et al. Mangrove enhance the biomass of coral reef fish communities in the Caribbean. Nature 2004, 427, 533–536. [Google Scholar] [CrossRef] [PubMed]
- Dahdouh-Guebas, F.; Jayatissa, L.P.; di Nitto, D.; Bosire, J.O.; Lo Seen, D.; Koedam, N. How effective were mangroves as a defence against the recent tsunami? Curr. Biol. 2005, 15, R443–R447. [Google Scholar] [CrossRef] [PubMed]
- Barbier, E.B. Natural barriers to natural disasters: Replanting mangroves after tsunami. Front. Ecol. Environ. 2006, 4, 124–131. [Google Scholar] [CrossRef]
- Food and Agricultural Organization (FAO). The World’s Mangroves 1980–2005; FAO: Rome, Italy, 2007; p. 153. [Google Scholar]
- Alongi, D.M. Mangrove forests: Resilience, protection from tsunamis, and responses to global climate change. Estuar. Coast. Shelf Sci. 2008, 76, 1–13. [Google Scholar] [CrossRef]
- Nagelkerken, I.; Blaber, S.J.; Bouillon, S.; Green, P.; Haywood, M.; Kirton, L.G.; Meynecke, J.-O.; Pawlik, J.; Penrose, H.M.; Sasekumar, A.; et al. The habit function of mangroves for terrestrial and marine fauna: A review. Aquat. Bot. 2008, 89, 155–185. [Google Scholar] [CrossRef]
- Alongi, D.M. Carbon payments for mangrove conservation: Ecosystem constraints and uncertainties of sequestration potential. Environ. Sci. Policy 2011, 14, 462–470. [Google Scholar] [CrossRef]
- Donato, D.C.; Kauffman, J.B.; Murdiyarso, D.; Kumianto, S.; Stidham, M.; Kanninen, M. Mangroves among the most carbon-rich forests in the tropics. Nat. Geosci. 2011, 4, 293–297. [Google Scholar] [CrossRef]
- Kuezner, C.; Bluemel, A.; Gebhardt, S.; Quoc, T.V.; Dech, S. Remote sensing of mangrove ecosystems: A review. Remote Sens. 2011, 3, 878–928. [Google Scholar]
- Pendleton, L.; Donato, D.C.; Murray, B.C.; Crooks, S.; Jenkins, W.A.; Sifleet, S.; Craft, C.; Fourqurean, J.W.; Kauffman, J.B.; Marba, N.; et al. Estimating global “blue carbon” emissions from conversion and degradation of vegetated coastal ecosystems. PLoS ONE 2012, 7, e43542. [Google Scholar] [CrossRef] [PubMed] [Green Version]
- Kauffman, J.B.; Heider, C.; Norfolk, J.; Payton, F. Carbon stocks of intact mangroves and carbon emissions arising from their conversion in the Dominican Republic. Ecol. Appl. 2014, 24, 518–527. [Google Scholar] [CrossRef] [PubMed]
- Thompson, B.S.; Clubbe, C.P.; Primavera, J.H.; Curnick, D.; Koldeway, H.J. Locally assessing the economic viability of blue carbon: A case study from Panay Island, the Philippines. Ecosyst. Serv. 2014, 8, 128–140. [Google Scholar] [CrossRef]
- Giri, C.; Long, J.; Abbas, S.; Mani Murali, R.; Qamer, F.M.; Pengra, B.; Thau, D. Distribution and dynamics of mangrove forests of South Asia. J. Environ. Manag. 2015, 148, 101–111. [Google Scholar] [CrossRef] [PubMed]
- Huxham, M.; Emerton, L.; Kairo, J.; Munyi, F.; Abdirizak, H.; Muriuki, T.; Nunan, F.; Briers, R.A. Applying Climate Compatible Development and economic valuation to coastal management: A case study of Kenya’s mangrove forests. J. Environ. Manag. 2015, 157, 168–181. [Google Scholar] [CrossRef] [PubMed]
- Valiela, I.; Bowen, J.L.; York, J.K. Mangrove forests: One of the world’s threatened major tropical environments. Bioscience 2001, 51, 807–815. [Google Scholar] [CrossRef]
- Duke, N.C.; Meynecke, J.O.; Dittmann, S.; Ellison, A.M.; Anger, K.; Berger, U.; Cannicci, S.; Diele, K.; Ewel, K.C.; Field, C.D.; et al. A world without mangroves? Science 2007, 317, 41–42. [Google Scholar] [CrossRef] [PubMed] [Green Version]
- Spalding, M.; Kainuma, M.; Collins, L. World Atlas of Mangroves; Earthscan: London, UK, 2010. [Google Scholar]
- Friess, D.A.; Webb, E.L. Variability in mangrove change estimates and implications for the assessment of ecosystem provision. Glob. Ecol. Biogeogr. 2013, 23, 715–725. [Google Scholar] [CrossRef]
- Alongi, D.M. The Impact of Climate Change on Mangrove Forests. Curr. Clim. Chang. Rep. 2015, 1, 30–39. [Google Scholar] [CrossRef]
- Polidoro, B.A.; Carpenter, K.E.; Collins, L.; Duke, N.C.; Ellison, A.M.; Ellison, J.C.; Farnsworth, E.J.; Fernando, E.S.; Kathiresan, K.; Koedam, N.E.; et al. Mangrove extinction risk and geographic areas of global concern. PLoS ONE 2010, 5, e10095. [Google Scholar] [CrossRef] [PubMed]
- Daru, B.H.; Yessoufou, K.; Mankga, L.T.; Davies, J. A Global Trend towards the Loss of Evolutionarily Unique Species in Mangrove Ecosystems. PLoS ONE 2013, 8, 1–9. [Google Scholar] [CrossRef] [PubMed]
- Farnsworth, E.J.; Ellison, A.M. The global conservation status of mangroves. AMBIO 1997, 26, 328–334. [Google Scholar]
- Primavera, J.H. Development and conservation of Philippine mangroves: Institutional issues. Ecol. Econ. 2000, 35, 91–106. [Google Scholar] [CrossRef]
- Dahdouh-Guebas, F. The use of remote sensing and GIS in the sustainable management of tropical coastal ecosystems. Environ. Dev. Sustain. 2002, 4, 93–112. [Google Scholar] [CrossRef]
- Primavera, J.H. Mangroves, fishponds, and the quest for sustainability. Science 2005, 310, 57–59. [Google Scholar] [CrossRef] [PubMed]
- Gopal, B.; Chauhan, M. Biodiversity and its conservation in the Sundarban Mangrove Ecosystem. Aquat. Sci. 2006, 68, 338–354. [Google Scholar] [CrossRef]
- Primavera, J.H. Overcoming the impacts of aquaculture on the coastal zone. Ocean Coast. Manag. 2006, 49, 531–545. [Google Scholar] [CrossRef]
- Gilman, E.L.; Ellison, J.; Duke, N.C.; Field, C. Threats to mangroves from climate change and adaptation options: A review. Aquat. Bot. 2008, 89, 237–250. [Google Scholar] [CrossRef]
- Walters, B.B.; Rönnbäck, P.; Kovacs, J.M.; Crona, B.; Hussain, S.A.; Badola, R.; Primavera, J.H.; Barbier, E.; Dahdouh-Guebas, F. Ethnobiology, socio-economics and management of mangrove forests: A review. Aquat. Bot. 2008, 89, 220–236. [Google Scholar] [CrossRef]
- Webb, E.L.; Jachowski, N.R.A.; Phelps, J.; Friess, D.A.; Than, M.M.; Ziegler, A.D. Deforestation in the Ayeyarwady Delta and the conservation implications of an internationally-engaged Myanmar. Glob. Environ. Chang. 2014, 24, 321–333. [Google Scholar] [CrossRef]
- Sitoe, A.A.; Mandlate, L.J.C.; Guedes, B.S. Biomass and Carbon Stocks of Sofala Bay Mangrove Forests. Forests 2014, 5, 1967–1981. [Google Scholar] [CrossRef]
- Field, C.D. Impact of expected climate change on mangroves. Hydrobiologia 1995, 295, 75–81. [Google Scholar] [CrossRef]
- Krauss, K.W.; Lovelock, C.E.; McKee, K.L.; Lopez-Hoffman, L.; Ewe, S.M.L.; Sousa, W.P. Environmental drivers in mangrove establishment and early development: A review. Aquat. Bot. 2008, 89, 105–127. [Google Scholar] [CrossRef]
- Chan, H.T.; Baba, S. Manual on Guidelines for Rehabilitation of Coastal Forests Damaged by Natural Hazards in the Asia-Pacific Region; International Society for Mangrove Ecosystems (ISME) and International Tropical Timber Organization (ITTO): Okinawa, Japan, 2009; p. 66. [Google Scholar]
- Suzuki, T.; Zijlema, M.; Burger, B.; Meijer, M.C.; Narayan, S. Wave dissipation by vegetation with layer schematization in SWAN. Coast. Eng. 2012, 59, 64–71. [Google Scholar] [CrossRef]
- Di Nitto, D.; Neukermans, G.; Koedman, N.; Defever, H.; Pattyn, F.; Kairo, J.G.; Dahdouh-Guebas, F. Mangroves facing climate change: landward migration potential in response to projected scenarios of sea level rise. Biogeosciences 2014, 11, 857–871. [Google Scholar] [CrossRef]
- Heumann, B.W. Satellite remote sensing of mangrove forests: Recent advances and future opportunities. Prog. Phys. Geogr. 2011, 35, 87–108. [Google Scholar] [CrossRef]
- Manson, F.J.; Loneragan, N.R.; McLeod, I.M.; Kenyon, R.A. Assessing techniques for estimating the extent of mangroves: Topographic maps, aerial photographs, and Landsat TM images. Mar. Freshw. Res. 2001, 52, 787–792. [Google Scholar] [CrossRef]
- Ruiz-Luna, A.; Berlanga-Robles, C.A. Land use, land cover changes and coastal lagoon surface reduction associated with urban growth in northwest Mexico. Landsc. Ecol. 2003, 18, 159–171. [Google Scholar] [CrossRef]
- Cornejo, R.H.; Koedam, N.; Luna, A.R.; Troell, M.; Dahdouh-Guebas, F. Remote sensing and ethno- botanical assessment of the mangrove forest changes in the Navachiste-San Ignacio-Macapule lagoon complex, Sinaloa, Mexico. Ecol. Soc. 2005, 10, 16. [Google Scholar]
- Beland, M.; Goita, K.; Bonn, F.; Pham, T.T.H. Assessment of land-cover changes related to shrimp aquaculture using remote sensing data: A case study in the Giao Thuy District, Vietnam. Int. J. Remote Sens. 2006, 27, 1491–1510. [Google Scholar] [CrossRef]
- Giri, C.; Pengra, B.; Zhu, Z.L.; Singh, A.; Tieszen, L.L. Monitoring mangrove forest dynamics of the Sundarbans in Bangladesh and India using multi-temporal satellite data from 1973 to 2000. Estuar. Coast. Shelf Sci. 2007, 73, 91–100. [Google Scholar] [CrossRef]
- Giri, C.; Zhu, Z.; Tieszen, L.L.; Singh, A.; Gillette, S.; Kelmelis, J.A. Mangrove forest distributions and dynamics (1975–2005) of the tsunami-affected region of Asia. J. Biogeogr. 2008, 35, 519–528. [Google Scholar] [CrossRef]
- Liu, K.; Li, X.; Shi, X.; Wang, S.G. Monitoring mangrove forest changes using remote sensing and GIS data with decision-tree learning. Wetlands 2008, 28, 336–346. [Google Scholar] [CrossRef]
- Paling, E.I.; Kobryn, H.T.; Humphreys, G. Assessing the extent of mangrove change caused by Cyclone Vance in the eastern Exmouth Gulf, northwestern Australia. Estuar. Coast. Shelf Sci. 2008, 77, 603–613. [Google Scholar] [CrossRef]
- Giri, C.; Ochieng, E.; Tieszen, L.L.; Zhu, Z.; Singh, A.; Loveland, T.; Masek, J.; Duke, N. Status and distribution of mangrove forests of the world using earth observation satellite data. Glob. Ecol. Biogeogr. 2011, 20, 154–159. [Google Scholar] [CrossRef]
- Alsaaideh, B.; Al-Hanbali, A.; Tateishi, R.; KoBayashi, T.; Hoan, N.T. Mangrove forests mapping in the southern part of Japan using Landsat ETM+ with DEM. J. Geogr. Inf. Syst. 2013, 5, 369–377. [Google Scholar] [CrossRef]
- Li, M.S.; Mao, L.J.; Shen, W.J.; Liu, S.Q.; Wei, A.I. Change and fragmentation trends of Zhanjiang mangrove forests in southern China using multi-temporal Landsat imagery (1977–2010). Estuar. Coast. Shelf Sci. 2013, 130, 111–120. [Google Scholar] [CrossRef]
- Nguyen, H.; McAlpine, C.; Pullar, D.; Johansen, K.; Duke, N. The relationship of spatial-temporal changes in fringe mangrove extent and adjacent land-use: Case study of Ken Giang coast, Vietnam. Ocean Coast. Manag. 2013, 76, 12–22. [Google Scholar] [CrossRef]
- Jones, T.G.; Ratsimba, H.R.; Ravaoarinorotsihoarana, L.; Cripps, G.; Bey, A. Ecological Variability and Carbon Stock Estimates of Mangrove Ecosystems in Northwestern Madagascar. Forests 2014, 5, 177–205. [Google Scholar] [CrossRef]
- Giri, C.; Muhlhausen, J. Mangrove forest distributions and dynamics in Madagascar (1975–2005). Sensors 2008, 8, 2104–2117. [Google Scholar] [CrossRef]
- Giri, C. National-Level Mangrove Cover Data-Sets for 1990, 2000 and 2010; United States Geological Survey: Sioux Falls, SD, USA, 2011.
- Rasolofoharinoro, M.; Blasco, F.; Bellan, M.F.; Aizpuru, M.; Gauquelin, T.; Denis, J. A remote sensing based methodology for mangrove studies in Madagascar. Int. J. Remote Sens. 1998, 19, 1873–1886. [Google Scholar] [CrossRef]
- Pasqualini, V.; Iltis, J.; Dessay, N.; Lointier, M.; Guelorget, O.; Polidori, L. Mangrove mapping in North-Western Madagascar using SPOT-XS and SIR-C radar data. Hydrobiologia 1999, 413, 127–133. [Google Scholar] [CrossRef]
- Guillet, M.; Renou, E.; Robin, M.; Debaine, F.; Ratsivalaka, S. Suivi et analyze de l’evolution de la mangrove de Mahajamba (Nord-ouest de Madagascar). In Proceedings of the International Pluridisciplinary Conference, Lille, France, 16–18 January 2008.
- Rasofolo, M.V. Use of mangroves by traditional fishermen in Madagascar. Mangroves Salt Marshes 1997, 1, 243–253. [Google Scholar] [CrossRef]
- Cornell University, 2001. The Commune Census by the ILO program of Cornell University in collaboration with FOFIFA and INSTAT. Available online: http://www.ilo.cornell.edu/ilo/data.html (accessed on 1 June 2012).
- Mayaux, P.; Gond, V.; Bartholome, E. A near-real time forest-cover map of Madagascar derived from SPOT-4 VEGETATION data. Int. J. Remote Sens. 2000, 21, 3139–3144. [Google Scholar] [CrossRef]
- Critical Ecosystem Partnership Fund (CEPF). Madagascar Vegetation Mapping Project; CEPF: Arlington, VA, USA, 2007. [Google Scholar]
- Harper, G.J.; Steininger, M.K.; Tucker, C.J.; Juhn, D.; Hawkins, F. Fifty years of deforestation and forest fragmentation in Madagascar. Environ. Conserv. 2007, 34, 325–333. [Google Scholar] [CrossRef]
- Richards, M.; Panfil, S.N. Social and Biodiversity Impact Assessment (SBIA) Manual for REDD+ Projects: Part 1—Core Guidance for Project Proponents; Climate, Community & Biodiversity Alliance, Forest Trends, Fauna & Flora International, and Rainforest Alliance: Washington, DC, USA, 2011. [Google Scholar]
- Richards, M. Social and Biodiversity Impact Assessment (SBIA) Manual for REDD+ Projects: Part 2—Social Impact Assessment Toolbox; Climate, Community & Biodiversity Alliance and Forest Trends with Rainforest Alliance and Fauna & Flora International: Washington, DC, USA, 2011. [Google Scholar]
- Chavez, P.S. Image-based atmospheric corrections: Revisited and improved. Photogramm. Eng. Remote Sens. 1996, 62, 1025–1036. [Google Scholar]
- Kirui, K.B.; Kairo, J.G.; Bosire, J.; Viergever, K.M.; Rudra, S.; Huxham, M.; Briers, R.A. Mapping of mangrove forest land cover change along the Kenya coastline using Landsat imagery. Ocean Coast. Manag. 2013, 83, 19–24. [Google Scholar] [CrossRef]
- Simard, M.; Zhang, K.Q.; Rivera-Monroy, V.H.; Ross, M.S.; Ruiz, P.L.; Castaneda-Moya, E.; Twilley, R.R.; Rodriguez, E. Mapping height and biomass of mangrove forests in Everglades National Park with SRTM elevation data. Photogramm. Eng. Remote Sens. 2006, 72, 299–311. [Google Scholar] [CrossRef]
- Fatoyinbo, T.E.; Simard, M.; Washington-Allen, R.A.; Shugart, H.H. Landscape-scale extent, height, biomass, and carbon estimation of Mozambique’s mangrove forests with Landsat ETM+ and Shuttle Radar Topography Mission elevation data. J. Geophys. Res. Biogeosci. 2008, 113. [Google Scholar] [CrossRef]
- Simard, M.; Rivera-Monroy, V.H.; Mancera-Pineda, J.E.; Castaneda-Moya, E.; Twilley, R.R. A systematic method for 3D mapping of mangrove forests based on Shuttle Radar Topography Mission elevation data, ICEsat/GLAS waveforms and field data: Application to Cienaga Grande de Santa Marta, Colombia. Remote Sens. Environ. 2008, 112, 2131–2144. [Google Scholar] [CrossRef]
- Fatoyinbo, T.E.; Simard, M. Height and biomass of mangroves in Africa from ICESat/GLAS and SRTM. Int. J. Remote Sens. 2013, 34, 668–681. [Google Scholar] [CrossRef]
- Aslan, A.; Rahman, A.F.; Warren, M.; Robeson, S.M.; Darusman, T. Combined Use of Active and Passive Remote Sensing for Mapping Distribution and Biomass of Coastal Mangroves. In Proceedings of the 2014 AGU fall meeting, San Francisco, CA, USA, 15–19 December 2014; p. 0093.
- Bhattarai, B.; Giri, C. Assessment of mangrove forests in the Pacific region using Landsat imagery. J. Appl. Remote Sens. 2011, 5, 053509. [Google Scholar] [CrossRef]
- Long, J.B.; Giri, C. Mapping the Philippines’ mangrove forests using Landsat imagery. Sensors 2011, 11, 2972–2981. [Google Scholar] [CrossRef] [PubMed]
- Tomlinson, P.B. The Botany of Mangroves; Cambridge University Press: Melbourne, Australia, 1986. [Google Scholar]
- Aschbacher, J.; Ofren, R.; Delsol, J.P.; Suselo, T.B.; Vibulsresth, S.; Charrupat, T. An integrated comparative approach to mangrove vegetation mapping using advanced remote sensing and GIS technologies: Preliminary results. Hydrologica 1995, 295, 285–295. [Google Scholar]
- Gao, J.A. Hybrid method toward accurate mapping of mangroves in a marginal habitat from SPOT Multispectral data. Int. J. Remote Sens. 1998, 19, 1887–1899. [Google Scholar] [CrossRef]
- Green, E.P.; Clark, C.D.; Mumby, P.J.; Edwards, A.J.; Ellis, A.C. Remote sensing techniques for mangrove mapping. Int. J. Remote Sens. 1998, 19, 935–956. [Google Scholar] [CrossRef]
- Gao, J.A. Comparative study on spatial and spectral resolutions of satellite data in mapping mangrove forests. Int. J. Remote Sens. 1999, 20, 2823–2833. [Google Scholar] [CrossRef]
- Saito, H.; Bellan, M.F.; Al-Habshi, A.; Aizpuru, M.; Blasco, F. Mangrove research and coastal ecosystem studies with SPOT-4 HRVIR and TERRA ASTER in Arabian Gulf. Int. J. Remote Sens. 2003, 24, 4073–4092. [Google Scholar] [CrossRef]
- Tong, P.H.; Auda, Y.; Populus, J.; Aizpura, M.; Habshi, A.A.; Blasco, F. Assessment from space of mangroves evolution in the Mekong Delta, in relation to extensive shrimp farming. Int. J. Remote Sens. 2004, 25, 4795–4812. [Google Scholar] [CrossRef]
- Jensen, L.S.; Mueller, T.; Tate, K.R.; Ross, D.J.; Magid, J.; Nielsen, N.E. Soil surface CO2 flux as an index of soil respiration in situ: A comparison of two chamber methods. Soil Biol. Biochem. 1996, 28, 1297–1306. [Google Scholar] [CrossRef]
- Kauffman, J.B.; Donato, D.C. Protocols for the Measurement, Monitoring and Reporting of Structure, Biomass and Carbon Stocks in Mangrove Forests. Working Paper 86; CIFOR: Bogor, Indonesia, 2012. [Google Scholar]
- Kauffman, J.B.; Heider, C.; Cole, T.G.; Dwire, K.A.; Donato, D.C. Ecosystem carbon stocks of Micronesian mangrove forests. Wetlands 2011, 31, 343–352. [Google Scholar] [CrossRef]
- Komiyama, A.; Poungparn, S.; Kato, S. Common allometric equations for estimate the tree weight of mangroves. J. Trop. Ecol. 2005, 21, 471–477. [Google Scholar] [CrossRef]
- Simpson, W.T. Method to Estimate Dry-Kiln Schedules and Species Groupings: Tropical and Temperate Hardwoods; US Department of Agriculture, Forest Service, Forest Products Laboratory: Washington, DC, USA, 1996.
- Dharmawan, I.W.S.; Siregar, C.A. Soil carbon and carbon estimation of Avicennia marina (Forsk). Vierh. Stand at Ciasem, Purwakarta. J. Penelit. Hutan dan Konservasi Alam. 2008, 5, 317–328. [Google Scholar]
- Clough, B.F.; Scott, K. Allometric relationships for estimating above-ground biomass in six mangrove species. For. Ecol. Manag. 1989, 27, 117–127. [Google Scholar] [CrossRef]
- Chave, J.; Andalo, C.; Brown, S.; Cairns, M.A.; Chambers, J.Q.; Eamus, D.; Fölster, H.; Fromard, F.; Higuchi, N.; Kira, T.; et al. Tree allometry and improved estimation of carbon stocks and balance in tropical forests. Oecologia 2005, 145, 87–99. [Google Scholar] [CrossRef] [PubMed]
- Cole, T.G.; Ewel, K.; Devoe, N.N. Structure of mangrove trees and forests in Micronesia. For. Ecol. Manag. 1999, 117, 95–109. [Google Scholar] [CrossRef]
- Comley, B.W.T.; McGuinness, K.A. Above- and below-ground biomass, and allometry, of four common northern Australian mangroves. Aust. J. Bot. 2005, 53, 431–436. [Google Scholar] [CrossRef]
- Sinclair, T.T.; Hoffer, R.M.; Schreiber, M.M. Reflectance and internal structure of leaves from several crops during a growing season. Agron. J. 1971, 63, 864–868. [Google Scholar] [CrossRef]
- Elvidge, C.D. Visible and near-infrared reflectance characteristics of dry plant materials. Int. J. Remote Sens. 1990, 11, 1775–1795. [Google Scholar] [CrossRef]
- Curran, P.J. Remote sensing of foliar chemistry. Remote Sens. Environ. 1989, 30, 271–278. [Google Scholar] [CrossRef]
- Tamura, M.; Kikushima, K. Extraction of mangrove forests using a satellite image and a digital elevation model. In Remote Sensing for Agriculture, Ecosystems, and Hydrology X; SPIE: Cardiff, UK, 2008; Volume 7104. [Google Scholar]
- Plugge, D.; Baldauf, T.; Ratsimba, H.R.; Rajoelison, G.; Köhl, M. Combined biomass inventory in the scope of REDD (Reducing Emissions from Deforestation and Forest Degradation). Madag. Conserv. Dev. 2010, 5, 23–34. [Google Scholar] [CrossRef]
- Jones, T.G.; Ratsimba, H.R.; Carro, A.; Ravaoarinorotsihoarana, L.; Glass, L.; Teoh, M.; Benson, L.; Cripps, G.; Giri, C.; Zafindrasilivonona, B.; et al. The mangroves of Ambanja and Ambaro Bays, northwest Madagascar: Historical dynamics, current status and deforestation mitigation strategy. In Estuaries: a Lifeline of Ecosystem Services in Western Indian Ocean; Diop, S., Scheren, P., Eds.; Springer: Berlin, Germany, 2015. [Google Scholar]
- Stringer, C.E.; Trettin, C.C.; Zarnoch, S.J.; Tang, W. The Zambezi River Delta Mangrove Carbon Project: A Pilot Baseline Assessment for REDD+ Reporting and Monitoring; United States Forest Service: Washington, DC, USA, 2014.
- Adame, M.F.; Kauffman, J.B.; Medina, I.; Gamboa, J.N.; Torres, O.; Caamal, J.P.; Reza, M.; Herrera-Silveira, J.A. Carbon stocks of tropical coastal wetlands within the Karstic landscape of the Mexican Caribbean. PLoS ONE 2013, 8, e56569. [Google Scholar] [CrossRef] [PubMed]
- Kauffman, J.B.; Cole, T.G. Micronesian mangrove forest structure and tree responses to a severe typhoon. Wetlands 2010, 30, 1077–1084. [Google Scholar] [CrossRef]
- Twilley, R.R.; Chen, R.H.; Hargis, T. Carbon sinks in mangroves and their implications to carbon budget of tropical coastal ecosystems. Water Air Soil Pollut. 1992, 64, 265–288. [Google Scholar] [CrossRef]
- Komiyama, A.; Ong, J.E.; Poungparn, S. Allometry, biomass, and productivity of mangrove forests: A review. Aquat. Bot. 2008, 89, 128–137. [Google Scholar] [CrossRef]
- Alongi, D.M. The Energetics of Mangrove Forests; Springer Science and Business Media BV: New York, NY, USA, 2009. [Google Scholar]
- Kairo, J.G.; Bosire, J.; Langat, J.; Kirui, B.; Koedam, N. Allometry and biomass distribution in replanted mangrove plantations at Gazi Bay, Kenya. Aquat. Conserv. 2009, 19, S63–S69. [Google Scholar] [CrossRef]
- Camacho, L.D.; Gevana, D.T.; Carandang, A.P.; Sofronio, C.C.; Combalicer, E.A.; Rebugio, L.L.; Youn, Y.-C. Tree biomass and carbon stock of a community-managed mangrove forest in Bohol, Phillipines. For. Sci. Technol. 2011, 7, 161–167. [Google Scholar]
- Mitra, A.; Sengupta, K.; Banerjee, K. Standing biomass and carbon storage of above-ground structures in dominant mangrove trees in the Sundarbans. For. Ecol. Manag. 2011, 261, 1325–1335. [Google Scholar] [CrossRef]
- Abino, A.C.; Castillo, J.A.A.; Lee, Y.J. Assessment of species diversity, biomass and carbon sequestration potential of a natural mangrove stand in Samar, the Philippines. For. Sci. Technol. 2013, 10, 2–8. [Google Scholar] [CrossRef]
- Hutchison, J.; Manica, A.; Swetnam, R.; Balmford, A.; Spalding, M. Predicting global patterns in mangrove forest biomass. Conserv. Lett. 2013, 7, 233–240. [Google Scholar] [CrossRef]
- Cohen, R.; Kaino, J.; Okello, J.A.; Bosire, J.O.; Kairo, J.G.; Huxham, M.; Mencuccini, M. Propogating uncertainty to estimates of above-ground biomass for Kenyan mangroves: A scaling procedure from tree to landscape level. For. Ecol. Manag. 2013, 310, 968–982. [Google Scholar] [CrossRef]
- Ajonina, G.N.; Kairo, J.; Grimsditch, G.; Sembres, T.; Chuyong, G.; Diyouke, E. Assessment of mangrove carbon stocks in Cameroon, Gabon, the Republic of Congo (RoC) and the Democratic Republic of Congo (DRC) including their potential for reducing emissions from deforestation and forest degradation (REDD+). In The Land/Ocean Interactions in the Coastal Zone of West and Central Africa; Diop, S., Barusseau, J.-P., Descamps, C., Eds.; Springer International Publishing: Berlin, Germany, 2014; pp. 177–189. [Google Scholar]
- Hamilton, S.E.; Lovette, J. Ecuador’s Mangrove Forest Carbon Stocks: A Spatiotemporal Analysis of Living Carbon Holdings and Their Depletion since the Advent of Commercial Aquaculture. PLoS ONE 2015, 10, e0118880. [Google Scholar] [CrossRef] [PubMed]
- Golley, F.; Odum, H.T.; Wilson, R.F. The structure and metabolism of a Puerto Rican red mangrove forest in May. Ecology 1962, 43, 9–19. [Google Scholar] [CrossRef]
- Eong, O.J. Mangroves—A carbon source and sink. Chemosphere 1993, 27, 1097–1107. [Google Scholar] [CrossRef]
- Matsui, N. Estimated stocks of organic carbon in mangrove roots and sediments in Hinchinbrook Band, Australia. Mangroves Salt Marshes 1998, 2, 199–204. [Google Scholar] [CrossRef]
- Fujimoto, K.; Imaya, A.; Tabuchi, R.; Kuramoto, S.; Utsugi, H.; Murofushi, T. Belowground C storage of Micronesian mangrove forests. Ecol. Res. 1999, 14, 409–413. [Google Scholar] [CrossRef]
- Ray, R.; Ganguly, D.; Chowdhury, C.; Dey, M.; Das, S.; Dutta, M.K.; Mandal, S.K.; Majumder, N.; De, T.K.; Mukhopadhyay, S.K.; et al. Carbon sequestration and annual increase of carbon stock in a mangrove forest. Atmos. Environ. 2011, 45, 5016–5024. [Google Scholar] [CrossRef]
- Chen, L.; Zeng, X.; Tam, N.F.Y.; Lu, W.; Luo, Z.; Du, X.; Wang, J. Comparing carbon sequestration and stand structure of monoculture and mixed mangrove plantations of Sonneratia caseolaris and S. apetala in Southern China. For. Ecol. Manag. 2012, 284, 222–229. [Google Scholar] [CrossRef]
- Wang, G.; Dongsheng, G.; Peart, M.R.; Chen, Y.; Peng, Y. Ecosystem carbon stocks of mangrove forest in Yingluo Bay, Guangdon Province of South China. For. Ecol. Manag. 2013, 310, 539–546. [Google Scholar] [CrossRef]
- Jardine, S.L.; Siikamäki, J.V. A global predictive model of carbon in mangrove soils. Environ. Res. Lett. 2014, 9, 104013. [Google Scholar] [CrossRef]
- Liu, H.; Ren, H.; Hui, D.; Wang, W.; Liao, B.; Cao, Q. Carbon stocks and potential carbon storage in the mangrove forests of China. J. Environ. Manag. 2014, 133, 86–93. [Google Scholar] [CrossRef] [PubMed]
- De la Cruz, A.A. Tropical wetlands as a carbon source. Aquat. Bot. 1986, 25, 109–115. [Google Scholar] [CrossRef]
- Hooijer, A.; Silvius, M.; Wösten, H.; Page, S. PEAT-CO2: Assessment of CO2 Emissions from Drained Peatlands in SE Asia, Delft Hydraulics, Report Q3943, 1st ed.; Wetlands International, Delft Hydraulics: Delft, The Netherlands, 2006. [Google Scholar]
- Grimsditch, G.; Alder, J.; Nakamura, T.; Kenchington, R.; Tamelander, J. The blue carbon special edition—Introduction and overview. Ocean Coast. Manag. 2013, 83, 1–4. [Google Scholar] [CrossRef]
- Alongi, D.M. Carbon Cycling and Storage in Mangrove Forests. Annu. Review Mar. Science 2014, 6, 195–219. [Google Scholar] [CrossRef] [PubMed]
- Schumacher, B. Methods for the Determination of Total Organic Carbon (TOC) in Soils and Sediments; Ecological Risk Assessment Support Center, Office of Research and Development; US Environmental Protection Agency: Washington, DC, USA, 2002.
- Mikhailova, E.A.; Noble, R.R.P.; Post, C.J. Comparison of soil organic carbon recovery by Walkley-Black and dry combustion methods in the Russian Chernozem. Commun. Soil Sci. Plant Anal. 2003, 34, 1853–1860. [Google Scholar] [CrossRef]
- De Vos, B.; Letterns, S.; Muys, B.; Deckers, J.A. Walkley-Black analysis of forest soil organic carbon: Recovery, limitations and uncertainty. Soil Use Manag. 2007, 23, 221–229. [Google Scholar] [CrossRef]
- Meersmans, J.; van Wesemael, B.; van Molle, M. Determining soil organic carbon for agricultural soils: A comparison between the Walkley & Black and the dry combustion methods (north Belgium). Soil Use Manag. 2009, 25, 346–353. [Google Scholar]
© 2015 by the authors; licensee MDPI, Basel, Switzerland. This article is an open access article distributed under the terms and conditions of the Creative Commons Attribution license ( http://creativecommons.org/licenses/by/4.0/).
Share and Cite
Jones, T.G.; Ratsimba, H.R.; Ravaoarinorotsihoarana, L.; Glass, L.; Benson, L.; Teoh, M.; Carro, A.; Cripps, G.; Giri, C.; Gandhi, S.; et al. The Dynamics, Ecological Variability and Estimated Carbon Stocks of Mangroves in Mahajamba Bay, Madagascar. J. Mar. Sci. Eng. 2015, 3, 793-820. https://doi.org/10.3390/jmse3030793
Jones TG, Ratsimba HR, Ravaoarinorotsihoarana L, Glass L, Benson L, Teoh M, Carro A, Cripps G, Giri C, Gandhi S, et al. The Dynamics, Ecological Variability and Estimated Carbon Stocks of Mangroves in Mahajamba Bay, Madagascar. Journal of Marine Science and Engineering. 2015; 3(3):793-820. https://doi.org/10.3390/jmse3030793
Chicago/Turabian StyleJones, Trevor G., Harifidy Rakoto Ratsimba, Lalao Ravaoarinorotsihoarana, Leah Glass, Lisa Benson, Marianne Teoh, Aude Carro, Garth Cripps, Chandra Giri, Samir Gandhi, and et al. 2015. "The Dynamics, Ecological Variability and Estimated Carbon Stocks of Mangroves in Mahajamba Bay, Madagascar" Journal of Marine Science and Engineering 3, no. 3: 793-820. https://doi.org/10.3390/jmse3030793