1. Introduction
The mooring system is a vital part of offshore wave energy converters (WEC) as it is responsible for the station-keeping of the WEC, but it counts as well for a significant part of the overall cost of the device [
1]. Therefore, it must have a relatively low system and installation cost and be reliable, to ensure there is little downtime and long intervals between maintenance. As the installation timeframe of WECs greatly exceeds five years, they require long-term mooring installation, which is supported by the offshore standard on position mooring DNV-OS-E301 [
2].
This document presents a quasi-static analysis for an ultimate limit state (
I) and sensitivity investigation of two different mooring configurations, which provides a decent preliminary design of the mooring systems [
3,
4]. Although many different types of suitable mooring systems exist for wave energy converters [
5], a traditional three-legged catenary anchor leg mooring (CALM) and a single anchor leg mooring (SALM) are being analyzed here. It aims to indicate what can be expected in terms of requirements for the mooring system size and stiffness. The two mooring systems were subjected to the same reference load case, in order to represent an extreme load scenario of a large floating WEC in intermediate water depths. This reference load case consists of a horizontal design load at the WEC of 2000 kN at a water depth of 30 m, which seems to be representative of large WECs, such as Weptos, Wave Dragon and many others, including reasonable safety factors (
II). However, additional safety factors might be required, for example, for corrosion protection of catenary chains (in the case of the CALM) or the absence of redundancy (in the case of the SALM) (
III). Around this reference scenario, the main influential parameters were modified in order to investigate their impact on the mooring system, e.g., the water depth, the horizontal design load at the WEC and a mooring design parameter.
- (I)
An ultimate limit state (ULS) corresponds to the design criteria where the individual components of the mooring system have adequate strength to withstand the maximum environmental loads [
2].
- (II)
The design of the mooring system for wave energy converters can be performed under consequence class 1 [
6]. This consequence class presents a 1.7 safety factor for the mean and dynamic tension for a ULS quasi-static analysis. To calculate the characteristic strength of a component, the minimum breaking strength is multiplied by a factor of 0.95.
- (III)
In the case that a system does not provide any redundancy, the safety factor is multiplied by a factor of 1.2. Depending on the type of inspection, the corrosion allowance referring to the chain diameter of a suspended catenary chain is 0.2 or 0.3 mm/year.
The SALM system was first developed for the mooring and loading of large tankers offshore in severe environments and was first used in 1969 [
7]. It consists, in this case, of a submerged mooring buoy that is anchored through a tension leg (the tether) by a suction anchor. This buoy is then connected through a hawser to the wave energy converter (WEC).
Spread moorings using catenary lines are commonly used for semi-submersible structures in shallow water. The restoring force from a catenary system comes from the suspended weight of the mooring lines, which changes in configuration with the excursion of the WEC. The mooring lines of the catenary system terminate at the seabed horizontally, which means that the anchor point is only subjected to horizontal forces. This results in relatively long mooring lines compared to the water depth.
2. CALM System
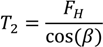
This CALM system consists of three catenary mooring lines (spaced 120 degrees apart), three anchors, an intermediate buoy, and a hawser connecting the buoy to the WEC (see
Figure 1). The restoring force of the system comes from the weight and suspended length of the catenary mooring lines and from the elasticity of the hawser and catenary mooring lines. An overview of the layout of the mooring configuration is given in the next figure (
Figure 1).
Figure 1.
Illustration of the three-legged catenary anchor leg mooring (CALM) system configuration.
Figure 1.
Illustration of the three-legged catenary anchor leg mooring (CALM) system configuration.
Some design criteria are respected:
- -
The length of the mooring lines was calculated such that the anchors are not exposed to vertical forces from the mooring lines.
- -
The design load of all the mooring lines is set equal to the resulting tension in them under the design conditions.
- -
The length of the hawser is 30 m.
- -
The buoy volume was calculated so that its buoyancy force is equal to the combined force of its own weight, the vertical forces from the three mooring lines (combined Tv), half of the weight of the hawser and 250 kg for extra equipment.
- -
The horizontal pretension in the mooring lines was set to 20 kN, which corresponds to 1% of the maximum design load at the WEC.
The elasticity of the mooring lines is considered, while the following assumptions and approximations are made for the calculations:
- -
There is no back mooring line considered.
- -
The sea bed is horizontal.
- -
There is no bending mooring stiffness in the chains.
- -
Dynamic effects in the mooring lines are ignored.
- -
Current forces resulting from the movement of the chains in the water and on the seabed are ignored.
- -
Friction on the seabed is ignored.
- -
Mooring lines have a constant weight per unit length.
- -
The angle between the chains is assumed constant at 120 degrees (as the horizontal excursion is small relative to the length of the chains).
- -
The environmental loads are in line with one of the three mooring lines.
- -
The mooring lines are assumed to be connected to the buoy at mean water level.
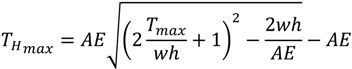
The forces at the different locations and the length of the different components under different tensions, taking the elasticity of the mooring lines into account, can be derived from the following equations [8,9]. First, the horizontal design load (
![Jmse 02 00093 i001]()
) at the buoy can be found based on an assumed resultant tension and other specifications of the system.
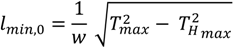
The minimum unstretched length of the chain
lmin,0 (the subscript 0 indicates that it corresponds to the unstretched value) can then be found, which is calculated relative to the necessary chain length so that the anchor will not have any vertical tension.
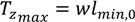
From this, the maximum vertical force at the fairlead on the buoy can be found with
From here, the following steps need to be repeated to obtain the force-displacement curve. First, a value of
Tz needs to be assumed. From this, the unstretched value of
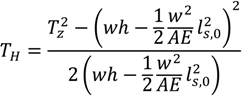
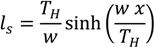
ls,0 can be obtained through (see
Figure 1)
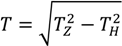
TH can then be calculated with
The resultant force at the fairlead is
Based on this, the length of the hanging part of the chain can be calculated by
The stretched length of
ls, which is the hanging part of the chain, can then be obtained by
The stretched length of the lying part of the line (
l-
ls) has to be calculated with
TH and the elasticity coefficients of the chain.
lmin is equal to
l, as no additional chain length is considered.
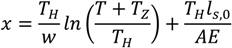
Finally, the horizontal distance between the anchor and the buoy can be found using the stretched values of the lines with
The resulting distance between the buoy and the two other mooring lines can be obtained easily assuming that the angle between the lines remains at all times at 120 degrees. Thereby, the change in distance between the buoy and anchor B and C is half of the increase in distance between anchor A and the buoy.
3. SALM System
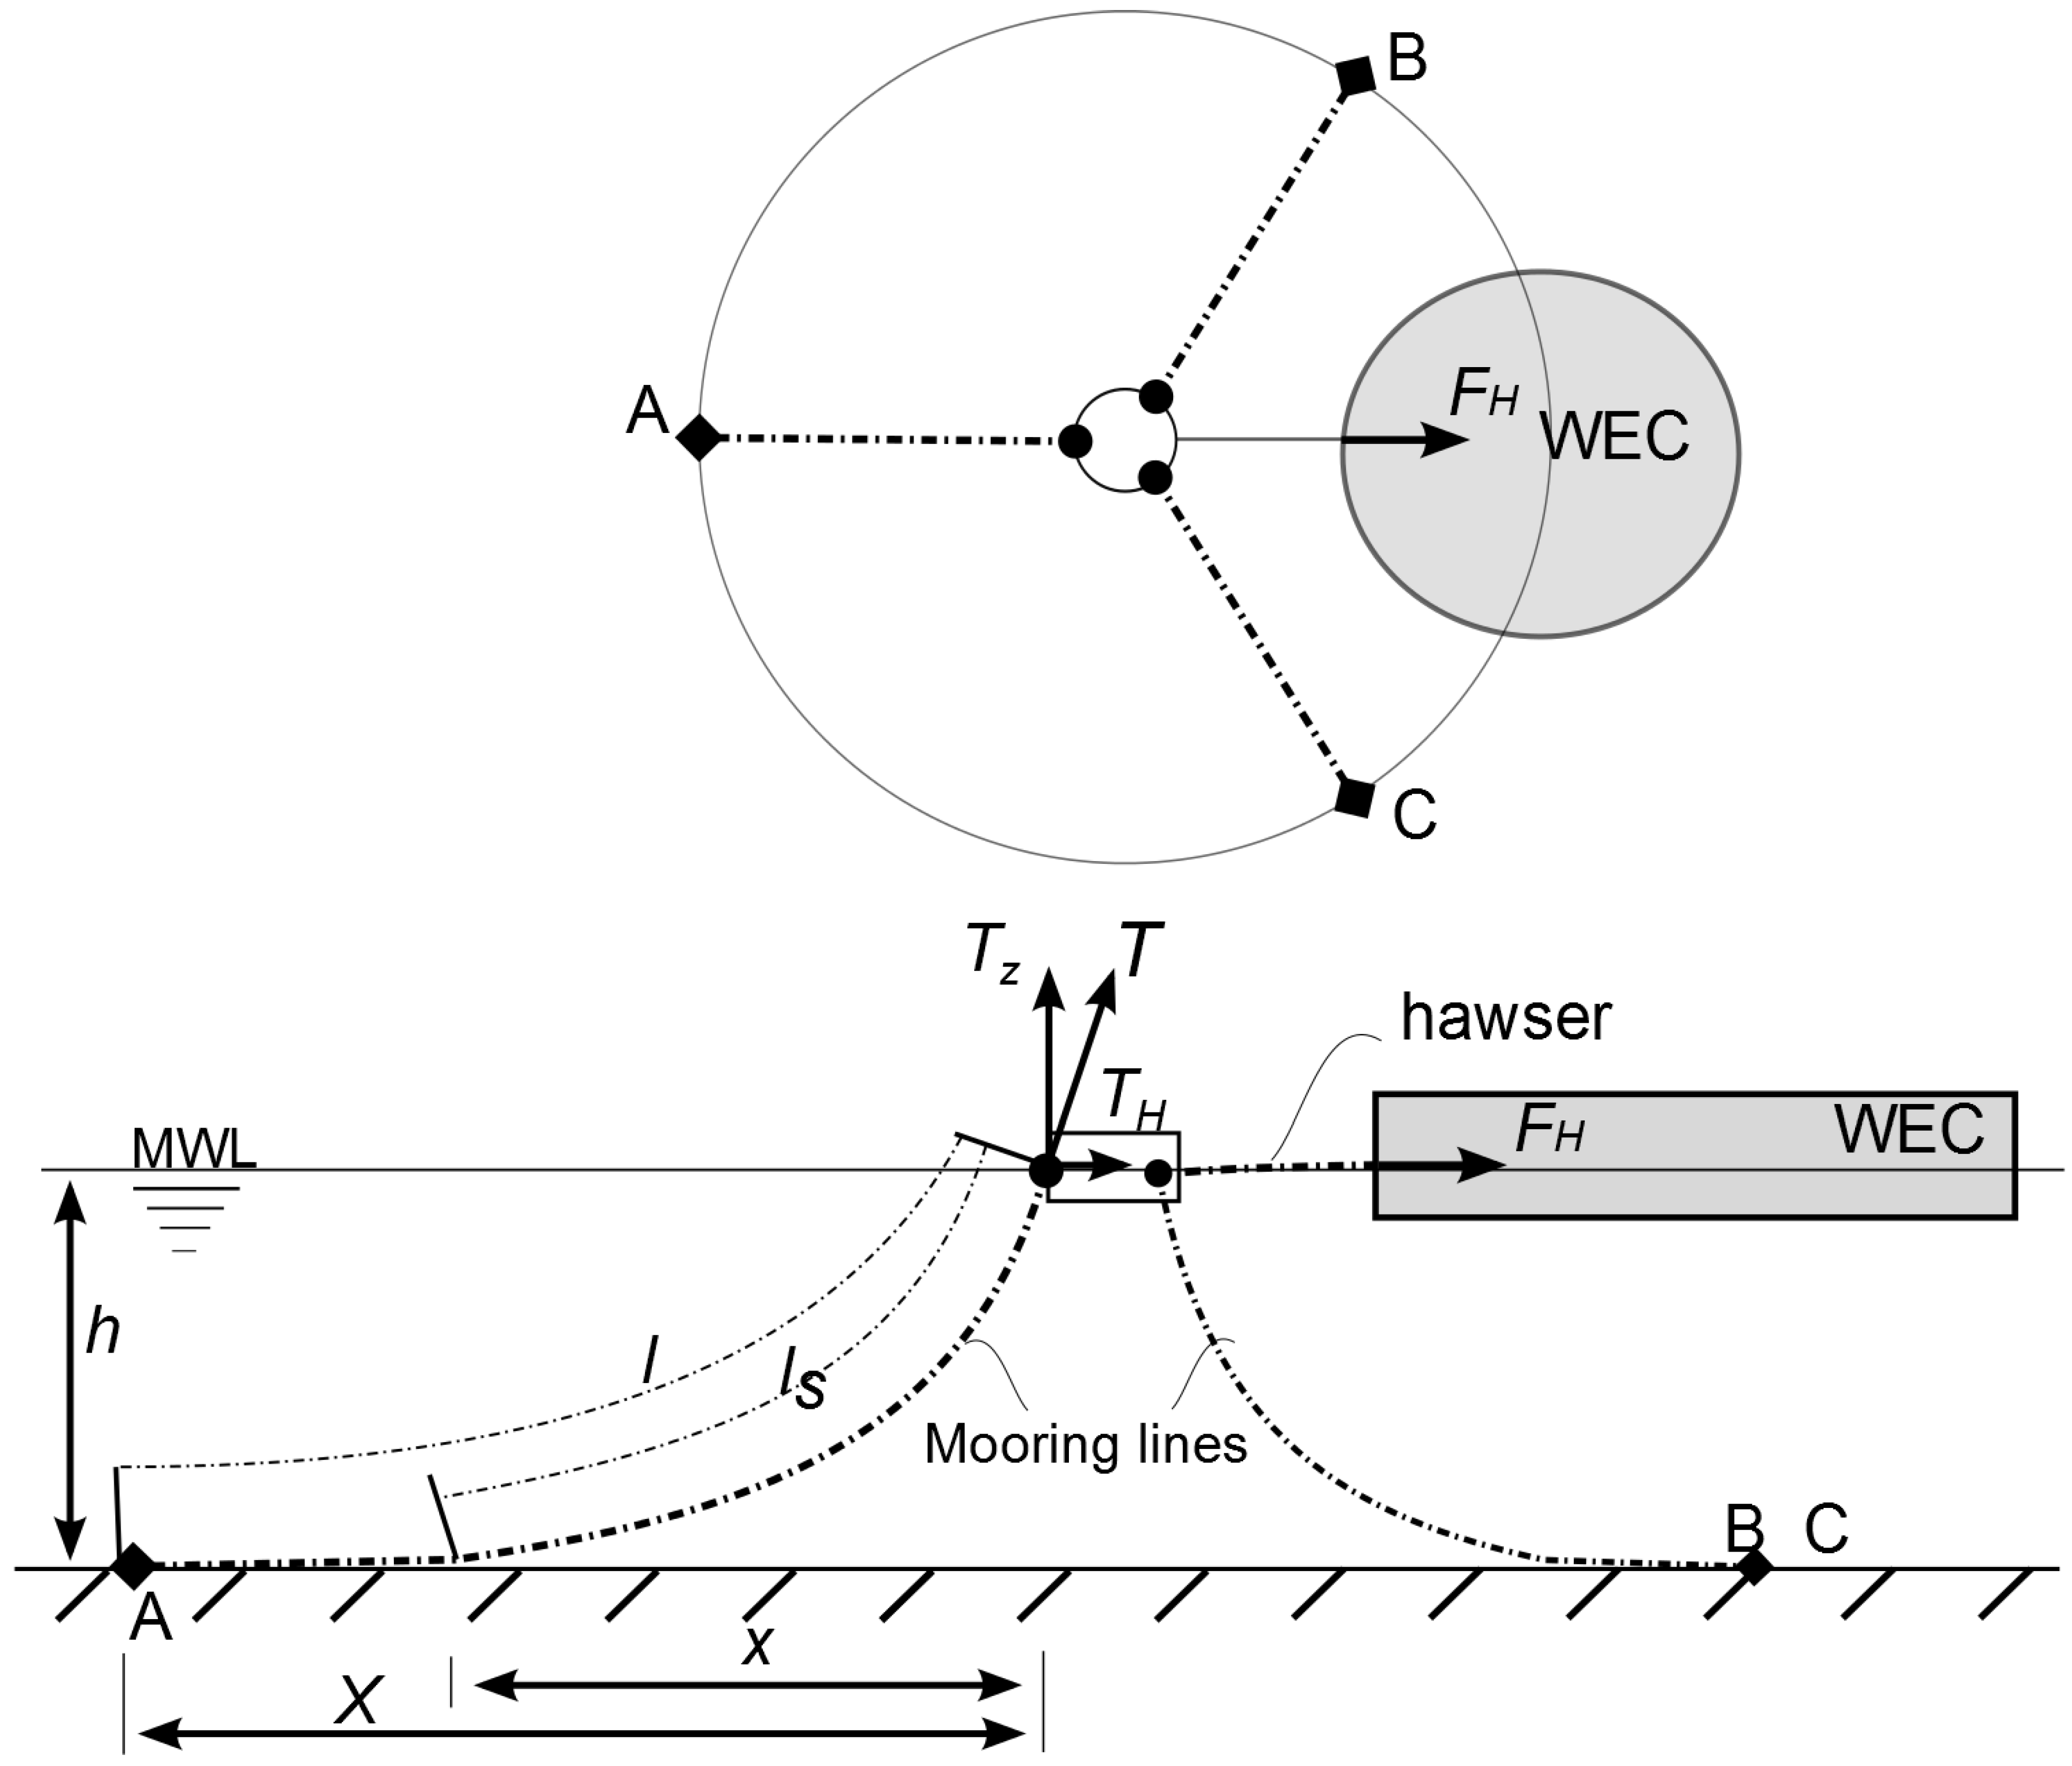
The single anchor leg mooring (SALM) system, also referred to as a tension leg mooring system, consists of an anchor point, which in this case is a suction anchor, two mooring lines (a tether and a hawser) and a submerged buoy (see
Figure 2). The restoring force of the system comes from the buoyancy force of the buoy and the elasticity of the tether and hawser.
Figure 2.
Illustration of the single anchor leg mooring (SALM) system.
Figure 2.
Illustration of the single anchor leg mooring (SALM) system.
Some design criteria are respected:
- -
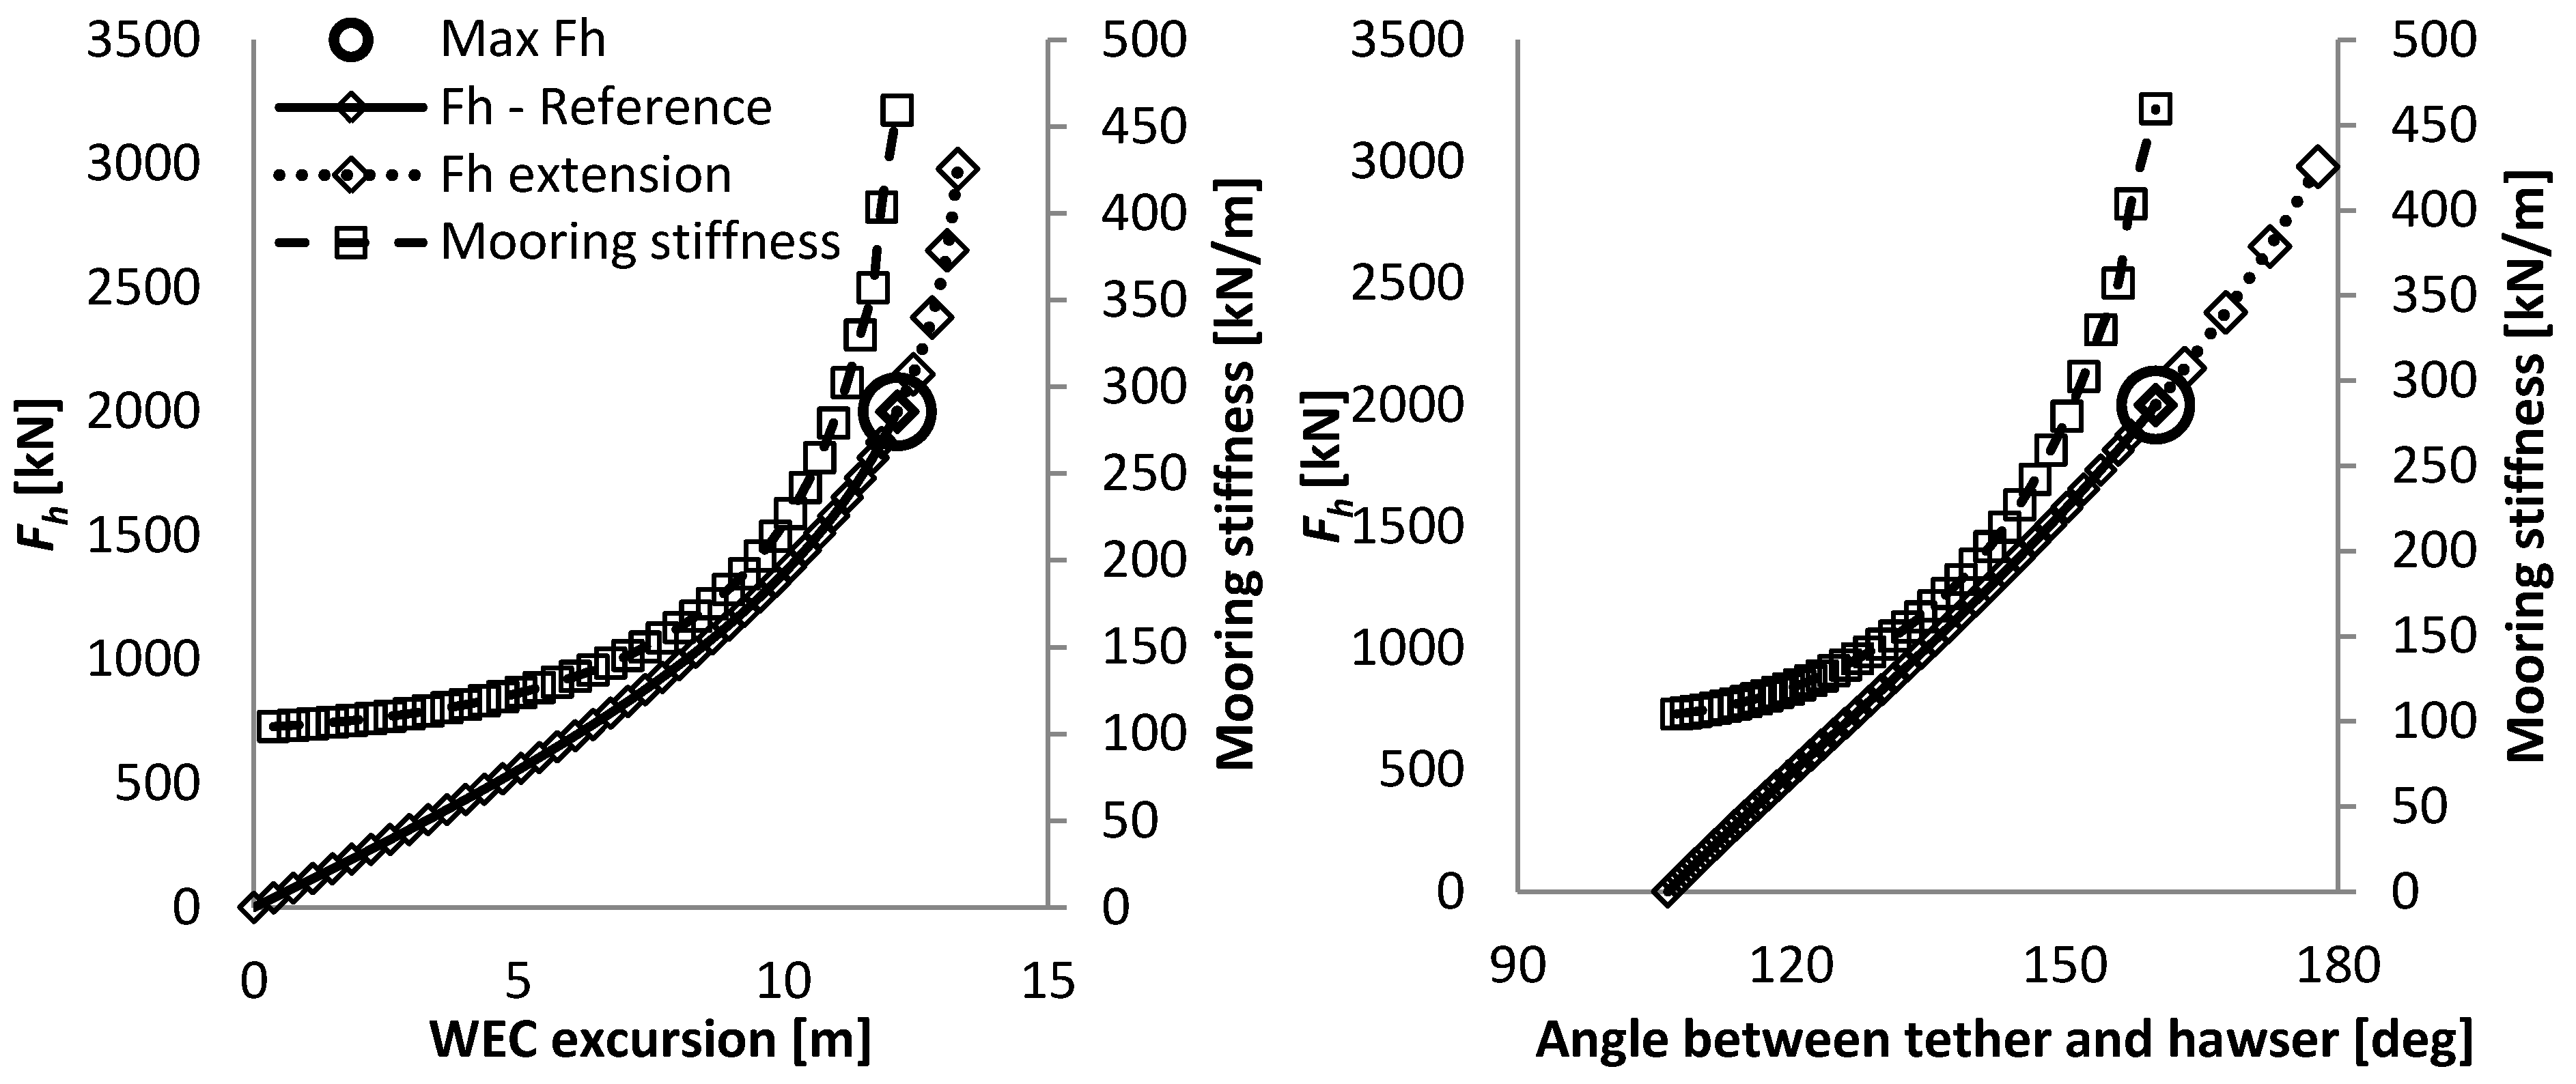
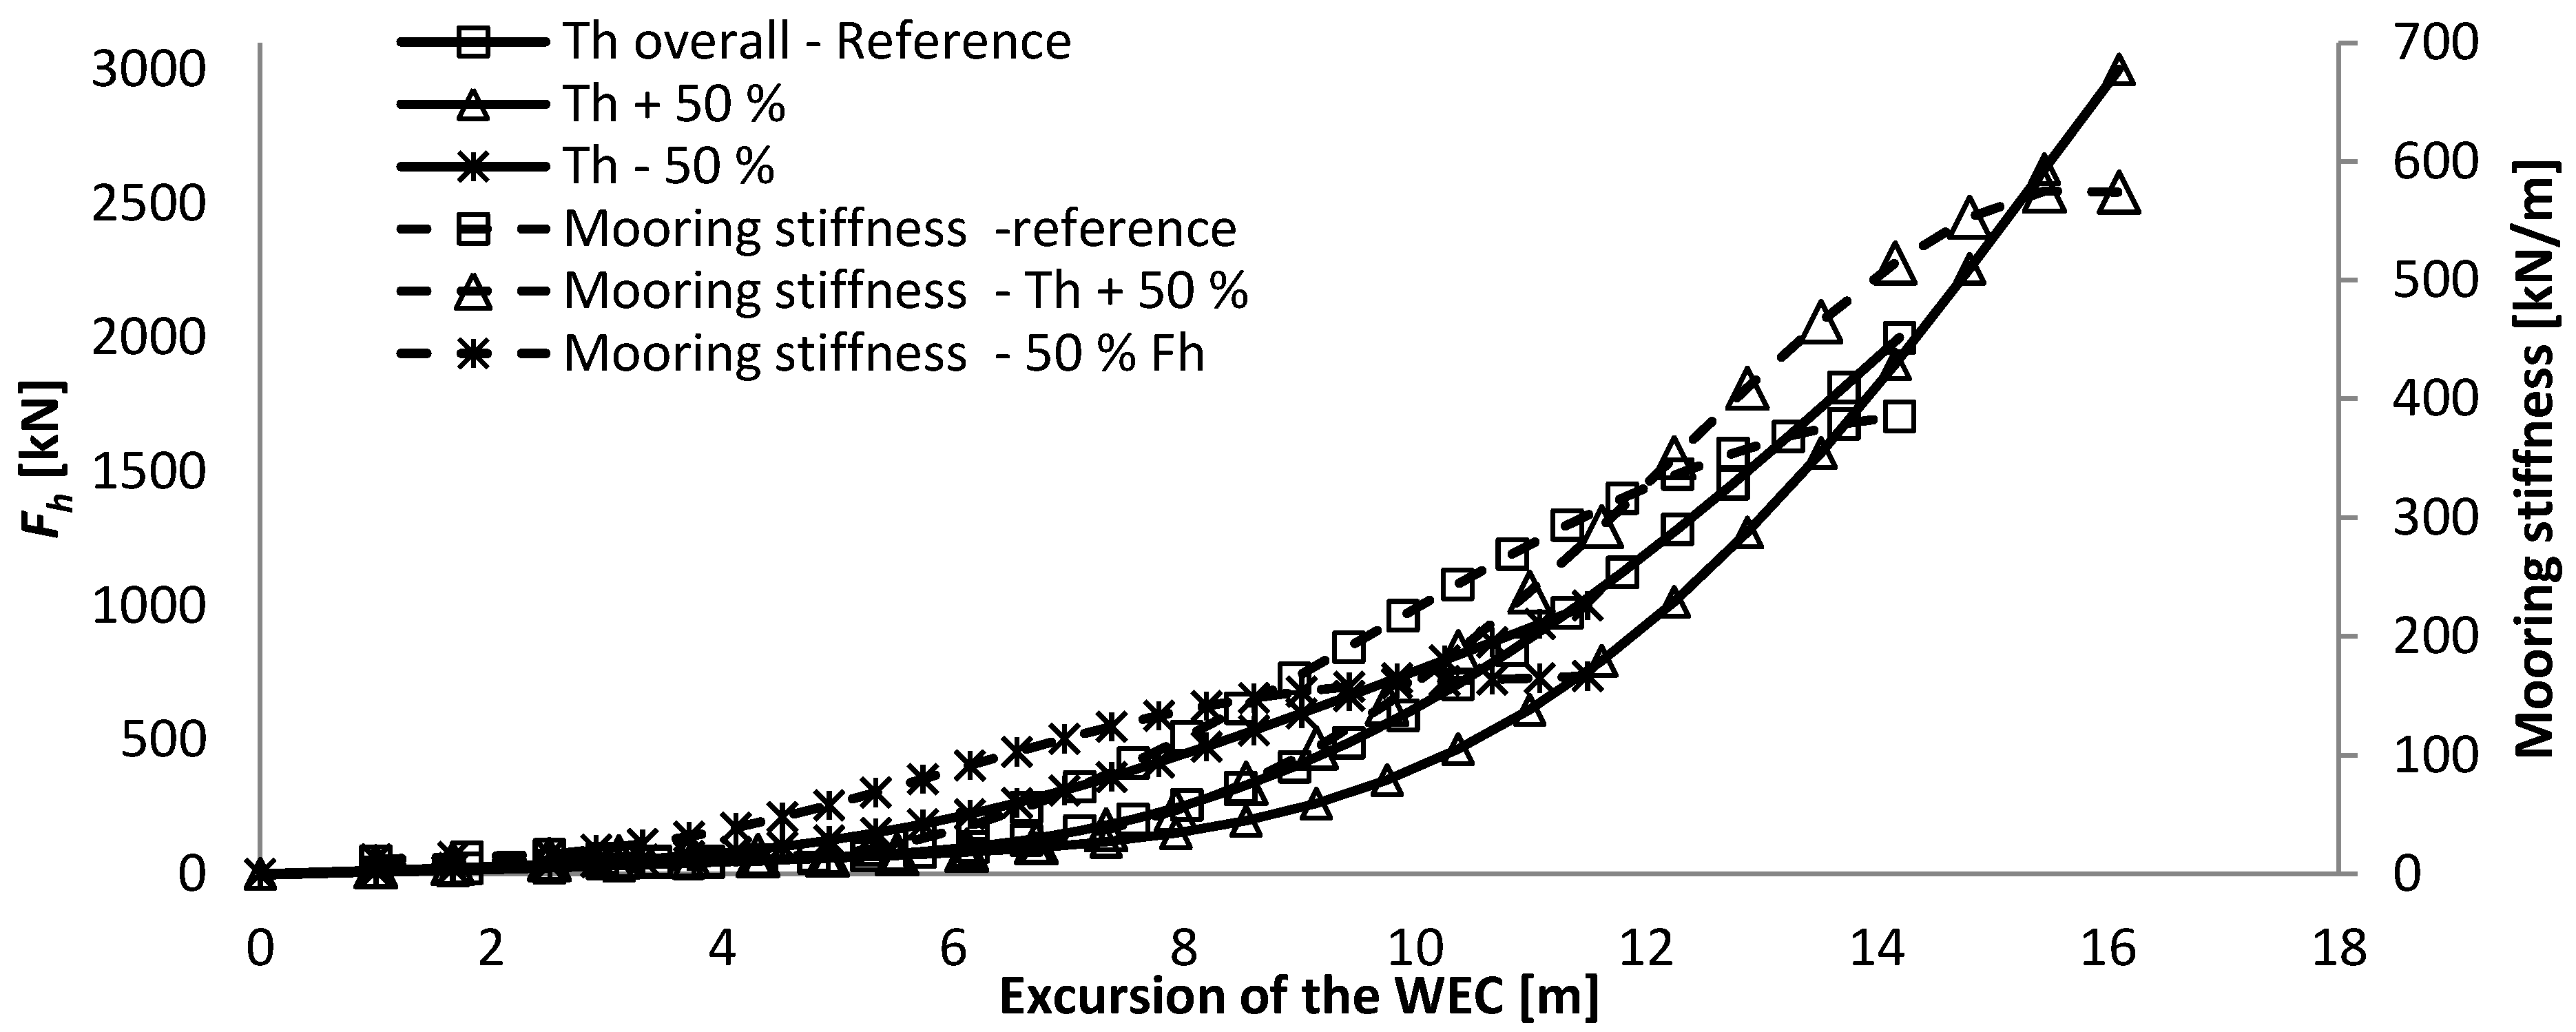
The angle between the hawser and tether at maximum excursion of the WEC is equal to 160 degrees. Although angles up to 180 degrees are physically possible, the resulting horizontal force increases too exponentially after 160 degrees (illustrated in
Figure 3). This can therefore not be part of the useable range of the mooring system, and was thereby excluded.
- -
The design load of the lines is set equal to the maximum resulting tension in them under the design condition.
- -
The depth of the buoy at rest, zrest, is calculated taking the maximum wave height into account (33% of 1.86*Hs of a hundred year storm) and half of the height of the buoy, where the buoy is assumed to be a cylinder of equal height and diameter.
- -
The length of the hawser is 30 m.
- -
The volume of the buoy is calculated relative to the required buoyancy force to fulfill the specifications of the mooring system. The combined gravitational force of the system consists of the buoy’s own weight, the weight of the tether, half of the weight of the hawser and 250 kg for extra equipment.
- -
The length of the tether is a result of the water depth, the submergence depth of the buoy at rest and the height of the connection on the seabed.
Some assumptions were taken into account:
- -
There is no back mooring line considered.
Dynamic effects in the line are ignored.
- -
Current forces resulting from the movement of the chain in the water and on the seabed are ignored.
- -
The mooring line is assumed to be connected to the WEC at mean water level.
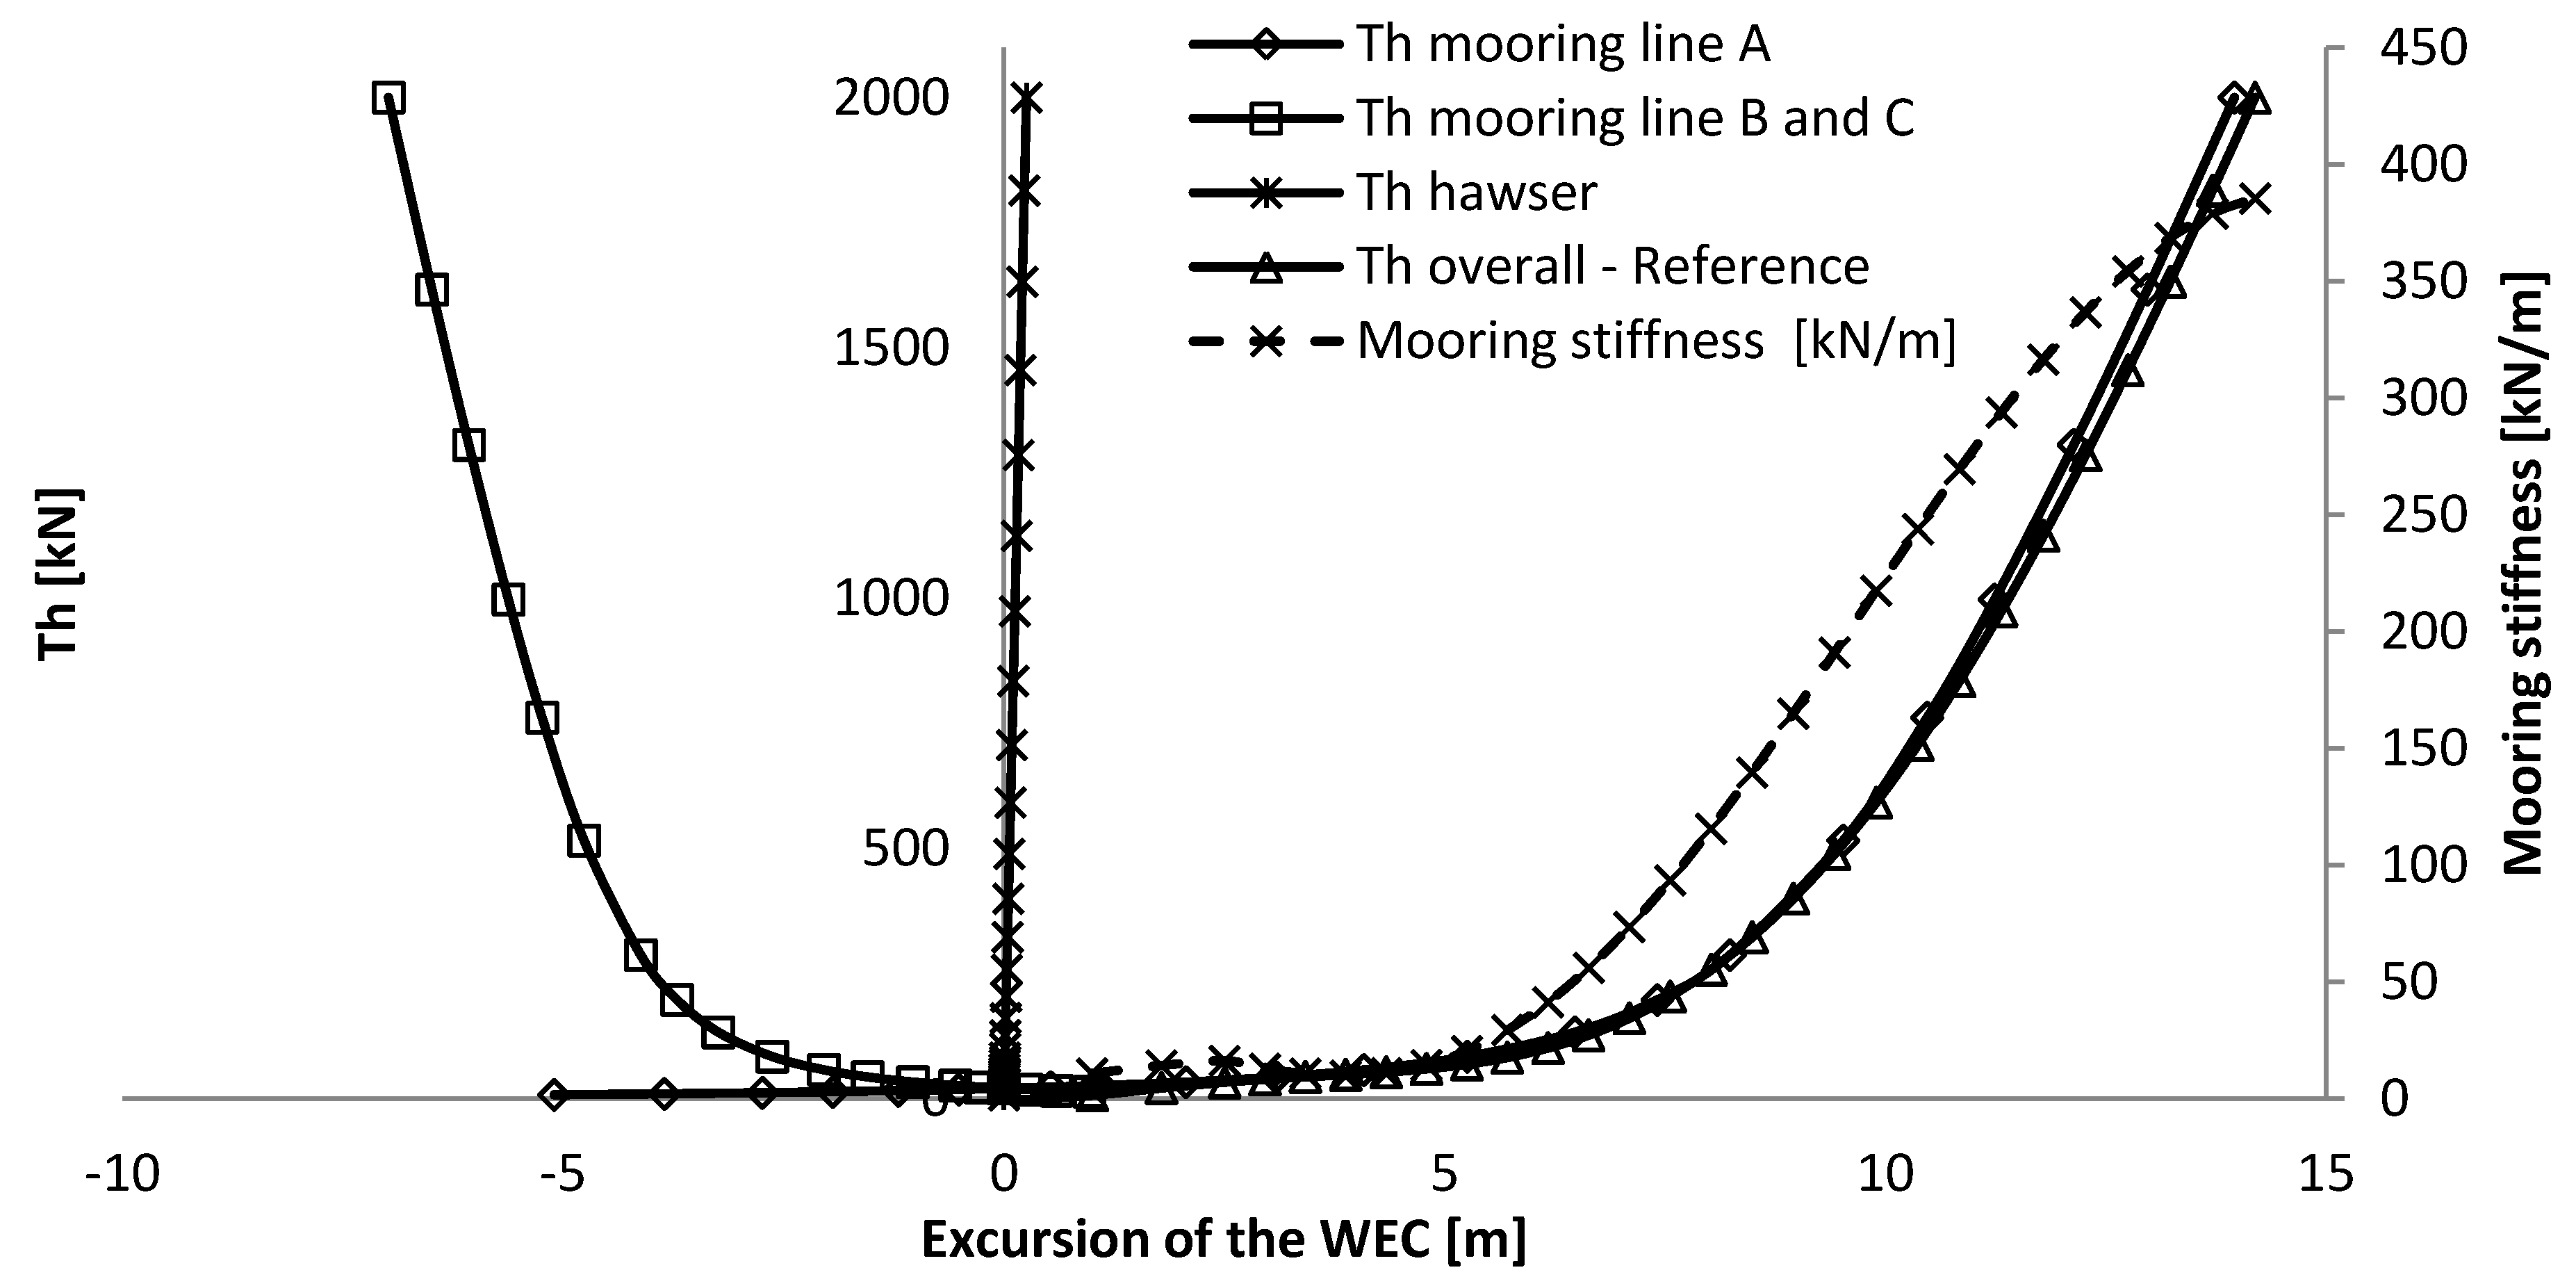
Figure 3.
Overview of the force excursion and the mooring stiffness curve, together with the maximum admissible FH and the extension of the force-displacement curve, given against the WEC excursion and relative angle between the tether and hawser.
Figure 3.
Overview of the force excursion and the mooring stiffness curve, together with the maximum admissible FH and the extension of the force-displacement curve, given against the WEC excursion and relative angle between the tether and hawser.
The calculations related to the SALM system can be obtained through an iteration process and the various forces and angles in the system can mainly be obtained geometrically with the equations described below.
The elongation of the lines can be calculated with their elasticity (
f) and the applied tension (the superscript 0 indicates that it corresponds to their unstretched lengths).
The depth of the buoy, where
zrest represents the depth of the buoy at rest (no load situation), is:
The horizontal force at the WEC is
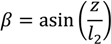
The angle between the second line and the mean water level (MWL) is
The overall tension at the WEC is
4. Specifications
4.1. Reference Load Case
The environmental conditions and loads are chosen with the objective to be as generic as possible. Therefore, they were inspired from values that were obtained from tank testing of various large devices [10,11]. The parametric study will analyse some of the effect of these environmental conditions, around the reference load case, presented in
Table 1. However, whenever a quasi-static analysis has to be performed for a device at a specific location, the corresponding environmental load should be calculated following [
2], and the design should also be verified for an accidental limit state and fatigue limit state besides the “ultimate limit state” case assessed here.
Table 1.
Overview of the specifications of the reference load case.
Table 1.
Overview of the specifications of the reference load case.
| | Unit | Symbol | Value |
|---|
| Water depth | [m] | h | 30 |
| Horizontal design load at the WEC | [kN] | FHmax | 2000 |
Note that the mooring stiffness, also called the resulting horizontal compliance, indicates the rate of change in the horizontal mooring force for a given WEC excursion (similar to the derivative of the force-displacement curve). It evolves differently with the excursion of the WEC depending on the mooring characteristics and has thereby a high influence on the horizontal design load at the WEC. As the mooring stiffness over the permissible excursion of the WEC is different for both mooring systems, the resulting horizontal design load at the WEC of a dynamic or experimental analysis can be expected to be different as well. However, the configurations that are presented are believed to be representative of what would physically be required under these specifications. A dynamic or experimental analysis should provide better indications of the WEC motions and resulting mooring forces.
The maximum values are set against a possible 100-year storm having a
Hs value of 8.28 m and a
Tp of 12.9 s at a water depth of 30 m, which corresponds to a maximum wave height of 15.4 m [
12] (we assume that the maximum wave trough will be one third of this, corresponding to 5.1 m). With fifth order stokes waves, we obtain a maximum wave trough of 4.7 m in these wave conditions [
13].
4.2. Chain
The characteristics of the chain (diameter, dry and submerged weight
w) of steel grade Q3 were extra- and interpolated based on chain specifications presented in [
14] and the axial mooring stiffness (
AE) specifications were based on [
9]. The elasticity
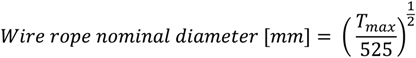
f is the reciprocal of the axial mooring stiffness. These different characteristics were calculated with the following equations (in which
Tmax is in [kN]):
4.3. Wire Rope
The characteristics of the six strand wire rope IWRC (diameter, dry and submerged weight
w and the elasticity), having an ultimate tensile stress of 1770 N/mm
2, were extra- and interpolated based on chain specifications presented in [
9,
14]. The wire rope specifications, used as a hawser for the catenary solution, could possibly be improved by lowering their mooring stiffness below the overall mooring stiffness (mooring stiffness at maximum WEC excursion) of the mooring system, possibly by using a fibre rope solution.
4.4. Flipper-Delta Anchor
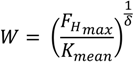
In this exercise, for the spread catenary mooring system Flipper-Delta anchors were selected. The holding capacity of the anchor is set equal to the horizontal design load at the WEC and its weight can be calculated with the following equation for a range of anchor weights between 0.3 and 27.5 ton (3 and 270 kN) [
14]:
where:
- -
W is the weight of the anchor [kN].
- -
Kmean and δ are the fitting coefficient, 42 and 0.85.
- -
FHmax is the horizontal design load at the WEC [kN].
It was chosen to use Kmean, which is the average value between the maximum and minimum value of K (28 and 58), as this depends on the soil. The safety factors are assumed to be taken into account in the horizontal design load at the WEC.
4.5. Suction Anchor
Suction anchors have been used to moor buoyant oil and gas facilities for the last 40 years [
15]. In this section, the procedure for the preliminary design of a suction anchor for the SALM system is described. The design is preliminary in the sense that it is merely based on a geotechnical analysis. The following hypotheses are necessary to the preliminary design:
- -
A mono-layer soil profile is assumed. The soil is medium soft clay with homogeneous strength profile, average undrained shear strength, su = 35 kPa, and saturated unit weight, γsat = 19 kN/m3. This is selected accordingly to what is likely to be found in the Danish sector of the North Sea.
- -
The mooring is connected to the suction anchor by means of a padeye placed on the foundation lid. The thickness of lid and wall of the anchor was chosen by taking existing similar foundations as reference.
The force calculated at the buoy,
T1, implies vertical and horizontal components acting on the foundation,
V and
H, respectively. Note that
V exerts constant uplift on the anchor. The uplift vertical capacity
Vult and the horizontal capacity
Hult of the suction anchor are calculated following [
16]. The foundation failure model taken as reference to calculate
Vult includes three contributions: the caisson weight, the external wall friction, and the soil plug:
where:
- -
W′ and W′plug are the buoyant weight of the foundation and of the soil plug
- -
Ase is the external shaft surface area
- -
αe is the external adhesion factor, assumed equal to 0.5
- -
su is the undrained shear strength of the soil.
It is worth noting that in the calculation of Vult, the reverse end bearing capacity is assumed to be not relevant since the foundation is subjected to sustained vertical load.
Hult is calculated as:
where:
- -
d is the anchor length.
- -
De is the external diameter.
- -
Np is the lateral bearing capacity factor that depends on the embedment ratio d/De and on where the padeye is located. Since the padeye is placed on the lid, Np was set equal to 3.
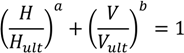
Since
H and
V are simultaneously applied to the foundation, overlooking their interaction would be non-conservative. The interaction diagram proposed by [
17] was used to complete the analysis:
where
a and
b are the parameters of the interaction diagram which depend on the embedment ratio.
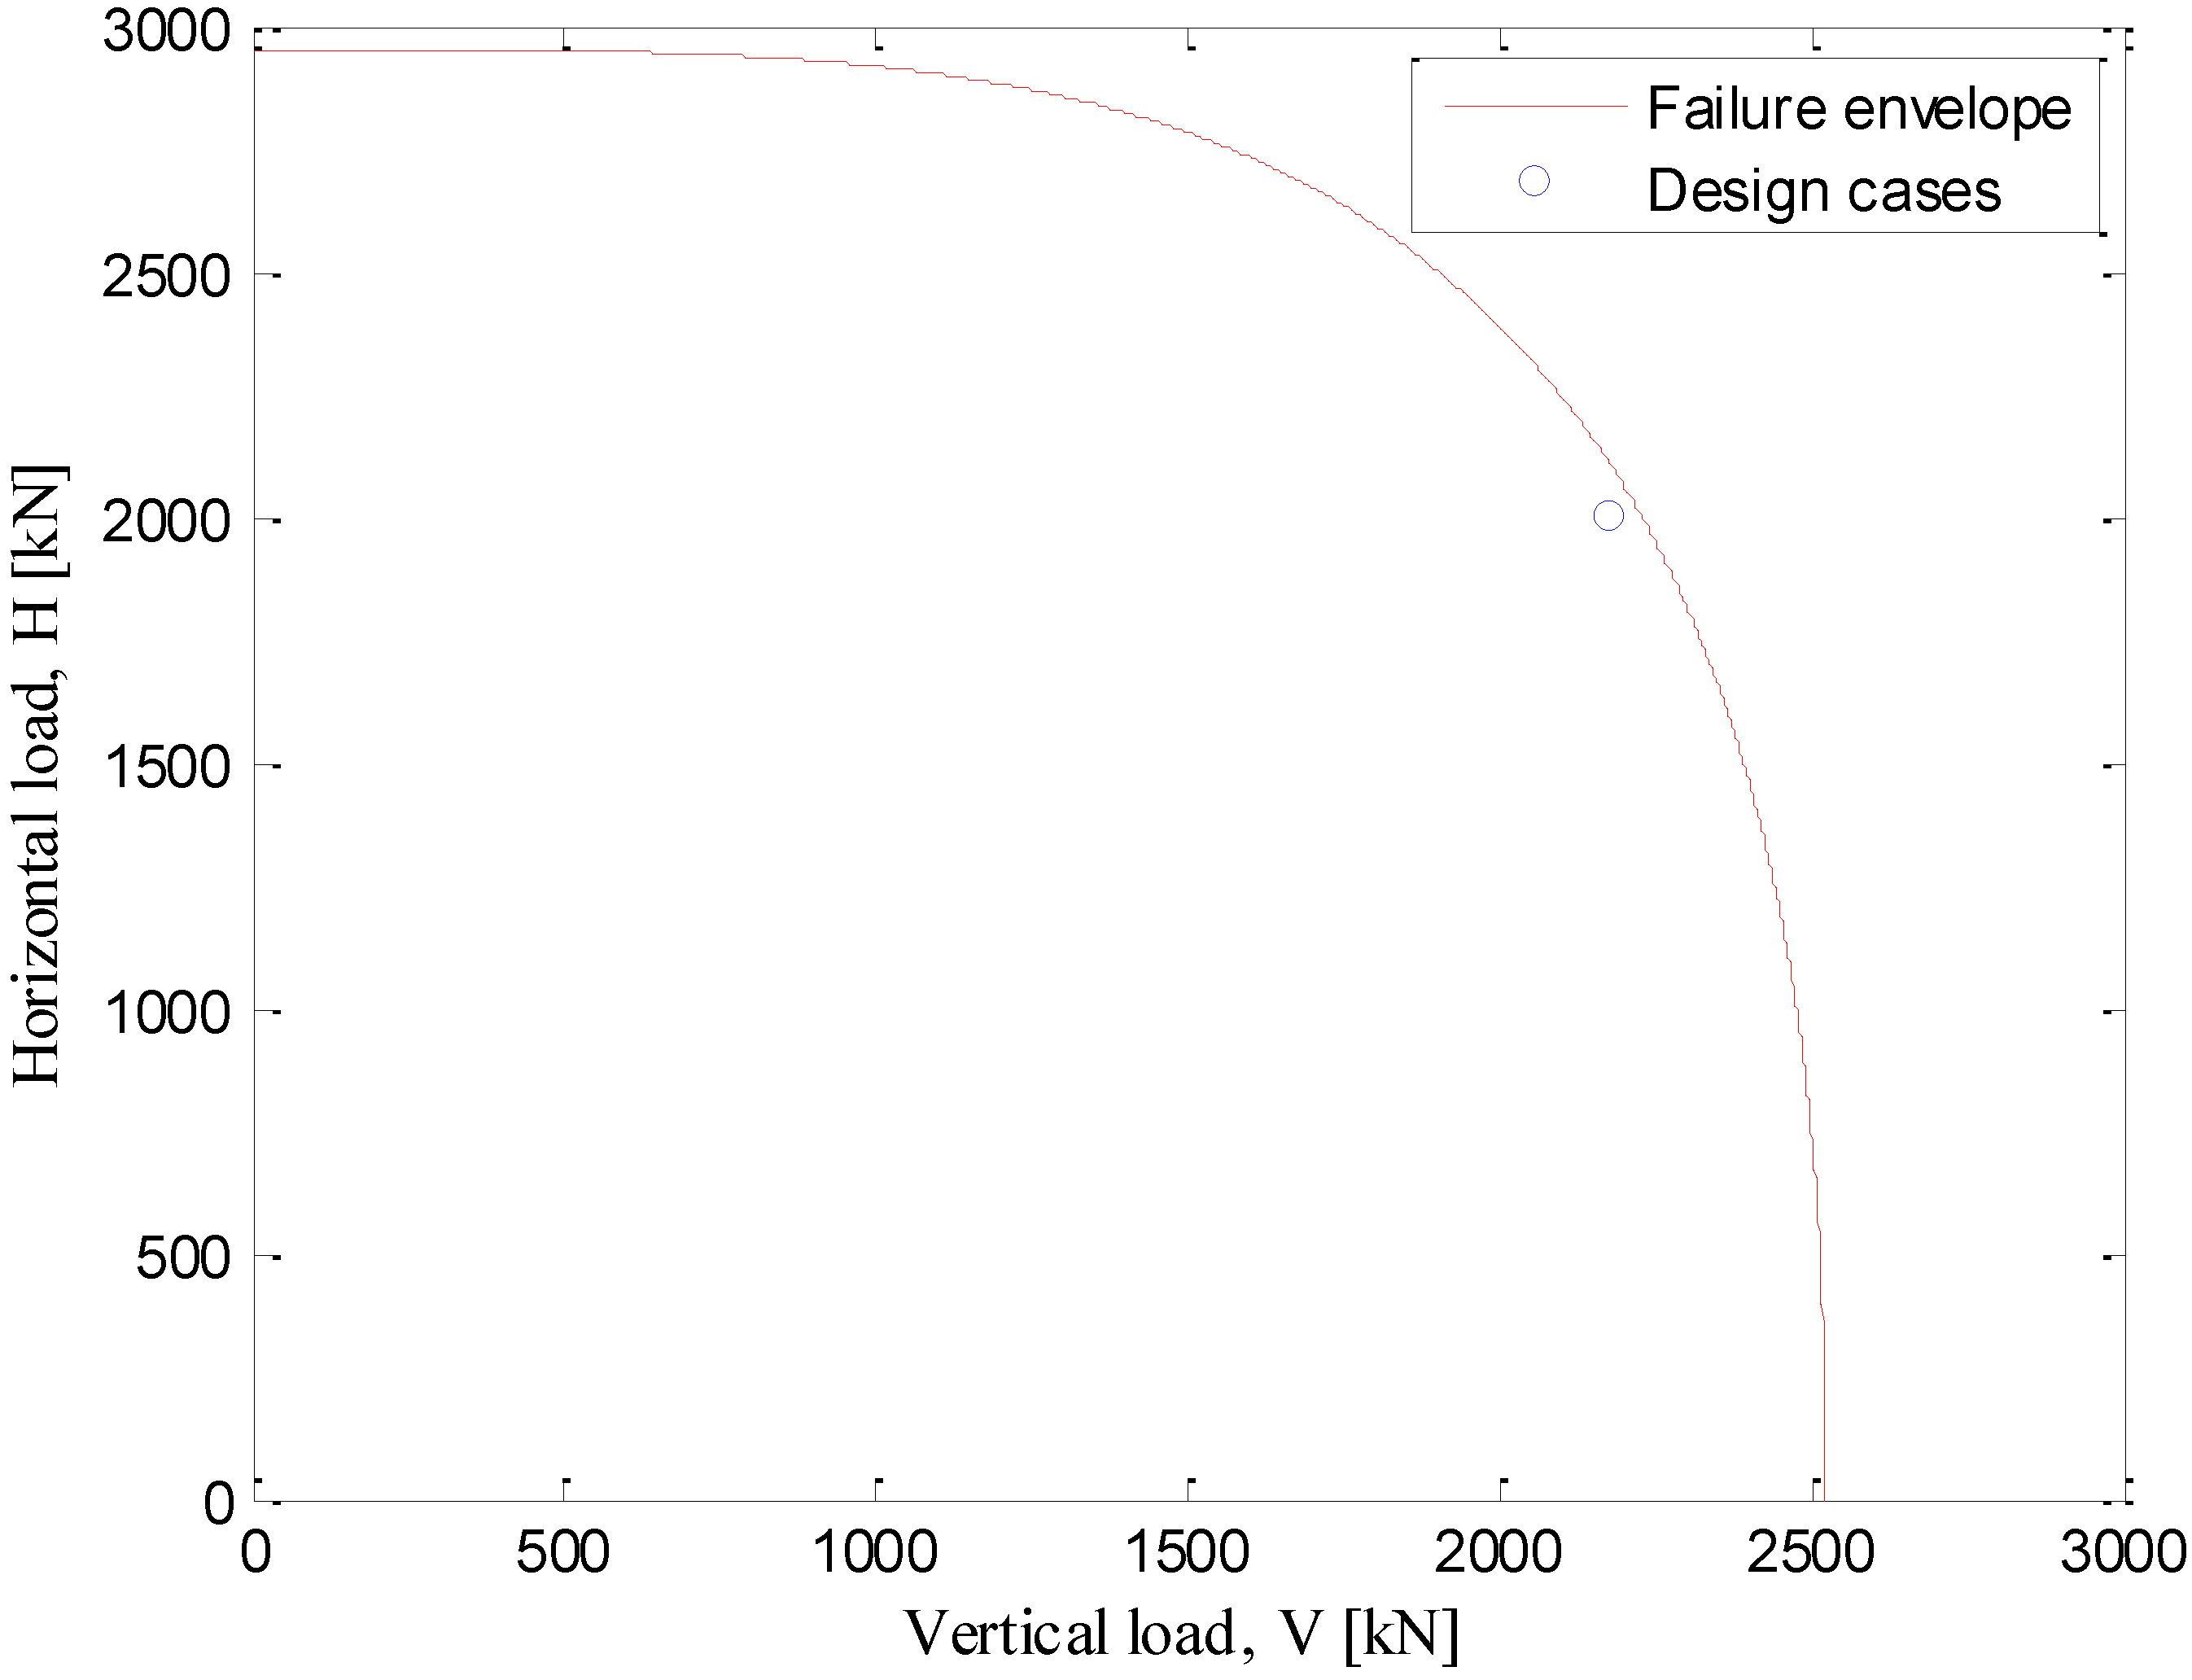
Seven different sizes of suction anchor were designed to fulfill the seven different loading cases. The dimensions of the suction anchors, including the thickness of lid and wall, are listed in annexed
Table 2,
Table 3 and
Table 4. In
Figure 4, the failure envelope obtained with Equations 27–29 is plotted together with the reference loading conditions calculated for the reference SALM system.
Figure 4.
Failure envelope of the suction anchor encompassing the reference design load point.
Figure 4.
Failure envelope of the suction anchor encompassing the reference design load point.
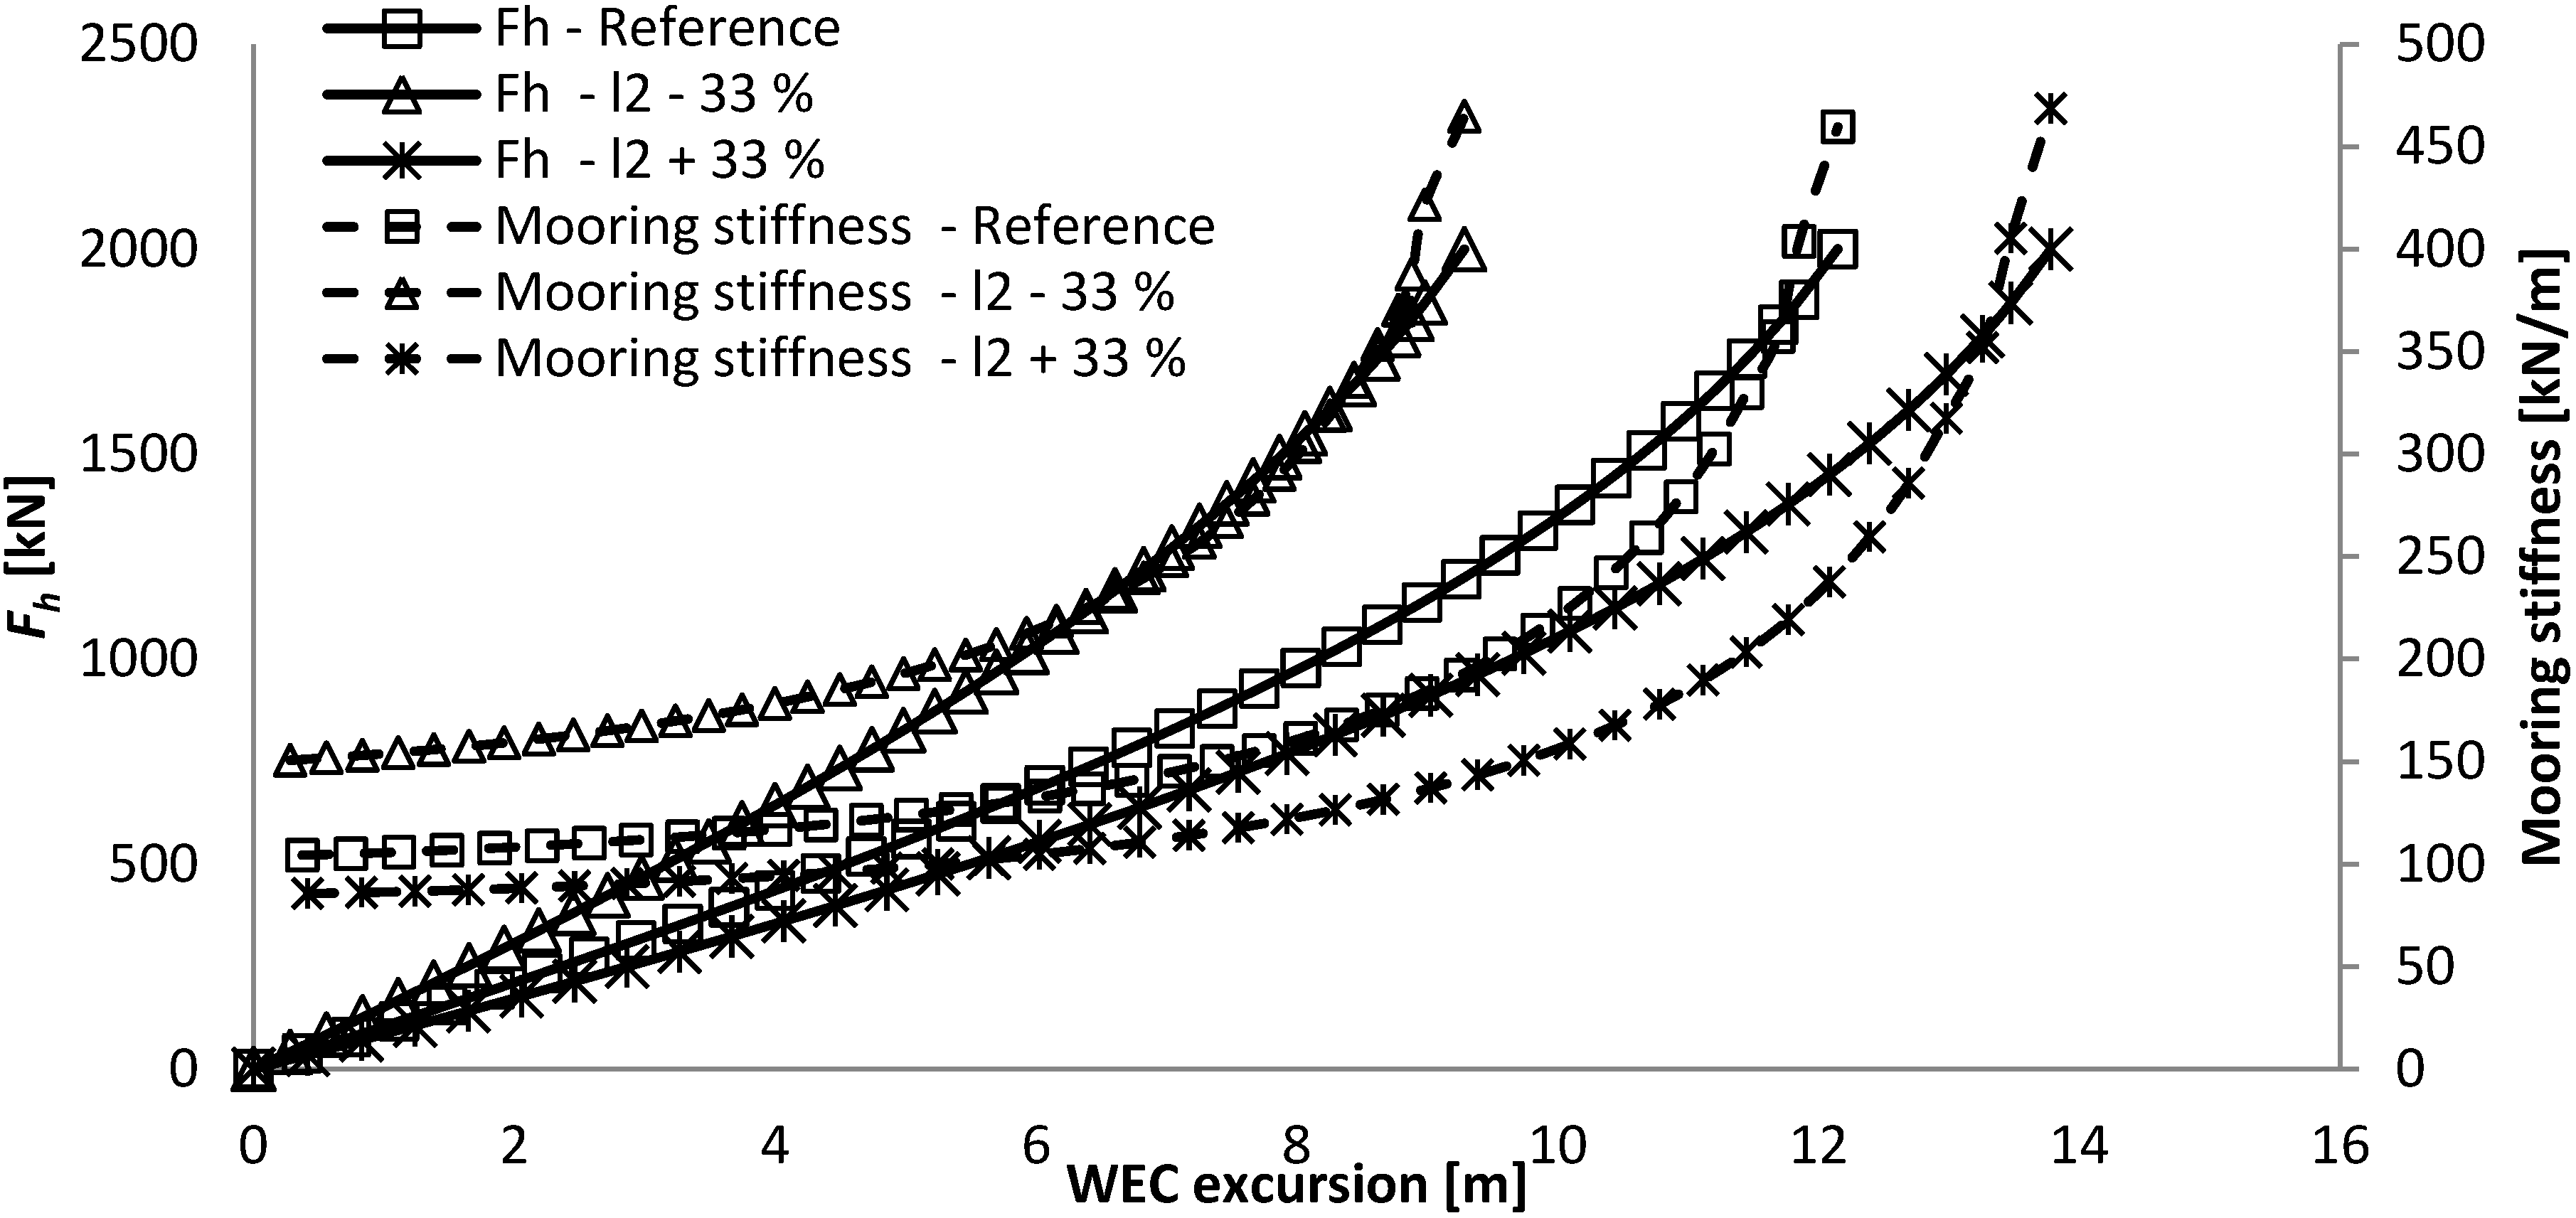
Table 2.
Main results from investigating the influence of the length of the hawser, l2, of the SALM system.
Table 2.
Main results from investigating the influence of the length of the hawser, l2, of the SALM system.
| l2,0 − 33% | Reference | l2,0 + 33% |
|---|
| length l2,0 [m] | 20 | 30 | 40 |
| Max excursion [m] | 9.3 | 12.1 | 13.8 |
| Mooring stiffness at max excursion [kN/m] | 465 | 460 | 469 |
| alpha [°] | 33 | 42.6 | 47.9 |
| Beta [°] | 37.0 | 27.4 | 22.1 |
| Buoy volume [m3] | 350 | 248 | 206 |
| Equivalent to a cylinder of height and diameter [m] | 7.6 | 6.8 | 6.4 |
| Length l1,0 [m] | 20.1 | 20.5 | 20.7 |
| Fbuoy [kN] | 3086 | 2178 | 1808 |
| Max T1 [kN] | 3677 | 2957 | 2696 |
| Max T2 [kN] | 2505 | 2254 | 2159 |
| Suction anchor diameter [m] | 4.25 | 3.75 | 3.55 |
| Suction anchor height [m] | 8.5 | 7.5 | 7.1 |
| Suction anchor lid thickness [mm] | 100 | 100 | 100 |
| Suction anchor wall thickness [mm] | 30 | 26 | 25 |
| Suction anchor weight [ton] | 37 | 27 | 23 |
| Total weight [ton] | 82 | 59 | 50 |
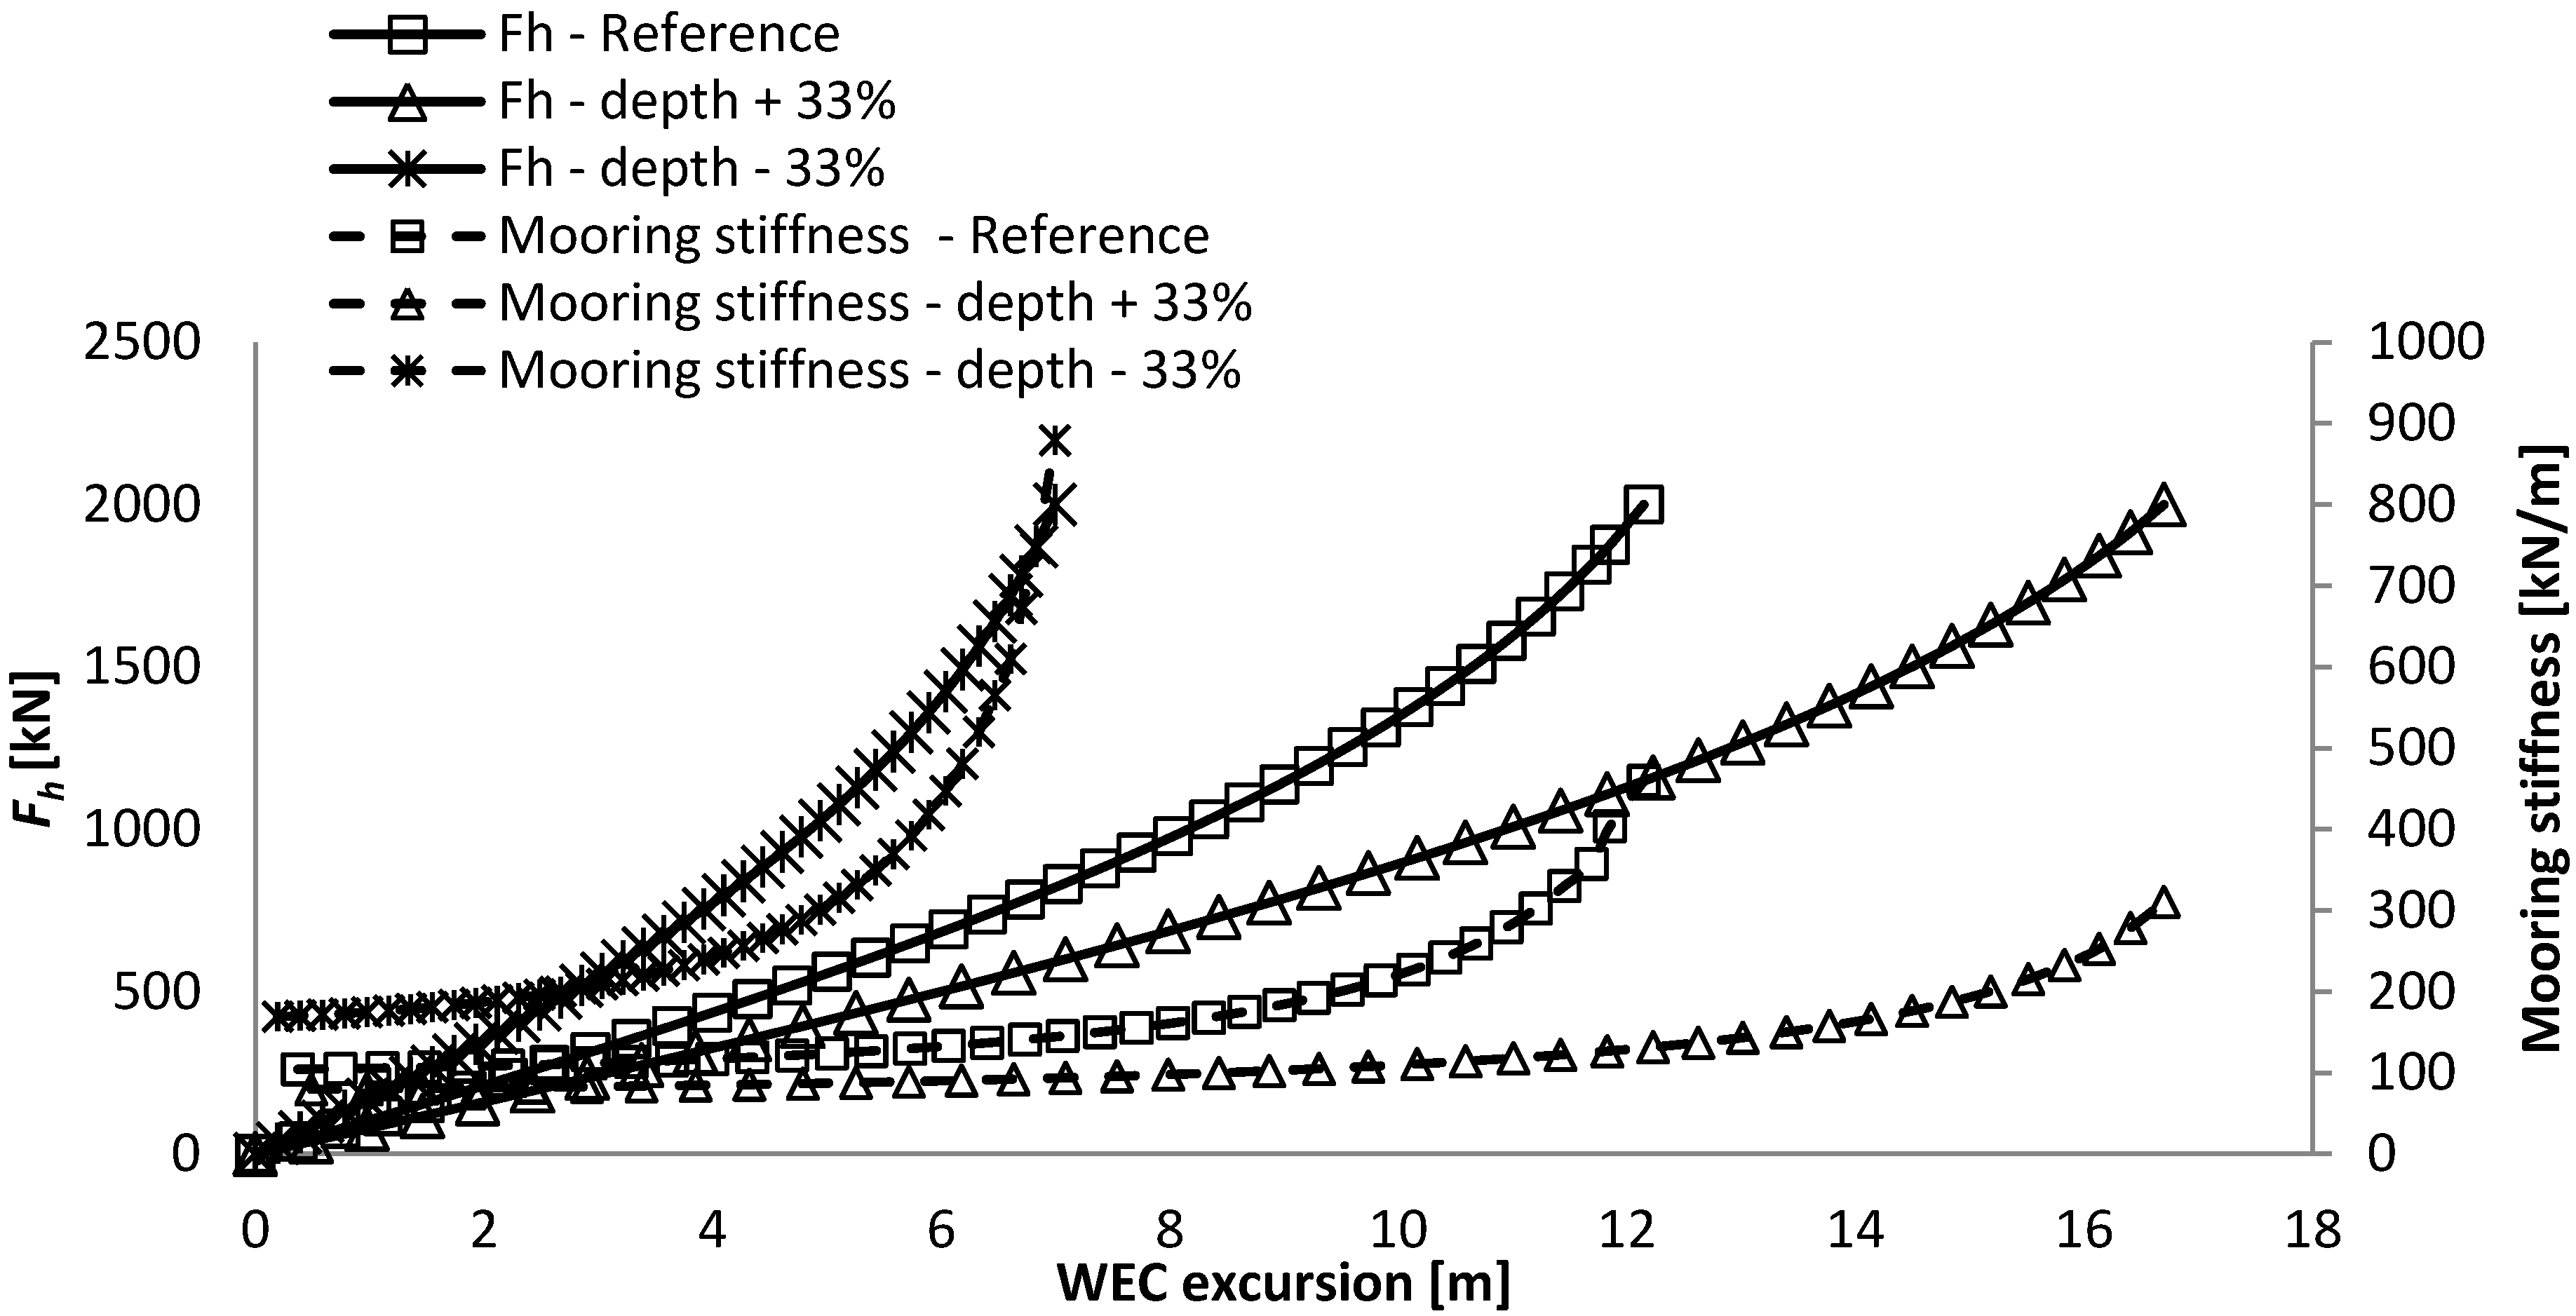
Table 3.
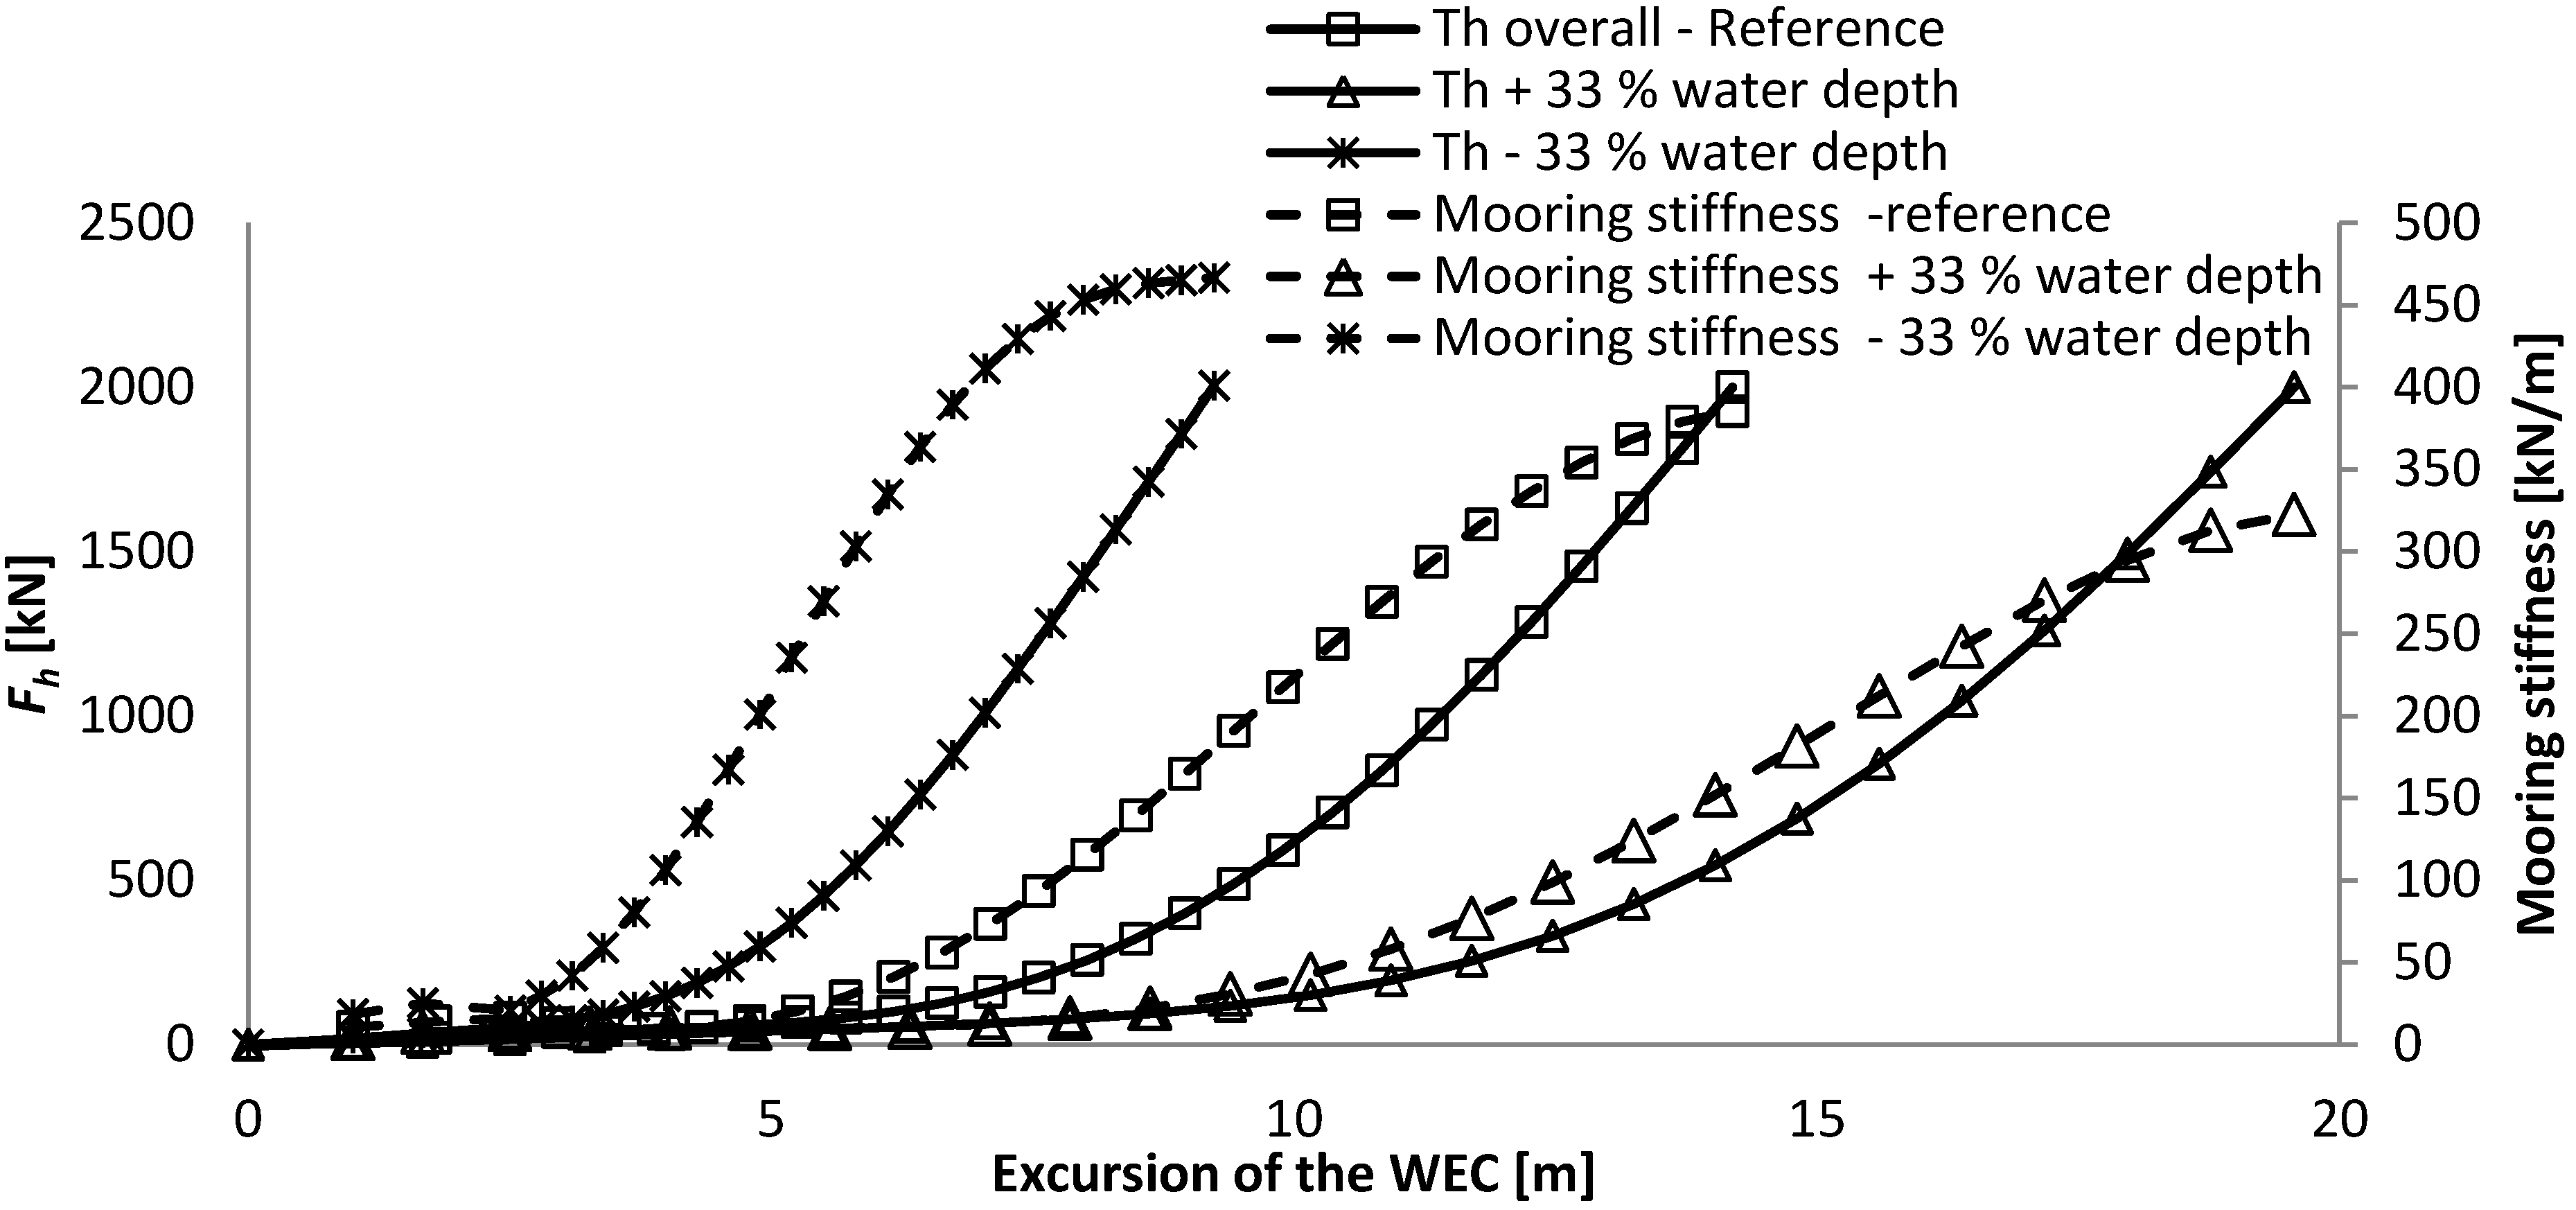
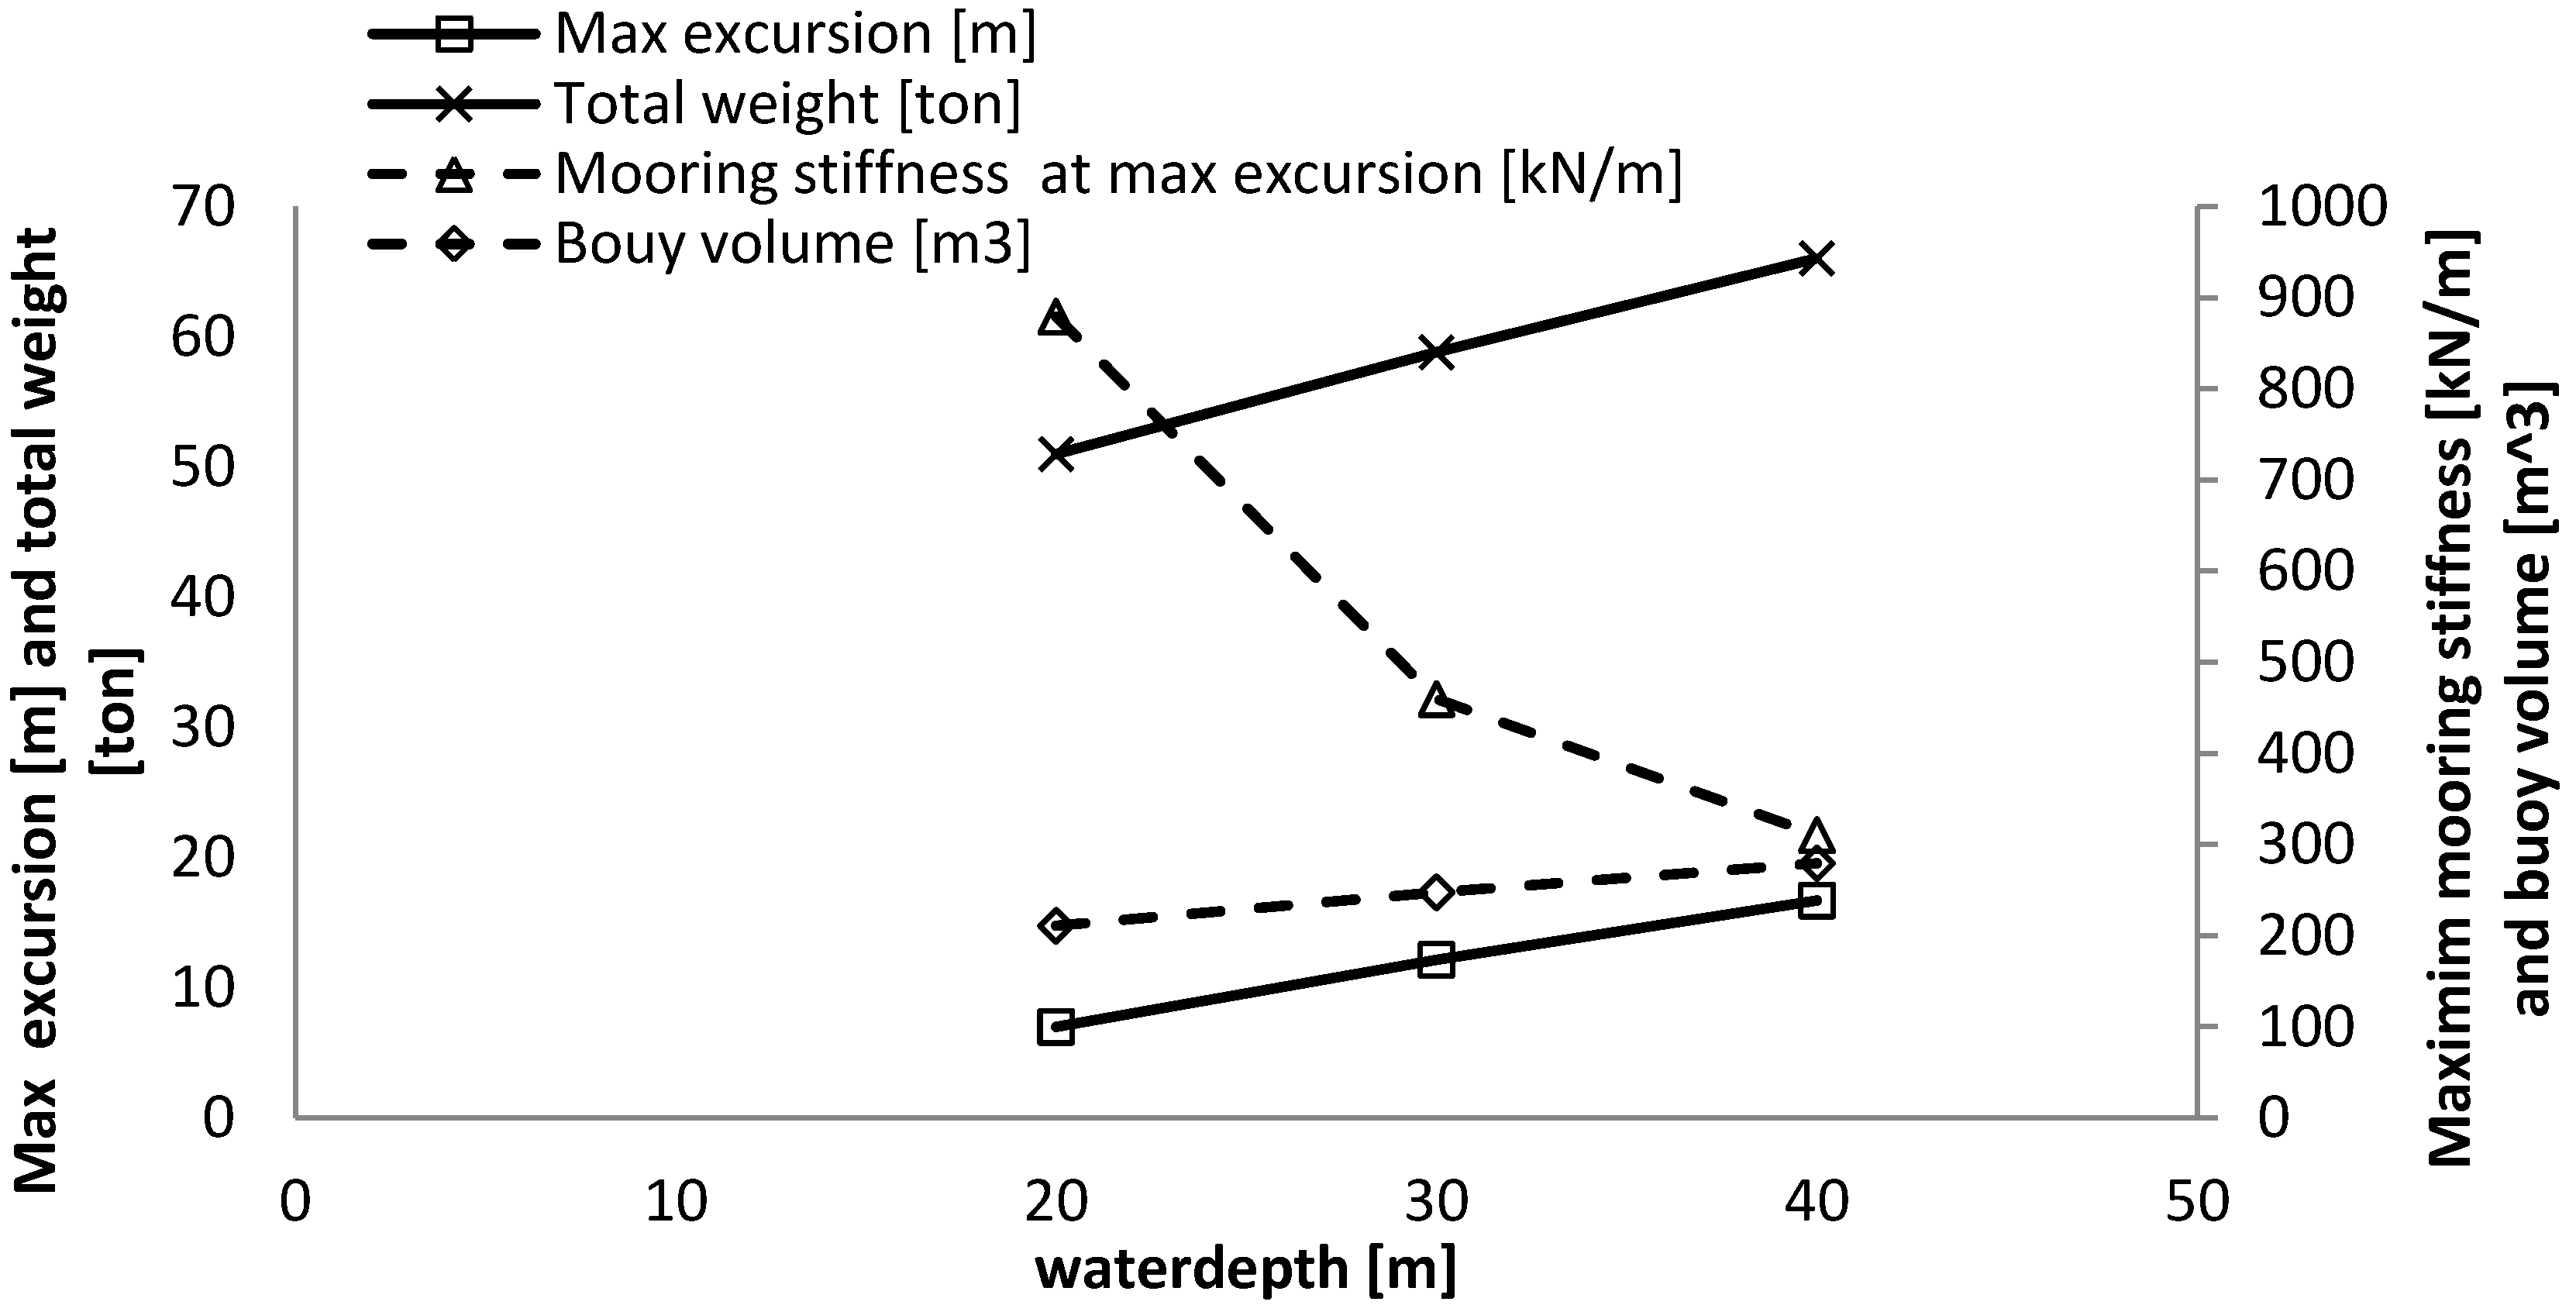
Main results from investigating the influence of water depth on a SALM system.
Table 3.
Main results from investigating the influence of water depth on a SALM system.
| | Water depth − 33% | Reference | Water depth + 33% |
|---|
| Water depth [m] | 20 | 30 | 40 |
| Max excursion [m] | 7.0 | 12.1 | 16.7 |
| Mooring stiffness at max excursion [kN/m] | 879 | 460 | 310 |
| Alpha [°] | 47.1 | 42.6 | 39.2 |
| Beta [°] | 22.9 | 27.4 | 30.8 |
| Buoy volume [m3] | 210.85 | 247.6 | 279.4 |
| Equivalent to a cylinder of height and diameter [m] | 6.5 | 6.8 | 7.1 |
| Length l1,0 [m] | 10.7 | 20.5 | 30.4 |
| Fbuoy [kN] | 1856 | 2178 | 2457 |
| Max T1 [kN] | 2728 | 2957 | 3168 |
| Max T2 [kN] | 2171 | 2254 | 2330 |
| Suction anchor diameter [m] | 3.6 | 3.75 | 3.9 |
| Suction anchor height [m] | 7.2 | 7.5 | 7.8 |
| Suction anchor lid thickness [mm] | 100 | 100 | 100 |
| Suction anchor wall thickness [mm] | 25 | 26 | 27 |
| Suction anchor weight [ton] | 24 | 27 | 30 |
| Total weight [ton] | 51 | 59 | 66 |
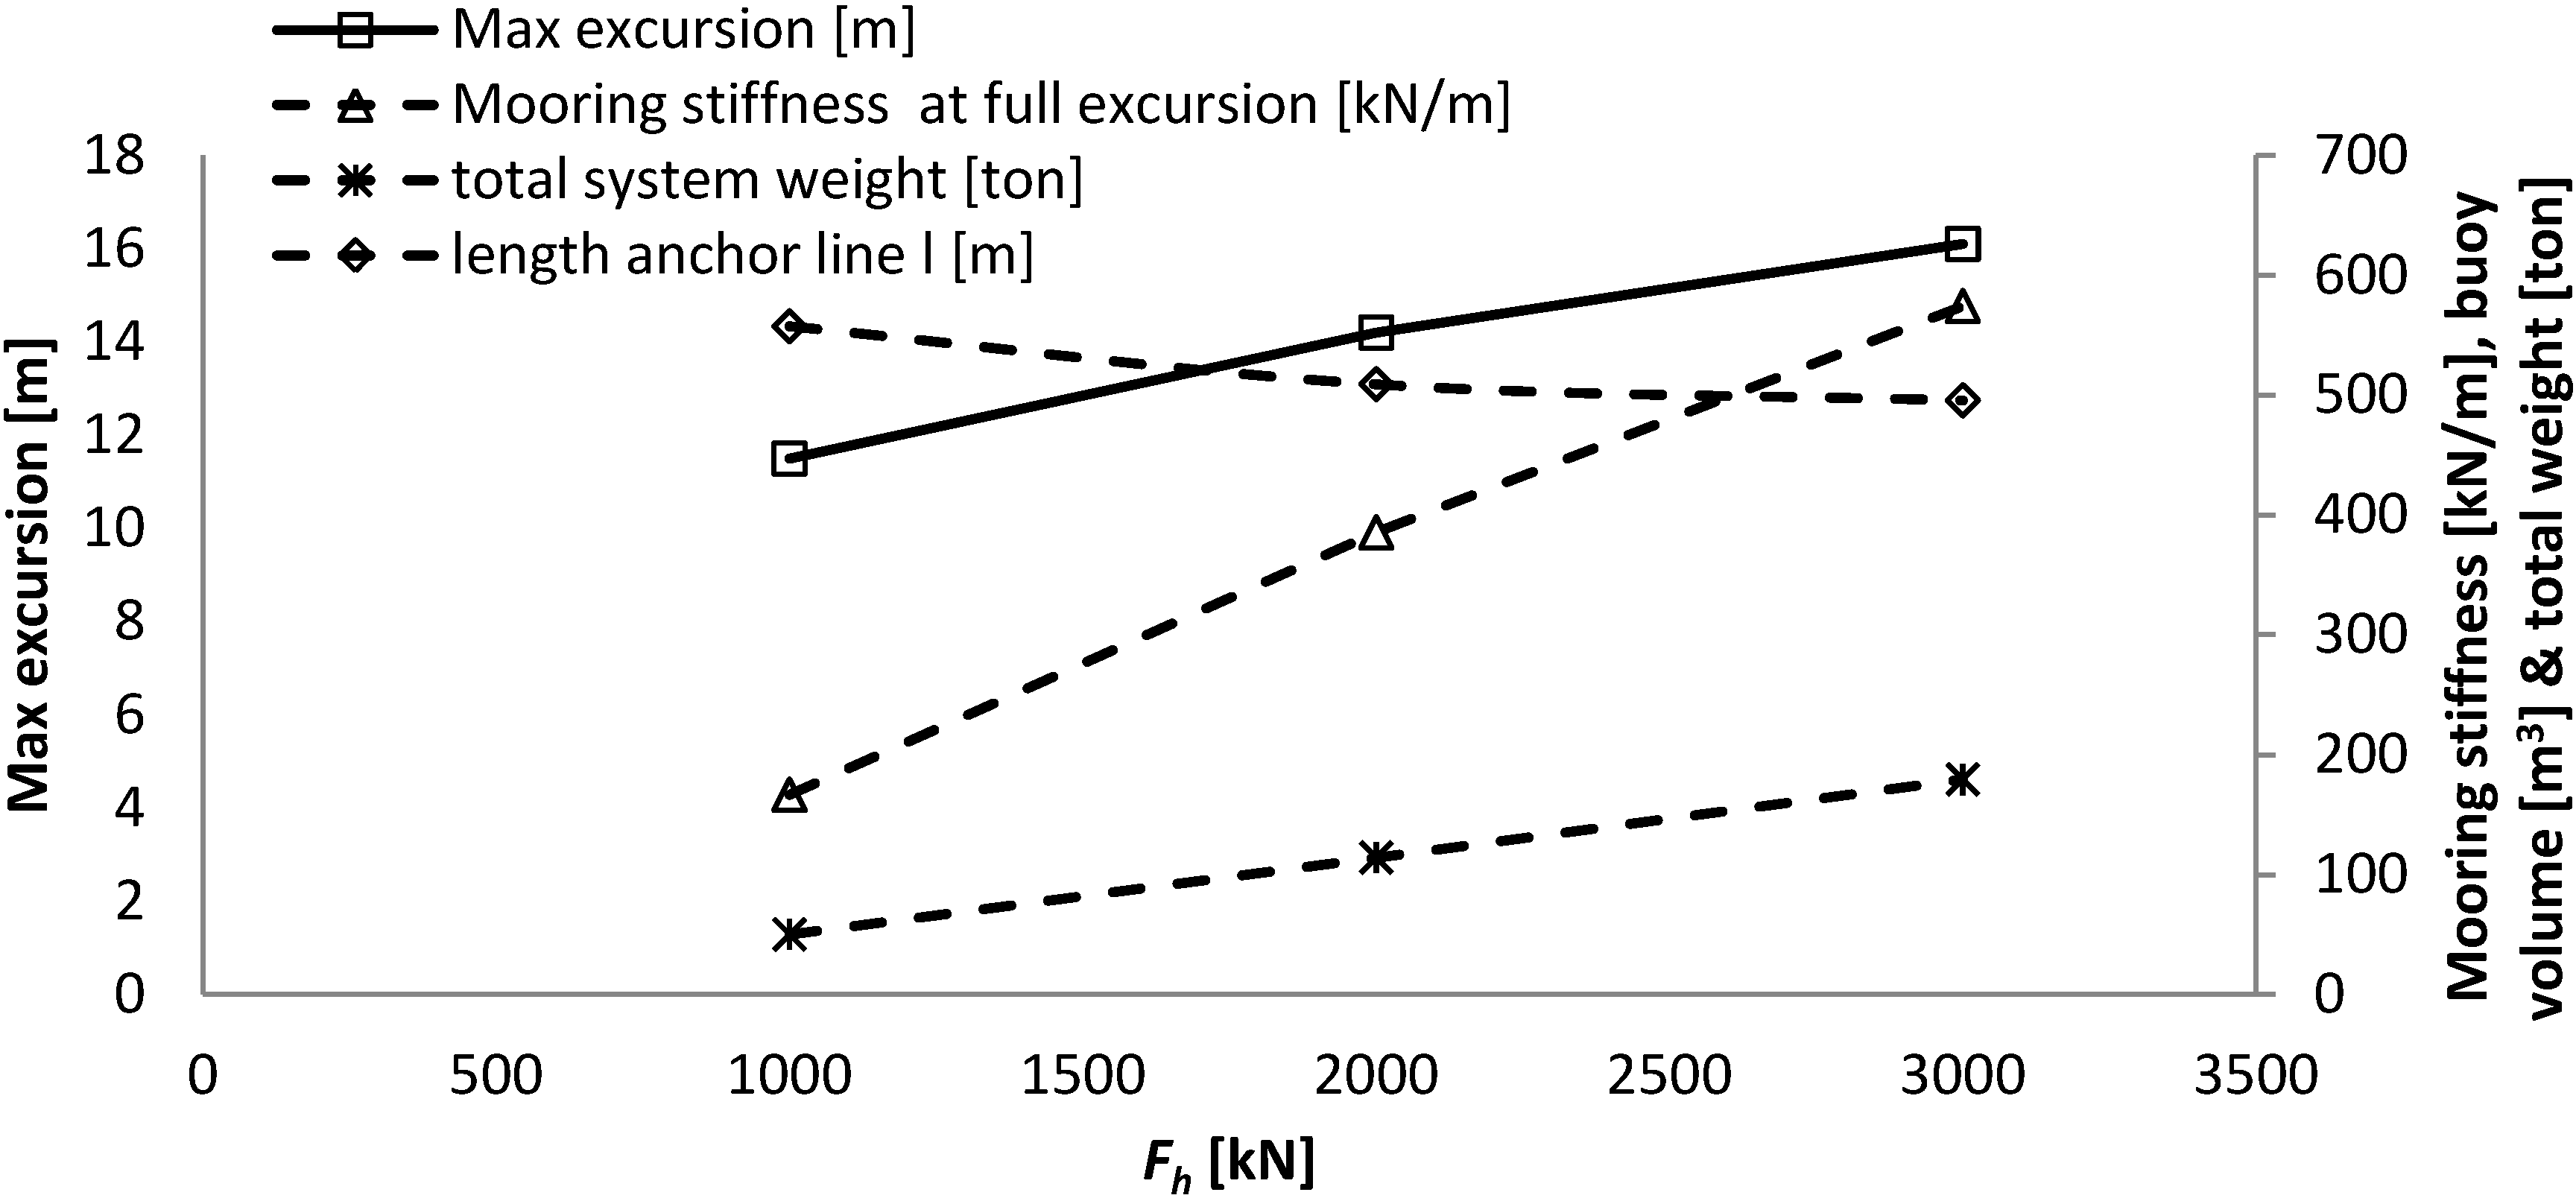
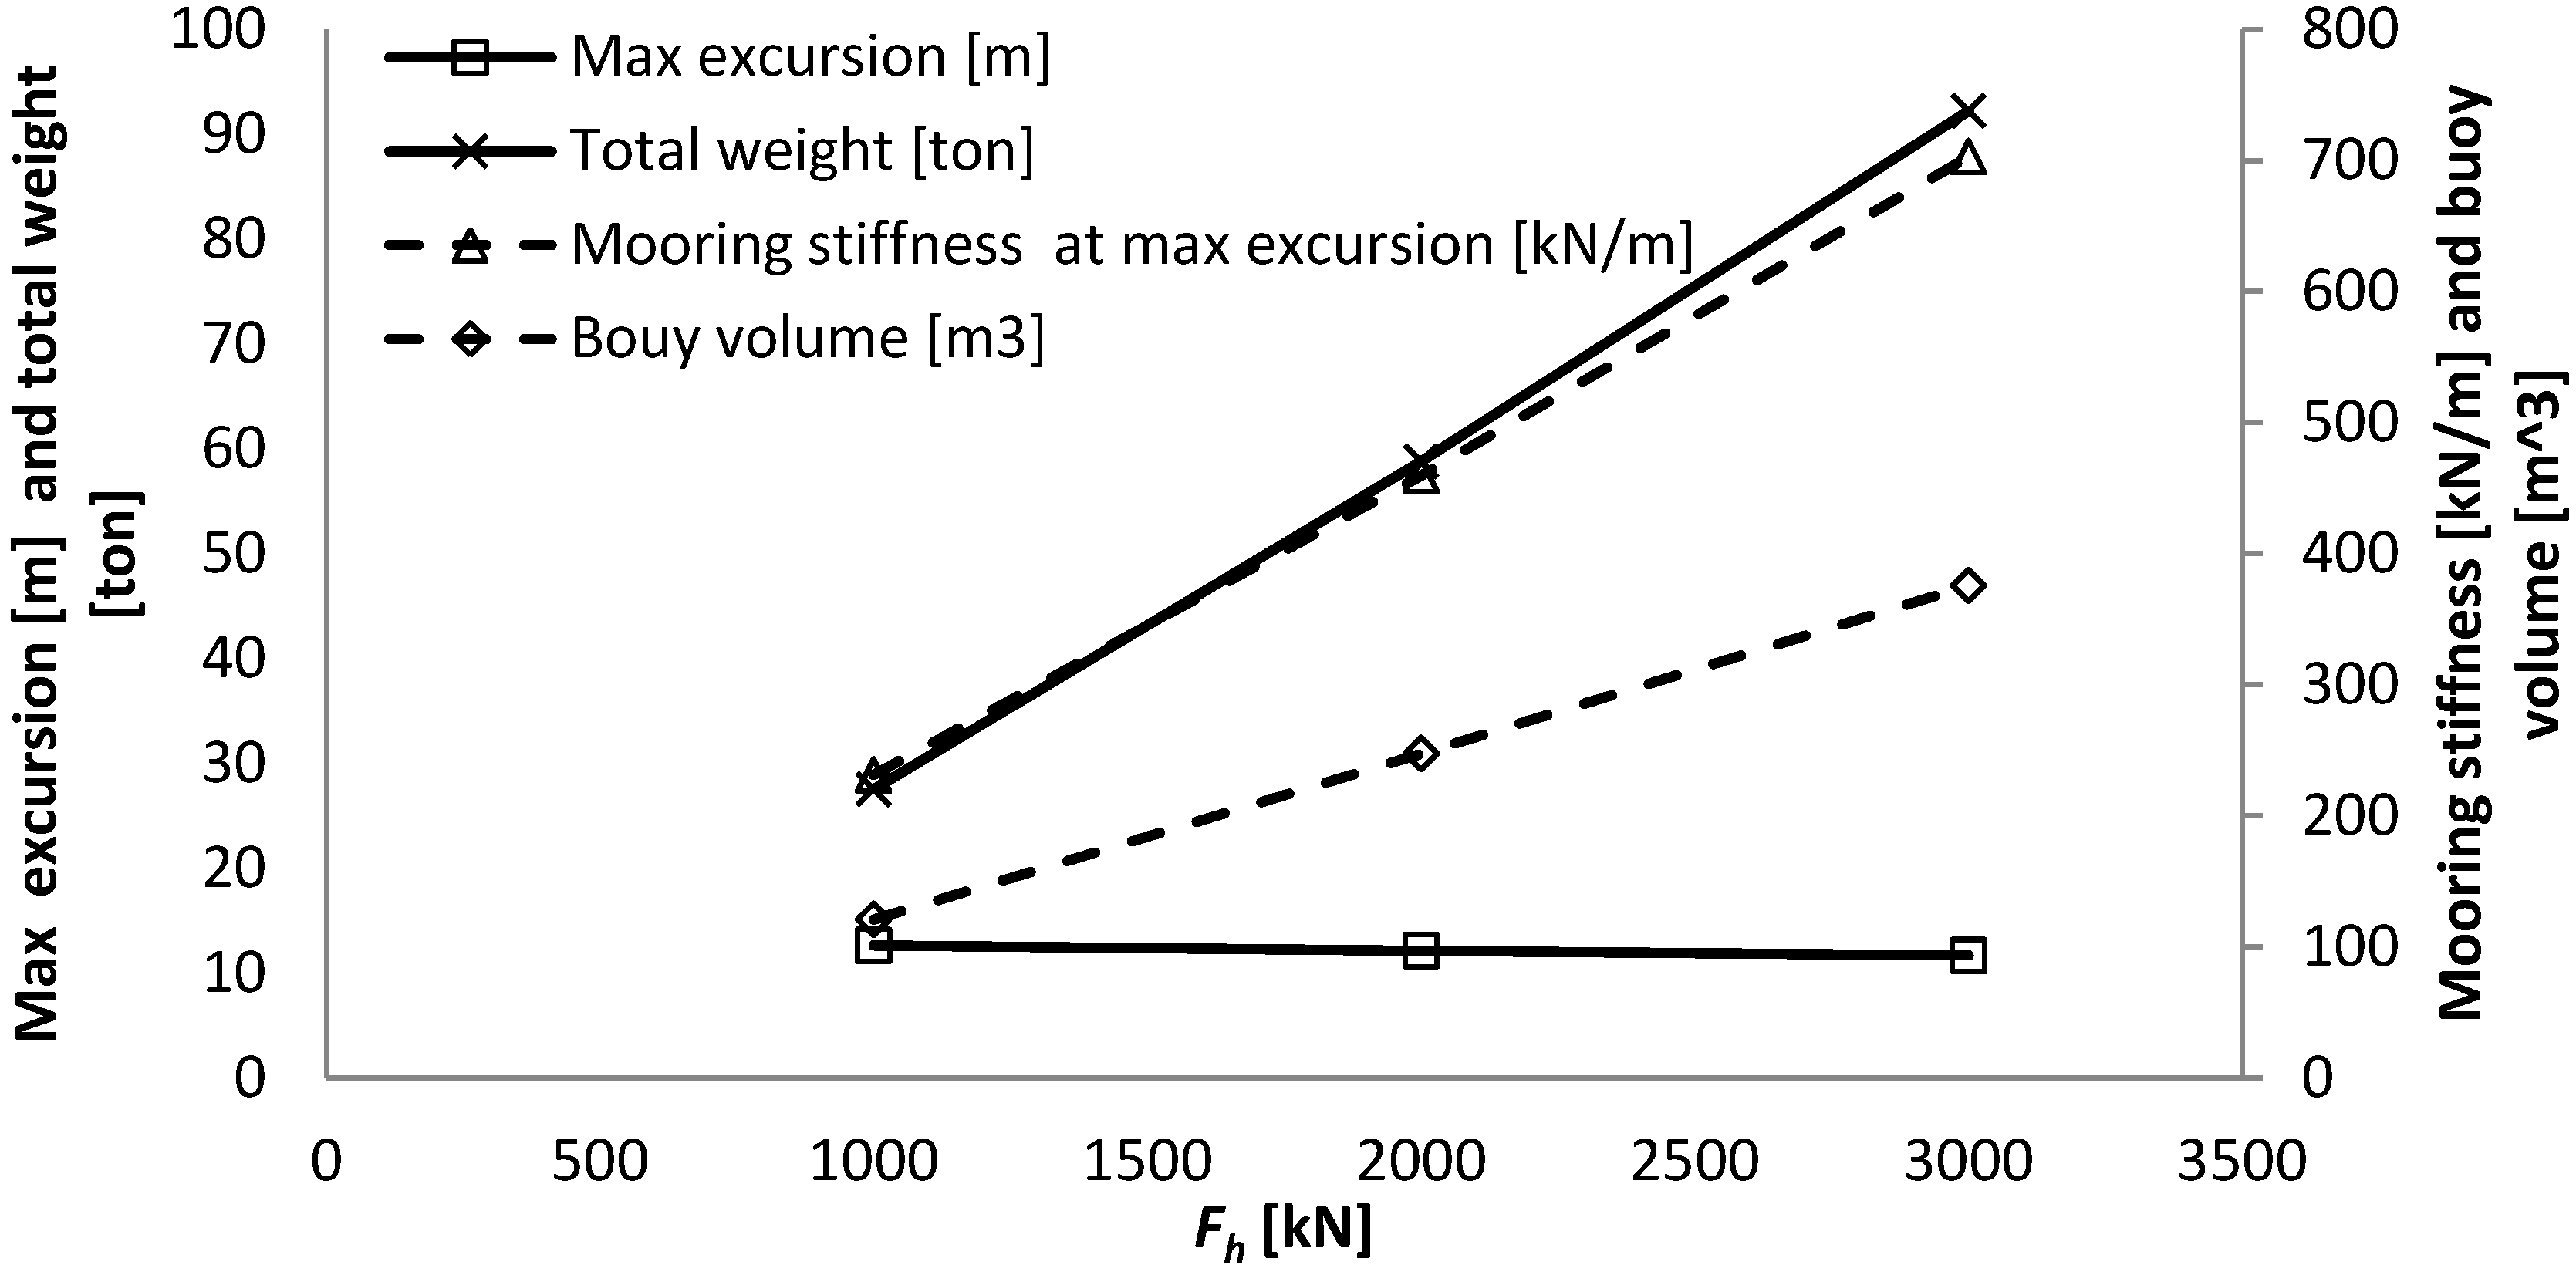
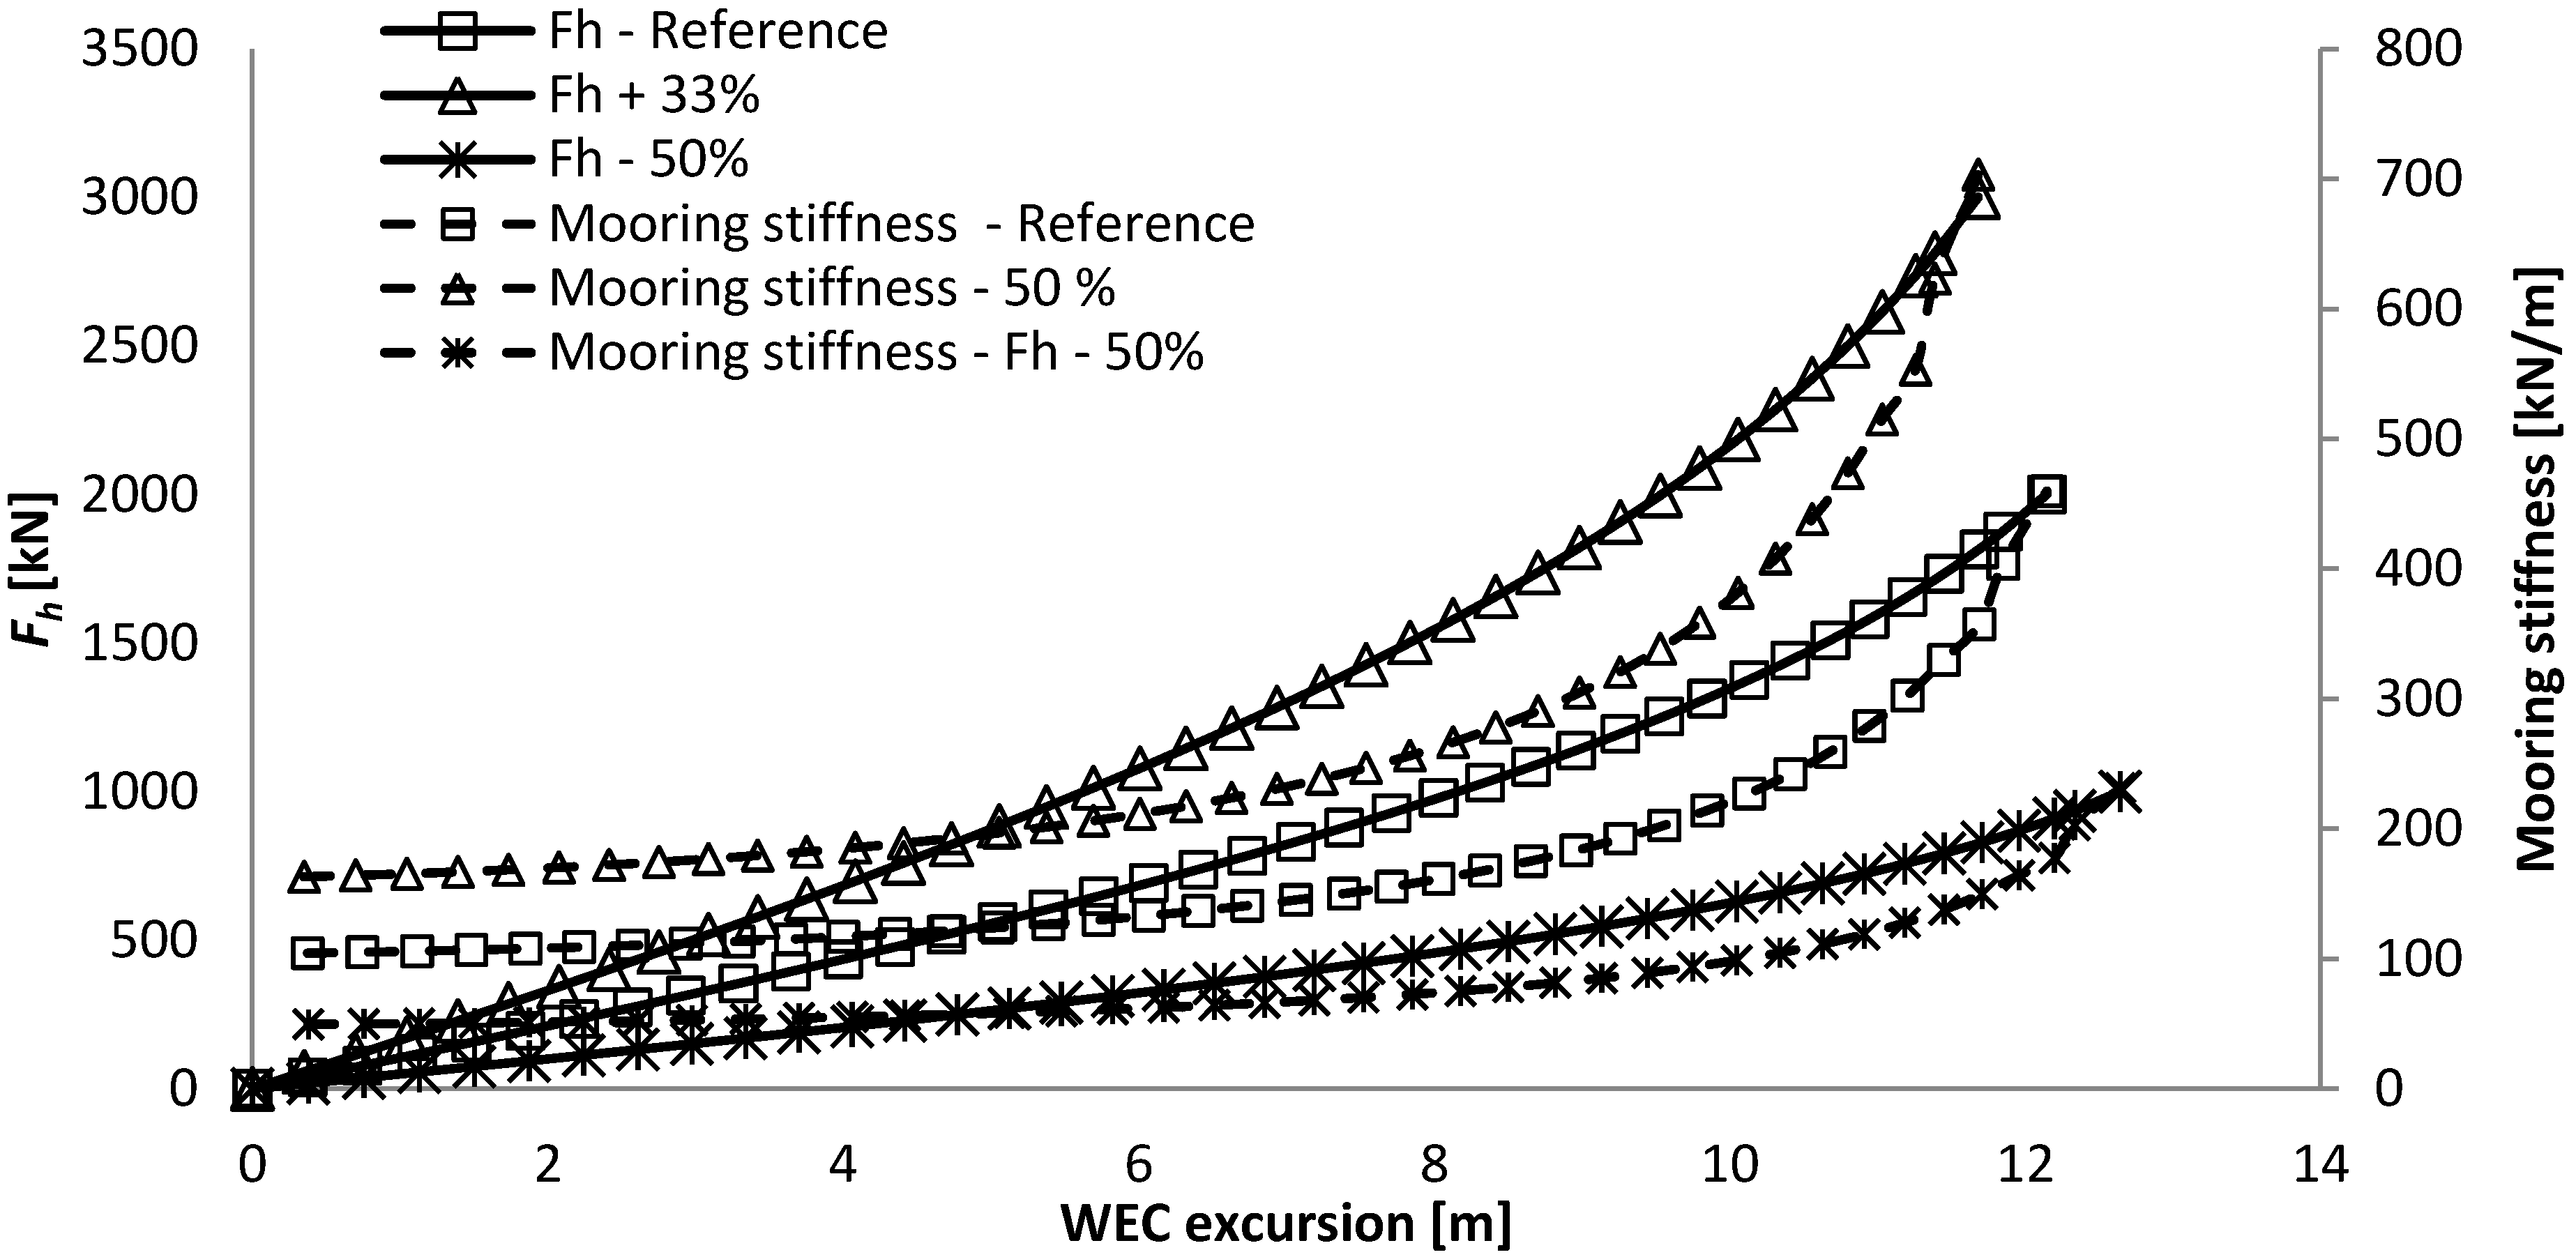
Table 4.
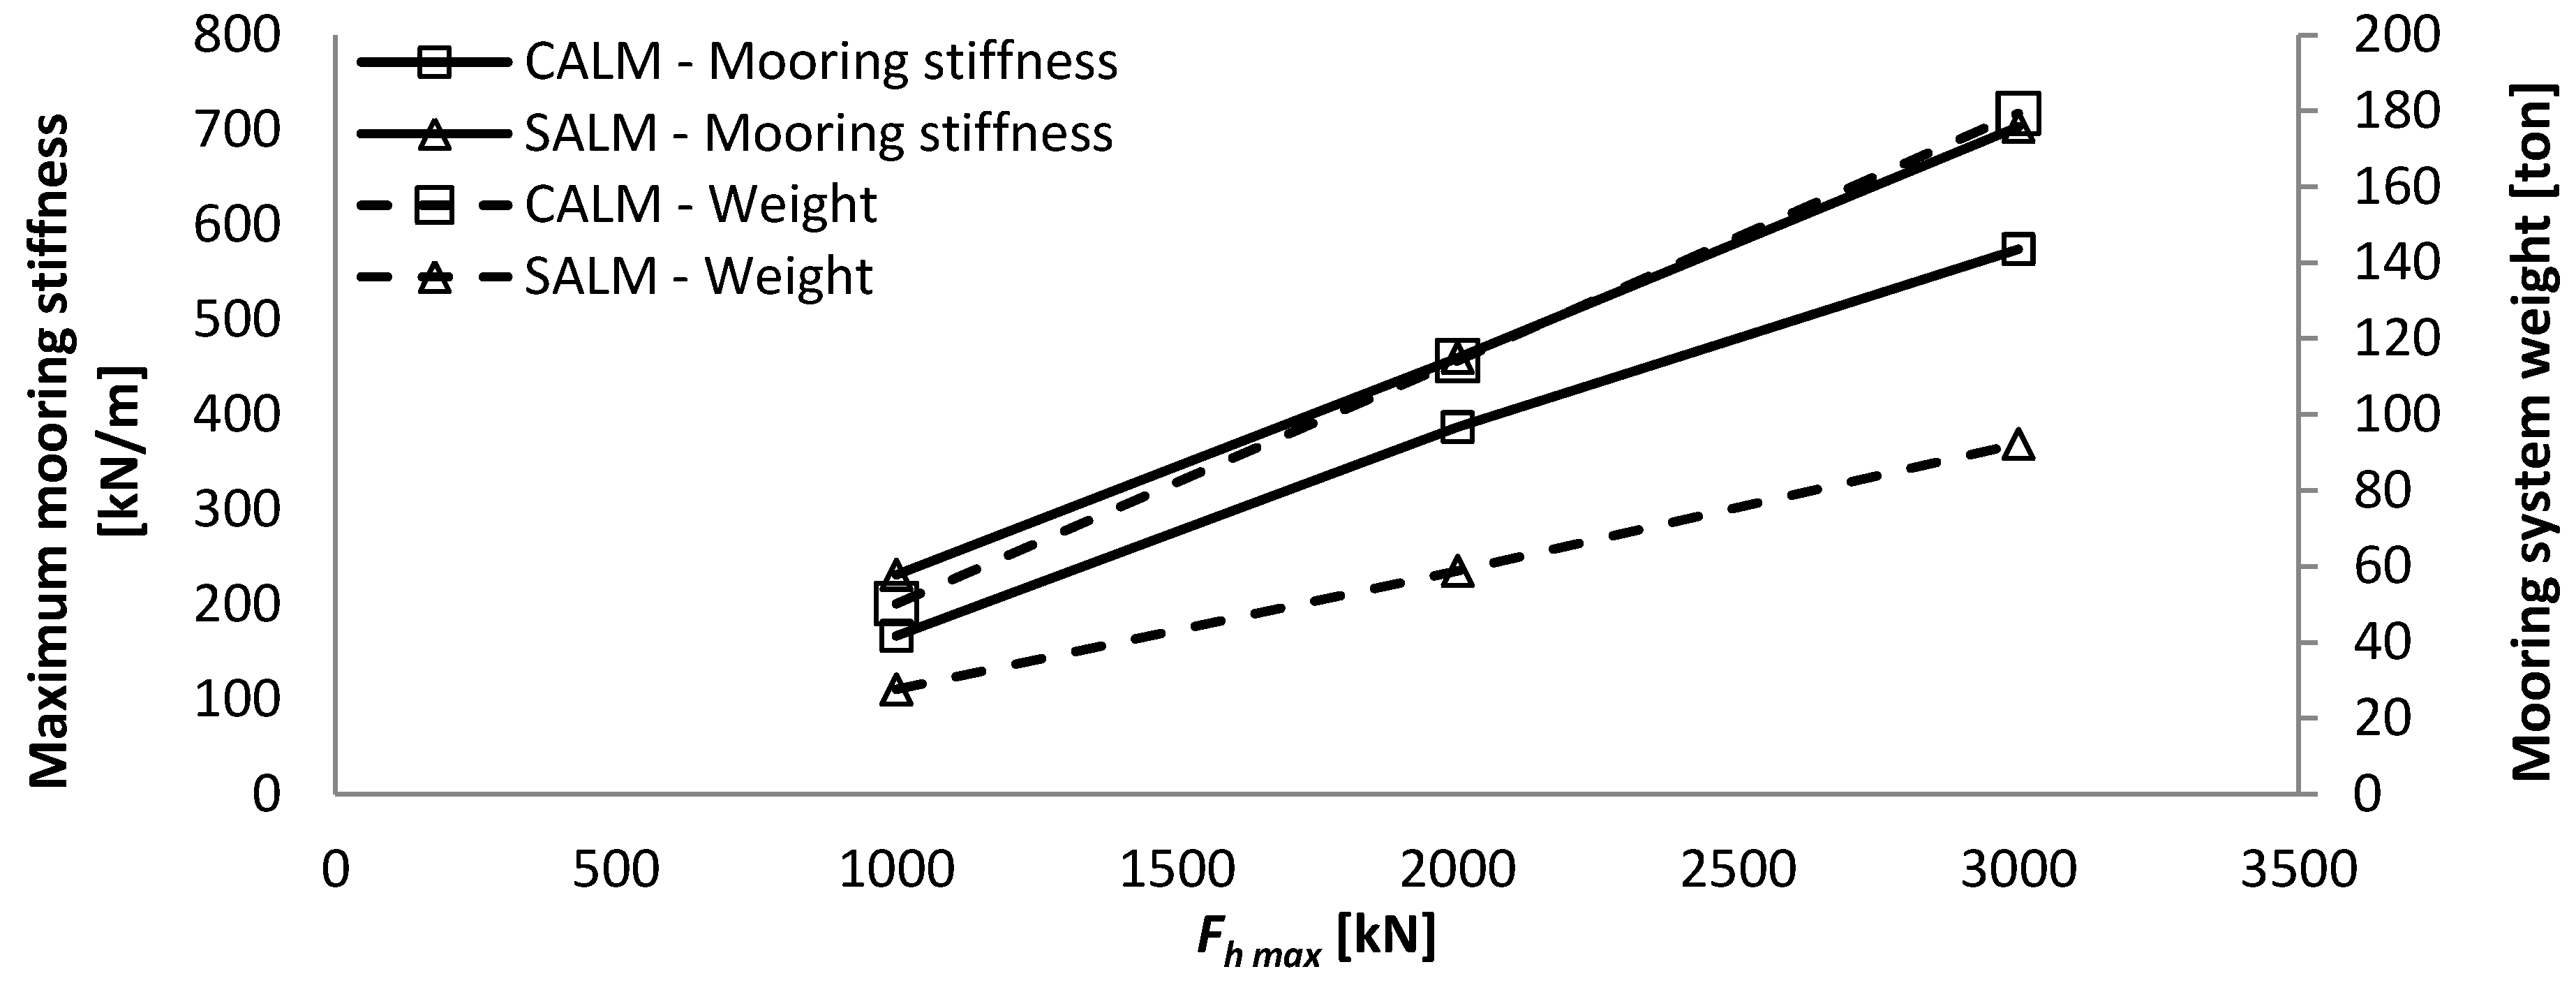
Main results from investigating the influence of horizontal design load at the WEC on a SALM system.
Table 4.
Main results from investigating the influence of horizontal design load at the WEC on a SALM system.
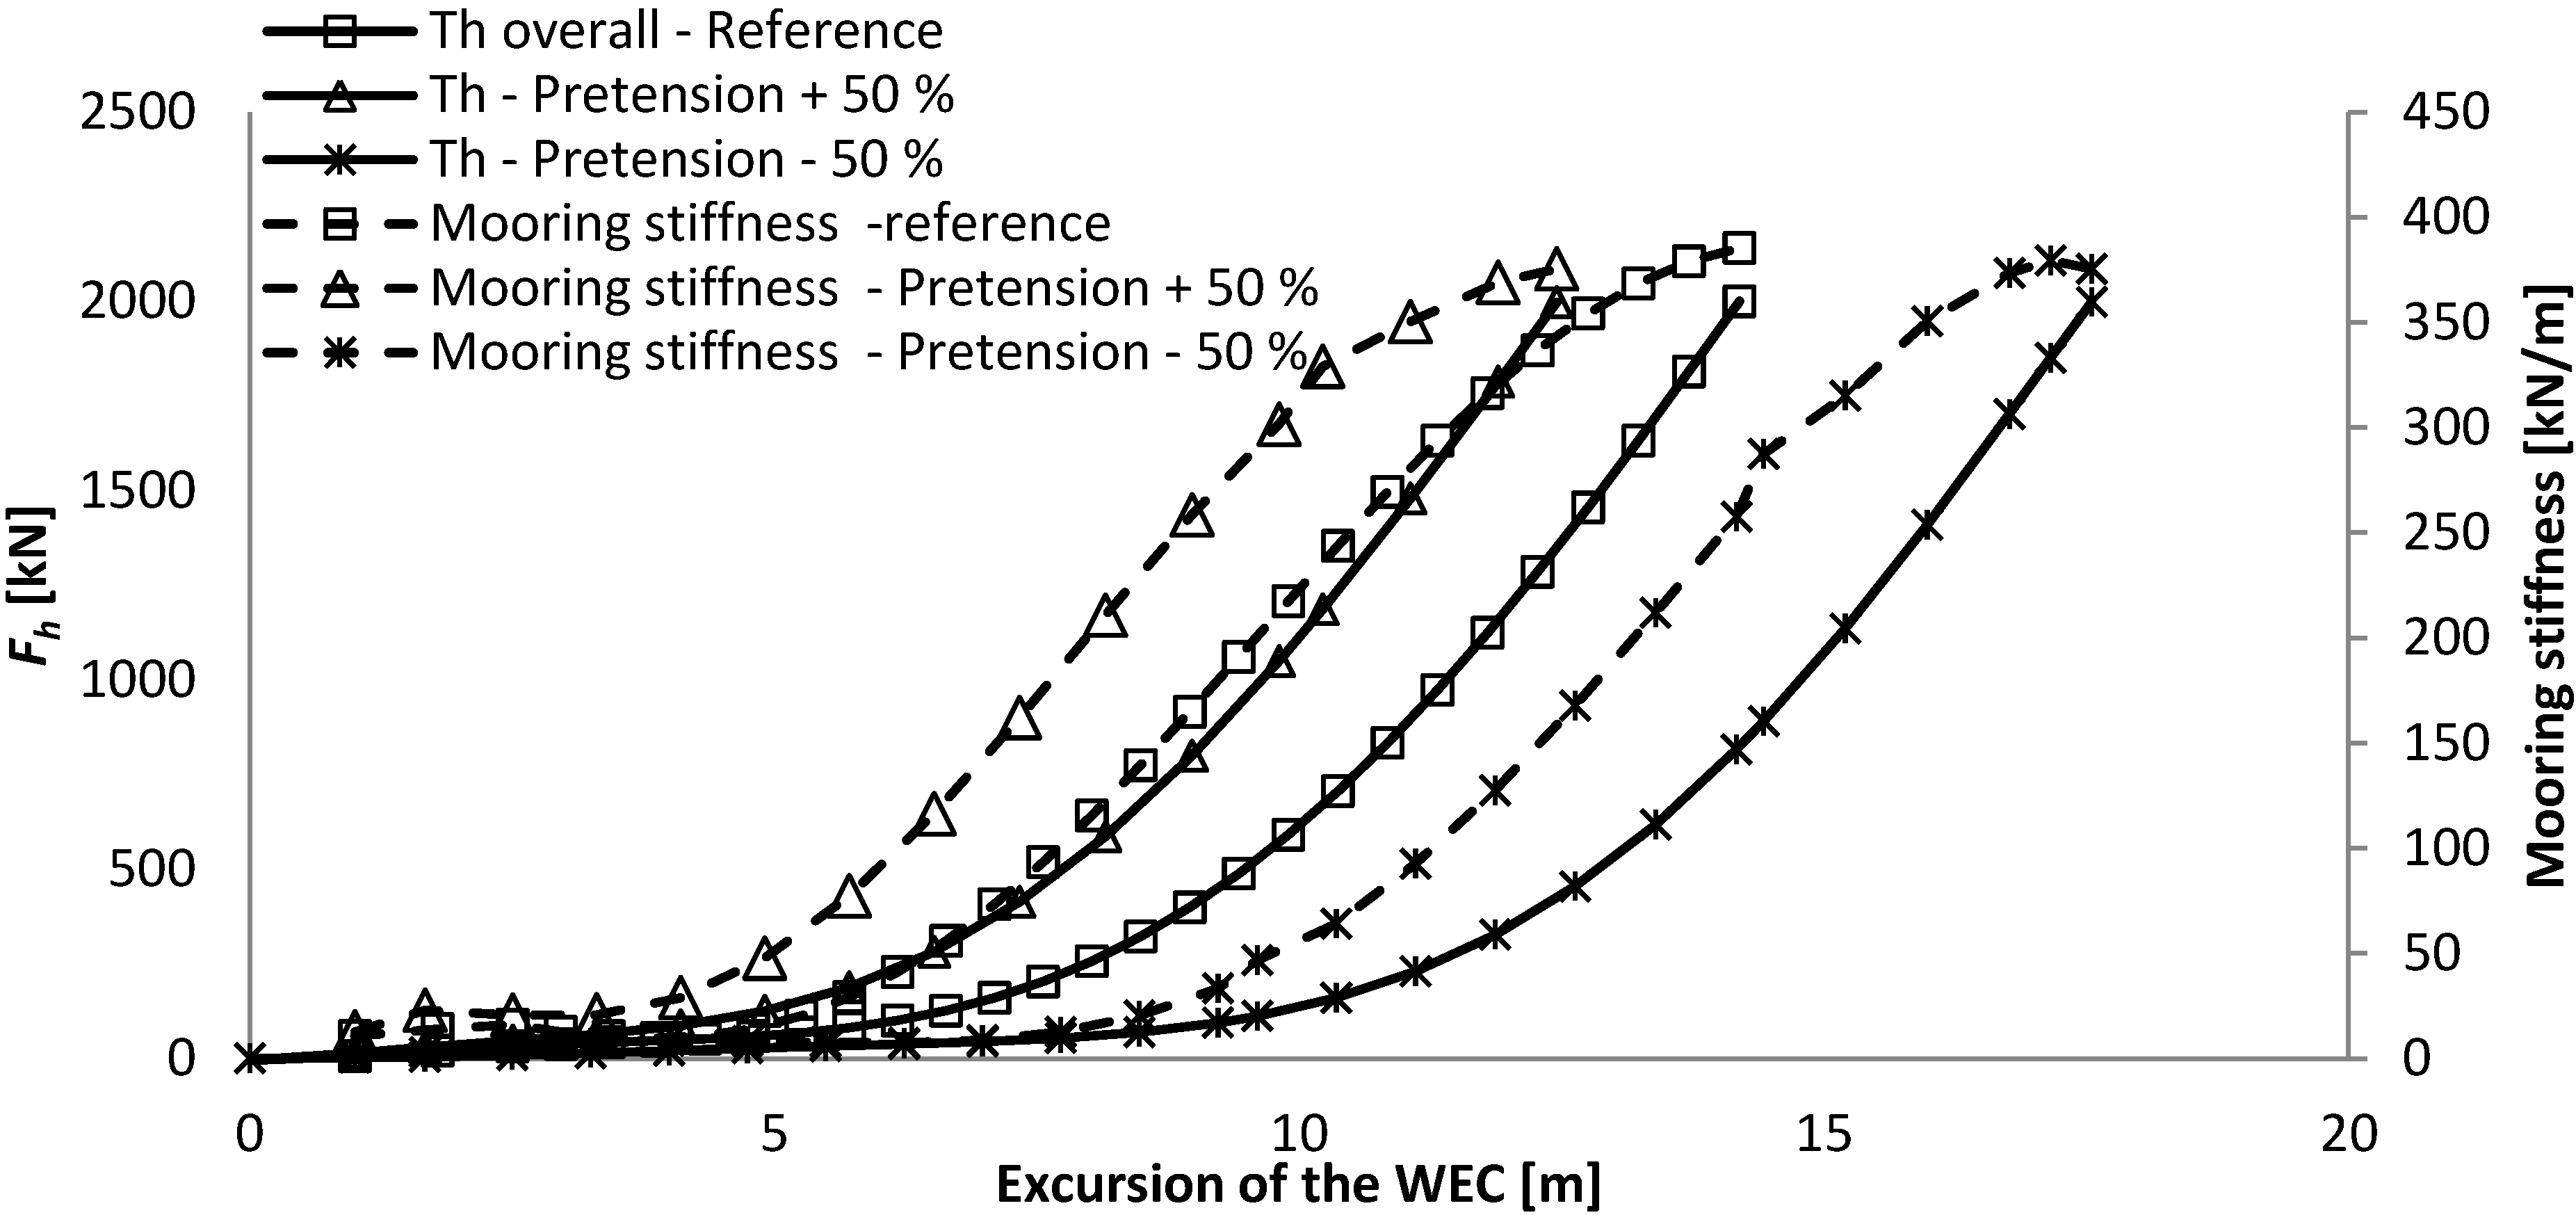
| | −50% Fh max | Reference | +50% Fh max |
|---|
| Horizontal design load
Fh max [m] | 1000 | 2000 | 3000 |
| Max excursion [m] | 12.6 | 12.1 | 11.7 |
| Mooring stiffness at max excursion [kN/m] | 231 | 460 | 703 |
| Alpha [°] | 43.2 | 42.6 | 42.2 |
| Beta [°] | 26.7 | 27.4 | 27.8 |
| Buoy volume [m3] | 121 | 248 | 376 |
| Equivalent to a cylinder of height and diameter [m] | 5.4 | 6.8 | 7.8 |
| Length l1,0 [m] | 21.2 | 20.5 | 20.0 |
| Fbuoy [kN] | 1063 | 2178 | 3308 |
| Max T1 [kN] | 1459 | 2957 | 4466 |
| Max T2 [kN] | 1119 | 2254 | 3393 |
| Suction anchor diameter [m] | 2.75 | 3.75 | 4.5 |
| Suction anchor height [m] | 5.5 | 7.5 | 9 |
| Suction anchor lid thickness [mm] | 100 | 100 | 100 |
| Suction anchor wall thickness [mm] | 19 | 26 | 31 |
| Suction anchor weight [ton] | 12 | 27 | 44 |
| Total weight [ton] | 28 | 59 | 92 |
4.6. Buoy
The buoys are assumed to have a weight density of 125 kg/m3 and to be of equal height as diameter. The volume of the buoy is calculated to provide the required buoyancy force, which is described in the section of the CALM and SALM systems.
6. Observations and Conclusions
Quasi-static analyses on two different types of mooring systems have been performed for a reference load case and for three other cases, where an important environmental or design parameter has been modified. The mooring systems are a three-legged catenary anchor leg mooring (CALM) system and a single anchor leg mooring (SALM) system, also referred to as a tension leg mooring system. The reference case corresponds to a horizontal design load at the WEC of 2000 kN and a water depth of 30 m. Around this reference case, the influence of a main mooring design parameter was investigated, as well as the influence of the water depth and of the horizontal design load at the WEC on the design of the mooring systems.
The main observations for the CALM system are:
- -
The reference case consists of chains that are each 509 m long and have a diameter of 50 mm, the maximum excursion of the WEC is 14.2 m and the total weight of the system is 132 ton.
- -
The force-displacement curve remains very low up to half the excursion, as at an excursion of 7.0 m the resulting horizontal mooring force is still only of 178 kN, where it then starts to increase exponentially.
- -
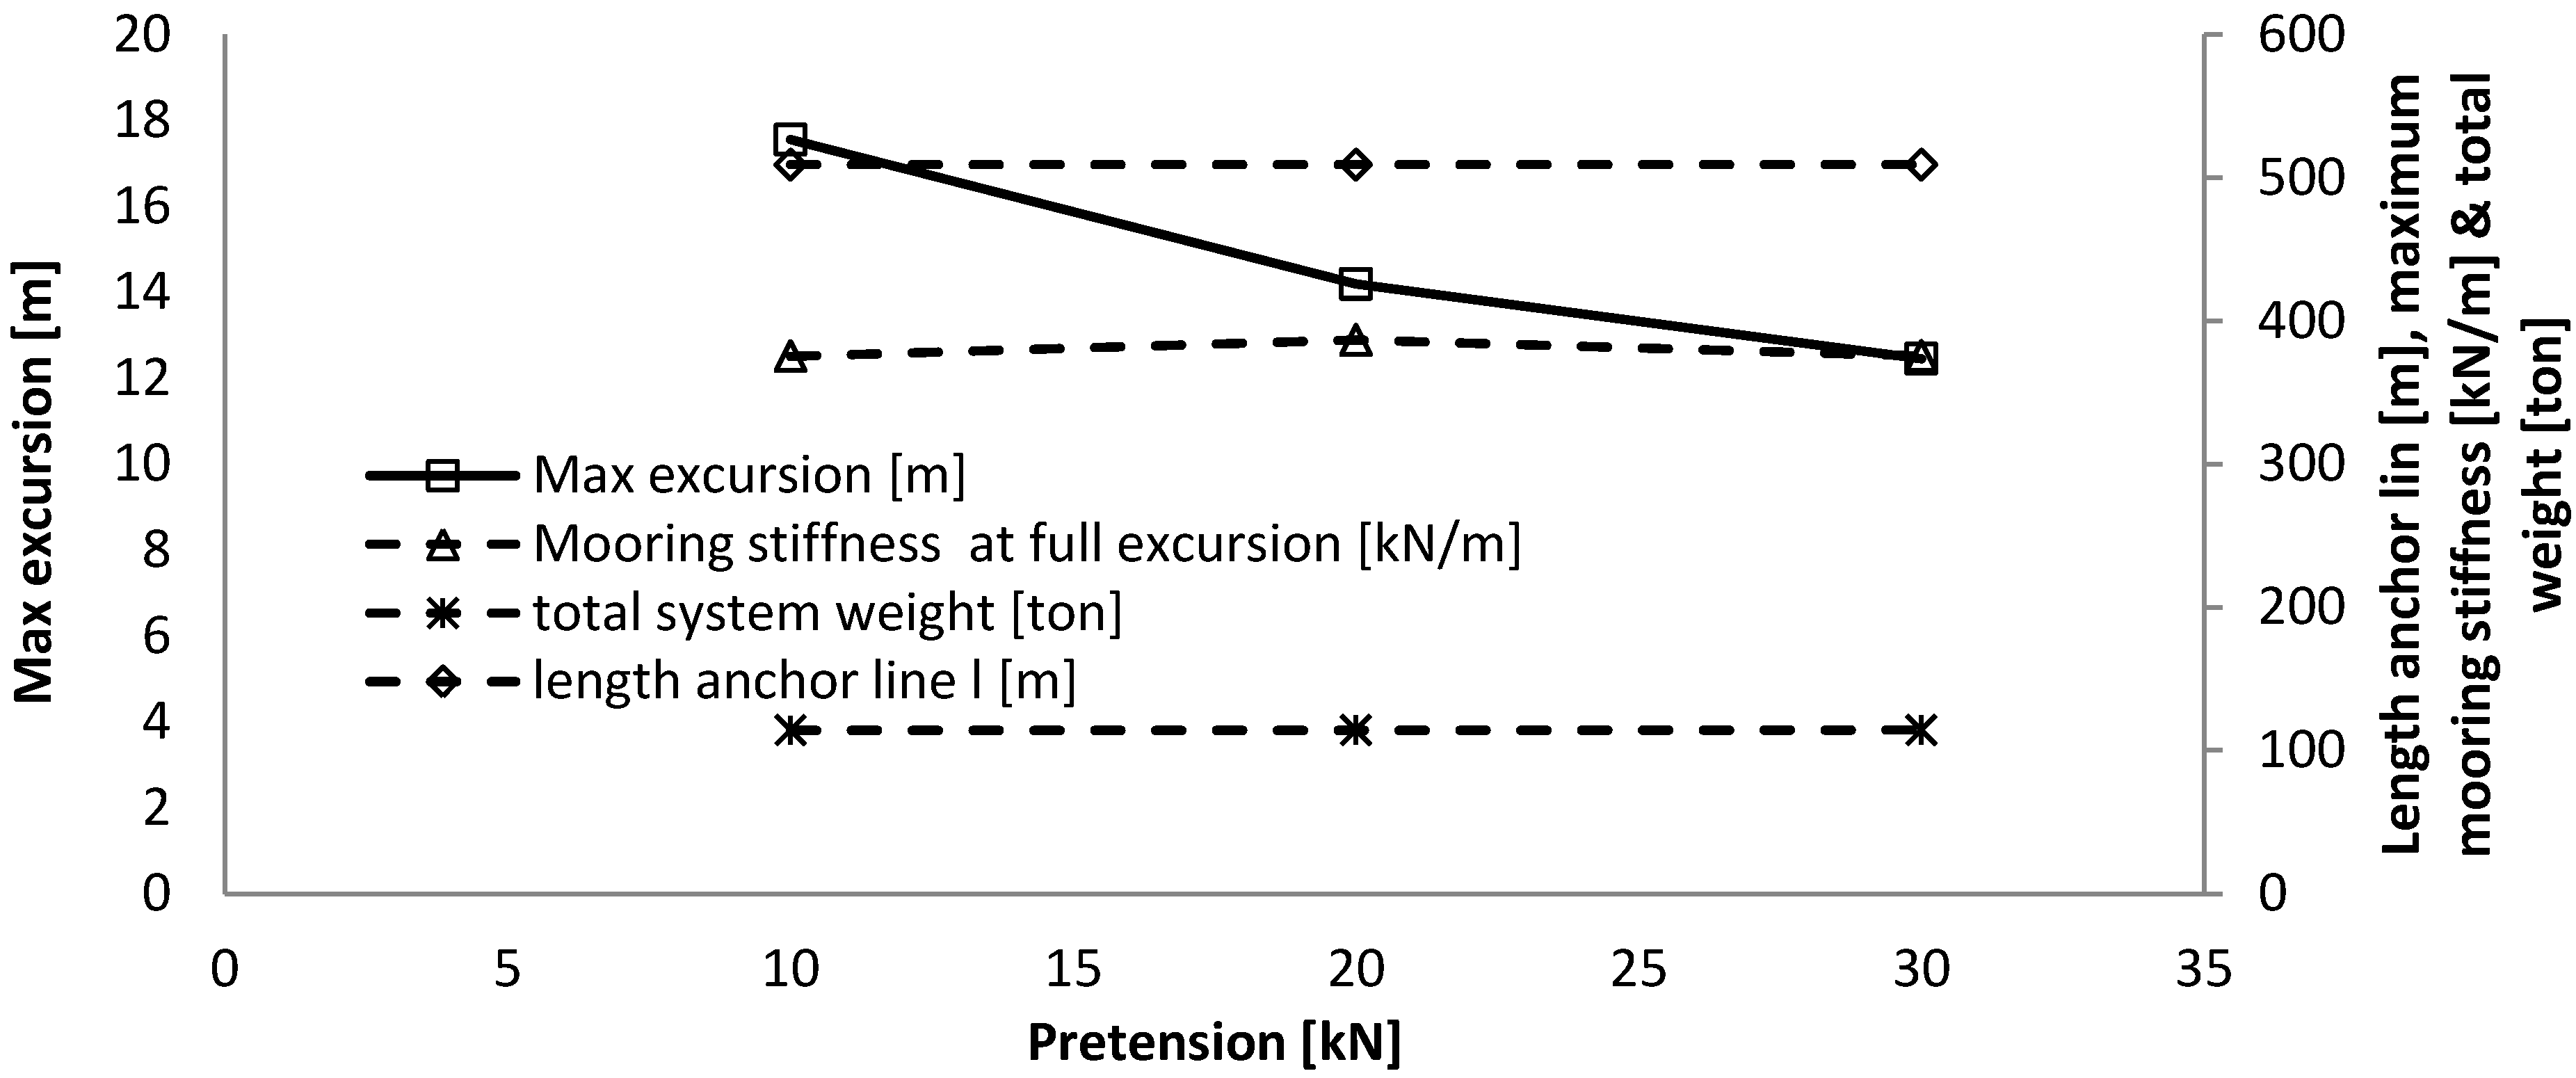
The pre-tension influences mainly the maximum excursion of the system, but not the mooring stiffness, as the force-displacement curve has the same shape and inclination, but is just translated. It might thereby not have an influence on the dynamic response of the system.
- -
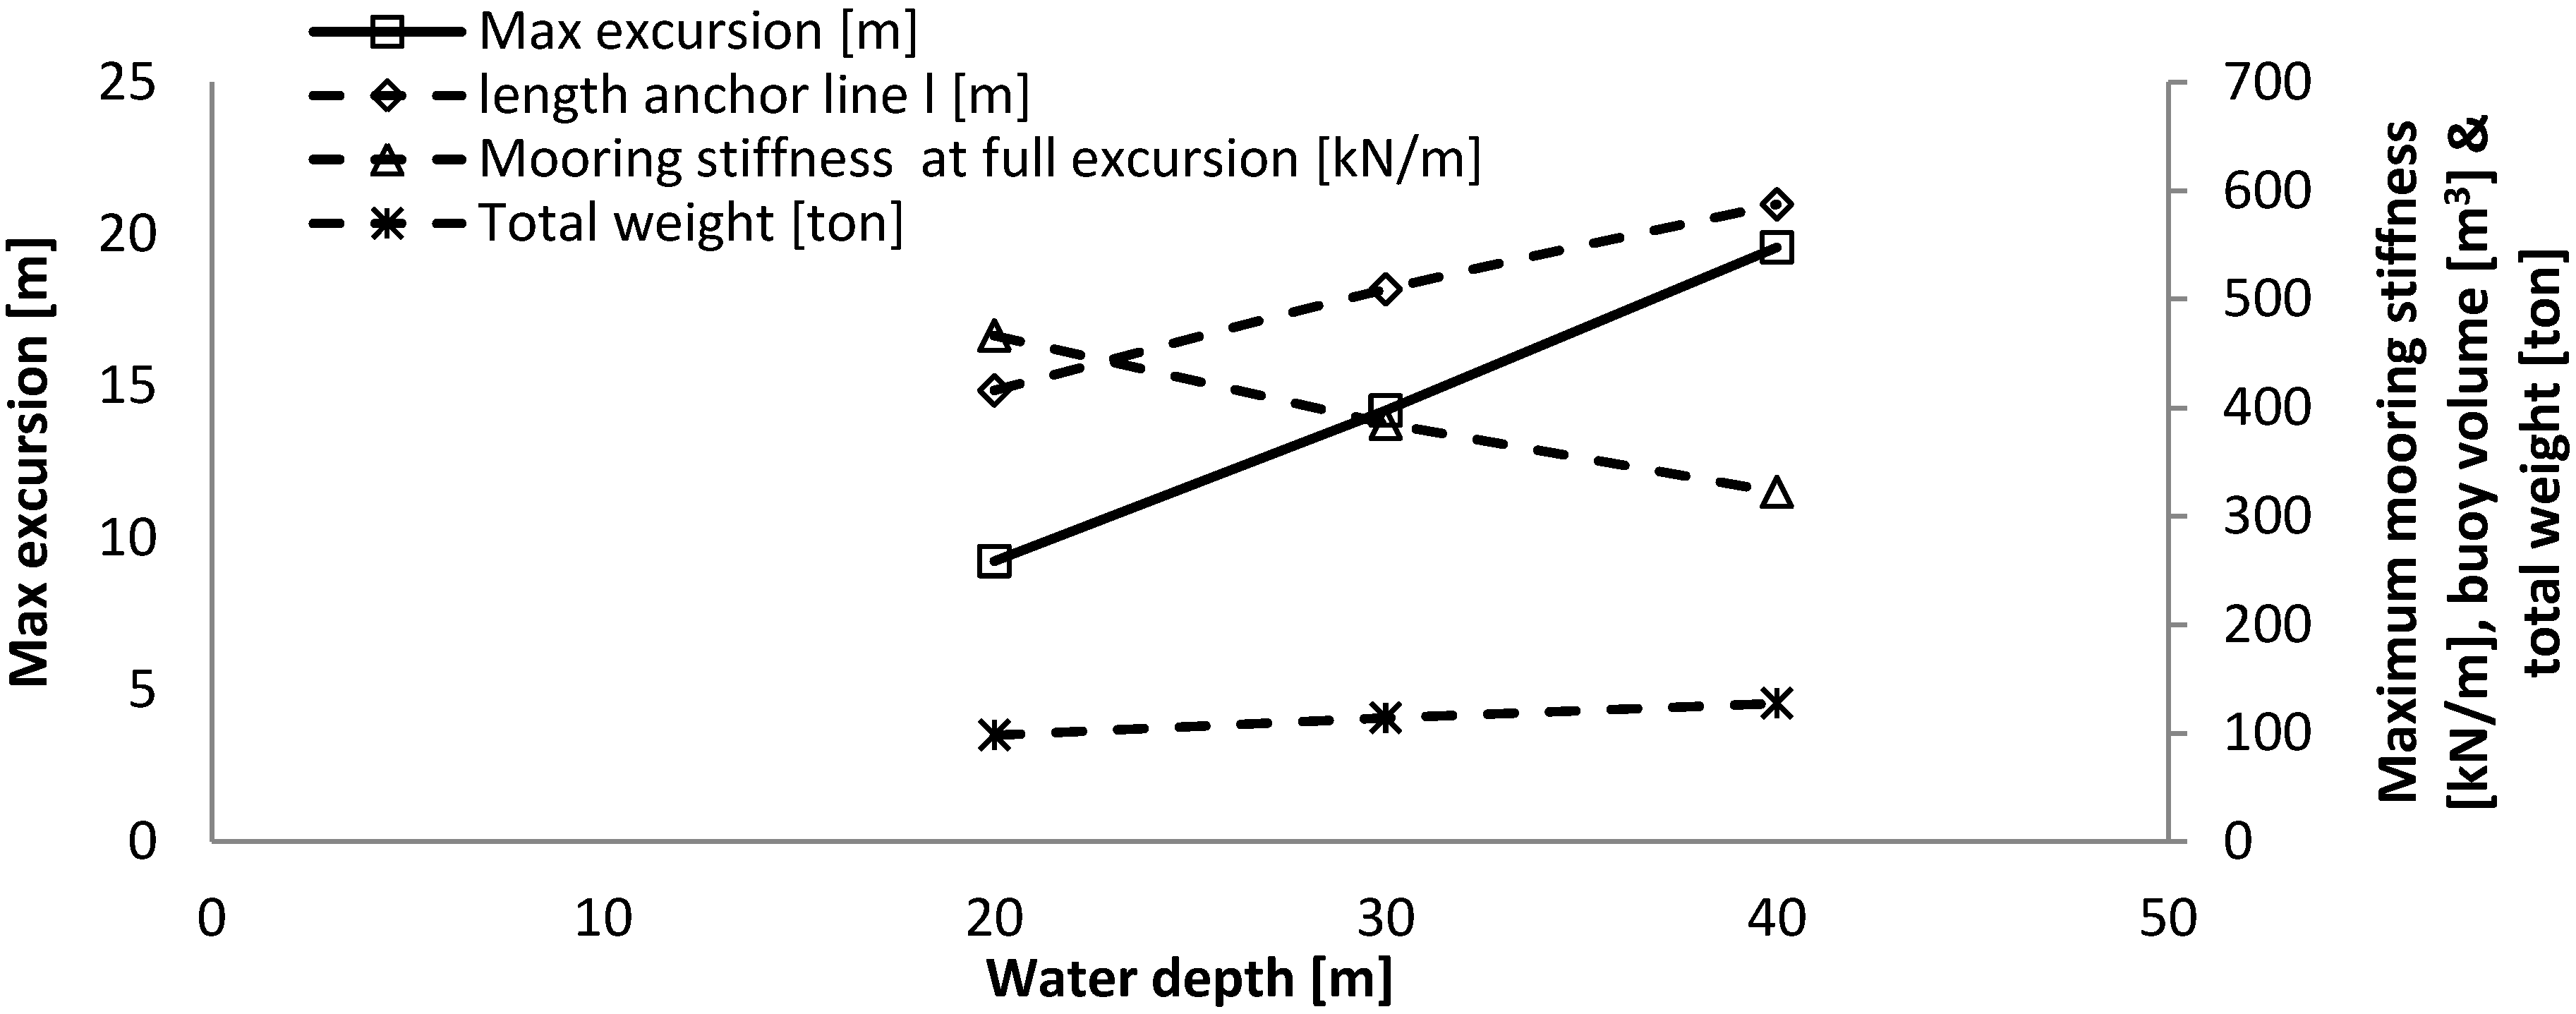
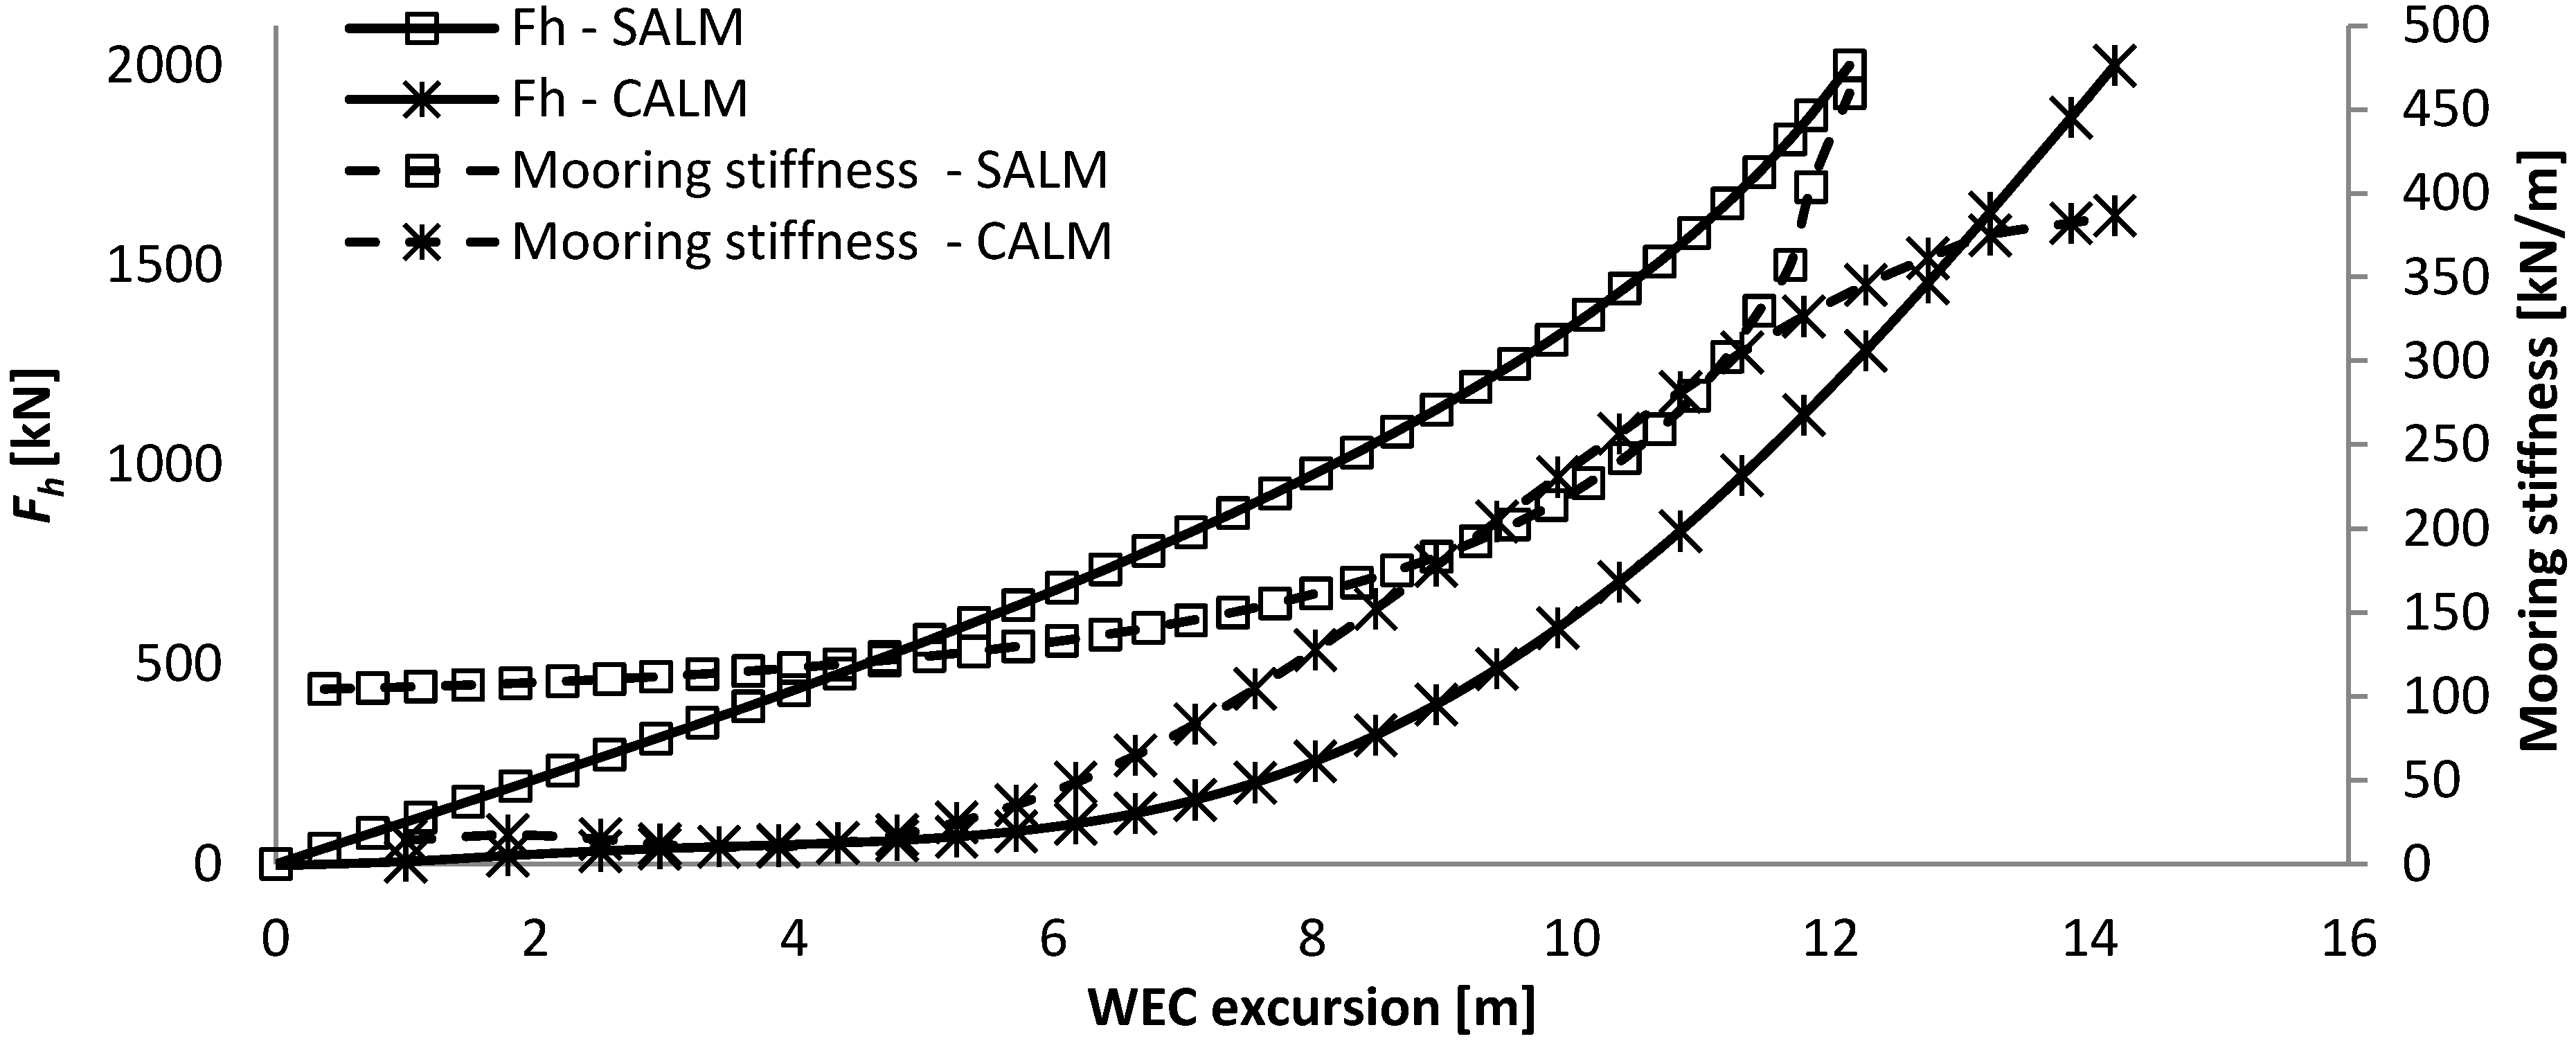
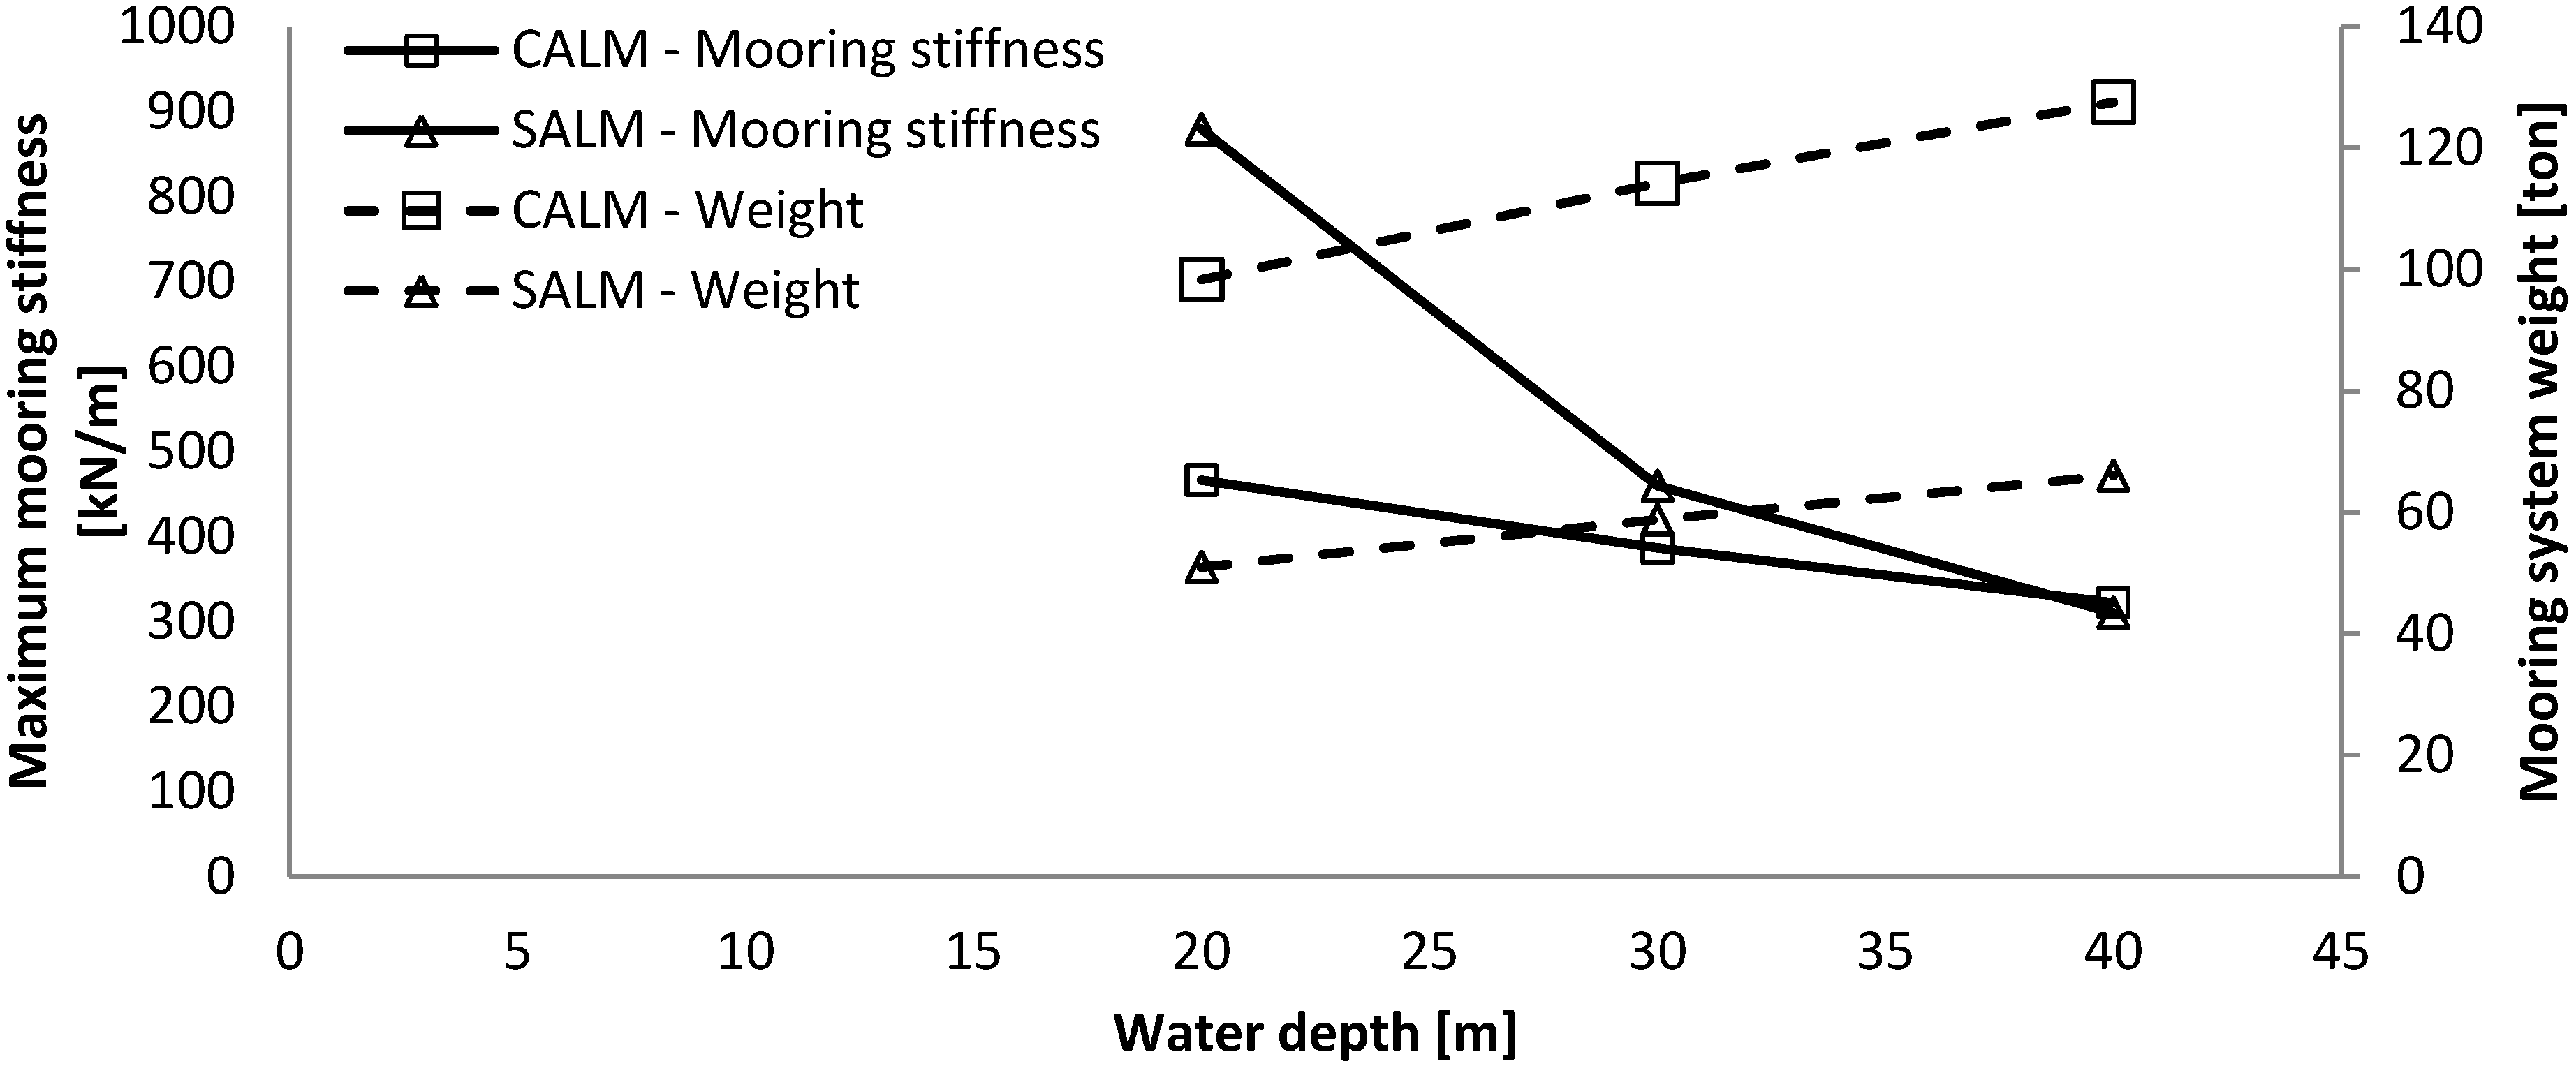
For greater water depths, the length of the same mooring lines needs to be increased, resulting in a larger maximum excursion of the WEC and a lower maximum mooring stiffness.
- -
For larger horizontal mooring forces, the submerged weight and dimension of the chains need to be significantly increased; while their required length remains roughly the same. This results in an increase in maximum WEC excursion and maximum mooring stiffness.
The main observations of the SALM system are:
- -
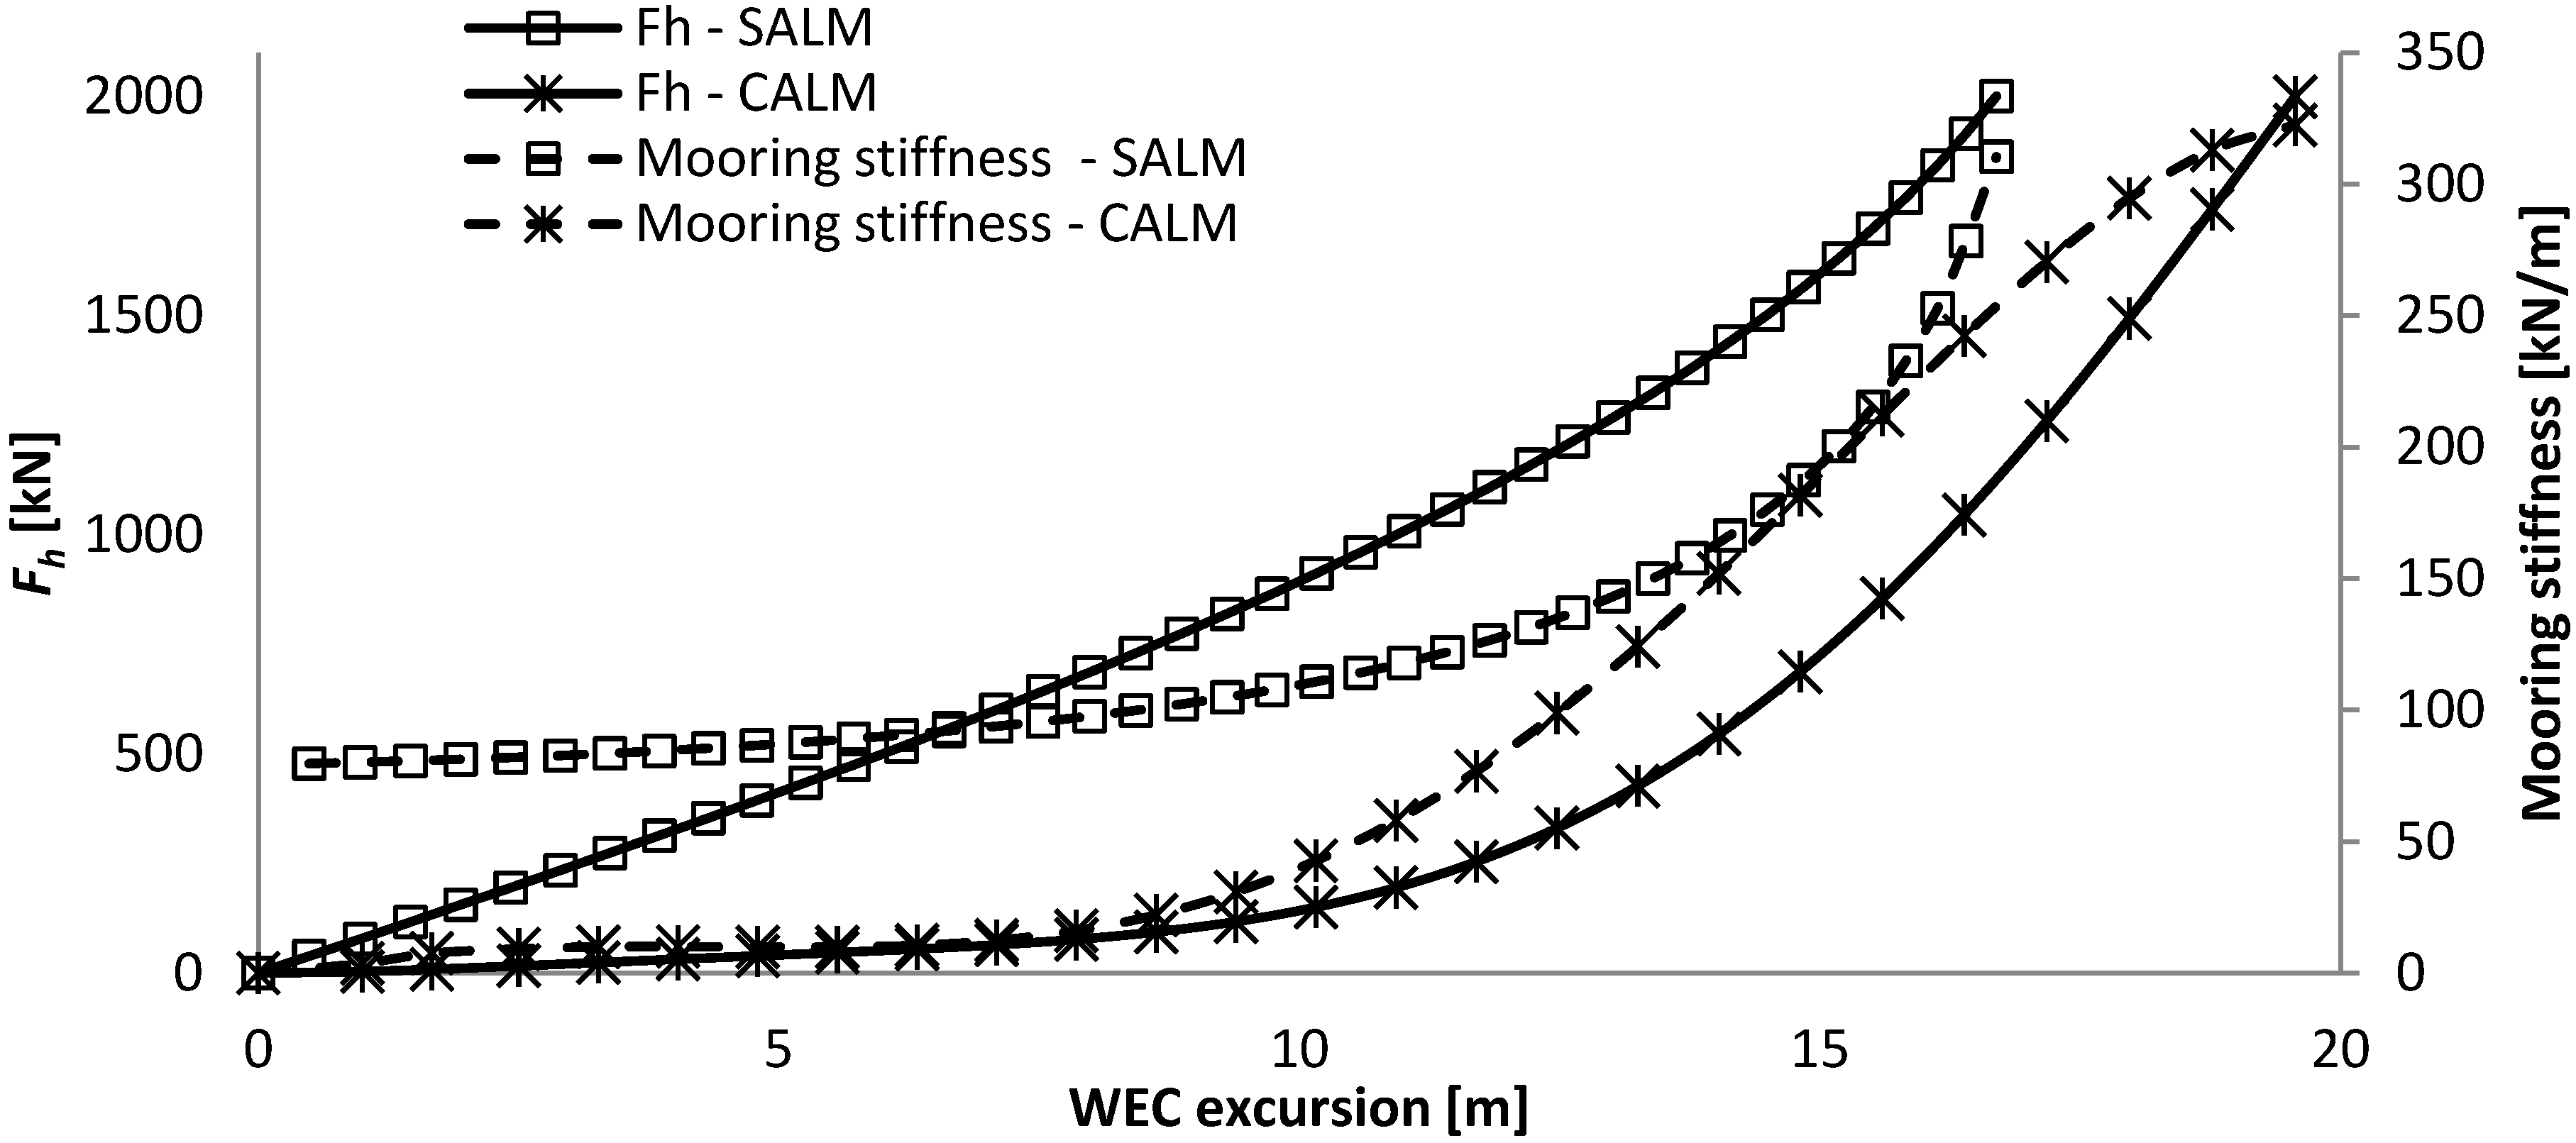
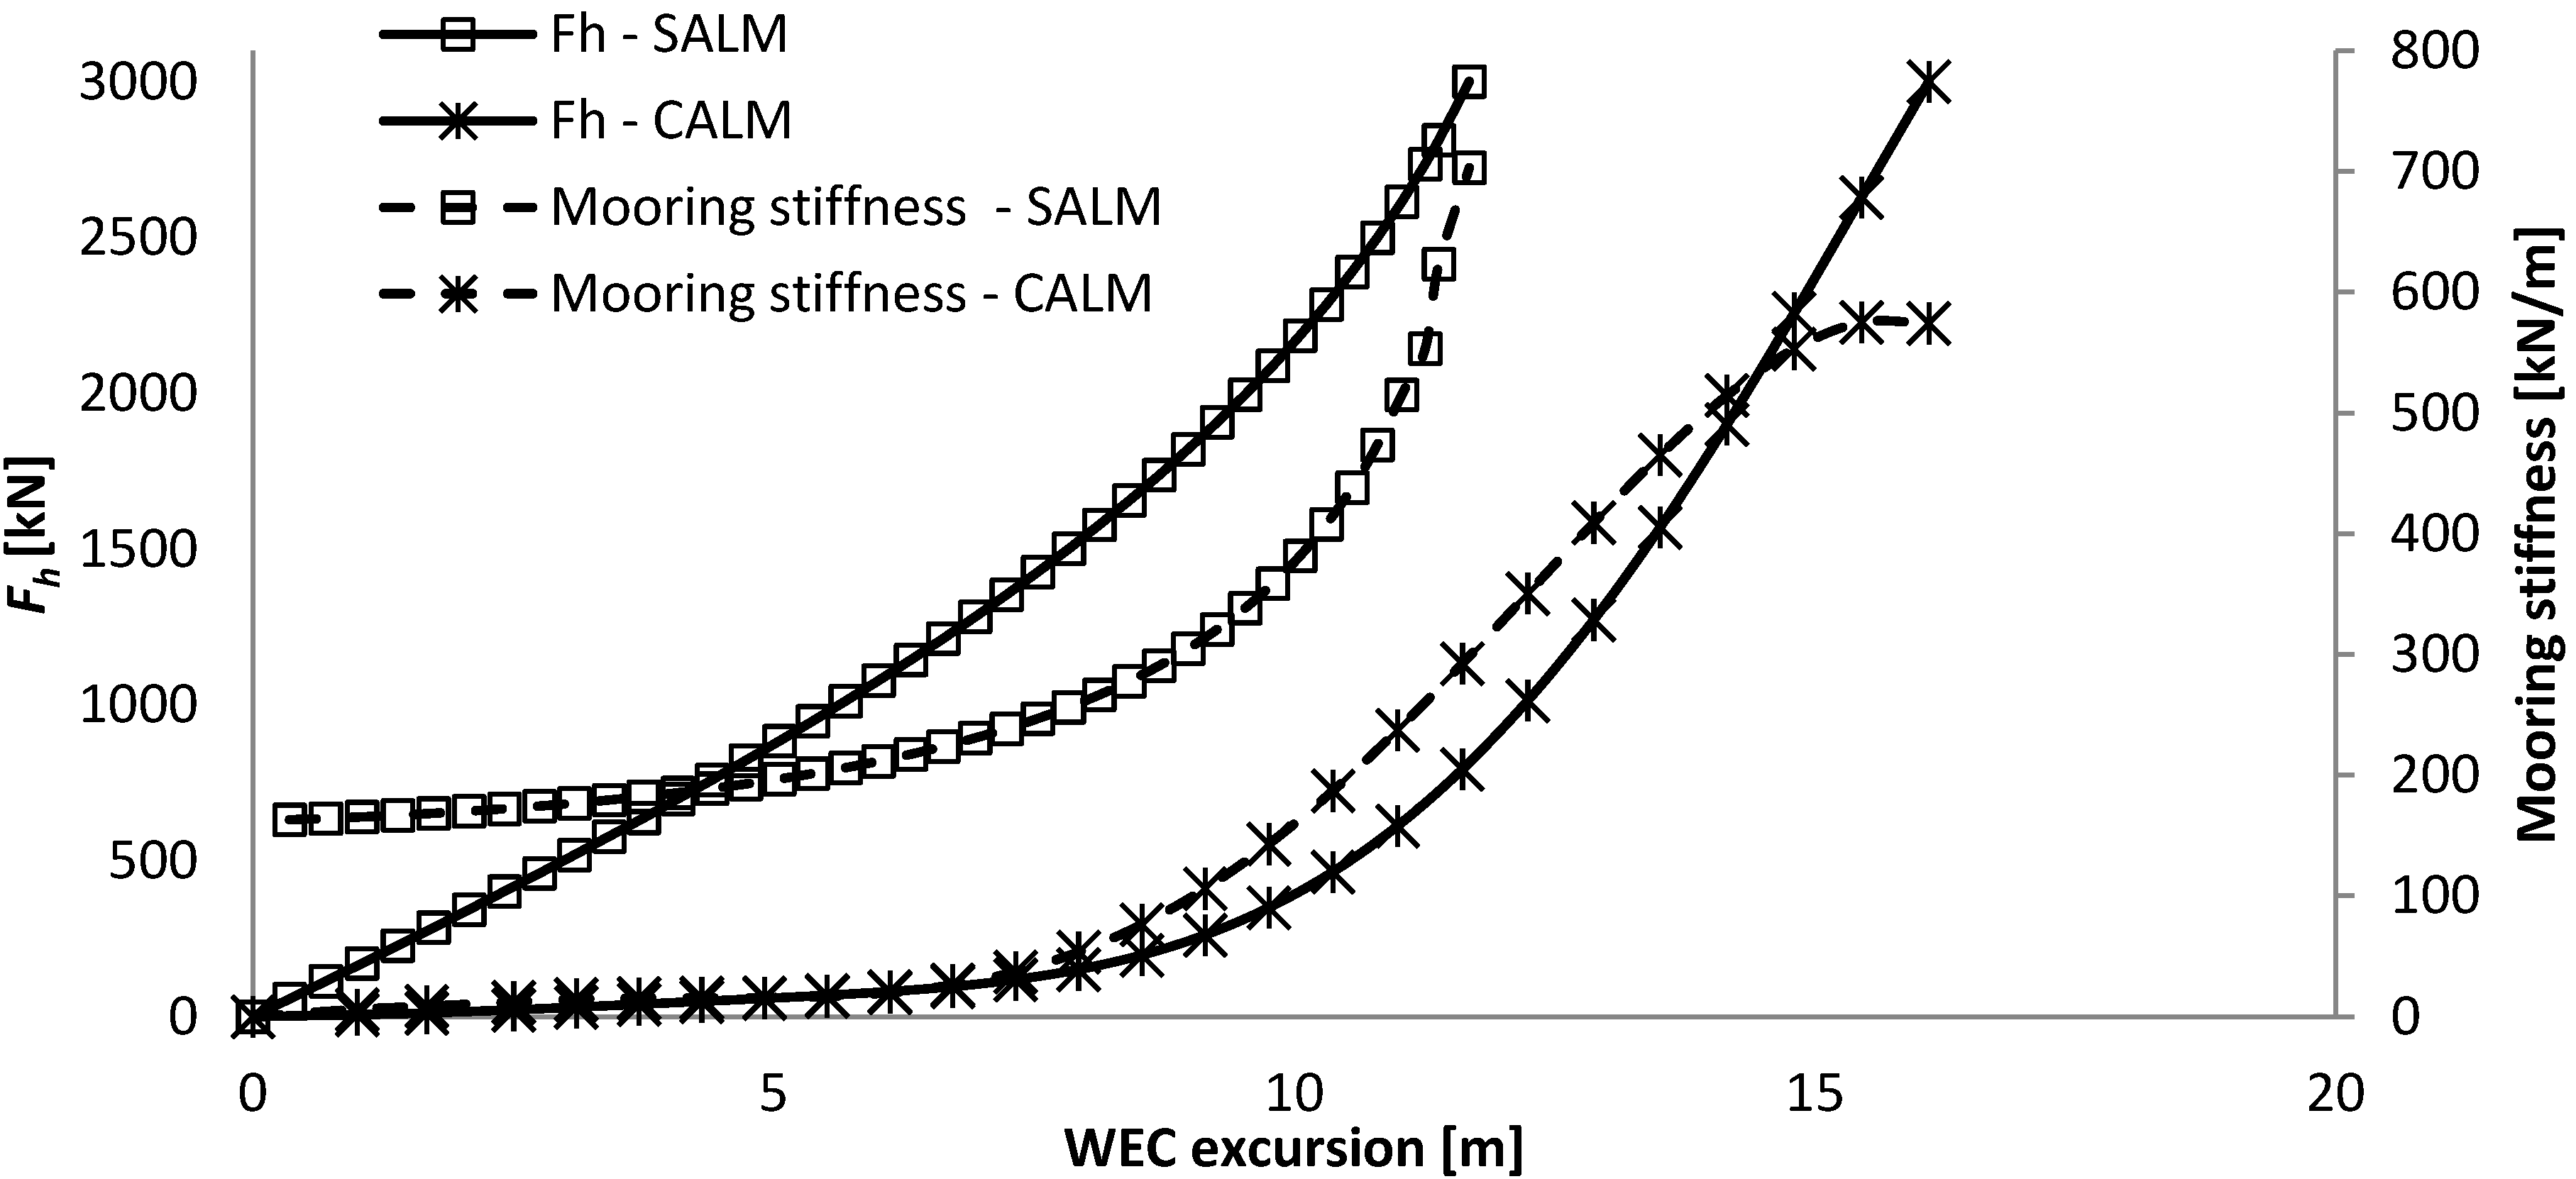
As the system is always under tension, the mooring stiffness is present from the smallest WEC excursion. The mooring stiffness increases almost linearly with the excursion of the WEC up to about 80% of the maximum excursion of the WEC (12.1 m), and then it increases exponentially. The total weight of the system is 60 ton.
- -
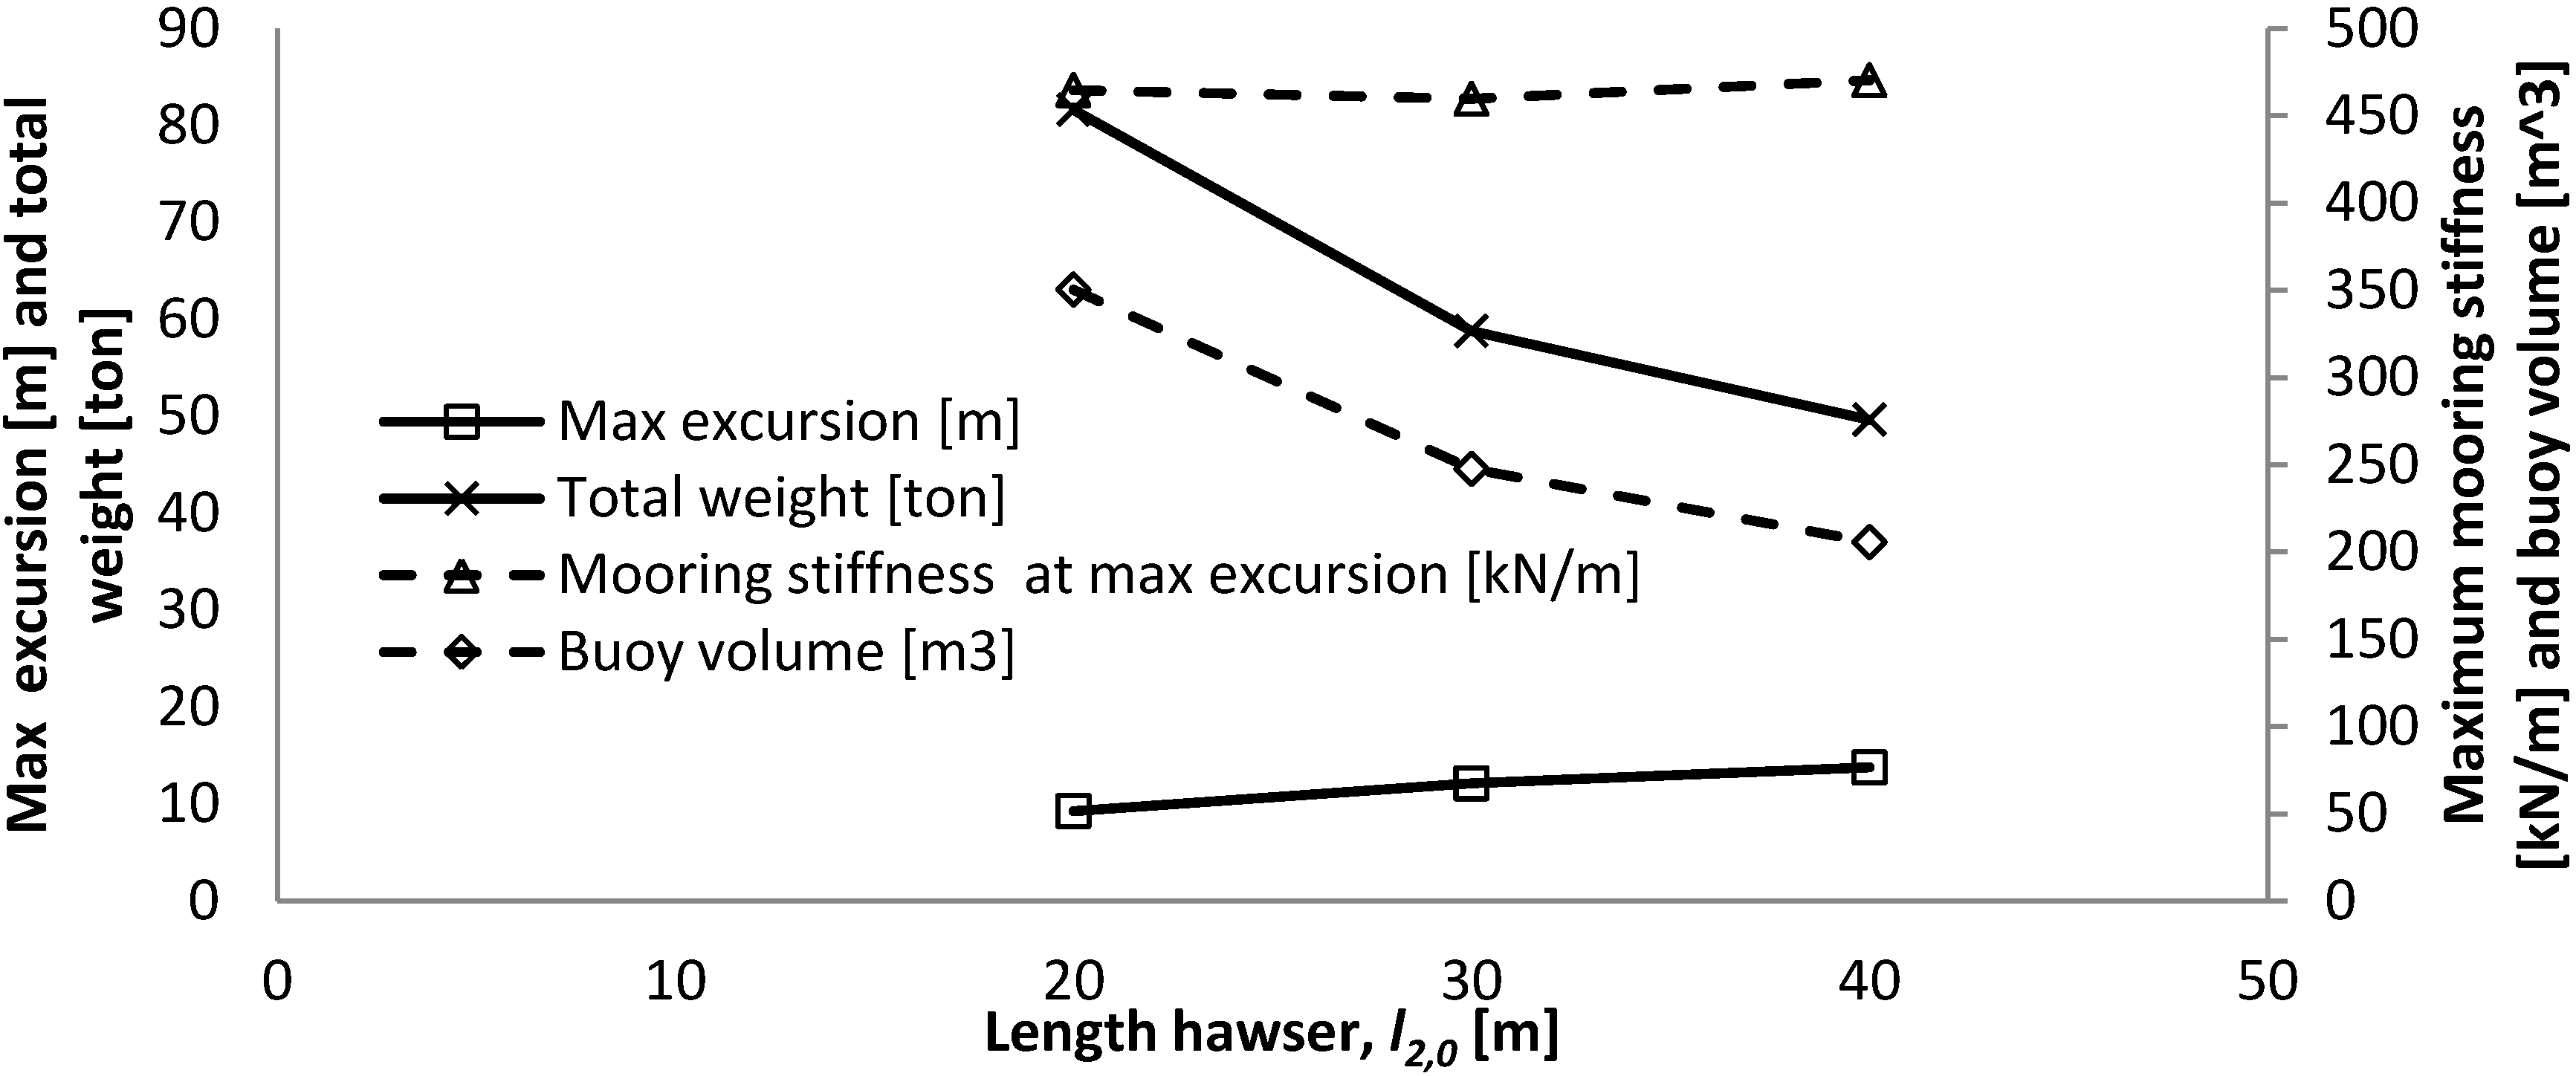
The length of the hawser has a significant influence on the maximum excursion of the WEC, while it does not affect the mooring stiffness as the volume of the buoy changes inversely.
- -
In this quasi-static analysis, the length of the tether was set in relationship with the water depth. A larger water depth mainly decreases the maximum mooring stiffness, while it increases slightly the volume of the buoy and the maximum excursion of the WEC.
- -
The increase in horizontal design load is, in this case, compensated directly by an increase in the volume of the buoy. This influences the maximum mooring stiffness of the system and reduces slightly the maximum excursion of the WEC due to the increased size of the buoy and thereby reduction in length of the tether.
Both systems appear to have advantages and inconveniences. Some comparison can be made:
- -
For the reference situation, the maximum mooring stiffness coming from this quasi-static analysis is larger for the SALM system. However, it is not sure that this would also result from a dynamic or experimental analysis, due to the slack initial distance of the CALM system.
- -
The maximum mooring stiffness resulting from this quasi-static analysis is approximately the same for both mooring systems at a water depth of about 40 m.
- -
The footprint of the SALM system is much more compact and light (60 ton), as it only requires the suction anchor on the seabed. The CALM system has a very large footprint as it is composed of three mooring lines of approximately 500 m and three anchors, so it is much heavier (up to 132 ton).
- -
The CALM system presents more redundancy, as it is composed of three mooring lines, which each should be able to take the full mooring load. This of course requires the hawser to be stronger than the chains and possibly doubled to have full redundancy on the system. The SALM system does not present any obvious redundancy, unless the whole system would be doubled. In case no redundancy is provided, the system requires an additional safety factor (multiplication factor of 1.2).
- -
The mooring stiffness increases very differently with the excursion of the WEC for both systems. The catenary mooring has a very low mooring stiffness of up to about 50% of its excursion after which it increase very steeply. The SALM system has a much more progressive mooring stiffness as it increases linearly up to 80% of its excursion, after which it increases steeply. So, it appears that the operational working range of the SALM mooring is greater than for the CALM system and this will have a very strong influence on the dynamic behaviour of the system and the resulting mooring loads.


 ) at the buoy can be found based on an assumed resultant tension and other specifications of the system.


