Article

Crop Management as an Agricultural Adaptation to Climate Change in Early Modern Era: A Comparative Study of Eastern and Western Europe

1
Department of Social Sciences, The Education University of Hong Kong, Hong Kong
2
Department of Geography and International Centre for China Development Study, The University of Hong Kong, Hong Kong
3
Department of Statistics and Actuarial Science, The University of Hong Kong, Hong Kong
*
Author to whom correspondence should be addressed.
Agriculture 2016, 6(3), 29; https://doi.org/10.3390/agriculture6030029
Submission received: 29 March 2016 / Revised: 16 June 2016 / Accepted: 4 July 2016 / Published: 12 July 2016
(This article belongs to the Special Issue Options for Agricultural Adaptation to Climate Change)

Abstract

:
Effective adaptation determines agricultural vulnerability to climate change, especially in the pre-industrial era. Crop management as an agricultural adaptation to climate change in recent human history, however, has rarely been systematically evaluated. Using Europe as our study area, we statistically compared yield ratio of wheat, rye, barley, and oats (an important performance indicator of an agrarian economy) between Eastern and Western Europe in AD 1500–1800. In particular, a statistical comparison was made of crop yield ratio in the two regions during the warm agricultural recovery period AD 1700–1800. The general trend of crop yield in Eastern and Western Europe basically followed the alternation of climatic epochs, in which the extreme cooling period in AD 1560–1660 drastically reduced the crop yield ratio. The yield ratio of rye in Eastern and Western Europe was very similar throughout the entire study period. However, the yield ratio of wheat, barley, and oats showed different patterns in the two regions and increased drastically in Western Europe in the warm agricultural recovery period, which might have contributed to rapid socio-economic development in Western Europe and eventually the East–West Divide in Europe in the following centuries.

1. Introduction

Global climate change has exerted a significant influence on human life, covering almost every aspect of our societies [1]. Agricultural production is regarded as the sector most sensitive to climate change because it is highly dependent on climatic conditions; this was especially true in the early modern era when the technological level was low [2]. The interaction between climate change and agricultural production has long been conceived as an arena where only a minimum level of technology is available to overcome natural impacts. Deteriorating climate could drastically reduce agricultural production within the context of the early modern period. Given that the agricultural sector was the basis of agrarian economies in the pre-industrial era, climate-induced agricultural shrinkage often translated into various socio-economic crises during the time, an observation supported by empirical evidence [3,4].
Crop yield ratio has been highlighted in historical studies and employed in examining agricultural productivity [5]. In agrarian societies, crop yield ratio not only reflects their social production capacity, but also indicates their macro- and micro-economic performance [6]. As the implication of analyzing crop yield ratio has been increasingly realized, a growing number of studies have examined the socio-economic impact of climate change in pre-industrial Europe via the use of crop yield ratio, and those studies are often conducted in a quantitative manner [7,8,9]. In addition, crop yield ratio has also been employed to explore the effectiveness of agricultural adaptation in pre-industrial Europe [10].
Nevertheless, the analysis of crop yield ratio has multiple constraints:
First, although crop yield ratio has been employed to investigate the effectiveness of labor and land input in boosting agricultural production [10], various types of crops (i.e., wheat, rye, barley, and oats) are treated as an aggregate, while their combination has not been considered. Wheat, rye, barley and oats are categorized as “small grain” crops, and between 80 and 95 percent of the early modern population directly depended on them [11,12]. In recent human history, bumper crops contributed positively to the agricultural sector and facilitated economic recovery, while people chose bumper crops according to their biological characteristics [13]. In this regard, historical combination/selection among these four crops deserves extra attention. Even in the present day, altering crop combination is considered to be an important adaption to climate change [14]. Therefore, historical choices of crops should be further investigated.
Second, pre-industrial Europe is often taken as a spatial aggregate when examining the link between climate change and agricultural production [7,8,10,15]. However, agricultural adaption to climate change at the sub-continental level is insufficiently explored, though there are some studies on the social impacts of climate change at the sub-continental level [16,17]. Hence, the regional dynamics of crop management in response to climate change in early modern Europe are not well understood.
Third, previous studies focused on the disastrous impact of extreme cooling on agricultural production in Europe during the Little Ice Age [18,19], while recovery of agricultural production after the cooling was neglected. As part of a complete economic cycle, the recovery stage of an agrarian economy deserves as much attention as its crisis stage.
In this study, we sought to address the above issues. Fine-grained paleo-climate and historical crop yield data together with statistical methods were employed. We focused on the assessment of agricultural production efficiency under major climate fluctuations in early modern Europe via the scrutiny of various crop yield ratios. Through regional comparisons, the differences of crop management efficiency and agricultural recovery capacity were revealed.

2. Materials and Methods

We delineated our study area as Europe as per current administrative boundaries. Europe is one of the original major grain centers in the world and has a long history of crop cultivation, especially for “small grain” crops [20]. In addition, Europe has detailed records on climate history [21]. Data of crop yield ratios are also available, which have been repeatedly employed in previous studies [7,8,9,10].
Scale is both a methodological issue inherent to observation and an objective characteristic of complex interactions within and among social and natural processes [22]. This study was mainly conducted at the sub-continental scale. We followed the Köppen Climate Classification to divide Europe into two macro regions, namely Eastern Europe and Western Europe (Figure 1) [23,24]. The classification is based on the concept that native vegetation is the best expression of climate [25]. Boundaries of climate zone are delineated according to the types of vegetation cover. This study focuses on the climate-agriculture nexus. As the classification considers the connection between climate and vegetation, we followed it to boil down our study area into sub-regions (i.e., Eastern and Western Europe).
A major methodological difficulty, however, persists. Early history is less precise than recent history, and written records are minimal and insufficient. Records in earlier eras are more fragmented than those in modern times. Nowadays, the agrarian economy is not only influenced by agricultural production, but also by industrial goods and international trade [26]. Thus, studying the pure relationship between climate fluctuations and the agrarian economy is difficult. Consequently, the study has been confined to AD 1500–1800. Our study time span overlaps with the Little Ice Age (between the sixteenth and mid-nineteenth centuries), as dated in most publications [27]. In addition, it covers the “General Crisis of the Seventeenth Century in Europe,” which is described as a period of widespread social disorder characterized by economic distress, political unrest, and population decline.
During this period, agricultural shrinkage is one of the most important aspects of the General Crisis. Widespread agricultural shrinkage has been reported, covering a number of countries such as England [19], Poland [28], Germany [29], France, and Russia [30]. In addition, social instability triggered and fueled by economic (agricultural) failure, happened across Europe [31]. Many conflicts and wars occurred in Europe during the crisis period, including the Thirty Years War in Germany, the Wars of the Three Kingdoms, the Protectorate and the Glorious Revolution in Britain and Ireland, internal revolts in the Ottoman Empire, the climax of the Dutch Revolt and so on. Briefly, “General Crisis of the Seventeenth Century in Europe” is characterized by widespread socio-economic and political chaos.
The major time span of the crisis period is generally considered as AD 1560–1660, and it officially ended at the start of the eighteen century (AD 1700) as stated by contemporary historians [32,33,34]. This study thus focuses particularly on the agricultural recovery period in Europe in the warm eighteenth century (AD 1700–1800).
Our goal was to compare historical trends of crop management as the adaptation approach to major climate fluctuations at the centennial and sub-continental scales. Thus, attention was paid neither to individual incidents that could temporarily distort agricultural production nor to exceptional cases. We believed that this rather broad-brush approach, although not without limitations, suits the scope of the present study.

2.1. Data Source

Our datasets were primarily obtained from our previous study on pre-industrial Europe [9]. The data from this previous publication have been validated. In the following sections, the source of data will be illustrated more in detail. In this study, quantitative methods were primary and qualitative methods were supplementary in verifying the effectiveness of crop management. Details of our datasets and methods are stated below.

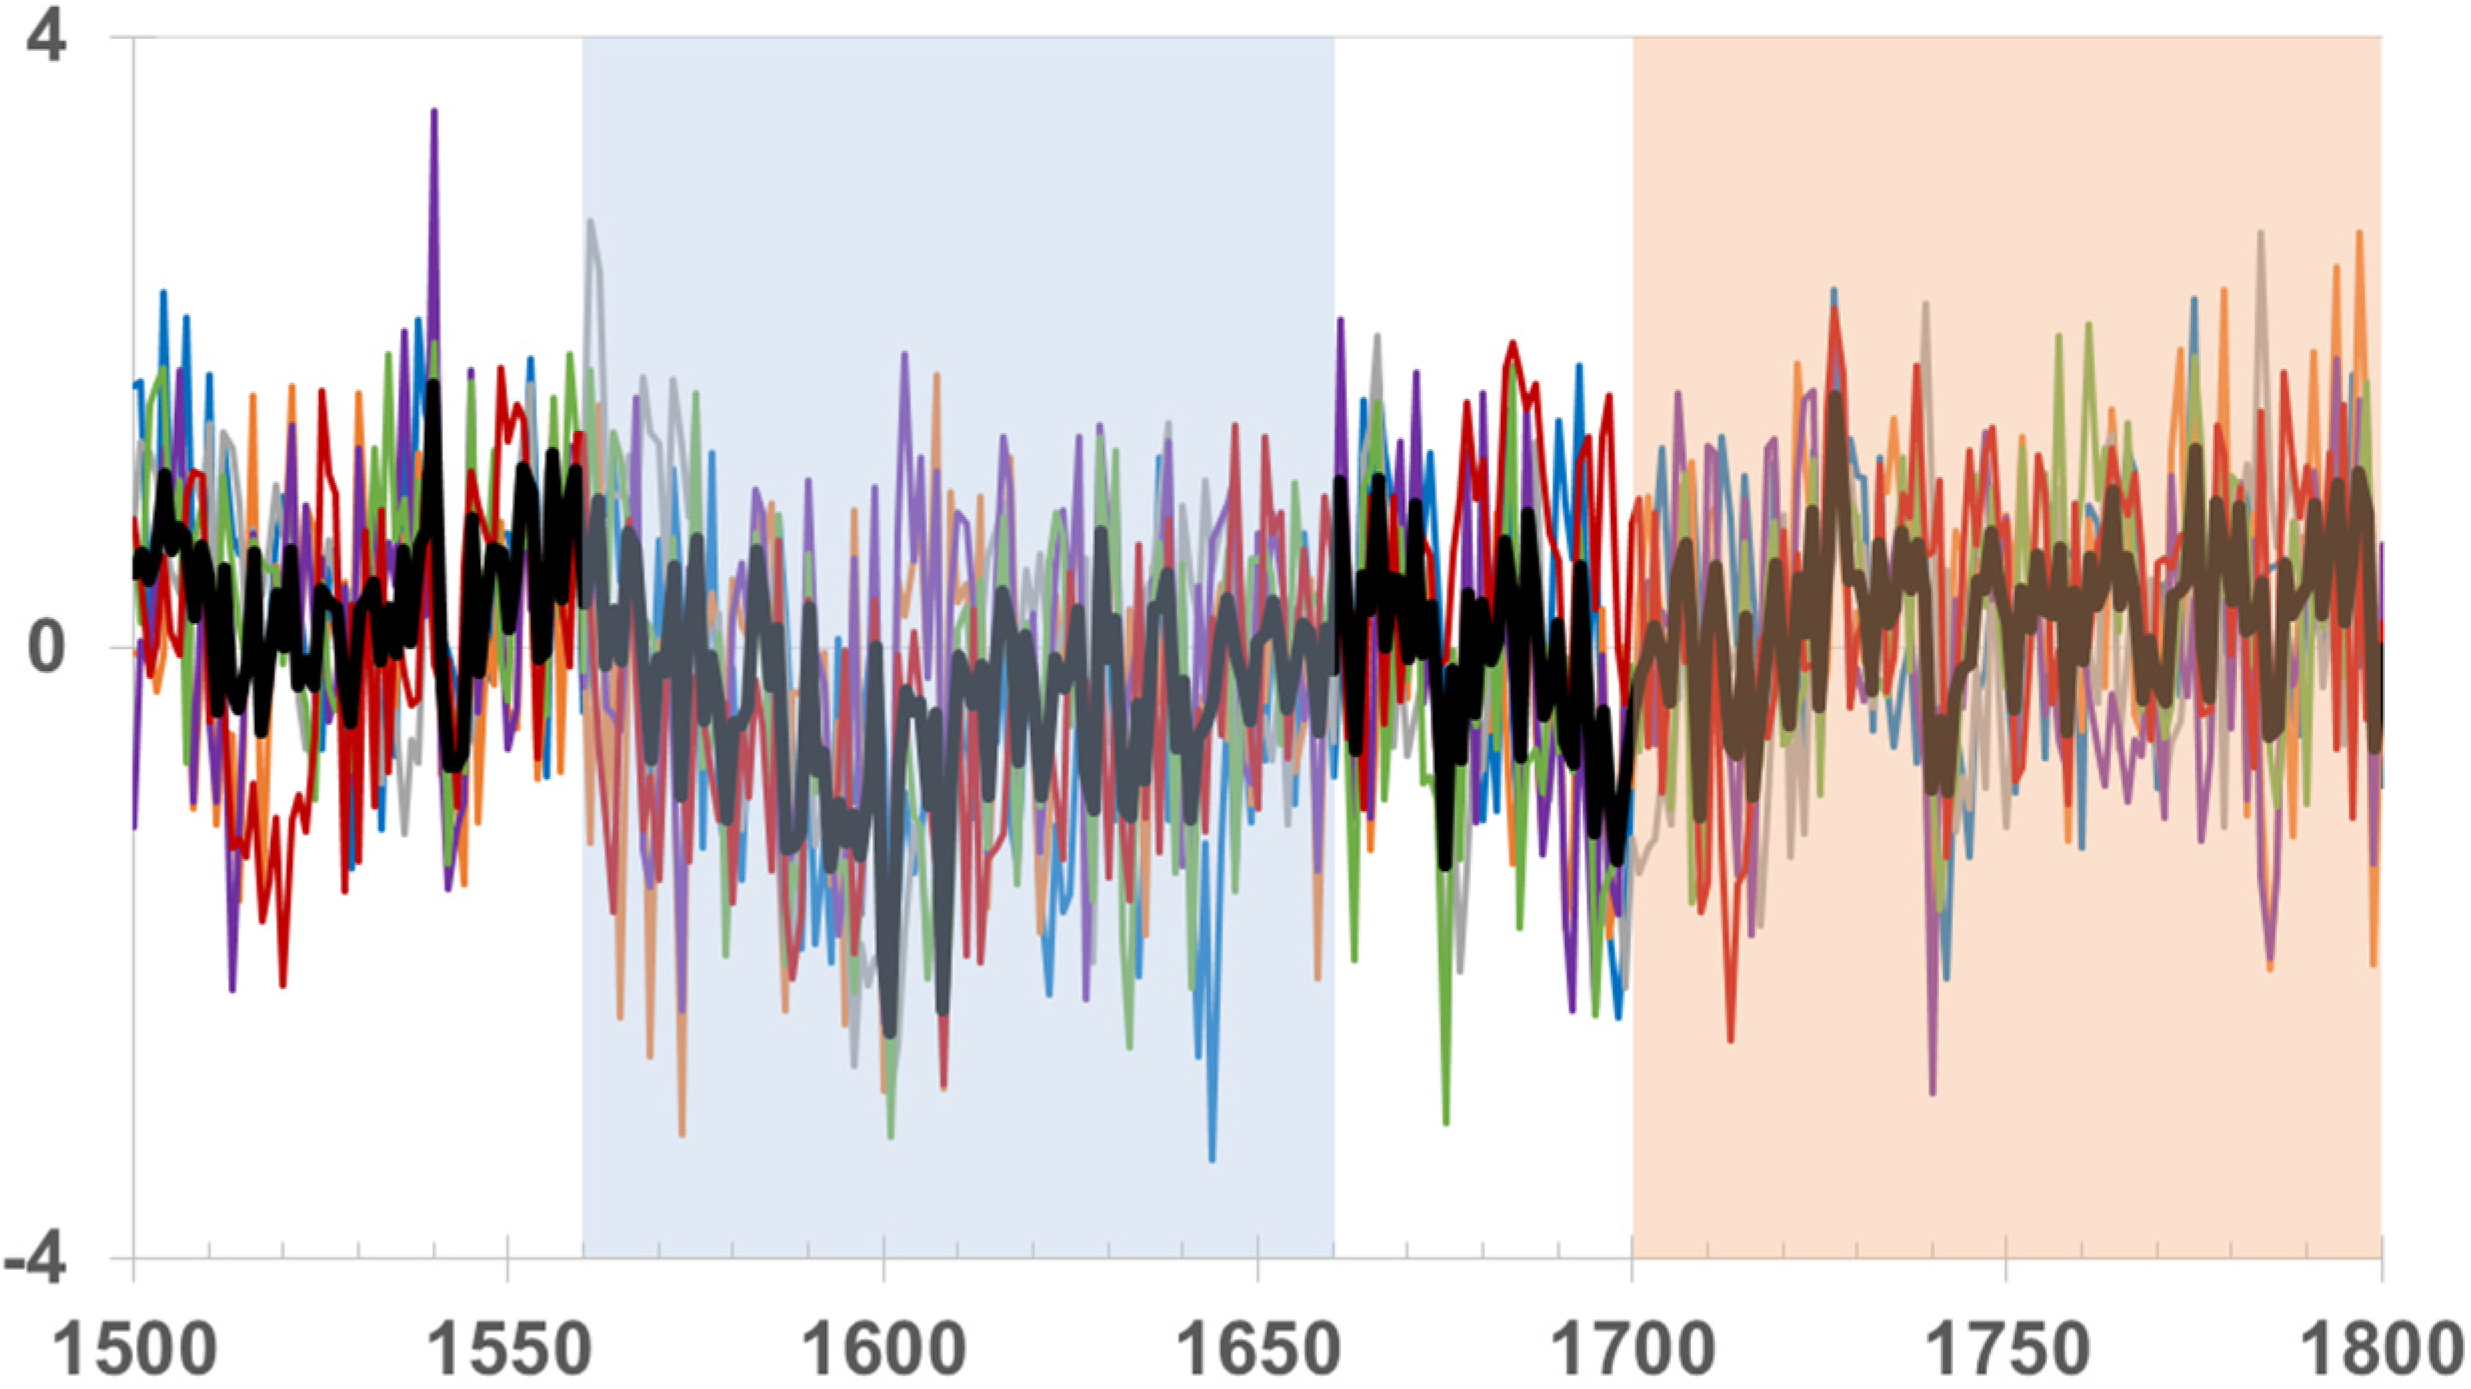
2.1.1. Temperature and the Delineation of Climatic Phases

Temperature has been proven to be more important than precipitation in determining the agrarian economies in pre-industrial Europe at the large spatial scale [7,15]. Moreover, temperature is also the appropriate indicator of climate change at the large spatial scale [35] and the most important factor of plant cultivation [36]. Thus, we adopted temperature to represent climatic conditions in this study within the macro-scale geography.
The temperature anomaly series was derived from six authoritative annual temperature reconstructions of Europe, namely the annual temperature reconstruction for European land areas by Luterbacher et al. [37]; the summer temperatures since Roman times by Luterbacher et al. [38]; the annual temperature dataset by Osborn and Briffa [27], who combined the regional temperature series nested within Europe; the temperature reconstruction based on tree ring chronologies in central Europe by Büntgen et al. [39]; the temperature reconstruction based on documentary records in central Europe by Dobrovolný et al. [40]; and spring–summer temperature reconstructions in Europe by Guiot et al. [41]. Because different proxies and methods were employed in the above reconstructions, we first normalized them to homogenize their original variability. These normalized temperature series were then arithmetically averaged to generate the European temperature composite we adopted in this study (Figure 2). Based on this temperature composite, two major epochs were delineated. First, the period AD 1560–1660 was delineated as “extreme cooling period” during the Little Ice Age, which is also coincident with the major time span of the General Crisis of the Seventeenth Century in European history. Second, the warm AD 1700–1800 period was delineated as “agricultural recovery period”.

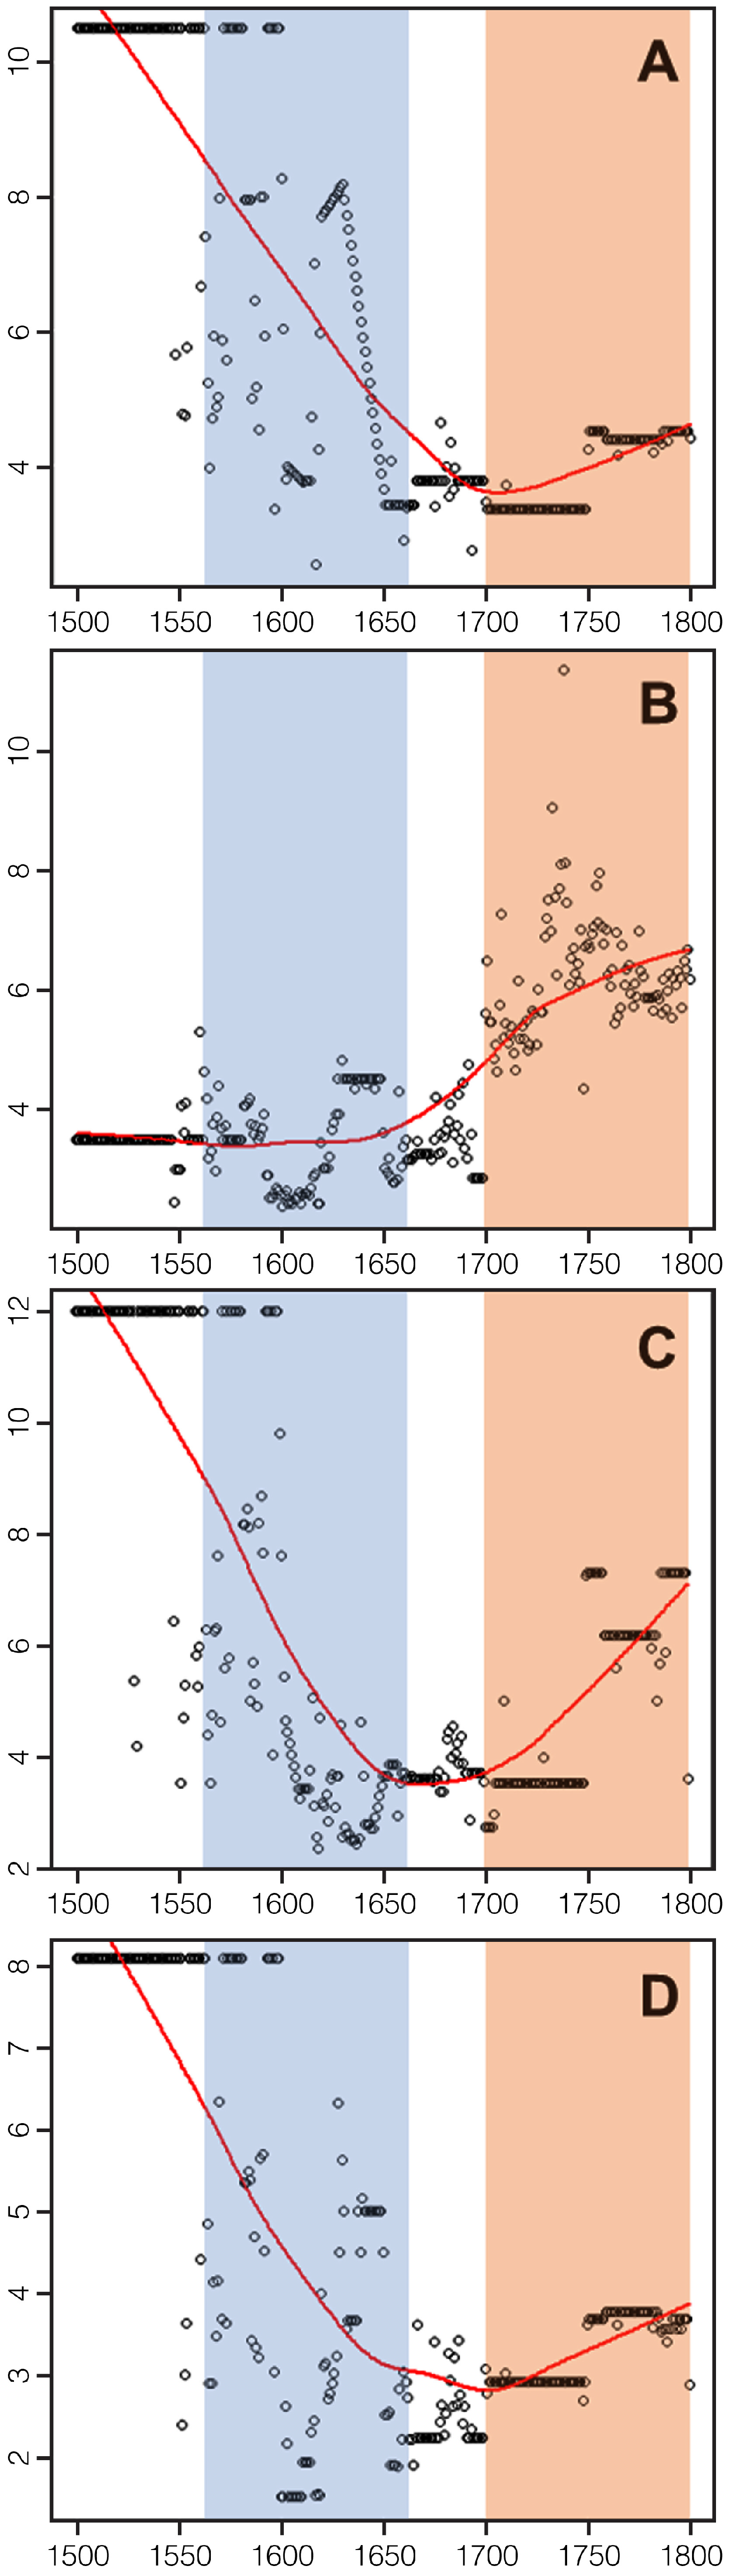
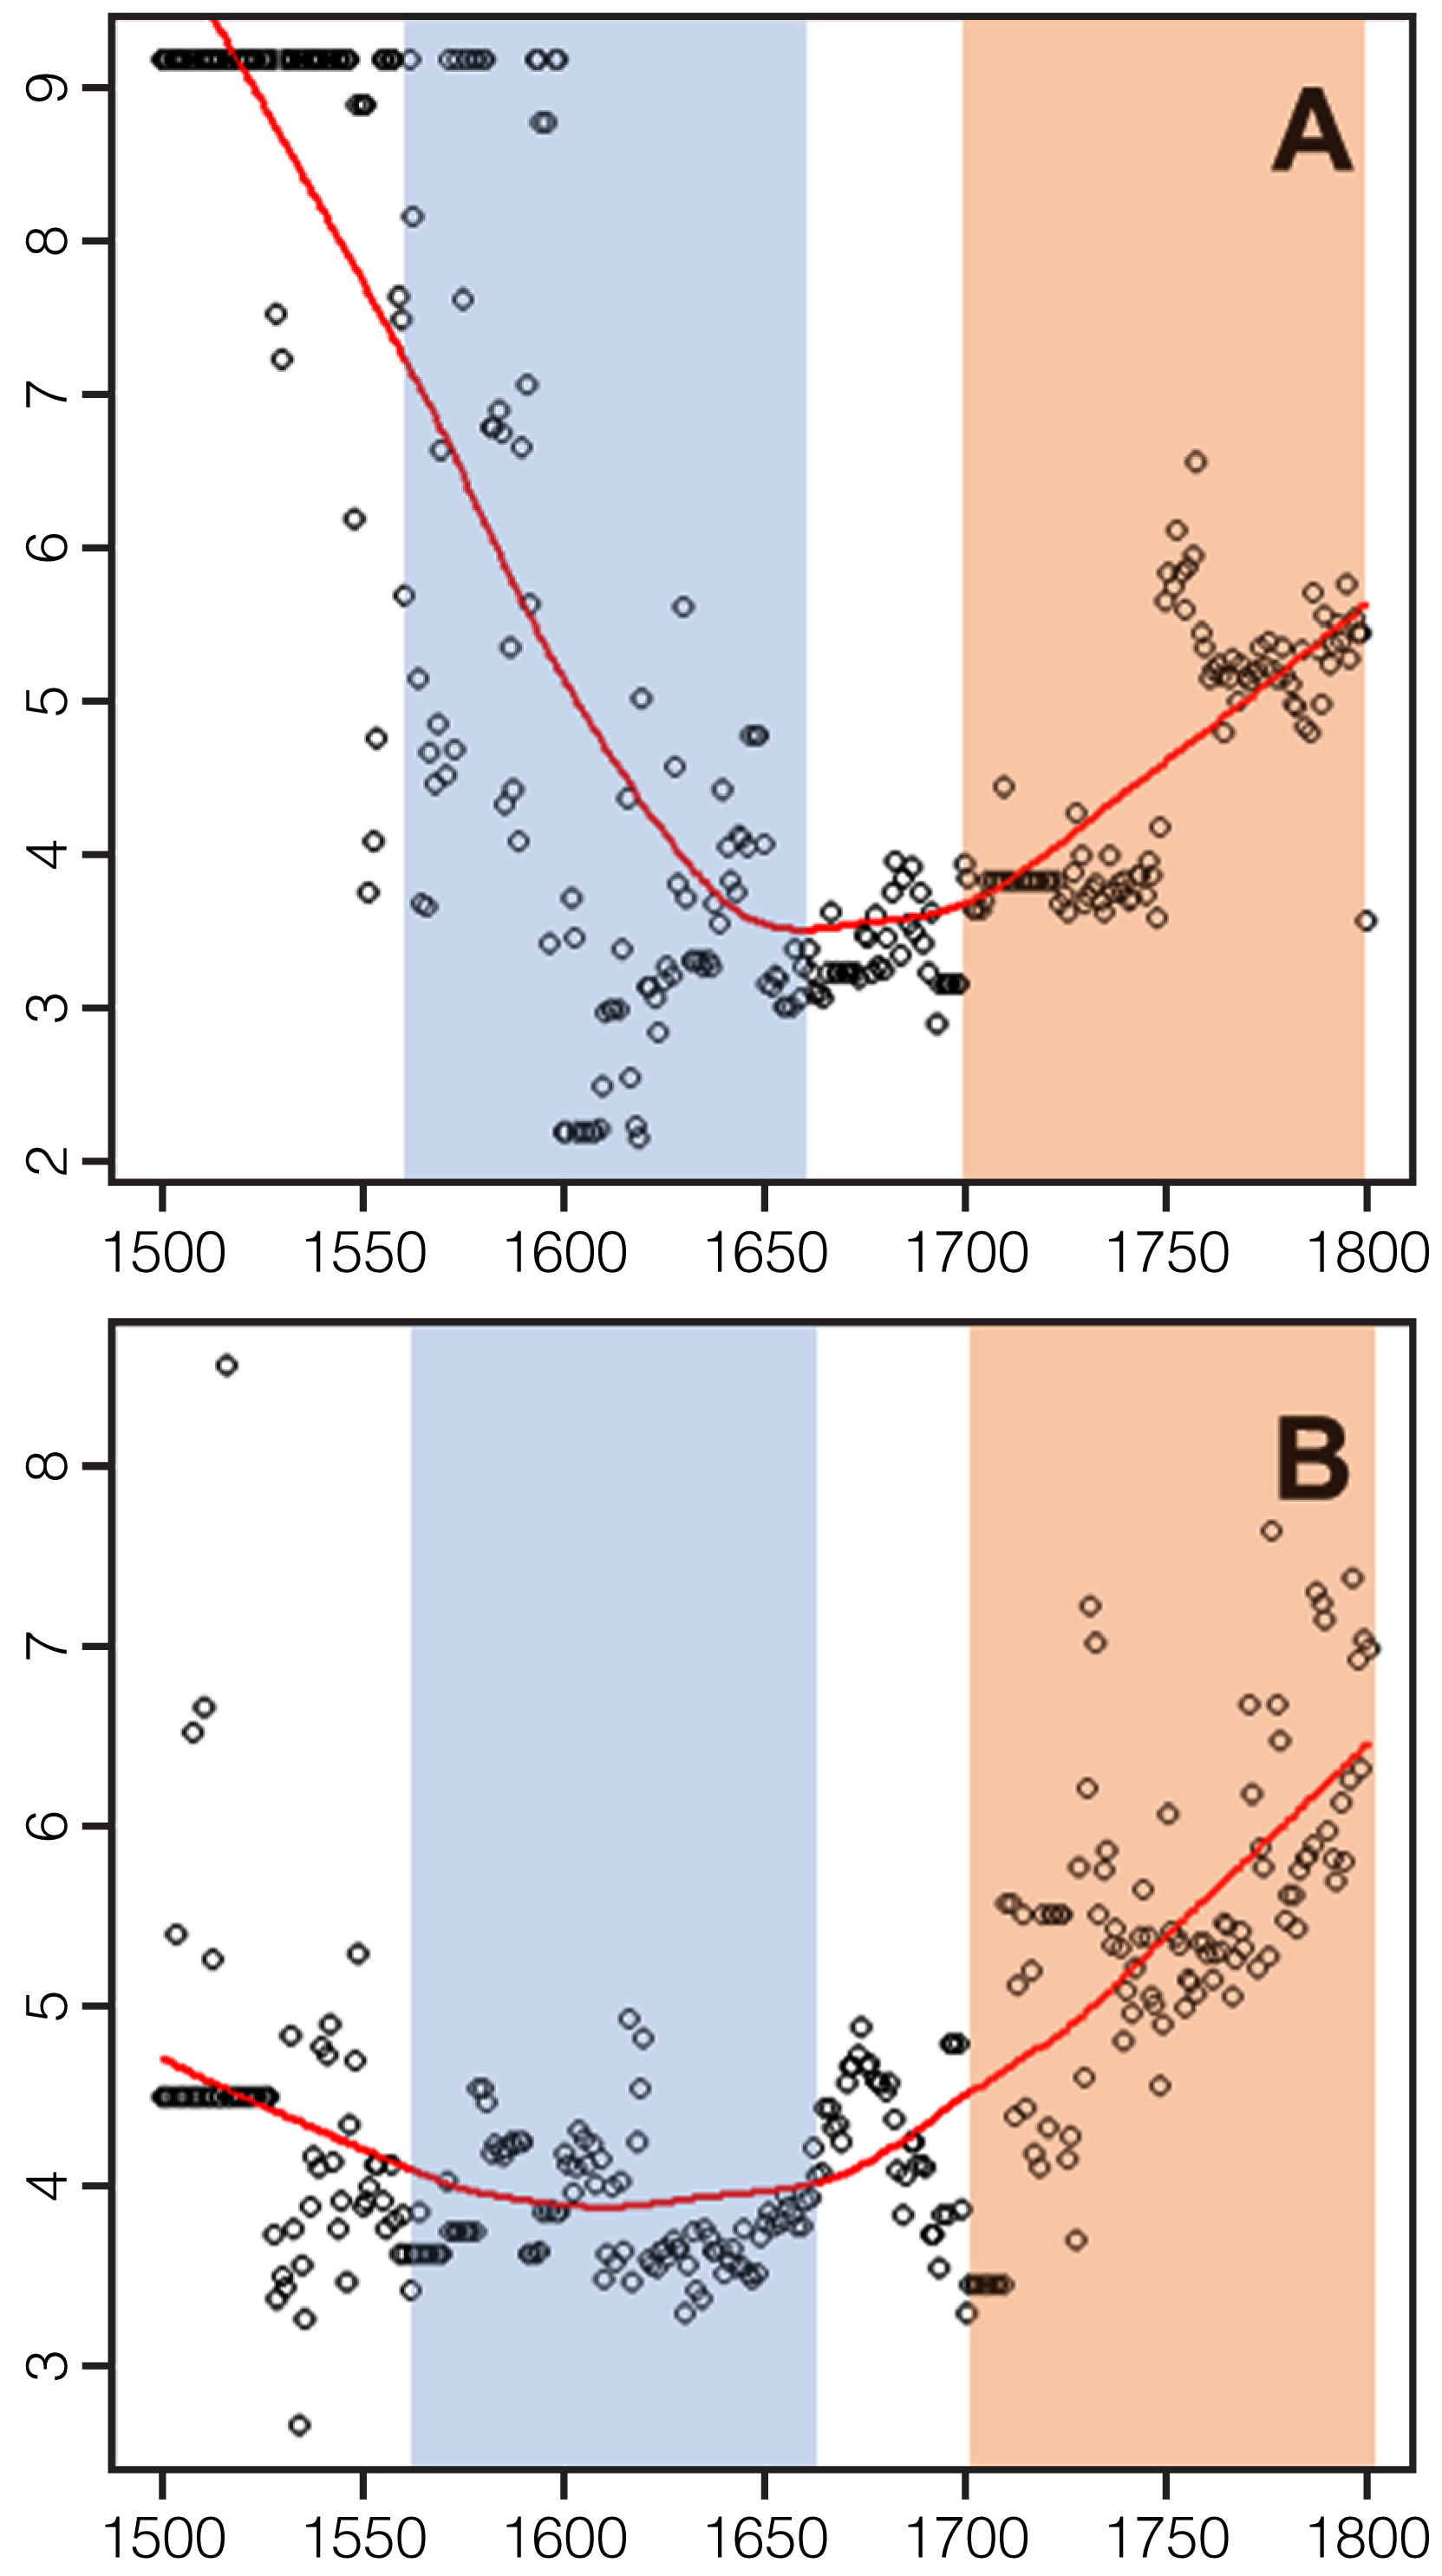
2.1.2. Crop Yield Ratio

Our analyses were primarily based on crop yield ratio of wheat, rye, barley, and oats to assess agricultural productivity and scrutinize the effectiveness of crop management in our study area [5]. There are few good substitutes for wheat, rye, barley, and oats, particularly in the pre-industrial period [42,43,44]. The crop yield ratio data used in this study were derived from the dataset of van Bath [45]. Crop yield ratio is defined as grain yield ratio in relation to seed. Yield ratio was calculated as follows:
Y i e l d   r a t i o = H a r v e s t   a m o u n t S e e d   a m o u n t
Crop yield ratio is taken as one of the most important indicators reflecting the general picture of agricultural productivity. Yield ratio could be considered as an indicator of past agricultural production efficiency and has been adopted for a number of reasons, mainly on account of the widely varying usage by medieval stewards of local customary measures, which often precludes any accurate means of yield measurement in terms of grain output per unit area [5]. Thus, an impression of the vulnerability of the surpluses upon which the elaborate civilization of Europe rested can be derived by examining the harvest yield ratios [46].
Van Bath’s dataset contains the crop yield ratio in 18 European countries [45]. The crop yield ratios of those countries were arithmetically averaged to obtain the one for the whole of Europe, as well as for Eastern Europe and Western Europe, respectively. Aggregating the data from different countries will help eliminate or neutralize a specialty in some local regions and provide a more accurate impression over a large area. Data aggregation should often be treated with caution, especially if data are from different sources and in different units, as in the case of Olmstead and Rhode [47]. However, in our study, the yield ratio data are from a single source (van Bath [45]), and the data across those European countries are in uniform units. Given the above circumstances, it is believed that the risk of our data aggregation is within acceptable range.

2.2. Formatting of Mathematical Components

Although the data employed in the study are published in international refereed journals, with their reliability verified, the data quality issue still cannot be totally ignored.
In this study, to further minimize the possible risk brought by data imperfection, we thus adopt a long term and macro perspective to investigate the link between major climate fluctuations and agricultural adaption. We also recognize that some records in some specific years may be not accurate enough. However, if we seek to obtain a big picture by including a large number of cases or records, the associated findings are reliable to draw an accurate historical account [48], similar to a questionnaire study [49]. In the study, two different kinds of statistical methods have been applied, which are explained in detail below.

2.2.1. Non-Parametric Analysis

The records of crop yield ratio in van Bath’s [45] dataset, which is the original source of yield ratio in Zhang et al.’s research [9], were derived from different sources all over Europe. Against this background, we applied non-parametric analysis to extract the general trends of crop yield ratio. The non-parametric method makes fewer assumptions on the nature of data quality and distribution. The results of the non-parametric method would be particularly useful to the assessment of performance from a general perspective [50]. This method is operationalized by the statistical software R. The model of non-parametric analysis is described as:
y i = f ( x i ) + ε i
f ( x 0 ) = 1 n h i = 1 n { W ( x 0 x i h ) × x i }
where h is the bandwidth of the local regression. W is the weighted function to each value xi around x0. The fitted value at x0, that is, the estimated height of the regression curve, is y 0 ˆ = a . Therefore, in a very small neighborhood, the yi can be written as the following simple function:
y i = a + e i
The above function is correct only in a small neighborhood. In the model, we use average weight to calculate the trend. If the xi within the small neighborhood of x0, weight value is 0.5; otherwise, it is 0. Because the weight in total should be 1, that is, W i = 1 ; therefore, the weight value is 0.5:
W ( z ) = 0.5 f o r | z | < 1 W ( z ) = 0 f o r | z | 1
In the above context, zi = (xix0)/h. It is typical to adjust h so that each local regression includes a fixed proportion s of the data. s is called the span of the local-regression smoother. The larger the span, the smoother the result is. We built on the general trends of crop yield ratio, which were obtained from the above method, to compare the agricultural production efficiency between Eastern and Western Europe.

2.2.2. Analysis of Variance (ANOVA)

One-way analysis of variance (ANOVA) was employed to statistically compare the recovery capacity of the agrarian economy (in terms of crop yield ratio) between Eastern and Western Europe in the warm AD 1700–1800 period (i.e., the agricultural recovery period).

3. Results

Figure 3 shows the general trends of crop yield ratio in Eastern and Western Europe that were obtained from the non-parametric analysis. The overall condition of crop yield ratio was calculated by averaging the yield ratio of the four types of crops (i.e., wheat, rye, barley, and oats). The averaged crop yield ratio in both Eastern and Western Europe (Figure 3) exhibited similar fluctuations with regard to the change of temperature (Figure 2). Beginning in AD 1500, the crop yield ratio dropped in both of the two regions. The drop was drastic in AD 1560–1660, the extreme cooling period occurring during the Little Ice Age. Only after AD 1700 did the crop yield ratio begin to rise above the bottom. Despite the above similarities, the differences between Eastern (Figure 3A) and Western (Figure 3B) Europe are also apparent. During the extreme cooling period, the decrease of crop yield ratio in Eastern Europe was more drastic than that in Western Europe. Since AD 1650, the grain yield in Western Europe has been higher than that in Eastern Europe. In addition, the crop yield ratio in the eighteenth century was higher than that in the sixteenth century in Western Europe but that was not the case in Eastern Europe. Furthermore, only Western Europe showed an elevated level of crop yield ratio throughout the study period.
Following the analysis of the general pattern of averaged crop yield ratios in the two macro regions, the four types of crops were separated for further analysis. In Eastern Europe, the patterns of four types of crops in Figure 4 are similar to the general pattern of crop yield change as shown in Figure 3A, except for rye. Furthermore, as shown in Figure 5, the fluctuation of rye yield ratio exhibits a different pattern in Western Europe, while the other three types of crops are more or less similar to the general trend of crop yield ratio as shown in Figure 3B.
Fixing on the regional variation of crop yield ratio changes, it was observed that the yield ratio of rye in both Eastern and Western Europe was very similar during the entire study period. Furthermore, the rye yield ratio bounced back first after the extreme cooling of the Little Ice Age, in both Eastern and Western Europe. Nevertheless, the regional divergences of crop yield became more pronounced afterwards. For instance, in Eastern Europe, only rye showed signs of recovery after the extreme cooling, while the yield of the other three types of crops in the eighteenth century was lower than that in the sixteenth century. In Western Europe, however, the yield of all of the crops in the eighteenth century exceeded their previous levels in the sixteenth century except rye. Furthermore, in Western Europe, the yield ratio of wheat, barley, and oats increased remarkably and reached a new height in the eighteen century.
In the comparison of crop yield ratio between Eastern and Western Europe in the agricultural recovery period AD 1700–1800, rye differentiated from the other three types of crops, as its yield ratio between Eastern and Western Europe was not statistically significant. However, the crop yield ratios of wheat, barley, and oats in Western Europe were all higher than those in Eastern Europe. As the crop yield ratio is a chief indicator of agricultural productivity, the higher crop yield ratios of wheat, barley, and oats in Western Europe imply that, in general, agricultural productivity in Western Europe was higher than that in Eastern Europe in the eighteenth century. Given that the period is after the extreme cooling in the Little Ice Age, the higher crop yield ratio in Western Europe in the eighteenth century also implies a more effective agricultural recovery mechanism there.

4. Discussion

The general trend of crop yield ratio in Eastern and Western Europe basically followed the alternation of climatic epochs, and the extreme cooling period of AD 1560–1660 resulted in the drastic reduction of crop yield ratio. Additionally, the yield ratio of rye in both Eastern and Western Europe was very similar throughout the entire study period. On the other hand, the yield ratio of wheat, barley, and oats was higher in Western Europe, especially in the agricultural recovery period in AD 1700–1800. In addition, the yield of wheat, barley, and oats increased drastically in Western Europe during the time.
Within the context of the agricultural sector, simple adaptation to climate change usually refers to substituting current vulnerable cultivars with climate-resistant ones [51], including any changes in crops, cultivars, sowing dates, sowing rates, tillage practices, use of inputs and so on. In the past and in modern days, some cases occur wherein current varieties (species) become unfeasible choices under climate change [52,53]. Farmers find it relatively easy to cope with change through the planting of new crop species [54]. This also applies to past agricultural production, which was characterized by a lower technological level.
Notably, new crops such as maize and potatoes were introduced to meet subsistence needs. Both of these could be good substitutes for grains to significantly augment the food-producing capacity of the land [55]. However, in the early modern era, farmers had very few alternatives. The introduction of new food was a prolonged process, though maize was introduced into Europe beginning in the mid-1500s [56]. The acceptance of potatoes and maize as food crops in Europe was closely related to rapid population growth after AD 1750 [57]. Potato was an uncommon crop before the second half of the eighteenth century, and most farmers were prejudiced against maize as food [58], leading them to plod along the same paths that their ancestors had trodden [59,60]. Wheat, rye, barley, and oats were the only acceptable options for farmers adapting to climate change during the study period. Therefore, in early modern Europe, selection of bumper or cold-resistant crops, which is a feasible means of adaptation, was largely limited to wheat, rye, barley, and oats. In this regard, a brief background of these four crops is discussed below for additional information.

4.1. Relative Importance of Wheat, Rye, Barley, and Oats in Pre-Industrial Europe

Rye was the dominant crop in Europe in our study period. However, it was not initially intentionally sown. Before its cold-resistant characteristics were widely recognized, rye was sown as a separate crop [61]. After the Renaissance, rye was more prominent than wheat and became the predominant bread grain. It was gradually replaced by wheat in the nineteenth century [62]. During the Middle Ages in Europe, rye was more important than wheat [63,64]. As agriculture extended to marginal areas to cope with the negative climatic impacts on grain harvest during the Little Ice Age [10], rye was generally the most popular food crop in Europe in our study period [65].
The prevalence of wheat in the human diet is relatively recent. The use of wheat as a bread grain grew rapidly between the late nineteenth century and the first half of the twentieth century [66]. In the past, most people in Europe relied more on coarse crops [62]. Furthermore, wheat was only cultivated to pay for dues and rent, or for export as an economic commodity [67]. Global expansion of wheat production mainly occurred in the twentieth century, followed by an increase in wheat planting area and yield [68].
Barley was grown more extensively than wheat, and apparently was more highly regarded as human food [69]. Although barley was the most important crop in the Roman era, it was replaced by rye during the Middle Ages [64]. In addition, barley is often valued for its forage quality of hay and for its relative earliness, providing harvestable grain when other crops are still growing.
Oats were always marginal in status. Oats were regarded as an uneconomical and poor-land crop, useful for planting in poorer soils [70]. They were only grown when population pressure forced encroachment into marginal areas. Oats were usually employed as a nurse crop for other agricultural use [71], and only in climates with lower temperatures were they considered as food [72].
Briefly, rye was the major food crop on the European continent in our study period. This may explain why the yield ratio of rye in Eastern and Western Europe was very similar in the entire study period (Table 1 and Figure 4 and Figure 5). On the other hand, wheat, barley, and oats were marginal crops, particularly in Eastern Europe, where their yield ratios in the eighteenth century were lower than those in the sixteenth century. The marginal status of wheat, barley, and oats implies that their cultivation was more determined by regional context, which may account for the variation of their yield ratios in Eastern and Western Europe.

4.2. Crop Selection as a Means of Adaptation to Climate Change

Given that rye was the major crop and that wheat was not popular in Europe in our study time span, only barley and oats could serve as additional choices during the time. Those crops were usually cultivated in newly opened farmland. Barley could be cultivated at temperate regions in spring and summer [73], but it is not particularly cold-tolerant [74]. Oats could adapt to a wide range of soil conditions, but it is also not cold-tolerant [62,75]. When the cooling prevailed, barley and oats could not serve as bumper crops.
Since rye is the most cold-resistant crop among the four types of crops, in a cold climate, rye should be widely cultivated to maintain the food supply. In a previous study, it was found that increasing land input was the most effective method to bump up harvest and relieve climatic impacts among past societies [10]. Barley and oats could serve as nurse crops (particularly oats) because of their biological characteristics [71]; they were planted in marginal areas to increase arable land area and, eventually, the food supply in pre-industrial Europe.
Indeed, there were limits for increasing land input to increase harvest. Although Europe was an agrarian hub, there had been little opportunity for simple expansion of cultivable land. Only Eastern Europe had unused lands that could be agriculturally productive [76]. In Eastern Europe, arable land existed in relatively unlimited supply, and there was nothing to prevent people from inhabiting these new lands [77]. However, this was not the case in Western Europe. For instance, shrinkage of wheat production in Spain in the seventeenth century was primarily caused by the exhaustion of cultivable land [78].
Overall, crop management was obviously employed as a means of adaptation to major climate fluctuations in early modern Europe. Rye was chosen as major crop in our study period, probably to relieve the impact of low temperature during the Little Ice Age. However, the efficiency and effectiveness of crop management were often determined by many other factors. Agriculture was sensitive to price changes and other market factors in early modern Europe [79]. Crop (particularly bumper crop) cultivation was determined by market factors [80]. For instance, oats were regarded as “uneconomical,” except for planting in poorer soils, due to their lower yield compared to wheat, rye, and barley [70]. The prevalence of wheat resulted primarily from the improvement of bread-making techniques [63]. Furthermore, government played an essential role in crop management [81]. In addition, making the best choice at precisely the right time was always a challenge. Most importantly, the selection of cold-resistant crops might have played a positive role in maintaining harvest in some small regions or short time spans, but it may not have been effective at long temporal and large spatial scales [7,9]. This phenomenon can be revealed by the drastic reduction of the yield ratio of rye in both Eastern and Western Europe during the extreme cooling period in the Little Ice Age (Figure 3, Figure 4 and Figure 5).
Notably, in the study, we have emphasized that the analysis is implemented at a large spatial and long term scale. Each scale brings new problems and information coinciding with a new nature or social interface [82,83,84]. Besides being a research question at the research level, scale is also an issue of recognizing how our living planet has been regarded in history [85]. At a large scale, the complex interactions between nature and human society are more obvious [86].
In terms of adaption, the institutional or technological capacity of past societies should not be neglected. However, in the pre-industrial period, the general low level of technology is the common image of the early modern world [87,88]. Even though humans could relieve the climatic effect in the short run by adaptation, institutional and social buffering mechanisms ultimately would be exhausted by the recurrent subsistence crises caused by long-term cooling [89]. Moreover, differences in institutional or technological capacity at the national scale would therein be neutralized, if this study takes Europe as the research region [90]. To clarify, at the scale in the study, we could identify the significant influences of climate change on agricultural activities. If the scale is narrowed down or shortened, other socio-economic factors should be considered, and their influences will possibly exceed those of climate change [91]. Furthermore, in individual countries, some advancement in technology could also be identified, such as in England [92,93] and the Netherlands [94]. In addition, some agricultural techniques like the development of heavy plows might have contributed to agricultural development [95], through more intensive and extensive cultivation, which was facilitated by the improvement of farm tools, also resulting in severe environmental degradation in return [96].

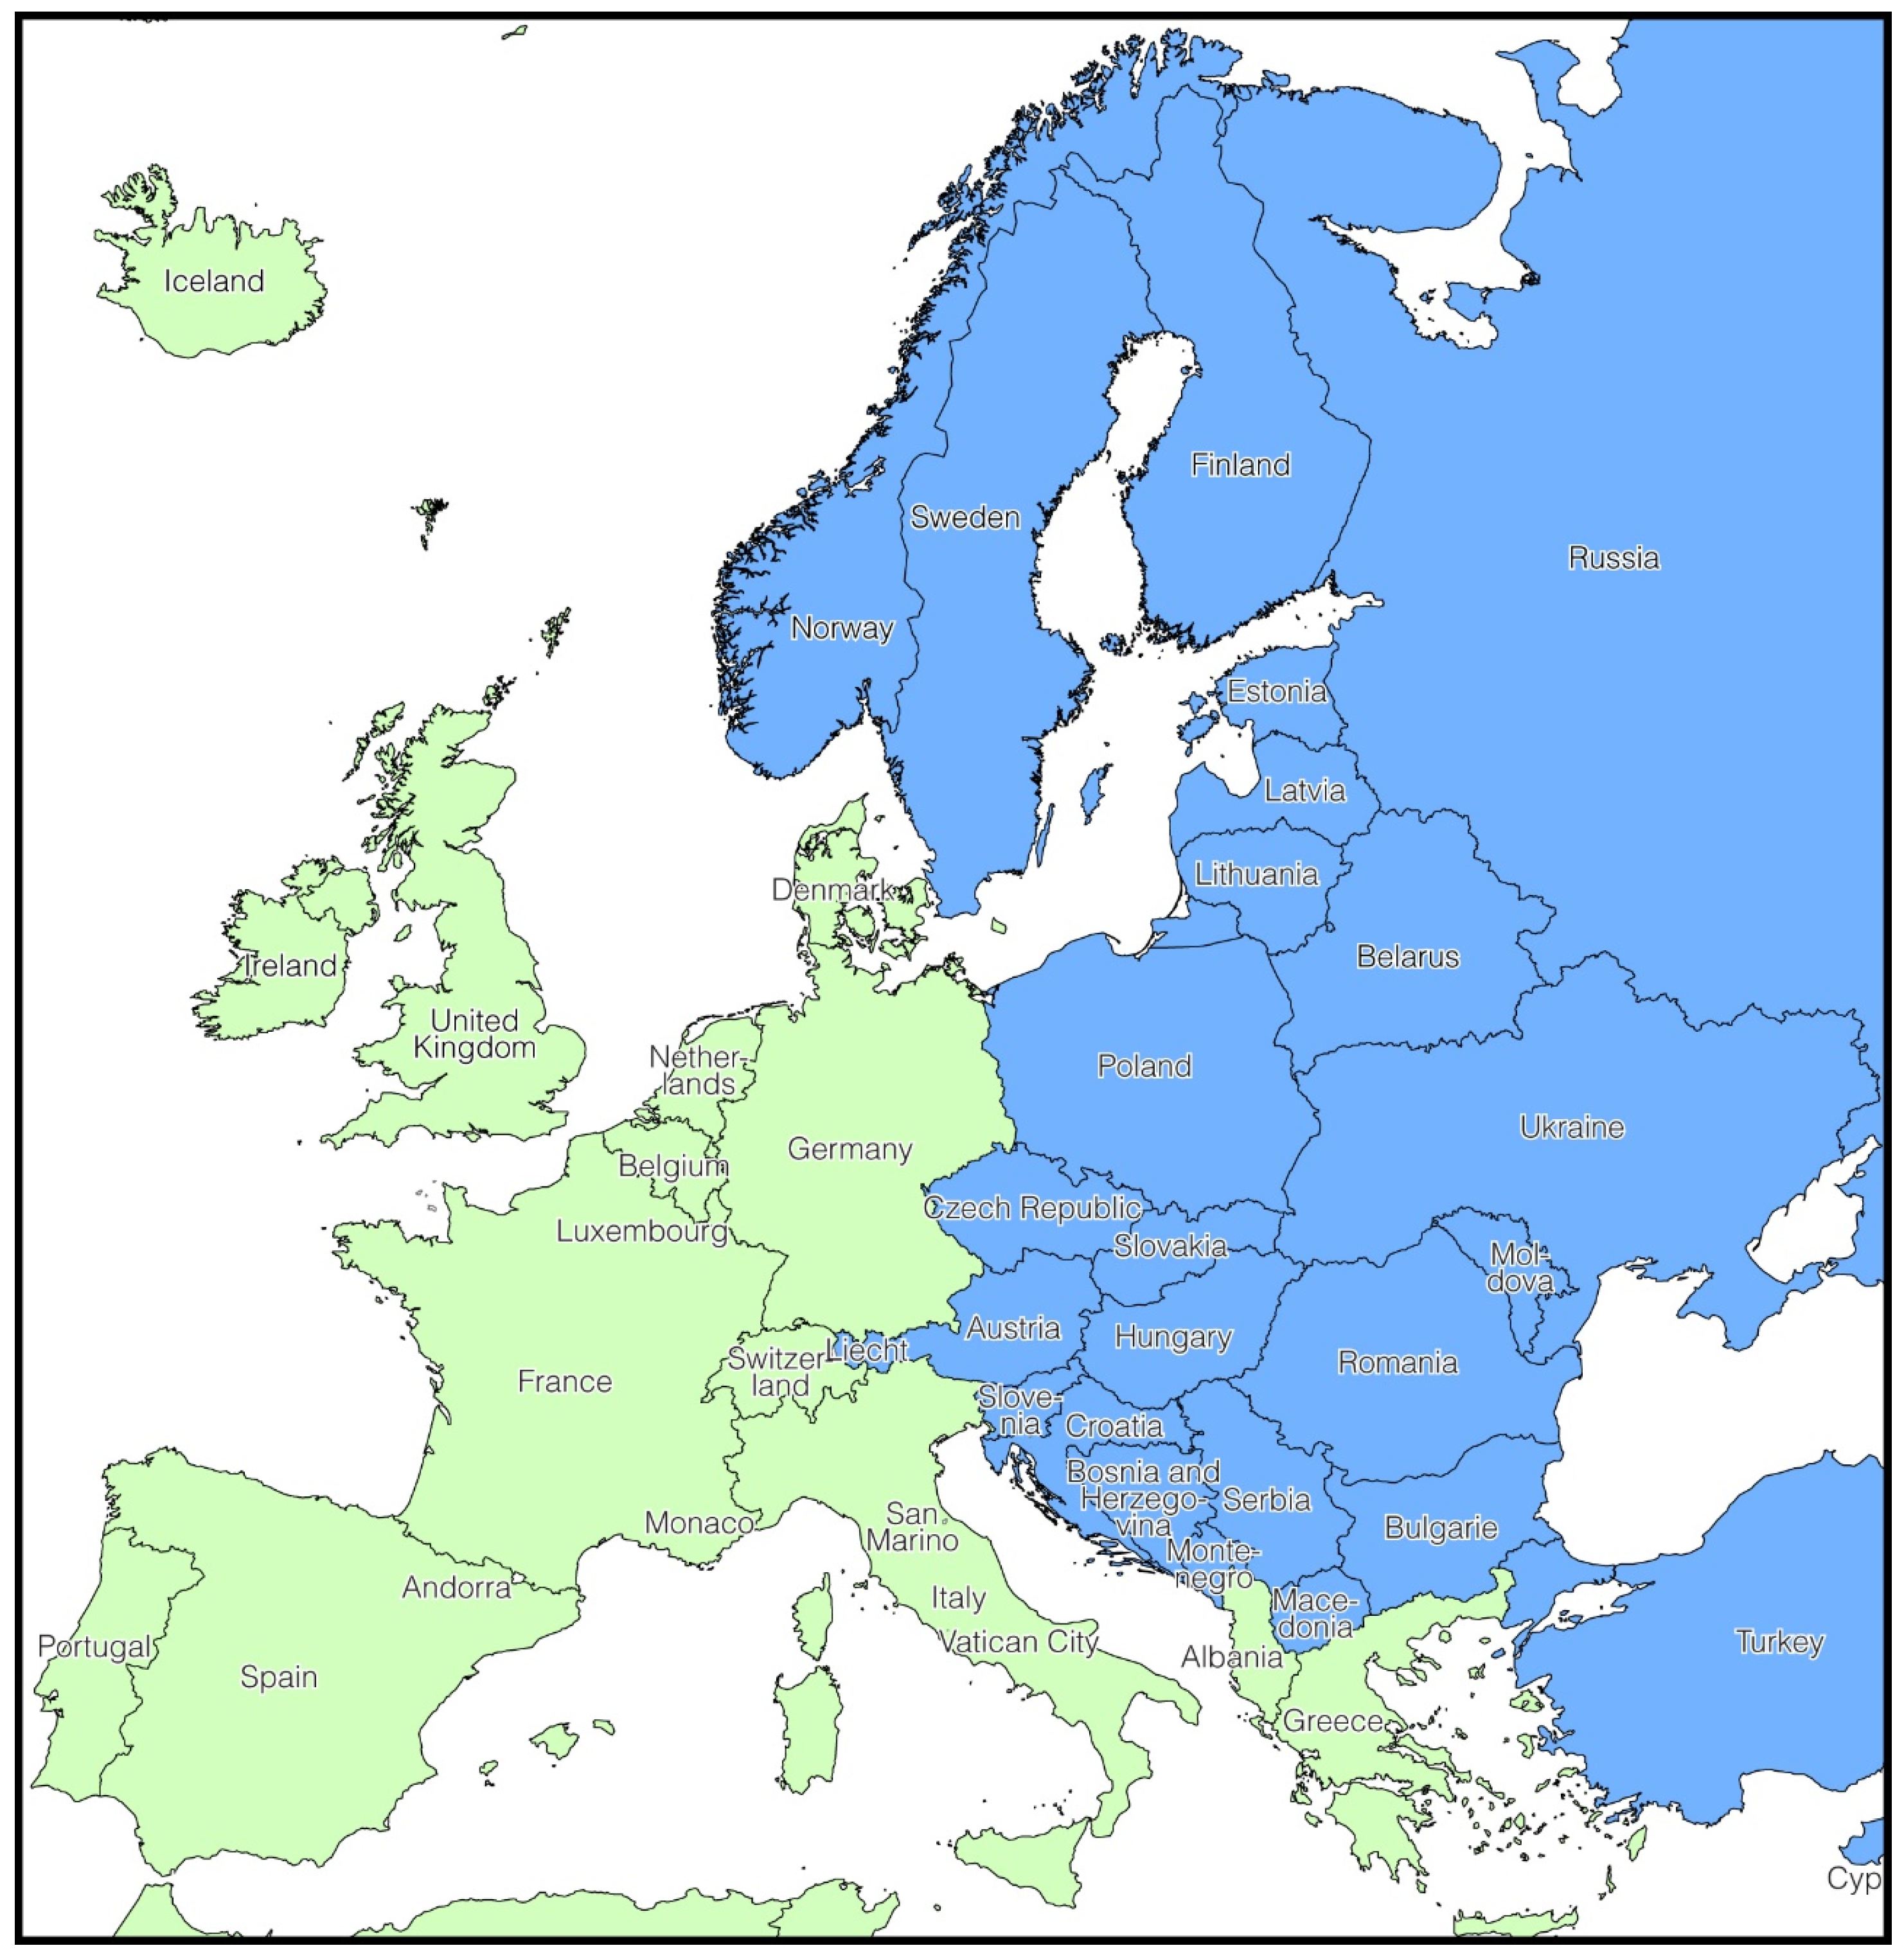
4.3. Agricultural Divide between Eastern and Western Europe

As mentioned in the introduction, most of the studies of early modern Europe focus on the climatic impacts on agricultural production in the Little Ice Age. However, the period of agricultural recovery (the eighteenth century) has not been examined in detail. This study demonstrates that crop yield ratio, which is a good indicator of agricultural productivity, is closely related to temperature. Thus, the change of crop yield ratio after the extreme cooling in the Little Ice Age could indicate the recovery capacity of the agrarian economy.
Table 1 shows that rye is the only crop whose yield ratio did not demonstrate significant differences between Eastern and Western Europe. On the other hand, wheat, barley, and oats in Western Europe showed higher yields than those in Eastern Europe. In agrarian societies, yield was the essential performance indicator of the economy. As revealed by the crop yield ratio, economic disparity of Eastern and Western Europe increased in the warm eighteenth century. The bumper crops positively affected the agrarian sector, as well as other sectors, which initiated economic recovery [13]. The yield of wheat, barley and oats increased drastically in Western Europe, but not in Eastern Europe, in the eighteenth century, which may suggest that the speed of recovery in Western Europe was faster than that in Eastern Europe.
In recent studies, although the East–West Divide in Europe since the last century has attracted great research attention [97], it has been emphasized that such divide originated from a long historical tradition, as well as from differences in culture and civilization [98]. The East–West Divide is reflected in almost every aspect of life, and the course of agrarian history in Eastern Europe is in notable contrast with that in Western Europe [99]. Economic conditions have been highlighted to explain the East–West Divide, as well as religion, philosophy, culture and other factors [100]. However, there are very few studies to explain the divide from the perspective of agricultural productivity. The above mentioned crop yield ratio upsurge in Western Europe in AD 1700–1800 significantly contributed to the regional economy.
In the agricultural sector, increasing land input was more feasible in Eastern Europe, while increasing labor input was more feasible in Western Europe [46,101]. Labor input could have been the momentum needed to increase crop yield ratio and agricultural production in the early modern period, in spite of its limited effect [10]. As highlighted in previous studies, production output is usually estimated by analyzing the labor input [102], especially in past agrarian societies with a low technological level. In the pre-industrial era, agricultural production was labor-intensive; as such, the availability of farm labor was significant [103]. Labor input also has special advantages because it is more elastic in supply compared to land [104]. Thus, labor is generally regarded as the abundant and principal input in production [105]. In this regard, in Western Europe, better crop yield ratio in the warm eighteenth century should have triggered the transfer of labor from agriculture to other sectors, as it did in England [88]. Human resources are fundamental to national development; for example, the advancement in technology in England was due to the increasing supply of unskilled workers in cities [106]. With the help of large labor inputs, industrial sectors started to gain the momentum for development, which might have contributed to the rapid social and economic development in Western Europe in the following centuries.

5. Conclusions

In this study, we based our analysis on crop yield ratio, which is the essential indicator of the economy in agrarian societies, to assess agricultural production efficiency under major climate fluctuations in early modern Europe. Via regional comparison, the yield ratio of rye in Eastern and Western Europe was found to be very similar. On the other hand, the yield ratio of wheat, barley, and oats was higher in Western Europe. As revealed by the changes of crop yield ratio in different climatic epochs, the disparity of the agrarian economies in Eastern and Western Europe was enlarged in the warm eighteenth century. Bumper crops positively contributed to agriculture, as well as other sectors, which initiated economic recovery [13]. The yield of wheat, barley and oats increased drastically in Western Europe in the warm eighteenth century, which may imply that the speed of economic recovery in Western Europe was more rapid than that in Eastern Europe during the time. In Western Europe, larger crop output facilitated the transfer of labor from agriculture to other sectors. Surplus human resources that are fundamental to national development would possibly have supported other sectors to drive social development. This might have contributed to rapid socio-economic development in Western Europe, and eventually to the East–West Divide in the following centuries. We do not deny the importance of other factors in establishing the divide in Europe. However, we offer a new perspective to explain the divide, which is grounded in the quantitative analysis of agricultural productivity in early modern periods.
Currently, the issue of global warming has attracted much scholarly attention. Warming has been unprecedented over the last two millennia, which is different from the warm eighteenth century mentioned in this study. Potential impacts of climate change on human societies are still under debate. Further research is needed to assess the climate–agriculture link under the global warming trend, especially in some under-developed regions or countries that are still heavily dependent on agricultural production. The findings in the study not only evaluated the effectiveness of crop management to relieve climatic impact at a low technological level in past society, but also investigated the potential to recover after climatic shocks. At a low technological level, the primary adaptation approach, like the simple crop management strategy described in the study, is not enough. Thus, no doubt the development of technology is the key step to addressing social vulnerability to climate change. In addition, after climatic shocks, we also may accelerate recovery speed if we have more choices in terms of socio-economic development, as illustrated in the study: Western Europe maintained a stronger pace to heal the damages caused by the cooling impacts than did Eastern Europe in the recovery period. Perhaps our empirical analysis of pre-industrial Europe could serve as a reference to attract more attention to the recovery capacity of society after the impact of climate change in the future.

Acknowledgments

The research grants are generously provided by a post-doctoral fellowship from The University of Hong Kong, Hong Kong, Hui Oi-Chow Trust Fund (201502172003 and 201602172006), and the Research Grants Council of The Government of the Hong Kong Special Administrative Region of the People’s Republic of China (HKU745113H and HKU17610715). The funders had no role in study design, data collection and analysis, decision to publish, or preparation of the manuscript.

Author Contributions

Q.P. conceived and designed the experiments; Q.P. performed the experiments; Q.P., D.D.Z. and H.F.L. analyzed the data; Q.P., D.D.Z. and G.D.L. contributed reagents/materials/analysis tools; Q.P. and H.F.L. wrote the paper.

Conflicts of Interest

The authors declare no conflict of interest.

References

  1. IPCC. Climate Change 2007: Impacts, Adaptation and Vulnerability. Contribution of Working Group II to the Fourth Assessment Report of the Intergovernmental Panel on Climate Change; Cambridge University Press: Cambridge, UK, 2008. [Google Scholar]
  2. Galloway, P.R. Long-term fluctuations in climate and population in the preindustrial era. Popul. Dev. Rev. 1986, 12, 1–24. [Google Scholar] [CrossRef]
  3. Lee, H.F.; Zhang, D.D.; Pei, Q.; Fei, J. Downscaling and disaggregating NAO-conflict nexus in pre-industrial Europe. Chin. Geogr. Sci. 2016, 1–14. [Google Scholar] [CrossRef]
  4. Zhang, D.D.; Lee, H.F.; Wang, C.; Li, B.; Zhang, J.; Pei, Q.; Chen, J. Climate change and large-scale human population collapses in the pre-industrial era. Glob. Ecol. Biogeogr. 2011, 20, 520–531. [Google Scholar] [CrossRef]
  5. Brandon, P.F. Cereal yields on Sussex estate of Battle Abbey during the later middle ages. Econ. Hist. Rev. 1972, 24, 404–412. [Google Scholar] [CrossRef]
  6. Van Bath, B.H.S. The rise of intensive husbandary in the Low Countries. In Agrarian Conditions in Modern European History; Warner, C.K., Ed.; The Macmillan Company: New York, NY, USA, 1966. [Google Scholar]
  7. Pei, Q.; Zhang, D.D.; Lee, H.F.; Li, G. Climate change and macro-economic cycles in pre-industrial Europe. PLoS ONE 2014, 9, e88155. [Google Scholar] [CrossRef] [PubMed] [Green Version]
  8. Pei, Q.; Zhang, D.D.; Li, G.; Lee, H.F. Climate change and the macroeconomic structure in pre-industrial Europe: New evidence from wavelet analysis. PLoS ONE 2015, 10, e0126480. [Google Scholar] [CrossRef] [PubMed] [Green Version]
  9. Zhang, D.D.; Lee, H.F.; Wang, C.; Li, B.; Pei, Q.; Zhang, J.; An, Y. The causality analysis of climate change and large-scale human crisis. Proc. Natl. Acad. Sci. USA 2011, 108, 17296–17301. [Google Scholar] [CrossRef] [PubMed]
  10. Pei, Q.; Zhang, D.D.; Lee, H.F. Evaluating the effectiveness of agricultural adaptation to climate change in preindustrial society. Asian Geogr. 2015, 32, 85–98. [Google Scholar] [CrossRef] [Green Version]
  11. Parker, G.; Smith, L.M. Introduction. In The General Crisis of the Seventeenth Century, 2nd ed.; Parker, G., Smith, L.M., Eds.; Routledge: London, UK, 1997. [Google Scholar]
  12. Zohary, D.; Hopf, M. Domestication of Plants in the Old World; Oxford University Press: New York, NY, USA, 2000. [Google Scholar]
  13. Appleby, A.B. Grain prices and subsistence crises in England and France. J. Econ. Hist. Rev. 1979, 39, 865–887. [Google Scholar] [CrossRef]
  14. Howden, S.M.; Soussana, J.-F.; Tubiello, F.N.; Chhetri, N.; Dunlop, M.; Meinke, H. Adapting agriculture to climate change. Proc. Natl. Acad. Sci. USA 2007, 104, 19691–19696. [Google Scholar] [CrossRef] [PubMed]
  15. Pei, Q.; Zhang, D.D.; Li, G.; Lee, H.F. Short and long term impacts of climate variations on the agrarian economy in pre-industrial Europe. Clim. Res. 2013, 56, 169–180. [Google Scholar] [CrossRef]
  16. Lee, H.F.; Zhang, D.D.; Brecke, P.; Pei, Q. Regional geographic factors mediate the climate-war relationship in Europe. Br. J. Interdiscip. Stud. 2015, 2, 1–28. [Google Scholar]
  17. Lee, H.F.; Zhang, D.D.; Brecke, P.; Fei, J. Positive correlation between the North Atlantic Oscillation and violent conflicts in Europe. Clim. Res. 2013, 56, 1–10. [Google Scholar] [CrossRef]
  18. Brenner, R. Agrarian class structure and economic development in pre-industrial Europe. Past Present 1976, 70, 30–75. [Google Scholar] [CrossRef]
  19. Campell, B.M.S. Nature as historical protagonist: Environment and society in pre-industrial England. Econ. Hist. Rev. 2010, 63, 281–314. [Google Scholar] [CrossRef]
  20. Hartmann, H.T.; Kofranek, A.M.; Rubatzky, V.E.; Flocker, W.J. Plant Science: Growth, Development, and Utilization of Cultivated Plants; Prentice-Hall Inc.: Englewood Cliffs, NJ, USA, 1981. [Google Scholar]
  21. Jones, P.D.; Bradley, R.S. Climatic variations over the last 500 years. In Climate Since AD 1500, Revised ed.; Bradley, R.S., Jones, P.D., Eds.; Routledge: London, UK; New York, NY, USA, 1995. [Google Scholar]
  22. Sayre, N.F. Ecological and geographical scale: Parallels and potential for integration. Prog. Hum. Geogr. 2005, 29, 276–290. [Google Scholar] [CrossRef]
  23. Gerstengarbe, F.-W.; Werner, P.C. A short update on Koppen climate shifts in Europe between 1901 and 2003. Clim. Chang. 2008, 92, 99–107. [Google Scholar] [CrossRef]
  24. Peel, M.C.; Finlayson, B.L.; McMahon, T.A. Updated world map of the Köppen-Geiger climate classification. Hydrol. Earth Syst. Sci. 2007, 11, 1633–1644. [Google Scholar] [CrossRef]
  25. McKnight, T.L.; Hess, D. Climate Zones and Types: The Köppen System. In Physical Geography: A Landscape Appreciation; Prentice Hall: Upper Saddle River, NJ, USA, 2000. [Google Scholar]
  26. Persson, K.G. The seven lean years, elasticity traps, and intervention in grain markets in pre-industrial Europe. Econ. Hist. Rev. 1996, 49, 692–714. [Google Scholar] [CrossRef]
  27. Osborn, T.J.; Briffa, K.R. The spatial extent of 20th-century warmth in the context of the past 1200 years. Science 2006, 311, 841–844. [Google Scholar] [CrossRef] [PubMed]
  28. Stone, D. The Polish-Lithuanian State, 1386–1795; University of Washington Press: Seattle, Washington, DC, USA, 2001. [Google Scholar]
  29. Fulbrook, M. A Concise History of Germany; Cambridge University Press: Cambridge, UK, 2004. [Google Scholar]
  30. Pennington, D.H. Europe in the Seventeenth Century; Longman: London, UK, 1989. [Google Scholar]
  31. Hsiang, S.M.; Burke, M.; Miguel, E. Quantifying the influence of climate on human conflict. Science 2013, 341, 1235367. [Google Scholar] [CrossRef] [PubMed]
  32. Fischer, D.H. The Great Wave: Price Revolutions and the Rhythm of History; Oxford University Press: New York, NY, USA, 1996. [Google Scholar]
  33. Parker, G.; Smith, L.M. Introduction. In The General Crisis of the Seventeenth Century; Parker, G., Smith, L.M., Eds.; Routledge & Kegan Paul: London, UK, 1978. [Google Scholar]
  34. Aston, T. Crisis in Europe: 1560–1660; Routledge & Kegan Paul: London, UK, 1996. [Google Scholar]
  35. Jones, P.D.; Bradley, R.S. Climatic variations in the longest instrumental records. In Climate Since AD 1500; Bradley, R.S., Jones, P.D., Eds.; Routledge: London, UK, 1992. [Google Scholar]
  36. Mathias, R.J. Factors Affecting the Establishment of Callus Cultures in Wheat. In Wheat; Bajaj, Y.P.S., Ed.; Springer: Heidelberg, Germany, 1990. [Google Scholar]
  37. Luterbacher, J.; Dietrich, D.; Xoplaki, E.; Grosjean, M.; Wanner, H. European seasonal and annual temperature variability, trends, and extremes since 1500. Science 2004, 303, 1499–1503. [Google Scholar] [CrossRef] [PubMed]
  38. Luterbacher, J.; Werner, J.P.; Smerdon, J.E.; Fernández-Donado, L.; González-Rouco, F.J.; Barriopedro, D.; Ljungqvist, F.C.; Büntgen, U.; Zorita, E.; Wagner, S.; et al. European summer temperatures since Roman times. Environ. Res. Lett. 2016, 11, 024001. [Google Scholar] [CrossRef]
  39. Büntgen, U.; Tegel, W.; Nicolussi, K.; McCormick, M.; Frank, D.; Trouet, V.; Kaplan, J.O.; Herzig, F.; Heussner, K.-U.; Wanner, H.; et al. 2500 years of European climate variability and human susceptibility. Science 2011, 331, 578–582. [Google Scholar] [CrossRef] [PubMed]
  40. Dobrovolný, P.; Moberg, A.; Brázdil, R.; Pfister, C.; Glaser, R.; Wilson, R.; Engelen, A.v.; Limanówka, D.; Kiss, A.; Halíčková, M.; et al. Monthly, seasonal and annual temperature reconstructions for Central Europe derived from documentary evidence and instrumental records since AD 1500. Clim. Chang. 2010, 101, 69–107. [Google Scholar] [CrossRef]
  41. Guiot, J.; Corona, C.; members, E. Growing season temperatures in Europe and climate forcings over the past 1400 years. PLoS ONE 2010, 5, e9972. [Google Scholar] [CrossRef] [PubMed]
  42. Van Bath, B.H.S. The yields of different crops (mainly cereal) in relation to the seed c. 810–1820. Acta Hist. Neederlandica 1963, 2, 26–106. [Google Scholar]
  43. McConnell, C.R.; Bruce, S.L. Economics: Principles, Problems and Policies; McGraw-Hill/Irwin: Boston, MA, USA, 2002. [Google Scholar]
  44. Spencer, M.H.; Orley, M.; Amos, J. Contemporary Economics, 8th ed.; Worth Publishers: New York, NY, USA, 1993. [Google Scholar]
  45. Van Bath, B.H.S. Yield Ratios, 810–1820; A.A.G. Bijdragen, No. 10; Afdeling Agrarische Geschiedenis, Landbouwhogeschool: Wageningen, Pays-Bas; p. 963.
  46. Vries, J. Economy of Europe in an Age of Crisis; Cambridge University Press: New York, NY, USA, 1976. [Google Scholar]
  47. Olmstead, A.L.; Rhode, P.W. Adapting North American wheat production to climatic challenges, 1839–2009. Proc. Natl. Acad. Sci. USA 2011, 108, 480–485. [Google Scholar] [CrossRef] [PubMed]
  48. Bunge, M. Causality and Modern Science, 4th ed.; Transaction Publishers: New Brunswick, NB, Canaada, 2009. [Google Scholar]
  49. Babbie, E. The Practice of Social Research; Wadsworth Cengage Learning: Belmont, CA, USA, 2013. [Google Scholar]
  50. Gibbons, J.D.; Chakraborti, S. Nonparametric Statistical Inference, 4th ed.; Marcel Dekker: New York, NY, USA, 2003. [Google Scholar]
  51. Smit, B.; Wandel, J. Adaptation, adaptive capacity and vulnerability. Glob. Environ. Chang. 2006, 16, 282–292. [Google Scholar] [CrossRef]
  52. Meza, F.J.; Silva, D. Dynamic adaptation of maize and wheat production to climate change. Clim. Chang. 2009, 94, 143–156. [Google Scholar] [CrossRef]
  53. Iglesias, A.; Erda, L.; Rosenzweig, C. Climate change in Asia: A review of the vulnerability and adaptation of crop production. Water Air Soil Pollut. 1996, 92, 13–27. [Google Scholar]
  54. Rosenzweig, C.; Parry, M.L. Potential impact of climate change on world food supply. Nature 1994, 367, 133–138. [Google Scholar] [CrossRef]
  55. McEvedy, C.; Jones, R. Atlas of World Population History; Allen Lane: London, UK, 1978. [Google Scholar]
  56. Zirkle, C. How maize get to Europe. J. Hered. 1952, 43, 116. [Google Scholar]
  57. Langer, W.L. American foods and Europe’s population growth 1750–1850. J. Soc. Hist. 1975, 8, 51–66. [Google Scholar] [CrossRef]
  58. Van Bath, B.H.S. The Agrarian History of Western Europe A.D. 500–1850; Bulter & Tanner Ltd: Frome/London, UK, 1963. [Google Scholar]
  59. Coleman, D.C. Technology and economic history, 1500–1750. Econ. Hist. Rev. 1959, 11, 506–514. [Google Scholar] [CrossRef]
  60. Fussell, G.E. Farming Technique from Prehistoric to Modern Times; Pergamon Press: Edinburgh/London, UK, 1966. [Google Scholar]
  61. Martin, J.H.; Leonard, W.H.; Stamp, D.L. Principles of Field Crop Production; Macmilan Publishing Co., Inc.: New York, NY, USA, 1976. [Google Scholar]
  62. Leonard, W.H.; Martin, J.H. Cereal Crops; The Macmilam Company: London, UK, 1970. [Google Scholar]
  63. Orth, R.A.; Shellenberger, J.A. Origin, production, and utilization of wheat. In Wheat: Chemistry and Technology, 3rd ed.; Pomeranz, Y., Ed.; American Association of Cereal Chemists, Inc.: Saint Paul, MN, USA, 1988; Volume 1. [Google Scholar]
  64. Hugh, J.C.; Hoveling, A.W. Wheat: Chemistry and Utilization; Technomic Publishing Co., Inc.: Lancaster, PA, USA, 1998. [Google Scholar]
  65. Küster, H. Rye. In The Cambridge World History of Food; Kiple, K.F., Ornelas, K.C., Eds.; Cambridge University Press: Cambridge, UK, 2000; Volume I. [Google Scholar]
  66. Duff, B.; Rasmussen, P.E.; Smiley, R.W. Wheat/fallow systems in semi-arid regions of the Pacific NW America. In Agriculture Sustainability: Economic, Environmental and Statistical Considerations; Barnett, V., Payne, R., Steiner, R., Eds.; Jhon Wiley & Sons: West Sussex, UK, 1995. [Google Scholar]
  67. Lough, J. An Introduction to Seventeenth Century France; Orient Longmans Private Ltd.: New York, NY, USA, 1957. [Google Scholar]
  68. Bell, G.D.H. The history of wheat cultivation. In Wheat Breeding: Its Scientific Basis; Lupton, F.G.H., Ed.; Chapman and Hall: London, UK, 1987. [Google Scholar]
  69. Takahashi, R. The origin and evolution of cultivated barley. Adv. Genet. 1955, 7, 227–266. [Google Scholar]
  70. Moore-Colyer, R.J. Oats and oat production in history and prehistory. In The Oat Crop: Production and Utilization; Welch, R.W., Ed.; Chapman & Hall: London, UK, 1995. [Google Scholar]
  71. Schrickel, D.J. Oats production, value, and use. In Oats: Chemistry and Technology; Webster, F.H., Ed.; American Association of Cereal Chemists, Inc.: Saint Paul, MN, USA, 1986. [Google Scholar]
  72. Albala, K. Food in Early Modern Europe; Greenwood Press: London, UK, 2003. [Google Scholar]
  73. Shands, H.G.; Dickson, A.D. Barley-botany, production, harvesting, processing, utilization, and economics. Econ. Bot. 1953, 8, 3–26. [Google Scholar] [CrossRef]
  74. Tarjoc, F.C.; Tabără, V. Issues concerning the impact of foliar fertilization on the production of barley in Timisoara. Res. J. Agric. Sci. 2011, 43, 184–189. [Google Scholar]
  75. Nilan, R.A.; Ullrich, S.E. Barley: Taxonomy, origin, distibution, production, genetics, and breeding. In Barley: Chemistry and Technology; MacGregor, A.W., Bhatty, R.S., Eds.; American Association of Cereal Chemists, Inc.: Saint Paul, MN, USA, 1993. [Google Scholar]
  76. Jan, D.V. Economy of European in an Age of Crisis, 1600–1750; Cambridge University Press: New York, NY, USA, 1976. [Google Scholar]
  77. Gunst, P. Agrarian Development and Social Change in Eastern Europe, 14th–19th Centuries; Variorum: Hampshire, UK, 1996. [Google Scholar]
  78. Weisser, M.R. The agrarian depression in seventeenth-century Spain. J. Econ. Hist. 1982, 42, 149–154. [Google Scholar] [CrossRef]
  79. Romano, R. Between the sixteenth and seventeenth centuries: The economic crisis of 1619–1622. In The General Crisis of the Seventeenth Century, 2nd ed.; Parker, G., Smith, L.M., Eds.; Routledge: London, UK, 1997. [Google Scholar]
  80. Welch, R.W. The Oat Crop: Production and Utilization; Chapman & Hall: London, UK, 1995. [Google Scholar]
  81. Karl, G.P. Grain Markets in Europe, 1500–1900: Integration and Deregulation; Cambridge University Press: Cambridge, UK, 1999. [Google Scholar]
  82. Dolidon, H. La multiplicité des échelles dans l’analyse d’un phénomène d’interface nature/société.L’exemple des feux de brousse en afrique de l’ouest. Cybergeo: European J. Geography 2007, 363, 20. [Google Scholar]
  83. Pei, Q.; Zhang, D.D.; Li, G.; Forêt, P.; Lee, H.F. Temperature and precipitation effects on agrarian economy in late imperial china. Environ. Res. Lett. 2016, 11, 064008. [Google Scholar] [CrossRef]
  84. Pei, Q.; Zhang, D.D.; Lee, H.F. Contextualizing human migration in different agro-ecological zones in ancient China. Quat. Int. 2016. [Google Scholar] [CrossRef]
  85. Chaplin, J.E. Earthsickness: Circumnavigation and the terrestrial human body, 1520–1800. Bull. Hist. Med. 2012, 86, 515–542. [Google Scholar] [CrossRef] [PubMed]
  86. MacDonald, K.I. Push and shove: Spatial history and the construction of a Portering economy in northern Pakistan. Comp. Stud. Soc. Hist. 1998, 40, 287–317. [Google Scholar] [CrossRef]
  87. Clark, G. A Farewell to Alms: A Brief Economic History of the World; Princeton University Press: Princeton, NJ, USA; Oxford, UK, 2007. [Google Scholar]
  88. Allen, R.C. Economic structure and agricultural productivity in Europe, 1300–1800. Eur. Rev. Econ. Hist. 2000, 3, 1–25. [Google Scholar] [CrossRef]
  89. Orlove, B. Human adaptation to climate change: A review of three historical cases and some general perspectives. Environ. Sci. Policy 2005, 8, 589–600. [Google Scholar] [CrossRef]
  90. Zhang, D.D.; Brecke, P.; Lee, H.F.; He, Y.Q.; Zhang, J. Global climate change, war, and population decline in recent human history. Proc. Natl. Acad. Sci USA 2007, 104, 19214–19219. [Google Scholar] [CrossRef] [PubMed]
  91. Gibson, C.C.; Ostrom, E.; Ahn, T.K. The concept of scale and the human dimensions of global change: A survey. Ecol. Econ. 2000, 32, 217–239. [Google Scholar] [CrossRef]
  92. Overton, M. Agricultural Revolution in England: The Transformation of the Agrarian Economy 1500–1850; Cambridge University Press: Cambridge, UK; New York, NY, USA; Melbourne, Australia, 1996. [Google Scholar]
  93. Pretty, J.N. Farmers’ extension practice and technology adaptation: Agricultural revolution in 17–19th century Britain. Agric. Hum. Values 1991, 8, 132–148. [Google Scholar] [CrossRef]
  94. Bieleman, J. Five Centuries of Farming: A Short History of Dutch Agriculture 1500–2000; Wageningen Academic Publishers: Wageningen, The Netherlands, 2010. [Google Scholar]
  95. Andersen, T.B.; Jensen, P.S.; Skovsgaard, C.V. The heavy plough and the agricultural revolution in medieval Europe. J. Dev. Econ. 2016, 118, 133–149. [Google Scholar] [CrossRef]
  96. Fraser, E.D.G. Can economic, land use and climatic stresses lead to famine, disease, warfare and death? Using Europe’s calamitous 14th century as a parable for the modern age. Ecol. Econ. 2011, 70, 1269–1279. [Google Scholar]
  97. Challand, B. 1989, contested memories and the shifting cognitive maps of Europe. Eur. J. Soc. Theor. 2009, 12, 397–408. [Google Scholar] [CrossRef]
  98. Stråth, B. A European identity: To the historical limits of a concept. Eur. J. Soc. Theor. 2002, 5, 387–401. [Google Scholar] [CrossRef]
  99. Warner, C.K. Introduction. In Agrarian Conditions in Modern European History; Warner, C.K., Ed.; The Macmillan Company: New York, NY, USA, 1966. [Google Scholar]
  100. Young, C. Religion and economic growth in Western Europe: 1500–2000. In Manuscript; Stanford University: Stanford, CA, USA, 2009. [Google Scholar]
  101. Clark, G. Productivity growth without technical change in European agriculture before 1850. J. Econ. Hist. 1987, 47, 419–432. [Google Scholar] [CrossRef]
  102. Douglas, P.H. The cobb-Douglas production function once again: Its history, its testing, and some new empirical values. J. Political Econ. 1976, 84, 903–916. [Google Scholar] [CrossRef]
  103. Symons, L. Agricultural Geography, Revised ed.; Westview Press: Boulder, CO, USA, 1979. [Google Scholar]
  104. Floyd, J.E. The effects of farm price supports on the returns to land and labor in agriculture. J. Political Econ. 1965, 73, 148–158. [Google Scholar] [CrossRef]
  105. Cornia, G.A. Farm size, land yields and the agricultural production function: An analysis for fifteen developing countries. World Dev. 1985, 13, 513–534. [Google Scholar] [CrossRef]
  106. Acemoglu, D. Technical change, inequality and the labor market. J. Econ. Lit. 2002, 40, 7–72. [Google Scholar] [CrossRef]
Figure 1. Map of Europe divided by Köppen Climate Classification. Blue part—Eastern Europe; Green part—Western Europe.
Agriculture 06 00029 g001
Figure 2. Temperature anomalies in Europe in AD 1500–1800. Note: The orange line is the normalized temperature reconstruction of Luterbacher et al. [37]; the green line is of Luterbacher et al. [38]; the blue line is of Osborn and Briffa [27]; the grey line is of Büntgen et al. [39]; the purple line is of Dobrovolný et al. [40]; and the red line is of Guiot et al. [41]. The bold black line is the arithmetic average of the six normalized temperature reconstructions, which was employed in this study. Blue shade indicates the extreme cooling period during the Little Ice Age (AD 1560–1660), while red shade indicates the warm agricultural recovery period (AD 1700–1800).
Agriculture 06 00029 g002
Figure 3. Average crop yield ratio in Eastern and Western Europe. (A) Average crop yield ratio in Eastern Europe; (B) average crop yield ratio in Western Europe. Note: Scatter plots in the figure are the raw data of crop yield ratio. Red line represents the general trend of crop yield ratio that is derived from non-parametric analysis. Blue shade indicates the extreme cooling period during the Little Ice Age (AD 1560–1660), while red shade indicates the warm agricultural recovery period (AD 1700–1800).
Agriculture 06 00029 g003
Figure 4. Yield ratio of various crop types in Eastern Europe. (A) wheat; (B) rye; (C) barley; (D) oats. Note: Scatter plots in the figure are the raw data of crop yield ratio. Red line represents the general trend of crop yield ratio that is derived from non-parametric analysis. Blue shade indicates the extreme cooling period during the Little Ice Age (AD 1560–1660), while red shade indicates the warm agricultural recovery period (AD 1700–1800).
Agriculture 06 00029 g004
Figure 5. Yield ratio of various crop types in Western Europe. (A) wheat; (B) rye; (C) barley; (D) oats. Note: Scatter plots in the figure are the raw data of crop yield ratio. Red line represents the general trend of crop yield ratio that is derived from non-parametric analysis. Blue shade indicates the extreme cooling period during the Little Ice Age (AD 1560–1660), while red shade indicates the warm agricultural recovery period (AD 1700–1800).
Agriculture 06 00029 g005
Table 1. ANOVA for various crop yield ratio between Eastern and Western Europe in AD 1700–1800.
MeanEastern EuropeWestern EuropeComparisonFp
Wheat4.2433.8854.601Eastern<Western37.4990.00 **
Rye6.0136.0655.961-0.5980.44
Barley5.3245.0585.591Eastern<Western4.6740.03 *
Oats4.0753.2914.859Eastern<Western88.6120.00 **
** Significant at the 0.01 level (p < 0.01); * Significant at the 0.05 level (p < 0.05).

