Article

Efficacy of Chicken Litter and Wood Biochars and Their Activated Counterparts in Heavy Metal Clean up from Wastewater

1
USDA, ARS, Southern Regional Research Center, 1100 Robert E. Lee Blvd., New Orleans, LA 70124, USA
2
USDA, ARS, Costal Plains Soil, Water and Plant Research Center, 2611 W. Lucas St., Florence, SC 29501, USA
3
Department of Natural Resources and Environmental Design, North Carolina A & T State University, 1601 E. Market St., Greensboro, NC 27411, USA
4
USDA, ARS, Jamie Whitten Delta States Research Center, 141 Experiment Station Road, Stoneville, MS 38776, USA
*
Author to whom correspondence should be addressed.
Agriculture 2015, 5(3), 806-825; https://doi.org/10.3390/agriculture5030806
Submission received: 30 June 2015 / Revised: 8 September 2015 / Accepted: 10 September 2015 / Published: 16 September 2015
(This article belongs to the Special Issue Effects of Biochar on Soil Fertility and Crop Production)

Abstract

:
It is known that properties of activated biochars are tightly associated with those of the original feedstock as well as pyrolysis and activation conditions. This study examined two feedstock types, pine wood shavings and chicken litter, to produce biochars at two different pyrolysis temperatures and subsequently activated by steam, acid or base. In order to measure activation efficiency, all materials were characterized for their properties and ability to remediate two well-known heavy metals of concern: copper and arsenic. Base activated biochars were superior in arsenic adsorption, to acid or steam activated samples, but increase in adsorption was not significant to warrant use. For wood biochars, significant increases of surface functionality as related to oxygen bearing groups and surface charge were observed upon acid activation which led to increased copper ion adsorption. However, oxygen bearing functionalities were not sufficient to explain why chicken litter biochars and steam activated biochars appeared to be significantly superior to wood shavings in positively charged metal ion adsorption. For chicken litter, functionality of respective biochars could be related to phosphate containing groups inherited from feedstock composition, favorably positioning this feedstock in metal ion remediation applications.

1. Introduction

Through extraction from ores and further processing into a myriad of uses, heavy metals have been released into the environment over many years. Since they are not biodegradable, they are prone to accumulate. Some heavy metals are carcinogenic, mutagenic, teratogenic and endocrine disruptors while others cause neurological and behavioral changes especially in children [1,2]. Due to their ubiquitous nature, they are often present in wastewater and their effective removal to acceptable levels commonly requires the use of adsorbents. Copper metal ions in particular, used in a number of industrial processes, e.g., copper mining and smelting, electroplating industries and corrosion of plumbing systems, are one of the most common sources of water pollution [3]. The U.S. EPA set the maximum contaminant level for copper in their National Primary Drinking Water Regulations to 1.3 ppm [4]. A current review of the available methods for heavy metal removal from wastewater [5] includes chemical precipitation, ion-exchange, adsorption, membrane filtration, coagulation-flocculation, flotation and electrochemical methods. Additionally, phyto-remediation of heavy metals has also been comprehensively discussed [1].
While traditional activated carbons such as those produced from coal are excellent materials for physisorption due to their high surface area, they might not have the desirable properties to sorb metal ions. In an effort to produce a carbon with the best qualities for a particular application, various precursors can be used as well as a number of different activation strategies. The increased availability of renewable resources is evermore the impetus for the development of technologies for their effective utilization. Furthermore, producing biochar from biomass is generally an energy autonomous process with potential to generate surplus energy [6,7] making it a carbon sequestering technology. The utilization of available agricultural and forestry residues for conversion and utilization into value-added adsorbents is extremely beneficial due to their availability [8], low cost as compared to fossil fuels, and wide range of physical properties depending on biomass type [9]. The biological potential of U.S. forestlands is 29.1 to 34.6 billion cubic feet per year [10] and logging generates considerable residues, such as pine saw dust and bark waste, which are often discarded as waste [11]. Additional resources include beetle infested pines which contributed in Canada alone to 620 Mt of merchantable timber from 2006 to 2008 [6]. About half of the land in the continental U.S. has agricultural potential for biomass growth [11] and, in 2014, 8.5 billion broilers were produced in the U.S. [12] generating approximately 7.8 million metric tons of chicken litter [13]. Various plant wastes [14,15,16,17,18] and animal wastes [19,20,21] have been utilized as precursors for biochars such as various crop residues, hard and soft woods and many have been shown to adsorb significant amounts of different heavy metals such as copper, zinc, cadmium and lead. Animal manures, in particular, are mass produced in concentrated areas leading to both water and air quality issues as well as public health impacts [21,22]. Previous studies have shown that poultry litter steam-activated carbons or biochars can adsorb significant amounts of heavy metal ions [23,24] as well as other manures [25]. Biochars are the products of pyrolysis that result from the thermal degradation of organic materials. They are relatively porous carbon rich materials containing both oxygen functional groups and aromatic surfaces [26] and can be further activated to enhance their surface functionality. It is known that biochars have potential as adsorbents, however, it is important to understand the mechanisms of activation and how they improve the adsorption potential of the biochar based on feedstock as well as activant choice. The objective of this study was to compare a forestry residue, wood chips, with an agricultural residue, chicken litter as precursors in the manufacture of biochars, at two different pyrolysis temperatures, for heavy metal remediation. Additionally, it was of interest to investigate the efficacy of different activation strategies on the biochars, such as steam activation, acid activation and base activation to determine the best performing adsorbent based on precursor type as well as activation method, in both copper and arsenic ion adsorption.

2. Materials and Methods

2.1. Sample Preparation

Chicken litter and wood shavings were ground separately to less than 2 mm and pyrolyzed in a Autothermic Transportable Torrefaction Machine (ATTM) originally created by Kusters Zima Corp. (Spartanburg, SC, USA) and modified at North Carolina State to pyrolyze woody biomass. Pyrolysis occurred in a low oxygen environment for respectively 1.3 min, 1.8 min, 1.5 min and 2.1 min for wood shavings at 250 °C and 500 °C, and chicken litter at 250 °C and 480 °C. Results and discussion refers to 250 °C and 500 °C pyrolysis temperature for both feedstocks for simplicity. Biochars were further activated via steam activation or chemical activation, using two different chemical activants. Each biochar (50 g) was separately placed in a ceramic crucible bowl and activated in a sealed retort inserted in a box furnace (Lindberg, Type 51662-HR, Watertown, WI, USA). Steam activation was accomplished by injecting water at 3 mL/min using a peristaltic pump, into the nitrogen gas flow entering the heated retort for 45 min at 800 °C [23,24]. Chemical activation involves impregnation of activating agent into the feedstock, followed by thermal degradation. In this study, biochars were soaked overnight in either 30% H3PO4 (acid activation) or 5 M KOH (base activation), 1:1 (m/v) ratio of sample to acid or base, activated 1 h at 450 °C under breathing air and allowed to cool to room temperature overnight. Using an overhead stirrer, chemically activated samples were rinsed twice in 90 °C DI water (2% w/v ratio) to remove excess acid or base, and then dried overnight.

2.2. Physical and Chemical Measurements, Yield, Surface Area, pH

Surface area measurements were obtained from nitrogen adsorption isotherms at 77 °K using a Nova 2000 Surface Area Analyzer (Quantachrome Corp., Boynton Beach, FL, USA). Specific surface areas (BET, Brunner-Emmett-Teller) were taken from adsorption isotherms using the BET equation. The micro pore size distributions were calculated using t-plots derived from the Nova 2000 software. Particle size analysis was conducted on a Partica Laser Scattering Particle Size Distributor Analyzer LA-950V2 by Horiba™ (Kyoto, Japan). One gram sample was mixed in 10 mL of DI water and allowed to fully wet for 2 h, after which sample was analyzed. A Thermo Orion pH meter (Beverly, MA, USA) was used to measure pH, where 0.5 g of sample was placed in 50 mL of deionized water, covered with Parafilm, and allowed to equilibrate by stirring at 300 rpm for 72 h.

2.3. Ultimate, Elemental and Proximate Analysis

Ultimate analysis (CHNSO) was determined by dry combustion using a 2400 Series II CHNS/O analyzer (Perkin Elmer, Shelton, CT, USA). Elemental analysis for the following elements: P, Fe, Ca, Mg, K, S, Na, Cu, Cd, Ni, Zn, and As in both raw samples and respective biochars and activated biochars was performed on digested samples as described previously [27]. All reagents were Ultrapure ICP-grade. Proximate analyses for all samples were performed in triplicate by following American Society for Testing and Materials (ASTM) method D5142-09 using a thermo-gravimetric analyzer (TGA701, LECO, St. Joseph, MI, USA). Moisture was determined as the weight loss after heating sample under N2 atmosphere in open crucible to 107 °C until stable sample weight. Volatile matter was determined as weight loss after heating sample under N2 atmosphere in covered crucible to 950 °C for 7 min. Ash was calculated from remaining mass after heating sample under O2 atmosphere in open crucible to 750 °C and holding until stable weight. Fixed carbon was calculated by difference.

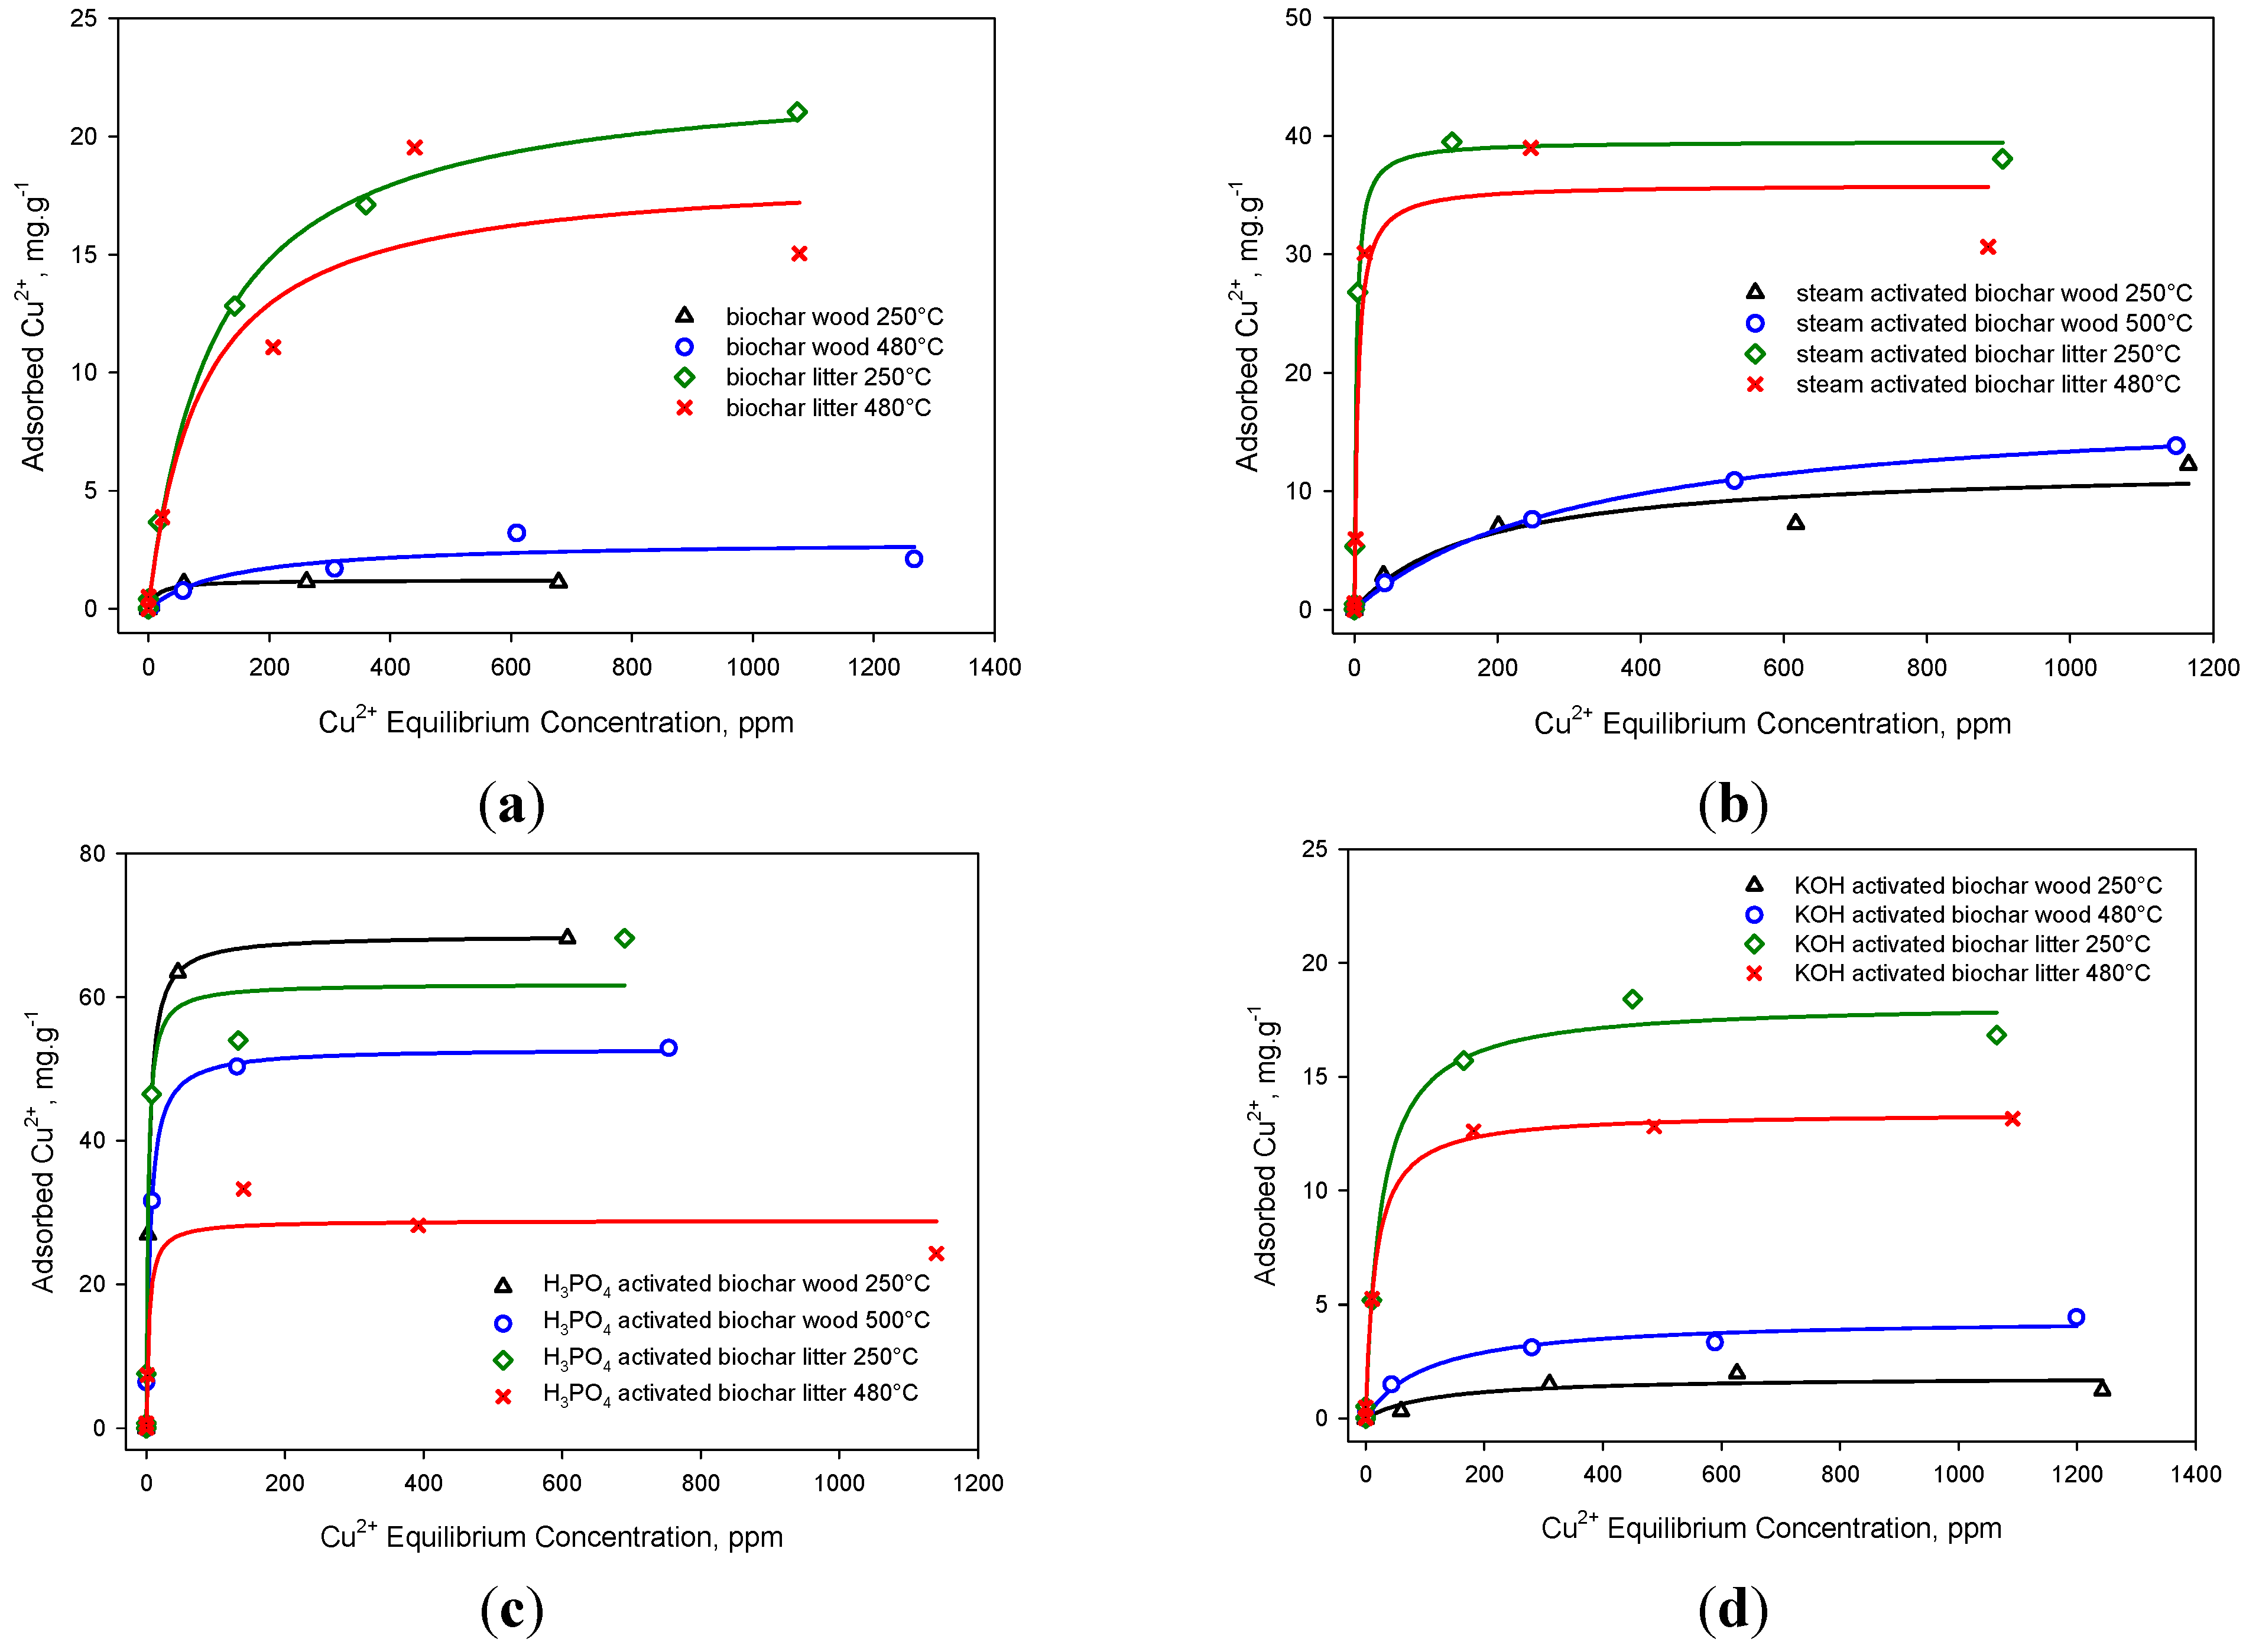
2.4. Copper Adsorption Isotherms

Adsorption isotherms were generated for all biochars and activated biochars, in duplicate. Binding assays were carried out by adding 0.25 g of sample to 25 mL of a cupric chloride (CuCl2·2H2O) solution at 0.01, 0.1, 1, 5, 10 and 20 mM for 24 h. Solutions were made up in 0.07 M sodium acetate −0.03 M acetic acid buffer (pH 4.8) and slurries stirred at 300 rpm (VarioMAC Multipoint Stirrer HP 15, H + P Labortechnik GmbH, München, Germany) with Teflon coated magnetic stir-bars. For analysis, aliquots of the suspension were filtered using disposable syringe containing 0.22 µm Millipore filters (Millipore Corp., Bedford, MA, USA) to remove suspended material. Metal ion concentrations were determined on acidified (4% v/v nitric acid) 1:5 dilutions of the supernatants by ICP-AES spectroscopy. From the adsorption isotherms, adsorption capacities (Q0) and affinity constants (b) were calculated by fitting the data to the non-linear Langmuir adsorption model, as follows:
Q 0 = Q 0   b   C e 1 + b   C e
where Q0 is the amount of solute adsorbed per unit weight of adsorbent in mg/g, Ce is the equilibrium concentration of solutes in ppm, Q0 is the monolayer capacity of adsorbent for solute in mg/g and b is a constant related to free energy of adsorption in L/ppm. The non-linear least squares regression method of Marquardt was implemented using Sigma Plot v.11.0 for Windows 7 (SPSS Inc., Chicago, IL, USA). A correlation coefficient (r2) and a probability value (p-value) representing “goodness of fit” of the Langmuir model to the data were obtained.

2.5. Arsenic Adsorption

Arsenic solutions were prepared in a pH 8 buffer solution, by mixing 6.81 g H2KO4P with 467 mL of 0.1 M NaOH. For equilibrium measurements, sample was added to 1 mM buffered arsenic solution (1% w/v sodium arsenate dibasic hepta-hydrate, Sigma Aldrich Company, Saint Louis, MO, USA), placed in a 150 mL beaker covered with Parafilm and stirred with Teflon coated, magnetic stir-bars for 24 h at 300 rpm. Slurry pH was monitored at beginning and end of the experiment and an aliquot filtered through a 0.22 μm filter to remove carbon particles. Sample was diluted to 1:100 by volume with 4 vol% HNO3 and analyzed by ICP-AES spectroscopy (Leeman Labs, Hudson, NH, USA).

2.6. Total Titratable Surface Charge

For surface charge measurements, a Boehm’s titrimetric method [28] was modified to identify total titratable negative surface charge by suspending 0.25 g of carbon in 25 mL of 0.1000 ± 0.0005 N NaOH solution, stirring in closed vessel for 24 h, filtering the slurry and adding a 10 mL aliquot to 15 mL of 0.1000 ± 0.0005 N HCl. The HCl neutralized un-reacted NaOH and kept further reaction between atmospheric CO2 and NaOH from occurring. The solution was then back-titrated with 0.1000 ± 0.0005 N NaOH using Bromothymol Blue as an indicator. The volume of NaOH required to neutralize sample was converted to titratable negative surface charge and results expressed as mmol H+ eq per gram carbon, from the following equation:
C s = U b   R b   N M c
where Cs = surface charge per weight of adsorbent in mmol H+ eq/g, Ub = difference in NaOH uptake between titrated sample and titrated blank, Rb = ratio of base volume in original slurry to filtrate volume used in titration, N = HCl normality and Mc = sample weight in grams. Total positive surface charge method involved a modified version of the above method by suspending samples in HCl, filtering the slurry, adding an aliquot to NaOH and back titrating with HCl.

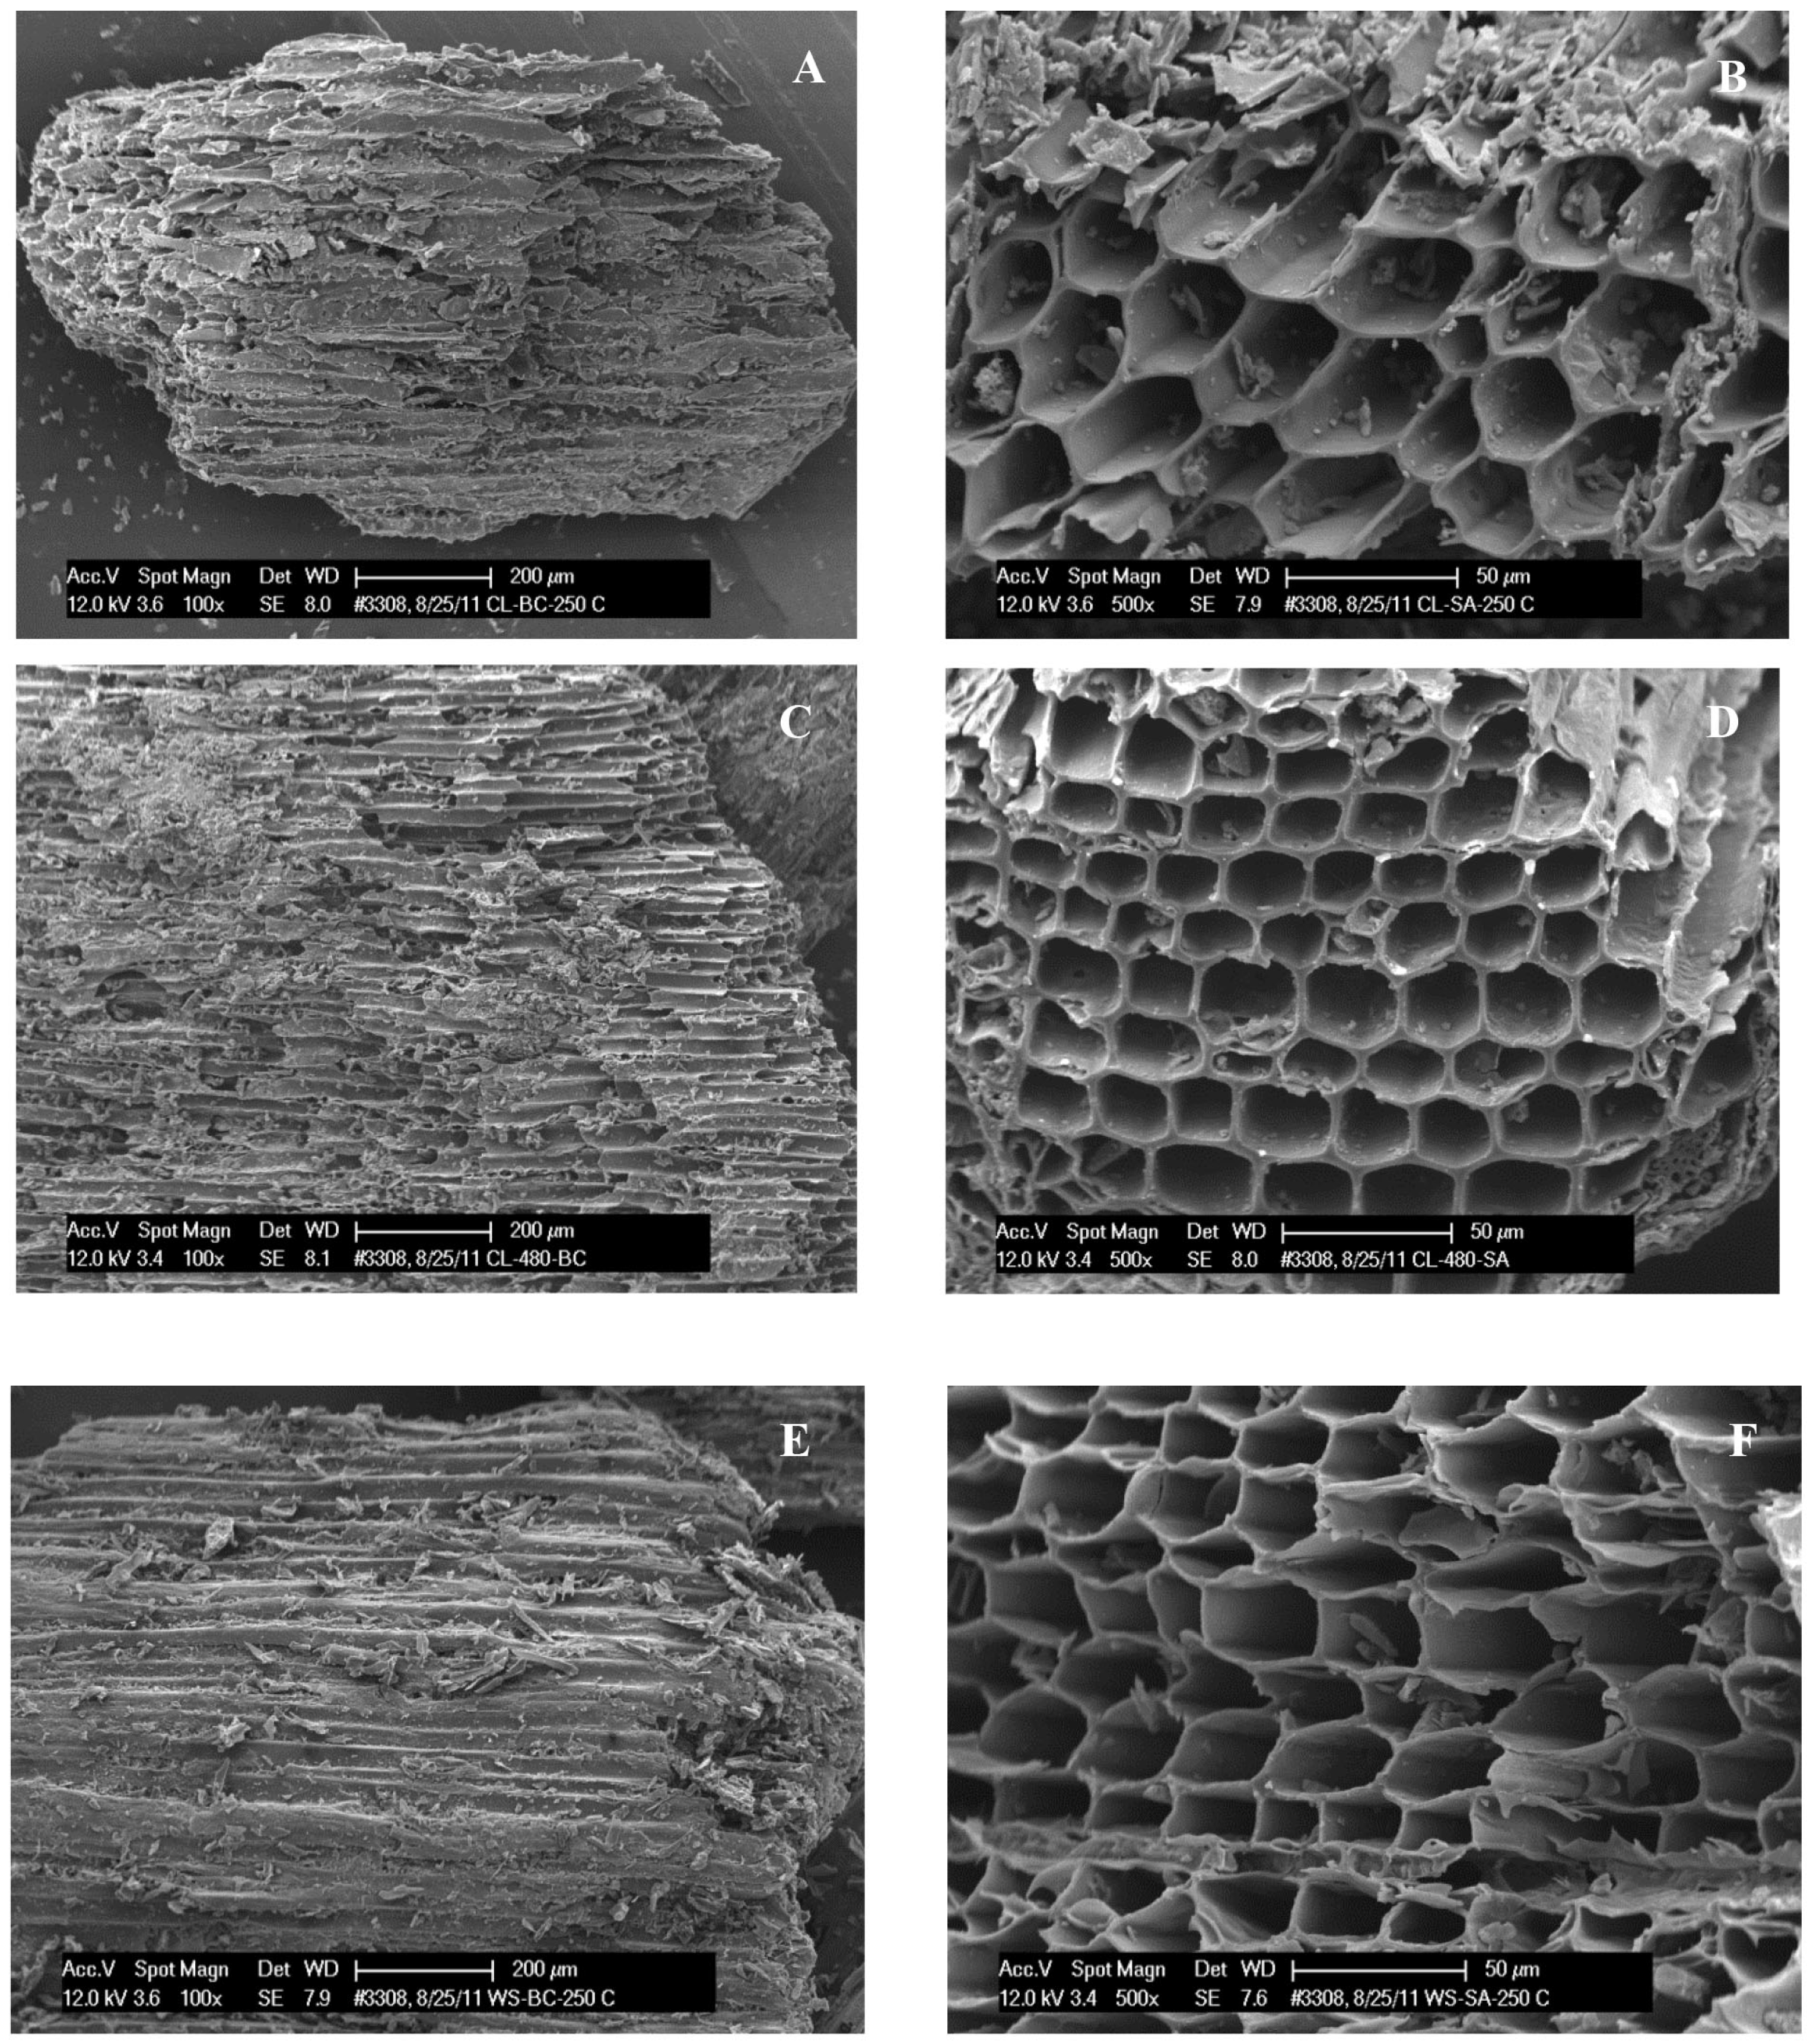
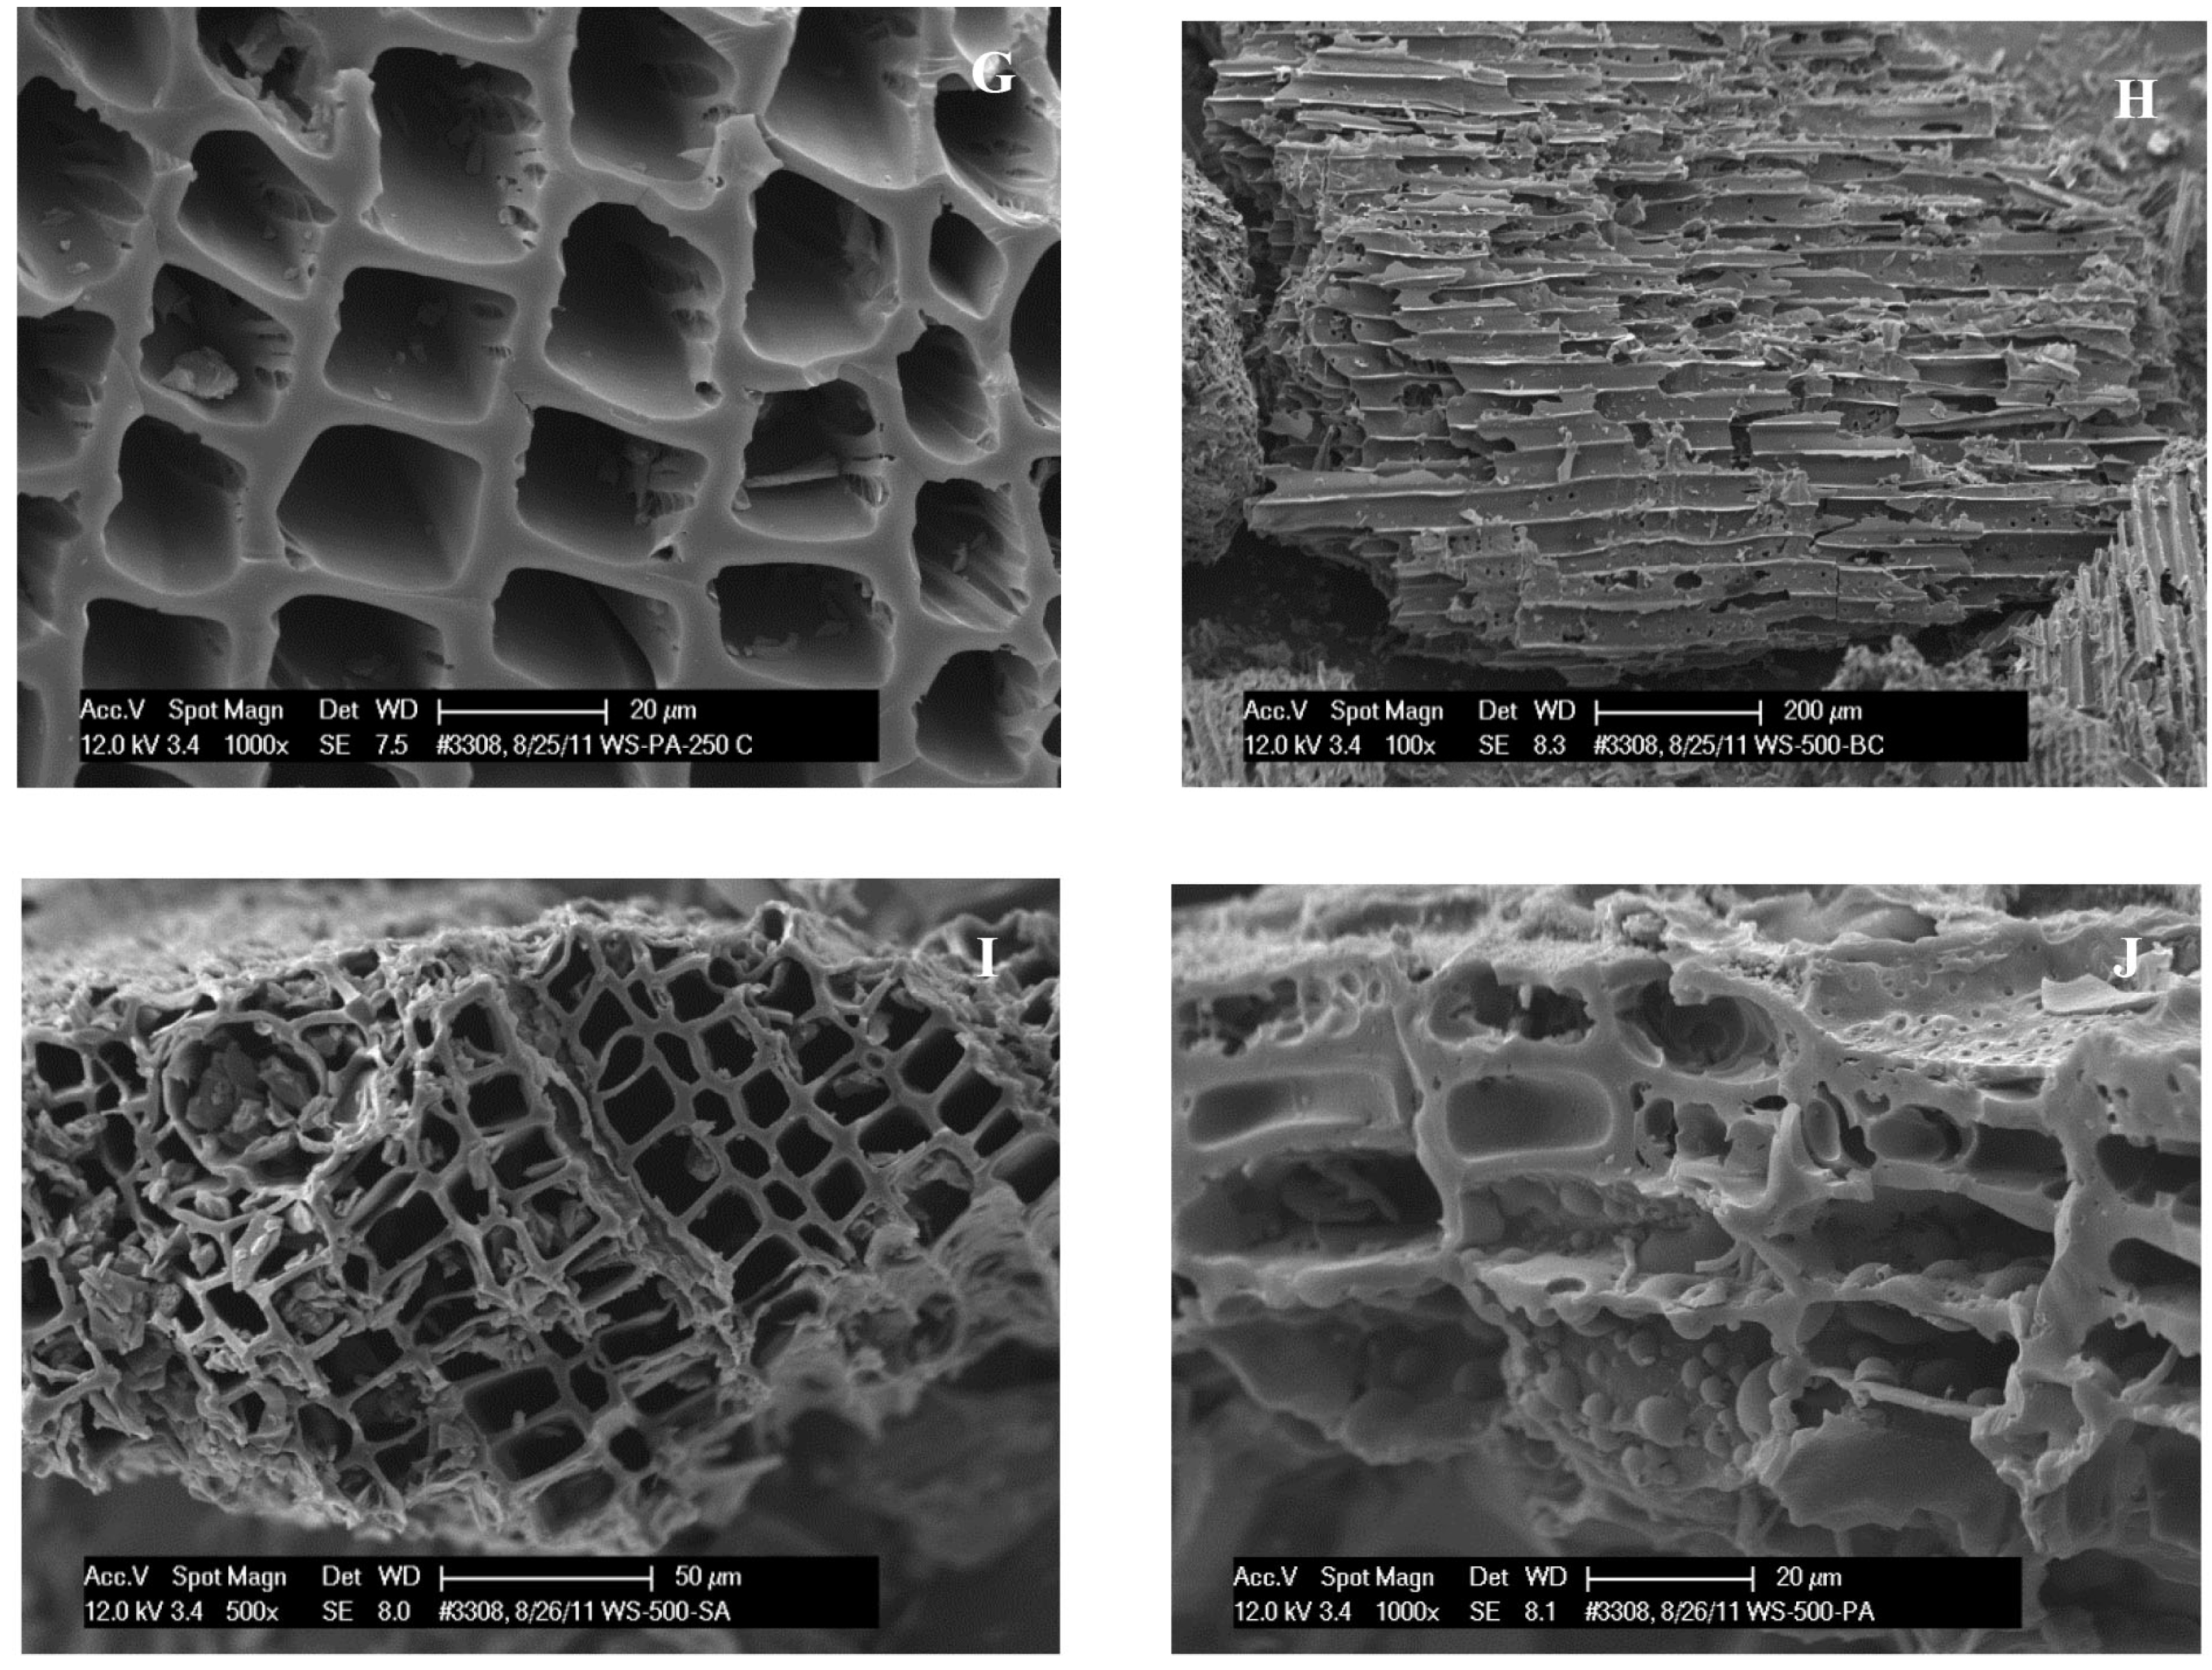
2.7. Scanning Electron Microscopy

Surface characterization on activated biochars was done by viewing samples under an Environmental Scanning Electron Microscope (ESEM; Philips XL30, Leuven, Belgium). Samples were mounted on standard 1/2 inch SEM stubs using double-stick adhesive tabs and coated with 20–30 nm of 60/40 gold-palladium in a Technics Hummer II sputter coater. Samples were viewed in the ESEM operating at a working distance of 10 mm with a magnification of 250–2500 ×. The acceleration voltage of the electron beam was 17 kV.

2.8. Experimental Design and Statistical Analysis

The experimental design was a completely randomized design with a factorial treatment structure of 2 feedstock types × 2 pyrolysis temperatures × 4 processing conditions. Three samples were taken for each treatment, but these were subsamples of the treatments not replications. Therefore analysis of variance for main effect and 2-way interactions used a model with the 3-way interaction as error and variability among samples as sub-sampling error. Relationships between measured sample properties were determined with correlation coefficients using treatment means for each feedstock, pyrolysis temperature and activation. All statistical significant differences inferred in this study were determined at the 5% confidence level.

3. Results and Discussion

With the objective of improving the surface properties and porous structure of biochars and ultimately adsorption towards heavy metals, activation protocols were applied to biochars from wood chips and chicken litter. Distinct morphologies of increasing porous structure are shown in the SEM images from biochar to activated biochar (Figure 1). The represented microscopic honeycomb like structures, typical of fibrous plant materials were anticipated in wood biochars, their presence in chicken manure derives from wood shavings used as bedding material. These microstructures evolve in shape and complexity with pyrolysis and further activation processes. There is an apparent swelling of the walls for higher pyrolysis temperature [29]. Table 1 displays analysis of variance (ANOVA) results where F-values establish if feedstock, pyrolysis temperature and activation had a significant effect on various physico-chemical properties. All major treatments significantly affected adsorption capacity (p < 0.001; Table 1) and activation, in particular, brought about significant differences in all properties with the exception of carbon content.
Figure 1. Scanning Electron Micrographs of (A): chicken litter 250 °C biochar; (B): chicken litter 250 °C steam activated biochar; (C): chicken litter 480 °C biochar; (D): chicken litter 480 °C steam activated biochar; (E): wood chip 250 °C biochar; (F): wood chip 250 °C steam activated biochar; (G): wood chip acid activated biochar; (H): wood chip 500 °C biochars; (I): wood chip 500 °C steam activated biochars; and (J): wood chip 500 °C acid activated biochar.
Agriculture 05 00806 g001aAgriculture 05 00806 g001b
Table 1. ANOVA table for select variables (1) (yield, ash content, pH, attrition, and contents in carbon, oxygen, hydrogen and nitrogen).
EffectDF (2)F-value (Pr)
B.E.T.AshSCVOCCarbonOxygenHydrogenNitrogenAds Cap
Feedstock13.1 (0.177)239 (0.001)3.9 (0.188)11.7 (0.042)201 (0.001)0.7 (0.465)16.6 (0.027)54.9 (0.005)104.3 (<0.0001)
Temperature15.9 (0.098)27.5 (0.013)39.3 (0.025)77.2 (0.003)4.8 (0.117)35.1 (0.010)19.6 (0.021)0.08 (0.801)44.8 (<0.0001)
Feedstock × Temperature14.5 (0.123)17.4 (0.025)1.8 (0.309)0.3 (0.612)3.9 (0.144)0.1 (0.766)1.2 (0.352)0.7 (0.472)28.3 (<0.0001)
Activation370.2 (0.003)11.0 (0.040)118 (0.008)103 (0.002)7.4 (0.067)40.3 (0.006)57.8 (0.004)15.9 (0.024)504.1 (<0.0001)
Feedstock × Activation30.72 (0.603)9.4 (0.049)7.7 (0.115)1.8 (0.323)11.6 (0.037)1.2 (0.430)0.6 (0.654)15.9 (0.024)83.3 (<0.0001)
Temperature × Activation311.0 (0.040)1.4 (0.401)8.2 (0.111)36.7 (0.007)2.3 (0.251)9.7 (0.047)8.4 (0.057)0.6 (0.676)40.8 (<0.0001)
(1) B.E.T.: Surface Area; Ash: Ash Content; SC: Surface Charge: VOC: Volatile Content; Ads Cap: Adsorption Capacity; (2) DF: degrees of freedom.
Mass loss upon activation ranged between 23% and 82%, depending on feedstock and activation method (Table 2) and was higher for 250 °C biochars than 500 °C overall. While 500 °C biochars experienced higher burn-off rates than 250 °C biochars due to higher pyrolysis temperature, PT, regime, mass loss by 250 °C biochars was accounted for during activation. Additional losses resulted from fines (<325 mesh) and mineral loss during rinsing/sieving steps after acid/base activation as seen by higher yields for steam activation than acid/base activation within same feedstock and PT, despite higher activation temperatures (700 °C vs. 450 °C) (Table 2). Particle size distribution analysis of biochars (Figure 2) confirms 16% to 34% of particles smaller than 325 Mesh (44 μm) lost during rinsing. Steam activation yield was slightly higher for wood than chicken litter samples due to higher carbon content in the former (Table 3) as well as lower volatile matter and higher fixed carbon [30]. However, a reversed trend was observed for acid and base activated samples with chicken litter having higher yield than wood at same processing conditions. It is possible fines loss was higher for wood chip samples. Furthermore, it has been reported that inorganic compounds found indigenously within biomass promote formation of gaseous species and biochar at the expense of bio-oil yield [31]. A higher inorganic content of chicken litter (herein represented as total ash, Table 3) would therefore lead to higher yields. In addition, base activation with potassium hydroxide led to higher yields than phosphoric acid activation (Table 2). This corroborates with the fact that the presence of certain minerals in the biochar (e.g., potassium), has been linked to higher yields [32,33], by acting as catalysts and influencing rate of degradation during carbonization reactions. Significantly higher potassium content for base activated samples were established from compositional analysis (Table 4) and expected contribution from the activant (KOH). Potassium also appears to be retained in the activated biochar. Similar findings were reported by others [32].
Figure 2. Particle size distribution for wood chip biochars pyrolyzed at 250 °C and 500 °C (q% represents amount of each size by volume; undersize% represents % of material smaller than that size).
Agriculture 05 00806 g002aAgriculture 05 00806 g002b
Table 2. Physico-chemical and adsorptive properties (Langmuir parameters for Cu2+ adsorption: adsorption capacity; Q0, association affinity constant; b, and “goodness of fit” parameters; r2 and p) for all samples as function of activation strategy, pyrolysis temperature and feedstock (1).
Feedstock SourceSampleY % dbB.E.T. m2/gpHSC meq H+/gQ0 Cu2+ (mg/g)b (L/mg)r2P
WS 250 °CBC-0.035.31.571.220.06560.98<0.0001
SA43.05738.80.0012.20.00580.940.0004
AA17.98512.53.0068.60.26890.99<0.0001
BA40.2276.70.361.840.00850.840.0039
WS 500 °CBC-0.005.60.372.900.00740.890.0016
SA76.75118.10.0017.70.00311.00<0.0001
AA24.85382.22.1152.80.18550.99<0.0001
BA47.83606.70.044.410.0100.98<0.0001
CL 250 °CBC-0.456.21.2822.80.00921.00<0.0001
SA31.859210.50.0639.50.37110.99<0.0001
AA32.07893.92.1561.90.38610.98<0.0001
BA40.21228.00.7018.30.03910.99<0.0001
CL 480 °CBC-1.568.70.2218.60.01130.940.0004
SA68.542010.90.0035.90.21820.97<0.0001
AA42.93205.60.7728.80.27390.96<0.0001
BA53.01187.70.0013.40.06121.00<0.0001
(1) WS: wood shavings; CL: chicken litter; BC: biochar; SA: steam activated biochar; AA: acid activated biochar; BA: base activated biochar; Y: activation yield; B.E.T.: surface area; SC: surface charge in milliequivalents (meq). Q0 and bparameters were derived from fitting the adsorption data at various copper ion concentrations (Cu2+ adsorption isotherms) to the Langmuir model; db: yield is in dry basis.
Table 3. Proximate analysis (1) for all samples as function of activation strategy, feedstock and pyrolysis temperature.
FeedstockSample (2)Moisture, % dbVM %Fixed C %Ash %C %H %O %
Wood chip 4.60 ± 0.0856.9 ± 0.540.0 ± 0.53.08 ± 0.0361.1 ± 1.15.42 ± 0.3224.3 ± 1.7
WS 250 °CBC3.96 ± 0.1159.1 ± 0.738.3 ± 0.42.6 ± 0.862.8 ± 0.17.41 ± 0.6225.8 ± 2.4
BC SA1.89 ± 0.076.0 ± 0.388.4 ± 1.25.6 ± 1.289.6 ± 0.52.07 ± 0.263.7 ± 0.4
BC AA3.05 ± 0.1035.8 ± 0.157.8 ± 2.26.4 ± 2.267.1 ± 0.22.22 ± 0.0427.7 ± 0.6
BC BA3.43 ± 0.1919.9 ± 0.277.6 ± 0.62.6 ± 0.773.5 ± 3.54.23 ± 0.718.2 ± 0.8
WS 500 °CBC7.74 ± 0.0314.2 ± 0.680.3 ± 0.85.6 ± 0.381.9 ± 0.54.03 ± 0.386.0 ± 0.8
BC SA1.56 ± 0.066.3 ± 0.687.1 ± 0.46.6 ± 0.990.0 ± 0.12.39 ± 0.424.1 ± 0.5
BC AA2.41 ± 0.1030.2 ± 0.462.8 ± 7.17.1 ± 1.970.1 ± 0.32.32 ± 0.0721.5 ± 1.4
BC BA3.27 ± 0.3012.1 ± 0.282.0 ± 0.95.9 ± 0.880.4 ± 0.42.67 ± 0.335.6 ± 0.3
chicken litter 41.4 ± 0.970.6 ± 0.517.8 ± 0.811.6 ± 1.038.3 ± 2.44.36 ± 0.5532.7 ± 1.2
CL 250 °CBC3.64 ± 0.0459.5 ± 0.227.0 ± 0.413.5 ± 0.246.3 ± 0.25.74 ± 0.3724.2 ± 0.9
BC SA1.50 ± 0.057.31 ± 0.4944.7 ± 1.048.0 ± 1.446.0 ± 3.70.83 ± 0.168.4 ± 0.7
BC AA22.2 ± 0.632.8 ± 1.349.6 ± 1.917.5 ± 3.252.2 ± 1.11.75 ± 0.1428.4 ± 2.3
BC BA2.24 ± 0.1322.1 ± 0.355.7 ± 2.122.1 ± 2.362.1 ± 0.33.04 ± 0.5310.2 ± 0.3
CL 480 °CBC4.36 ± 0.3321.8 ± 0.538.1 ± 3.840.1 ± 3.551.2 ± 0.63.51 ± 0.508.9 ± 0.2
BC SA1.07 ± 0.206.97 ± 0.5837.8 ± 5.355.2 ± 5.948.4 ± 0.60.71 ± 0.136.2 ± 0.5
BC AA10.1 ± 0.325.0 ± 0.438.0 ± 1.837.0 ± 2.150.3 ± 4.41.40 ± 0.2015.3 ± 0.7
BC BA4.80 ± 0.6620.8 ± 0.740.1 ± 9.939.2 ± 9.358.4 ± 0.52.80 ± 0.099.4 ± 0.4
(1) VM: volatile matter; Fixed C: fixed carbon; C: carbon; H: hydrogen; O: oxygen; (2) WS: wood shavings; CL: chicken litter; 250°C and 480°C or 500°C are pyrolysis temperatures; BC: biochar; SA: steam activated biochar; AA: acid activated biochar; BA: base activated biochar; B.E.T.: surface area; SC: surface charge.
Table 4. Elemental analysis in mg/g for various elements (P, K, Ca, Mg, Na, Fe, S).
SampleT, °CPKCaMgNaFeS
raw woodchips 0.61 ± 0.034.91 ± 0.134.57 ± 0.032.15 ± 0.150.49 ± 0.042.93 ± 0.640.69 ± 0.07
biochar2500.32 ± 0.093.87 ± 0.392.57 ± 0.101.57 ± 0.040.33 ± 0.01-0.52 ± 0.0
steam activated2501.34 ± 0.3512.7 ± 0.027.93 ± 0.754.37 ± 0.041.08 ± 0.064.37 ± 0.972.90 ± 0.18
acid activated2503.76 ± 0.290.36 ± 0.012.23 ± 0.630.71 ± 0.010.13 ± 0.034.03 ± 1.620.24 ± 0.01
base activated2500.64 ± 0.051.04 ± 0.0111.9 ± 0.512.62 ± 0.080.09 ± 0.031.61 ± 0.100.80 ± 0.02
biochar5001.55 ± 0.1912.1 ± 0.4512.0 ± 0.525.06 ± 0.151.04 ± 0.079.66 ± 4.80.89 ± 0.01
steam activated5001.81 ± 0.1417.5 ± 0.4414.2 ± 0.845.97 ± 0.291.19 ± 0.216.03 ± 2.01.01 ± 0.02
acid activated5003.61 ± 0.520.22 ± 0.014.16 ± 0.021.56 ± 0.090.09 ± 0.057.45 ± 5.110.43 ± 0.0
base activated5002.75 ± 1.023.53 ± 0.1224.3 ± 1.084.61 ± 0.150.17 ± 0.027.60 ± 3.621.12 ± 0.04
raw chicken litter 16.7 ± 1.539.3 ± 3.844.2 ± 3.310.1 ± 0.98.77 ± 0.642.77 ± 0.0411.2 ± 1.3
biochar25011.2 ± 2.642.5 ± 2.734.2 ± 8.88.20 ± 0.9110.9 ± 0.34.86 ± 2.127.96 ± 0.38
steam activated25034.9 ± 1.0130 ± 5.9136 ± 4.724.8 ± 0.0325.7 ± 2.510.0 ± 1.8419.8 ± 1.8
acid activated25011.7 ± 0.70.45 ± 0.0037.0 ± 3.50.78 ± 0.180.12 ± 0.048.37 ± 1.233.30 ± 0.19
base activated25013.0 ± 1.815.7 ± 2.4763.3 ± 4.515.1 ± 0.922.47 ± 0.468.58 ± 0.747.08 ± 0.30
biochar48029.5 ± 6.096.0 ± 1.05102 ± 2918.2 ± 1.023.8 ± 0.47.89 ± 2.8414.9 ± 0.6
steam activated48029.5 ± 8.7118 ± 28.8106 ± 3319.7 ± 3.825.1 ± 7.810.6 ± 4.7813.5 ± 2.5
acid activated48024.8 ± 6.66.89 ± 0.1258.3 ± 1.34.72 ± 0.092.59 ± 0.0010.1 ± 0.494.62 ± 0.98
base activated48016.8 ± 6.227.3 ± 3.063.2 ± 2.621.0 ± 2.36.10 ± 0.6610.1 ± 3.137.57 ± 0.02
Biochars displayed negligible surface area at both PT (Table 2) attributable to short pyrolysis residence time (<2.1 min). Higher surface area (318 m2/g) for broiler cake biochar when pyrolyzed for 1 h at 700 °C has been reported [34]. PT was not a significant factor in surface area development (F = 5.9, p = 0.10) (Table 1). While biochar surface area was negligible for all biochars, it significantly increased via activation (F = 70, p = 0.003; Table 1), with largest increase upon acid activation and least increase for basic activated samples (Table 2). Other studies in literature also report higher surface area development for acid activation than steam activation [16,35]. Jagtoyen and Derbyshire [29] determined high porosity development through phosphoric acid activation directly related to the retention and dilation of cellular material creating an extensive surface accessible to the adsorbent. Despite different composition, surface area development upon activation was unaffected by feedstock (F = 3.1, p = 0.18) (Table 1). However, ash content (Table 3) was much higher for chicken litter biochar (13.5%–40.1%) than wood chip biochar (2.6%–5.6%) diminishing remaining fraction per unit weight linked to porosity development, due to low contribution to surface area by ash. Several studies reported higher surface area upon demineralization by acid washing/rinsing, with partial removal of ash constituents [27,36,37] which concentrate during pyrolysis and activation (Table 3) leading to partial pore blockage. In acid activation, surface area development was significantly (LSD of 224.8) more pronounced for 250 °C than 500 °C, for both feedstocks; with 851 m2/g and 789 m2/g surface area for acid activated 250 °C biochars, versus 538 m2/g and 320 m2/g for 500 °C biochars, for wood and litter respectively (Table 2). It is possible that acid and base impregnation was more effective for low PT biochars. Activation via base impregnation was least effective method for surface area development and trends did not follow those for acid activation, with highest surface area (360 m2/g) for 500 °C wood shavings. Tseng [38] reported on significant increase in surface area by increasing activant to adsorbent ratio from 1 to 2–4 for NaOH activated plum kernels. Overall, there were no significant differences in surface area between acid and steam activated samples, unless when isolating PT, where 250 °C samples had higher surface area development upon acid activation.
In addition to feedstock- and PT-dependent structural changes, it was anticipated for activation to bring acid/base behavior changes as function of activant. The pH increased with PT and was affected by activation protocol (Table 2). Biochar’s mineral content is directly related to original amounts in feedstock [39] which substantiates the fact that pH (Table 2) and ash content (Table 3) were higher for chicken litter than wood. The presence of large amount of minerals in chicken litter samples is clearly seen in SEM images (Figure 1A–D). It has been previously reported that mineral content concentrates during pyrolysis due to their low volatility [27]. Acid activation allowed formation of oxygen bearing surface groups as shown by negative surface charge values (Table 2), with wood shavings acid activated 250 °C biochars displaying highest total negative surface charge of 3 meq H+/g. This is consistent with other literature studies reporting overall negative surface charge for biochars [40,41,42,43].
Overall, PT (F = 39, p = 0.025) and activation (F = 118, p = 0.008) significantly influenced surface charge (Table 1). However, while surface charge increased upon acid activation, it decreased with steam and base activation as well as PT (Table 2). Similar surface charge values were reported by Johns et al. [44] for steam activated (0.00 meq H+/g) and acid activated (3.41 meq H+/g) pecan shells. Surface charge is mainly composed of carboxylic, phenolic, hydroxyl, and carbonyl groups [28] which tend to decrease or disappear with PT. In contrast, their formation is enhanced with acid activation, and a strong Pearson correlation was determined between surface charge and oxygen content (F = 0.92, p < 0.0001). Klasson et al. [45] observed an increase in oxygen-containing functional groups for pecan shell-derived phosphoric acid activated carbons as a result of partial oxidation during carbonization associated with enhanced adsorption capacity for Cu2+ [45]. Zhang et al. [18] reported similar results with higher Pb2+ adsorption onto carbons containing higher O- and H-groups, consistent with predominance of negative charges in acidic carbons. Cationic species are thus adsorbed onto negative surface charge functional groups. The fixation of acidic oxygen complexes onto the surface creates an ion-exchange behavior where copper ion species are retained as ligands and protons are released to the aqueous solution giving rise to formation of metal-ligand surface complexes [46].
Proximate analysis (Table 3) and particularly volatile matter (VM) could be an indicator of surface functionality [47], with a significant correlation found (p = 0.71; p = 0.004). Initial VM was higher for chicken litter than wood and exhibited similar losses with PT and activation (Table 3). Carbon content increased with PT while oxygen content decreased (Table 3). Biochar production is often assessed through changes in elemental concentrations of C, H, O and N and associated molar ratios [48], more importantly both H/C and O/C measuring, respectively degree of aromaticity and polarity and illustrated in Van Krevelen diagrams which plot H/C and O/C [49]. The H/C ratio of unburned fuel materials, such as cellulose or lignin is approximately 1.5 [48]. As stated by Schmidt and Noack [50], black carbon represents a continuum from partly charred material to graphite and soot particles with no general agreement on clear-cut boundaries. During carbonization, polymerization reactions lead to formation of aromatic structures, and carbon enrichment as VM from decomposition of organic and inorganic compounds is removed. Hydroxyl and aliphatic groups decrease with PT, leading to a highly carbonized structure and an increase in the aromatic character [51] and hydrophobicity due to removal of oxygen [52]. H/C ratios consistently decreased from raw material to biochar and to activated biochars (Figure 3). High ratios (H/C ratio > 1.0) for lower PT suggest that these biochars could contain significant amounts of original organic residues, such as polymeric CH2 and fatty acid, lignin and some cellulose [42]. Steam activated samples had lowest H/C ratios due to higher PT, as lower H/C and O/C ratios are commonly observed for biochars produced under high temperatures and/or prolonged heating. When activated carbons are produced from wood, phosphoric acid activation facilitates carbon aromaticity at temperatures far lower than thermal treatment alone, and at temperatures above 300 °C there is less loss to burn off [29]. In general, H/C and O/C ratios in experimentally produced biochars decreased with PT [44,52,53,54]. O/C ratios were consistently higher for acid activated samples than base, lowest for steam and base samples, highest for biochars and acid activated biochars and decreased with PT for both feedstocks (Figure 3). O/C and particularly H/C ratios decreased upon steam activation and carbons became less polar and more aromatic, with total removal of oxygen functional groups particularly from wood. Particularly for 500 °C biochars, acid activation increased O/C ratio due to formation of oxygen rich surface functionalities. These results are corroborated with oxygen content from ultimate analysis likewise indicating presence or absence of oxygen surface groups (Table 3). Fixed carbon content (FC) from proximate analysis (Table 3), another indicator of aromaticity development, increased with PT and was highest for steam activated samples.
Figure 3. The Van Krevelen plot of elemental ratios for chars formed from wood chips and chicken litter and undergoing different activation protocols. Samples grouped by treatment (bc: biochar).
Agriculture 05 00806 g003
Feedstock type, PT and activation protocol had strong effects on the ability of samples to adsorb copper ions (Table 1), with activation being the most effective at increasing adsorption capacity (F = 504, p < 0.0001) followed by feedstock (F = 104, p < 0.0001). Wood biochars and their respective steam activated counterparts consistently adsorbed significantly less copper ions than chicken litter samples (Figure 4a–d, Table 2). Adsorption capacity for Cu2+ ions was highest (68.6 mg/g) for acid activated wood chips pyrolyzed at 250 °C and lowest for wood chip biochars. Because of their initial poor performance as biochars, improvements in adsorption capacity upon activation were more significant for wood chip samples. In contrast to wood biochars, chicken litter biochars had copper adsorption capacities 10 to 20 times higher and steam activated chicken litter chars also displayed significantly higher adsorption capacities than their wood chip counterparts, with adsorption capacities ranging from 39.5 to 51 mg/g for chicken litter carbons versus 12.2 to 17.7 mg/g for wood chip carbons. Similar findings were reported by [25] where biochar feedstock mineral composition (CO32−, PO43− groups) determined biochar sorption properties with dairy manure biochars being more effective than rice husk biochars in removing Pb2+, Cu2+, Zn2+, and Cd2+ ions, under same processing conditions. As mentioned before, 250 °C biochars were more effectively acid activated than 500 °C biochars, which translated into higher negative surface charge as well as higher adsorption capacities (Table 2) for each feedstock. At 250 °C, there were no significant differences between adsorption capacity for wood and chicken litter acid activated samples, however at 500 °C, wood was superior to chicken litter. Base activation for either feedstock type, proved to be an inadequate mode of activation insofar as copper ion adsorption. Regmi et al. [26] found copper adsorption efficiencies of 0.503 mmol/g with alkali (KOH) activated hydrothermal biochars. From the correlation analysis it was determined that negative surface charge was significantly correlated to adsorption capacity (F = 0.60, p = 0.025), however surface functionality as measured by surface charge was not sufficient to explain why chicken litter biochars and steam activated biochars emerged much superior to wood shavings in metal ion adsorption. For this feedstock, functionality could be related to phosphate containing groups as demonstrated by their elemental composition, as P content is approximately 30 times higher for chicken litter than wood chip carbons. Poultry manures also contain substantial amounts of protein, about 25% of dry matter [55] as well as significantly less cellulose and lignin than wood [56]. In opposition, arsenic adsorption was negligible for all samples and best performing were the base-activated samples (Table 5). Activated carbons with acidic and basic characteristics are generally recognized as having negative and positive surface charges respectively [57] which are hypothesized to provide selectivity to respectively attract cationic or anionic metal ions onto the carbon’s surface. The better performance for base-activated samples was likely due to overall surface positive charge (Table 5) and ability to attract negatively charged arsenic species, which in surface waters commonly exist as arsenite (AsO33−) and arsenate (AsO43−) [15]. Results herein reported confirm that the adsorption of heavy metals occurs through the electrostatic interactions between positive metal species and negative functional groups of the biochars and activated biochars. Besides surface charge, adsorption capacity was also well correlated with oxygen content (F = 0.58, p = 0.019), highly correlated to surface area (F = 0.78, p < 0.001) and inversely correlated with hydrogen content. The fact that there was no correlation between surface charge and surface area (F = 0.146, p = 0.62) further substantiates the complexity of the adsorption process as well as possible contribution of different surface functionalities depending on feedstock.
When comparing effectiveness of different activation protocols in copper ion adsorption, it is important to take into account the economic feasibility of each protocol and there are several literature reports on production costs for various adsorbent materials from different agriculture residues [58,59,60,61]. Dividing unit production or manufacturing cost by copper adsorption capacity per unit yields cost per unit of copper ion removed. Albeit the potential improvement in adsorption capacity per unit adsorbent, activation of biochars comes with associated additional production costs and mass loss. Furthermore, steam versus phosphoric acid activations represent different costs. While steam activation requires higher temperatures, and might result in lower yields, chemical activation requires more expensive activants. The disadvantage of chemical activation (e.g., phosphoric acid) is the additional cost of the activant, the post-activation treatment (washing to near-neutral), reclamation of the activant, and drying [59,61]. Deciding whether or not to activate and the choice of activation protocol is tied to feedstock type, improvement in adsorption capacity, and associated production cost and yield.

4. Conclusions

Three different activation protocols (acid, base and steam) significantly increased surface area for both pine wood and chicken litter biochars. Highest surface area was registered for acid activated wood chip biochar pyrolyzed at 250 °C (851 m2/g) followed by chicken litter pyrolyzed and activated under same conditions (789 m2/g). More importantly, activation of biochars was responsible for changes in various chemical properties, and particularly led to significant changes in surface functionality that resulted in increased copper ion adsorption. Highest adsorption capacity observed for acid activated wood shavings 250 °C biochars at 69 mg/g followed by 62 mg/g for acid activated chicken litter 250 °C biochars, demonstrating that acid impregnation was more effective for 250 °C biochars than 500 °C. Despite the positive results observed with copper ion adsorption, neither of the activation protocols was effective at generating significant amount of positive surface groups and therefore significantly improving arsenic adsorption. When looking at feedstock choice, chicken litter biochars and their steam activated counterparts were significantly superior to the pine wood shavings in copper ion adsorption, likely due to native phosphate group functionalities. With additional processing costs and mass loss associated with activation, biochars could represent a more inexpensive alternate solution for metal ion remediation, recognizing the possible advantage of chicken litter as a choice of feedstock.
Figure 4. (a) Copper ion adsorption isotherms for biochars made from chicken litter and wood chips at two different pyrolysis temperatures. Isotherms were generated by plotting adsorption at six different initial copper ion concentrations, from 0.01 ppm to 20 ppm. Isotherm data was fitted to the Langmuir model, represented by the solid line; (b) Copper ion adsorption isotherms for steam activated biochars made from chicken litter and wood chips at two different pyrolysis temperatures. Isotherms were generated by plotting adsorption at six different initial copper ion concentrations, from 0.01 ppm to 20 ppm. Isotherm data was fitted to the Langmuir model, represented by the solid line; (c) Copper ion adsorption isotherms for acid activated biochars made from chicken litter and wood chips at two different pyrolysis temperatures. Isotherms were generated by plotting adsorption at 6 different initial copper ion concentrations, from 0.01 ppm to 20 ppm. Isotherm data was fitted to the Langmuir model, represented by the solid line; (d) Copper ion adsorption isotherms for base activated biochars made from chicken litter and wood chips at two different pyrolysis temperatures. Isotherms were generated by plotting adsorption at six different initial copper ion concentrations, from 0.01 ppm to 20 ppm. Isotherm data was fitted to the Langmuir model, represented by the solid line.
Agriculture 05 00806 g004
Table 5. Arsenic adsorption efficiencies at 1mM buffered arsenic solutions, total positive surface charge and comparison with copper adsorption at 1mM.
Feedstock SourceSampleAs Adsorption %As Adsorption mg/gSC meq OH/gCu Adsorption %Cu Adsorption mg/g
WS 250 °CBC--0.0015.51.08
BC SA--0.0041.02.87
BC AA1.40.0010.0499.46.95
BC BA1.60.0020.176.60.34
WS 500 °CBC--0.0011.90.77
BC SA1.40.0010.1534.52.25
BC AA1.20.0010.2098.76.43
BC BA1.70.0020.4630.11.50
CL 250 °CBC0.60.0010.0067.83.68
BC SA1.30.0010.0098.25.32
BC AA1.00.0010.0098.77.56
BC BA4.80.0060.6582.95.18
CL 480 °CBC--0.0761.13.88
BC SA--0.0095.05.96
BC AA--0.0096.57.39
BC BA4.90.0060.5682.45.23

Acknowledgments

The authors would like to thank Renee Bigner for the various analyses and technical assistance in this study and Chris Hopkins for producing the chicken litter and wood chip biochar samples. Mention of trade names or commercial products in this publication is solely for the purpose of providing specific information and does not imply recommendation or endorsement by the U.S. Department of Agriculture. USDA is an equal opportunity provider and employer.

Author Contributions

Isabel M. Lima and Kyoung S. Ro conceived and designed the experiments; Isabel M. Lima analyzed the data; G. B. Reddy contributed materials; Debbie L. Boykin performed the statistical analysis; Isabel M. Lima wrote the paper; Kjell T. Klasson helped with overall data analysis and discussion.

Conflicts of Interest

The authors declare no conflict of interest.

References

  1. Hazrat, A.; Khan, E.; Saja, M.A. Phytoremediation of heavy metals—Concepts and applications. Chemosphere 2013, 91, 869–881. [Google Scholar]
  2. Wang, Y.; Björn, L.O. Heavy metal pollution in Guangdong Province, China, and the strategies to manage the situation. Front. Environ. Sci. 2014, 2, 1–12. [Google Scholar] [CrossRef]
  3. Vijayaraghavan, K.; Jegan, J.R.; Palanivelu, K.; Velan, M. Copper removal from aqueous solution by marine green alga Ulva reticulata. Electron. J. Biotechnol. 2004, 7, 61–71. [Google Scholar]
  4. USEPA. National Primary Drinking Water Regulations; US Environmental Protection Agency: Washington, DC, USA, 2011.
  5. Fu, F.; Wang, Q. Removal of heavy metal ions from wastewaters: A review. J. Environ. Manag. 2011, 92, 407–418. [Google Scholar] [CrossRef] [PubMed]
  6. Matovic, D. Biochar as a viable carbon sequestration option: Global and Canadian perspective. Energy 2011, 36, 2011–2016. [Google Scholar] [CrossRef]
  7. Spokas, K.A.; Cantrell, K.B.; Novak, J.M.; Archer, D.W.; Ippolito, J.A.; Collins, H.P.; Boateng, A.; Lima, I.M.; Lamb, M.C.; McAloon, A.J.; et al. Biochar: A synthesis of its agronomic impact beyond carbon sequestration. J. Environ. Qual. 2011, 41, 973–989. [Google Scholar] [CrossRef] [PubMed]
  8. Ladanai, S.; Vinterbäck, J. Global Potential of Sustainable Biomass for Energy; Swedish Agricultural University: Uppsala, Sweden, 2009. [Google Scholar]
  9. McKendry, P. Energy production from biomass (Part 1): Overview of biomass. Bioresour. Technol. 2002, 83, 37–46. [Google Scholar] [CrossRef]
  10. Spurr, S.H.; Vaux, H.J. Timber: Biological and economic potential. Science 1976, 191, 752–756. [Google Scholar] [CrossRef] [PubMed]
  11. Mohan, D.; Pittman, C.U.; Steele, P.H. Pyrolysis of wood/biomass for bio-oil: A critical review. Energy Fuels 2006, 20, 848–889. [Google Scholar] [CrossRef]
  12. USEPA. Poultry—Production and Value 2014 Summary; United States Department of Agriculture, National Agricultural Statistics Service: Washington, DC, USA, 2015.
  13. Collins, E.R., Jr.; Barker, J.C.; Carr, L.E.; Brodie, H.L.; Martin, J.H., Jr. Poultry Waste Management Handbook; Natural Resource, Agriculture, and Engineering Service: Ithaca, NY, USA, 1999. [Google Scholar]
  14. Qiu, Y.; Cheng, H.; Xu, C.; Sheng, G.D. Surface characteristics of crop-residue-derived black carbon and lead(II) adsorption. Water Res. 2008, 42, 567–574. [Google Scholar] [CrossRef] [PubMed]
  15. Mohan, D.; Pittman, C.U.; Bricka, M.; Smith, F.; Yancey, B.; Mohammad, J.; Steele, P.H.; Alexandre-Franco, M.F.; Gómez-Serrano, V.; Gong, H. Sorption of arsenic, cadmium, and lead by chars produced from fast pyrolysis of wood and bark during bio-oil production. J. Colloid Interface Sci. 2007, 310, 57–73. [Google Scholar] [CrossRef] [PubMed]
  16. Ahmedna, M.; Marshall, W.E.; Rao, R.M. Production of granular activated carbons from select agricultural by-products and evaluation of their physical, chemical and adsorption properties. Bioresour. Technol. 2000, 71, 113–123. [Google Scholar] [CrossRef]
  17. Zhang, T.; Walawender, W.P.; Fan, L.T.; Fan, M.; Daugaard, D.; Brown, R.C. Preparation of activated carbon from forest and agricultural residues through CO2 activation. Chem. Eng. J. 2004, 105, 53–59. [Google Scholar] [CrossRef]
  18. Zhang, K.; Cheung, W.H.; Valix, M. Roles of physical and chemical properties of activated carbon in the adsorption of lead ions. Chemosphere 2005, 60, 1129–1140. [Google Scholar] [CrossRef] [PubMed]
  19. Kim, S.; Agblevor, F.A. Pyrolysis characteristics and kinetics of chicken litter. Waste Manag. 2007, 27, 135–140. [Google Scholar] [CrossRef] [PubMed]
  20. Shinogi, Y.; Kanri, Y. Pyrolysis of plant, animal and human waste: Physical and chemical characterization of the pyrolytic products. Bioresour. Technol. 2003, 90, 241–247. [Google Scholar] [CrossRef]
  21. Qiu, G.; Guo, M. Quality of poultry litter-derived granular activated carbon. Bioresour. Technol. 2010, 101, 379–386. [Google Scholar] [CrossRef] [PubMed]
  22. Singh, K.; Risse, L.M.; Das, K.C.; Worley, J.; Thompson, S. Pyrolysis of poultry litter fractions for bio-char and bio-oil production. J. Agric. Sci. Appl. 2012, 1, 37–44. [Google Scholar]
  23. Lima, I.M.; Marshall, W.E. Utilization of turkey manure as granular activated carbon: Physical, chemical and adsorptive properties. Waste Manag. 2005, 25, 726–732. [Google Scholar] [CrossRef] [PubMed]
  24. Lima, I.M.; Marshall, W.E. Adsorption of selected environmentally important metals by poultry manure-based granular activated carbons. J. Chem. Technol. Biotechnol. 2005, 80, 1054–1061. [Google Scholar] [CrossRef]
  25. Xu, X.; Cao, X.; Zhao, L. Comparison of rice husk- and dairy manure-derived biochars for simultaneously removing heavy metals from aqueous solutions: Role of mineral components in biochars. Chemosphere 2013, 92, 955–961. [Google Scholar] [CrossRef] [PubMed]
  26. Regmi, P.; Moscoso, J.L.G.; Kumar, S.; Cao, X.; Mao, J.; Schafran, G. Removal of copper and cadmium from aqueous solutions using switchgrass biochars produced via hydrothermal caronization process. J. Environ. Manag. 2012, 109, 61–69. [Google Scholar] [CrossRef] [PubMed]
  27. Lima, I.M.; Boykin, D.L.; Klasson, K.T.; Uchimiya, M. Influence of post-treatment strategies on the properties of activated chars from broiler manure. Chemosphere 2014, 95, 96–104. [Google Scholar] [CrossRef] [PubMed]
  28. Boehm, H.P. Some aspects of the surface chemistry of carbon blacks and other carbons. Carbon 1994, 32, 759–769. [Google Scholar] [CrossRef]
  29. Jagtoyen, M.; Derbyshire, F. Some considerations of the origins of porosity in carbons from chemically activated wood. Carbon 1993, 31, 1185–1192. [Google Scholar] [CrossRef]
  30. Jahirul, M.I.; Rasul, M.G.; Chowdhury, A.A.; Ashwath, N. Biofuels production through biomass pyrolysis—A technological review. Energies 2012, 5, 4952–5001. [Google Scholar] [CrossRef]
  31. Sekiguchi, Y.; Shafizadeh, F. The effect of inorganic additives on the formation, composition, and combustion of cellulosic char. J. Appl. Polym. Sci. 1984, 29, 1267–1286. [Google Scholar] [CrossRef]
  32. Jensen, P.A.; Sander, B.; Dam-Johansen, K. Pretreatment of straw for power production by pyrolysis and char wash. Biomass Bioenergy 2001, 20, 431–446. [Google Scholar] [CrossRef]
  33. Fahmi, R.; Bridgwater, A.V.; Darvell, L.I.; Jones, J.M.; Yates, N.; Thain, S.; Donnison, I.S. The effect of alkali metals on combustion and pyrolysis of Lolium and Festuca grasses, switchgrass and willow. Fuel 2007, 86, 1560–1569. [Google Scholar] [CrossRef]
  34. Lima, I.M.; Boateng, A.A.; Klasson, K.T. Pyrolysis of broiler manure: char and product gas characterization. Ind. Eng. Chem. Res. 2009, 48, 1292–1297. [Google Scholar]
  35. Johns, M.M.; Marshall, W.E.; Toles, C.A. The effect of activation method on the properties of pecan shell-activated carbons. J. Chem. Technol. Biotechnol. 1999, 74, 1037–1044. [Google Scholar] [CrossRef]
  36. Klasson, K.T.; Uchimiya, M.; Lima, I.M. Characterization of narrow micropores in almond shell biochars by nitrogen, carbon dioxide, and hydrogen adsorption. Ind. Crop. Prod. 2015, 67, 33–40. [Google Scholar] [CrossRef]
  37. Raveendran, K.; Ganesh, A.; Khilar, K.C. Influence of mineral matter on biomass pyrolysis characteristics. Fuel 1995, 74, 1812–1822. [Google Scholar] [CrossRef]
  38. Tseng, R. Physical and chemical properties and adsorption type of activated carbon prepared from plum kernels by NaOH activation. J. Hazard. Mater. 2007, 147, 1020–1027. [Google Scholar] [CrossRef] [PubMed]
  39. Meszaros, E.; Jakab, E.; Varhegyi, G.; Bourke, J.; Manley-Harris, M.; Nunoura, T.; Antal, M.J. Do all carbonized charcoals have the same chemical structure? 1. Implications of thermogravimetry-mass spectrometry measurements. Ind. Eng. Chem. Res. 2007, 46, 5943–5953. [Google Scholar] [CrossRef]
  40. Liang, B.; Lehmann, J.; Solomon, D.; Kinyangi, J.; Grossman, J.; O’Neill, B.; Skjemstad, J.O.; Thies, J.; Luizao, F.J.; Petersen, J.; et al. Black carbon increases cation exchange capacity in soils. Soil Sci. Soc. Am. J. 2006, 70, 1719–1730. [Google Scholar] [CrossRef]
  41. Cheng, C.-H.; Lehmann, J.; Thies, J.E.; Burton, S.D.; Engelhard, M.H. Oxidation of black carbon by biotic and abiotic processes. Org. Geochem. 2006, 37, 1477–1488. [Google Scholar] [CrossRef]
  42. Chen, B.; Zhou, D.; Zhu, L. Transitional adsorption and partition of nonpolar and polar aromatic contaminants by biochars of pine needles with different pyrolytic temperatures. Environ. Sci. Technol. J. 2008, 42, 5137–5143. [Google Scholar] [CrossRef]
  43. Mukherjee, A.; Zimmerman, A.R.; Harris, W. Surface chemistry variations among a series of laboratory-produced biochars. Geoderma 2011, 163, 247–255. [Google Scholar] [CrossRef]
  44. Keiluweit, M.; Nico, P.S.; Johnson, M.G.; Kleber, M. Dynamic molecular structure of plant biomass-derived black carbon (biochar). Environ. Sci. Technol. 2010, 44, 1247–1253. [Google Scholar] [CrossRef] [PubMed]
  45. Klasson, K.T.; Wartelle, L.H.; Rodgers, J.E.; Lima, I.M. Copper (II) adsorption by activated carbons from pecan shells: Effect of oxygen level during activation. Ind. Crop. Prod. 2009, 30, 72–77. [Google Scholar] [CrossRef]
  46. Jaramillo, J.; Gómez-Serrano, V.; Alvarez, P.M. Enhanced adsorption of metal ions onto functionalized granular activated carbons prepared from cherry stones. J. Hazard. Mater. 2009, 161, 670–676. [Google Scholar] [CrossRef] [PubMed]
  47. Polo, M.S.; Utrilla, J.R. Adsorbent-adsorbate interactions in the adsorption of Cd (II) and Hg (II) on ozonized activated carbons. Environ. Sci. Technol. 2002, 36, 3850–3854. [Google Scholar] [CrossRef]
  48. Lehmann, J.; Joseph, S. Biochar for Environmental Management: Science and Technology; Earthscan: Sterling, VA, USA, 2012; pp. 53–63. [Google Scholar]
  49. Van Krevelen, D.W. Graphical-statistical method for the study of structure and reaction processes of coal. Fuel 1950, 29, 269–284. [Google Scholar]
  50. Schmidt, M.W.I.; Noack, A.G. Black carbon in soils and sediments: Analysis, distribution, implications, and current challenges. Glob. Biogeochem. Cycles 2000, 14, 777–793. [Google Scholar] [CrossRef]
  51. Yan, Q.; Toghiani, H.; Yu, F.; Cai, Z.; Zhang, J. Effects of pyrolysis conditions on yield of bio-chars from pine chips. Forest Prod. J. 2011, 61, 367–371. [Google Scholar] [CrossRef]
  52. Zieliňska, A.; Oleszczuk, P.; Charmas, B.; Skubiszewska-Zięba, J.; Pasieczna-Patkowska, S. Effect of sewage sludge properties on the biochar characteristic. J. Anal. Appl. Pyrolysis 2015, 112, 201–213. [Google Scholar] [CrossRef]
  53. Shindo, H. Elementary composition, humus composition, and decomposition in soil of charred grassland plants. Soil Sci. Plant Nutr. 1991, 37, 651–657. [Google Scholar] [CrossRef]
  54. Baldock, J.A.; Smernik, R.J. Chemical composition and bioavailability of thermally altered Pinus resinosa (red pine) wood. Org. Geochem. 2002, 33, 1093–1109. [Google Scholar] [CrossRef]
  55. Chen, S.; Liao, W.; Liu, C.; Wen, Z.; Kincaid, R.L.; Harison, J.H.; Elliott, D.C.; Brown, D.C.; Solana, A.E.; Stevens, D.J. Value-Added Chemicals from Animal Manure; Pacific Northwest National Laboratory: Richland, WA, USA, 2003. [Google Scholar]
  56. Das, K.C.; Garcia-Perez, M.; Bibens, B.; Melear, N. Slow pyrolysis of poultry litter and pine woody biomass: Impact of chars and bio-oils on microbial growth. J. Environ. Sci. Health A Tox. Hazard. Subst. Environ. Eng. 2008, 43, 714–724. [Google Scholar] [CrossRef] [PubMed]
  57. Linsen, B.G. The texture and surface chemistry of carbons. In Physical and Chemical Aspects of Adsorbents and Catalyst; Academic Press: London, UK, 1970. [Google Scholar]
  58. Chilton, N.; Marshall, W.E.; Rao, RM.; Bansode, R.R.; Losso, J.N. Activated carbon from pecan shell: Process description and economic analysis. Ind. Crop. Prod. 2003, 17, 209–217. [Google Scholar]
  59. Toles, C.A.; Marshall, W.E.; Johns, M.M.; Wartelle, L.H.; McAloon, A. Acid-activated carbons from almond shells: Physical, chemical and adsorptive properties and estimated cost of production. Bioresour. Technol. 2000, 71, 87–92. [Google Scholar] [CrossRef]
  60. Lima, I.M.; McAloon, A.; Boateng, A.A. Activated carbon from broiler litter: Process description and cost of production. Biomass Bioenergy 2008, 32, 568–572. [Google Scholar] [CrossRef]
  61. Toles, C.A.; Marshall, W.E.; Wartelle, L.H.; McAloon, A. Steam- or carbon dioxide-activated carbons from almond shells: Physical, chemical and adsorptive properties and estimated cost of production. Bioresour. Technol. 2000, 75, 197–203. [Google Scholar] [CrossRef]

