Article

Evaluation of Spring Wheat (20 Varieties) Adaptation to Soil Drought during Seedlings Growth Stage

1
The Franciszek Górski Institute of Plant Physiology, Polish Academy of Sciences, Niezapominajek 21, 30-239 Krakow, Poland
2
Department of Plant Physiology, Agricultural University, Podluzna 3, 30-239 Krakow, Poland
*
Author to whom correspondence should be addressed.
Agriculture 2014, 4(2), 96-112; https://doi.org/10.3390/agriculture4020096
Submission received: 22 January 2014 / Revised: 22 March 2014 / Accepted: 26 March 2014 / Published: 4 April 2014

Abstract

:
The effect of soil drought (10 days) on the growth of plants, the accumulation of water and leakage of electrolytes, gas exchange, the contents of chl a + b and carotenoids in leaves and photochemical activity of photosystem II was studied at the seedling stage by transient fluorescent analysis in 20 of the popular varieties of polish spring wheat. Drought caused a particularly strong reduction in vigor of growth of seedlings, net photosynthesis rate and triggered an increase in electrolyte leakage from the leaves. Certain varieties during the drought demonstrated relatively intense CO2 assimilation at low water loss through transpiration. The varieties tested were significantly different in terms of tolerance to drought of the processes of gas exchange and seedlings development. Photochemical processes in PSII showed high tolerance to drought and at the same time low differentiation among varieties. The results obtained suggested that tolerance of growth parameters to drought and CO2 assimilation at the seedling stage may alleviate consequent depression of final yield of the grain.

1. Introduction

Wheat is the most important cereal crop; it is common diet for more than one third of the world population and contributes more calories and proteins to the world diet than any other cereal crop [1]. Water deficit is the most severe stress and the main cause of significant losses in growth and productivity of crop plants [2,3]. Water deficit is particularly dangerous for spring cereals, which do not use winter reserves of water in the soil. Spring wheat has additionally particularly high water demands. This is caused by the poor development of root system, a shorter growing season, and the fact that these plants are sown in partially dried soil by the spring tillage. What is more, the initial growth of spring wheat is slow, which further increases their vulnerability to drought. This period of high sensitivity to drought occurs in the spring during the tillering phase and later during the shooting and heading stages.
Drought tolerance is not an easily quantifiable plant attribute, because it is a combination of complex physiological, morphological and molecular traits. Physiological traits affected by drought can be correlated with the rate of CO2 assimilation [4,5,6], PSII photochemical activity [7,8,9,10,11], leaf water potential (stomatal conductance, transpiration rate, relative water content—RWC) [11,12,13], plasma membrane integrity [14] and chlorophyll content [15].
The improvement of tolerance to drought has been a long-lasting principal goal of the majority of breeding programs as water deficit in certain stages of wheat growth commonly occurs in many wheat growing regions of the world [16]. In the studies on watering plants, increased emphasis is being placed on understanding reactions to drought, not only in species, but also their particular varieties [17]. Different varieties can display various requirements in terms of environmental conditions [18]. The plant varieties with lower water requirements and/or higher resistance to drought could be useful in the areas with limited access to water, and thus compensate the losses associated with reduced yields [19].
For some genotypes, the seedling response is apparently a good indicator of the plants’ reaction to drought stress later in their life cycle. The objective of this research was to verify more reliably some of the physiological traits used for screening the performance on a set of popular Polish wheat genotypes under restricted water conditions in the soil and to correlate the tolerance of seedlings of these varieties with the depression of final grain yield.

2. Results and Discussion

2.1. Results

2.1.1. Water Content and Electrolyte Leakage

The mean values obtained for all varieties tested indicate that soil drought in wheat seedlings resulted in only a low reduction in the water content in leaves (3.1%), and a higher decrease in RWC (20.3%), while simultaneously causing a significant increase in electrolyte leakage (EL) from the cells (38.8%) compared to control (Table 1).
Table 1. The mean, variation coefficient (CV), the maximum and minimum values of the mean and stress index (SI as percentage of control) of physiological parameters of seedlings and the final yield of grain wheat varieties at optimal soil moisture and after the drought stress. Values calculated on the basis of the means for 20 varieties (N = 20).
ParametersGrowth ConditionsMeanCVMinimumMaximumSI
Water Content and Electrolyte Leakage
water content (%)control86.51.283.688.0
drought83.81.780.786.096.9
RWC (%)control92.22.588.796.1
drought73.510.859.990.079.7
EL (%)control3.329.71.85.7
drought4.618.13.26.0138.8
Growth and Accumulation of Biomass
leaf area (cm2)control30.08.825.534.5
drought21.013.015.925.069.9
dry weight of seedling (mg)control92.211.173.5108.2
drought75.113.348.290.881.4
RGRa (m2 m−2 day−1) × 102control9.011.06.911.0
drought5.427.42.47.659.6
NAR (g m−2 day−1) × 10control31.711.225.438.8
drought28.416.019.437.989.6
Gas Exchange
PN (μmol CO2 m−2 s−1)control13.17.711.615.9
drought1.546.40.52.611.4
WUE (μmol CO2 × mmol H2O−1)control5.621.64.2
drought6.559.11.715.0115.5
Leaf Pigment Content
chlorophyll (a + b) (mg m−2)control415.511.3348.7507.2
drought367.010.2324.7469.588.3
carotenoids (mg m−2)control32.38.428.940.0
drought29.86.027.834.792.2
Photochemical Efficiency
ABS/CS (ru)control1946.63.61802.92085.9
drought1826.83.51698.71919.793.8
TRo/CS (ru)control1492.14.61374.41642.5
drought1391.14.11265.51472.393.2
ETo/CS (ru)control699.57.6597.3801.3
drought654.17.1562.3737.393.5
DIo/CS (ru)control454.53.4420.0481.0
drought435.74.3398.3471.295.9
RC/CS (ru)control675.27.0587.0773.6
drought626.65.9544.5686.792.8
Weight of Seeds
(g plant−1)control17.421.213.027.6
drought14.322.910.225.982.5
ru—relative units.
The diversity of the set of varieties tested in the conditions of optimal watering (control) depended on the analyzed trait/parameter of the plant. Differences in the water content in the leaves and RWC were at extremely low levels (coefficient of variation CV was respectively 1.2% and 2.5%), but the EL was significantly higher (CV ca. 30%). Application of drought stress caused a significant increase in differences between particular wheat varieties only with respect to RWC. When water content in the tissues is considered, the increase in the CV value at this growth conditions was low, and the reduction of the EL ratio was also observed, indicating disappearance of the differences between varieties.
Detailed statistical analysis revealed that under drought conditions, none of the varieties tested in this study, except for the cv. Bryza, were able to maintain RWC at the level of controls (Table 2). In contrast, the stability of cell membranes under stress, estimated on the basis of EL measurements, proved to be high for some varieties (“Jasna”, “Katoda”, “Parabola”, “Zadra” and “Żura”), as evidenced by the stress index value, which was close to 100%.
Table 2. Values of stress index (as percentage of control) water content, relative water content (RWC), electrolyte leakage (EL) and growth parameters of seedling (leaf area, dry weight of seedling, RGRa, NAR) of 20 wheat varieties after 10 days of drought stress.
VarietyWater ContentRWCELLeaf AreaDry Weight of SeedlingRGRaNAR
Banti95.0 *72.4 *130.6 *54.5 *75.5 *38.5 *92.6
Bombona95.8 *70.3 *248.0 *78.1 *91.865.0 *99.7
Bryza99.593.8198.9 *81.8 *78.7 *77.7 *77.2 *
Cytra98.587.9 *173.8 *73.5 *86.4 *66.8 *95.3
Hewilla98.789.3 *246.9 *67.6 *79.9 *64.5 *92.1
Jasna97.780.3 *105.082.4 *91.975.8 *98.3
Katoda96.681.9 *109.876.7 *85.4 *70.0 *92.1
Koksa98.380.9 *142.3 *74.4 *81.9 *67.9 *88.3 *
Korynta97.291.7 *228.4 *82.1 *80.3 *78.6 *80.3 *
Monsun96.2 *82.2 *142.5 *57.9 *65.6 *44.6 *68.3 *
Nawra93.3 *65.5 *118.6 *55.1 *74.9 *28.7 *86.3 *
Parabola95.9 *81.6 *107.867.1 *85.1 *60.1 *99.6
Radunia96.584.6 *138.6 *83.4 *89.780.7 *95.5
Raweta100.078.0 *135.5 *53.9 *77.4 *38.4 *95.0
Torka96.577.3 *124.2 *71.5 *83.1 *61.0 *90.7
Vinjet95.9 *69.2 *115.1 *72.8 *83.6 *54.2 *89.8 *
Waluta98.781.5 *132.8 *80.6 *83.1 *75.6 *85.3 *
Zadra96.979.2 *105.160.9 *72.1 *45.7 *79.1 *
Zebra95.3 *67.1 *156.9 *64.8 *84.3 *47.1 *97.8
Żura96.479.1 *104.765.7 *77.5 *52.7 *86.1 *
F1.979.6815.0613.1112.638.313.03
p0.0110.0000.0000.0000.0000.0000.000
The significance of differences in varieties was determined by the analysis of variance using the F-test and probability p. Asterisks indicate significant differences (p < 0.05) between control and drought treated plants according to F-test.

2.1.2. Growth and Accumulation of Biomass

Drought stress resulted in significantly lower growth vigor of seedlings (Table 1). Growth measured as leaf area and mass accumulation of whole plants were inhibited. The mean value of relative growth rate of leaf area (RGRa) decreased in the varieties tested during the period of stress by nearly 40%, while the intensity of net assimilation (NAR) by about 10%. Drought caused differences in the varieties tested in all parameters of growth measured. This effect was most pronounced for RGRa, for which the variation coefficient (CV) was more than 27%. None of the varieties were able to prevent the inhibition of the growth process of leaf area under drought conditions (Table 2). However, some of them retained the ability to intensively increase the weight of the seedlings (cv. “Bombona”, “Jasna” and “Radunia”) under stress and to maintain a high net assimilation rate (NAR), because the values of these parameters were similar to controls and did not differ statistically from them. The growth of leaves of cv. “Raweta” and “Banti” was particularly sensitive to drought. This is reflected in the low values of the SI index for RGRa, reaching about 38%. Relatively, net assimilation was inhibited by stress most significantly in varieties “Monsun” (SI = 68.3%) and “Zadra” (SI = 79.1%).

2.1.3. Gas Exchange and Leaf Pigment Content

The growth under drought conditions reduced the rate of photosynthesis (PN) in all varieties by an average of about 89%, the content of chl a + b by about 12% and carotenoid content of 8%, while WUE index was elevated by almost 16% (Table 1). In relation to the control, soil drought increased variation in varieties in terms of PN and WUE indices. The coefficient of variation of both parameters was the highest in drought from all the tested plant traits and amounted to more than 46% and 59%, respectively. In contrast, the differences between the varieties in terms of the content of chl a + b and carotenoids slightly narrowed down in drought conditions. None of the varieties tested could maintain PN at the control level after 10 days of drought (Table 3). Coefficient of water use efficiency was either increased or decreased under stress depending on the variety.

2.1.4. Photochemical Efficiency

Activity of photochemical processes in PSII was subject to slight inhibition in the absence of water in the soil (Table 1). The reduction of energy absorption by the antenna system, the energy flux transported to the center and outside the center of PSII, energy dissipation and the concentration of active reaction centers, did not exceed an average of 8% when compared to the well-watered plants. Diversification of varieties in terms of photochemical activity was also low. At both levels of water content in the soil, CV coefficient did not exceed 8% for the photochemical parameters (Table 3).

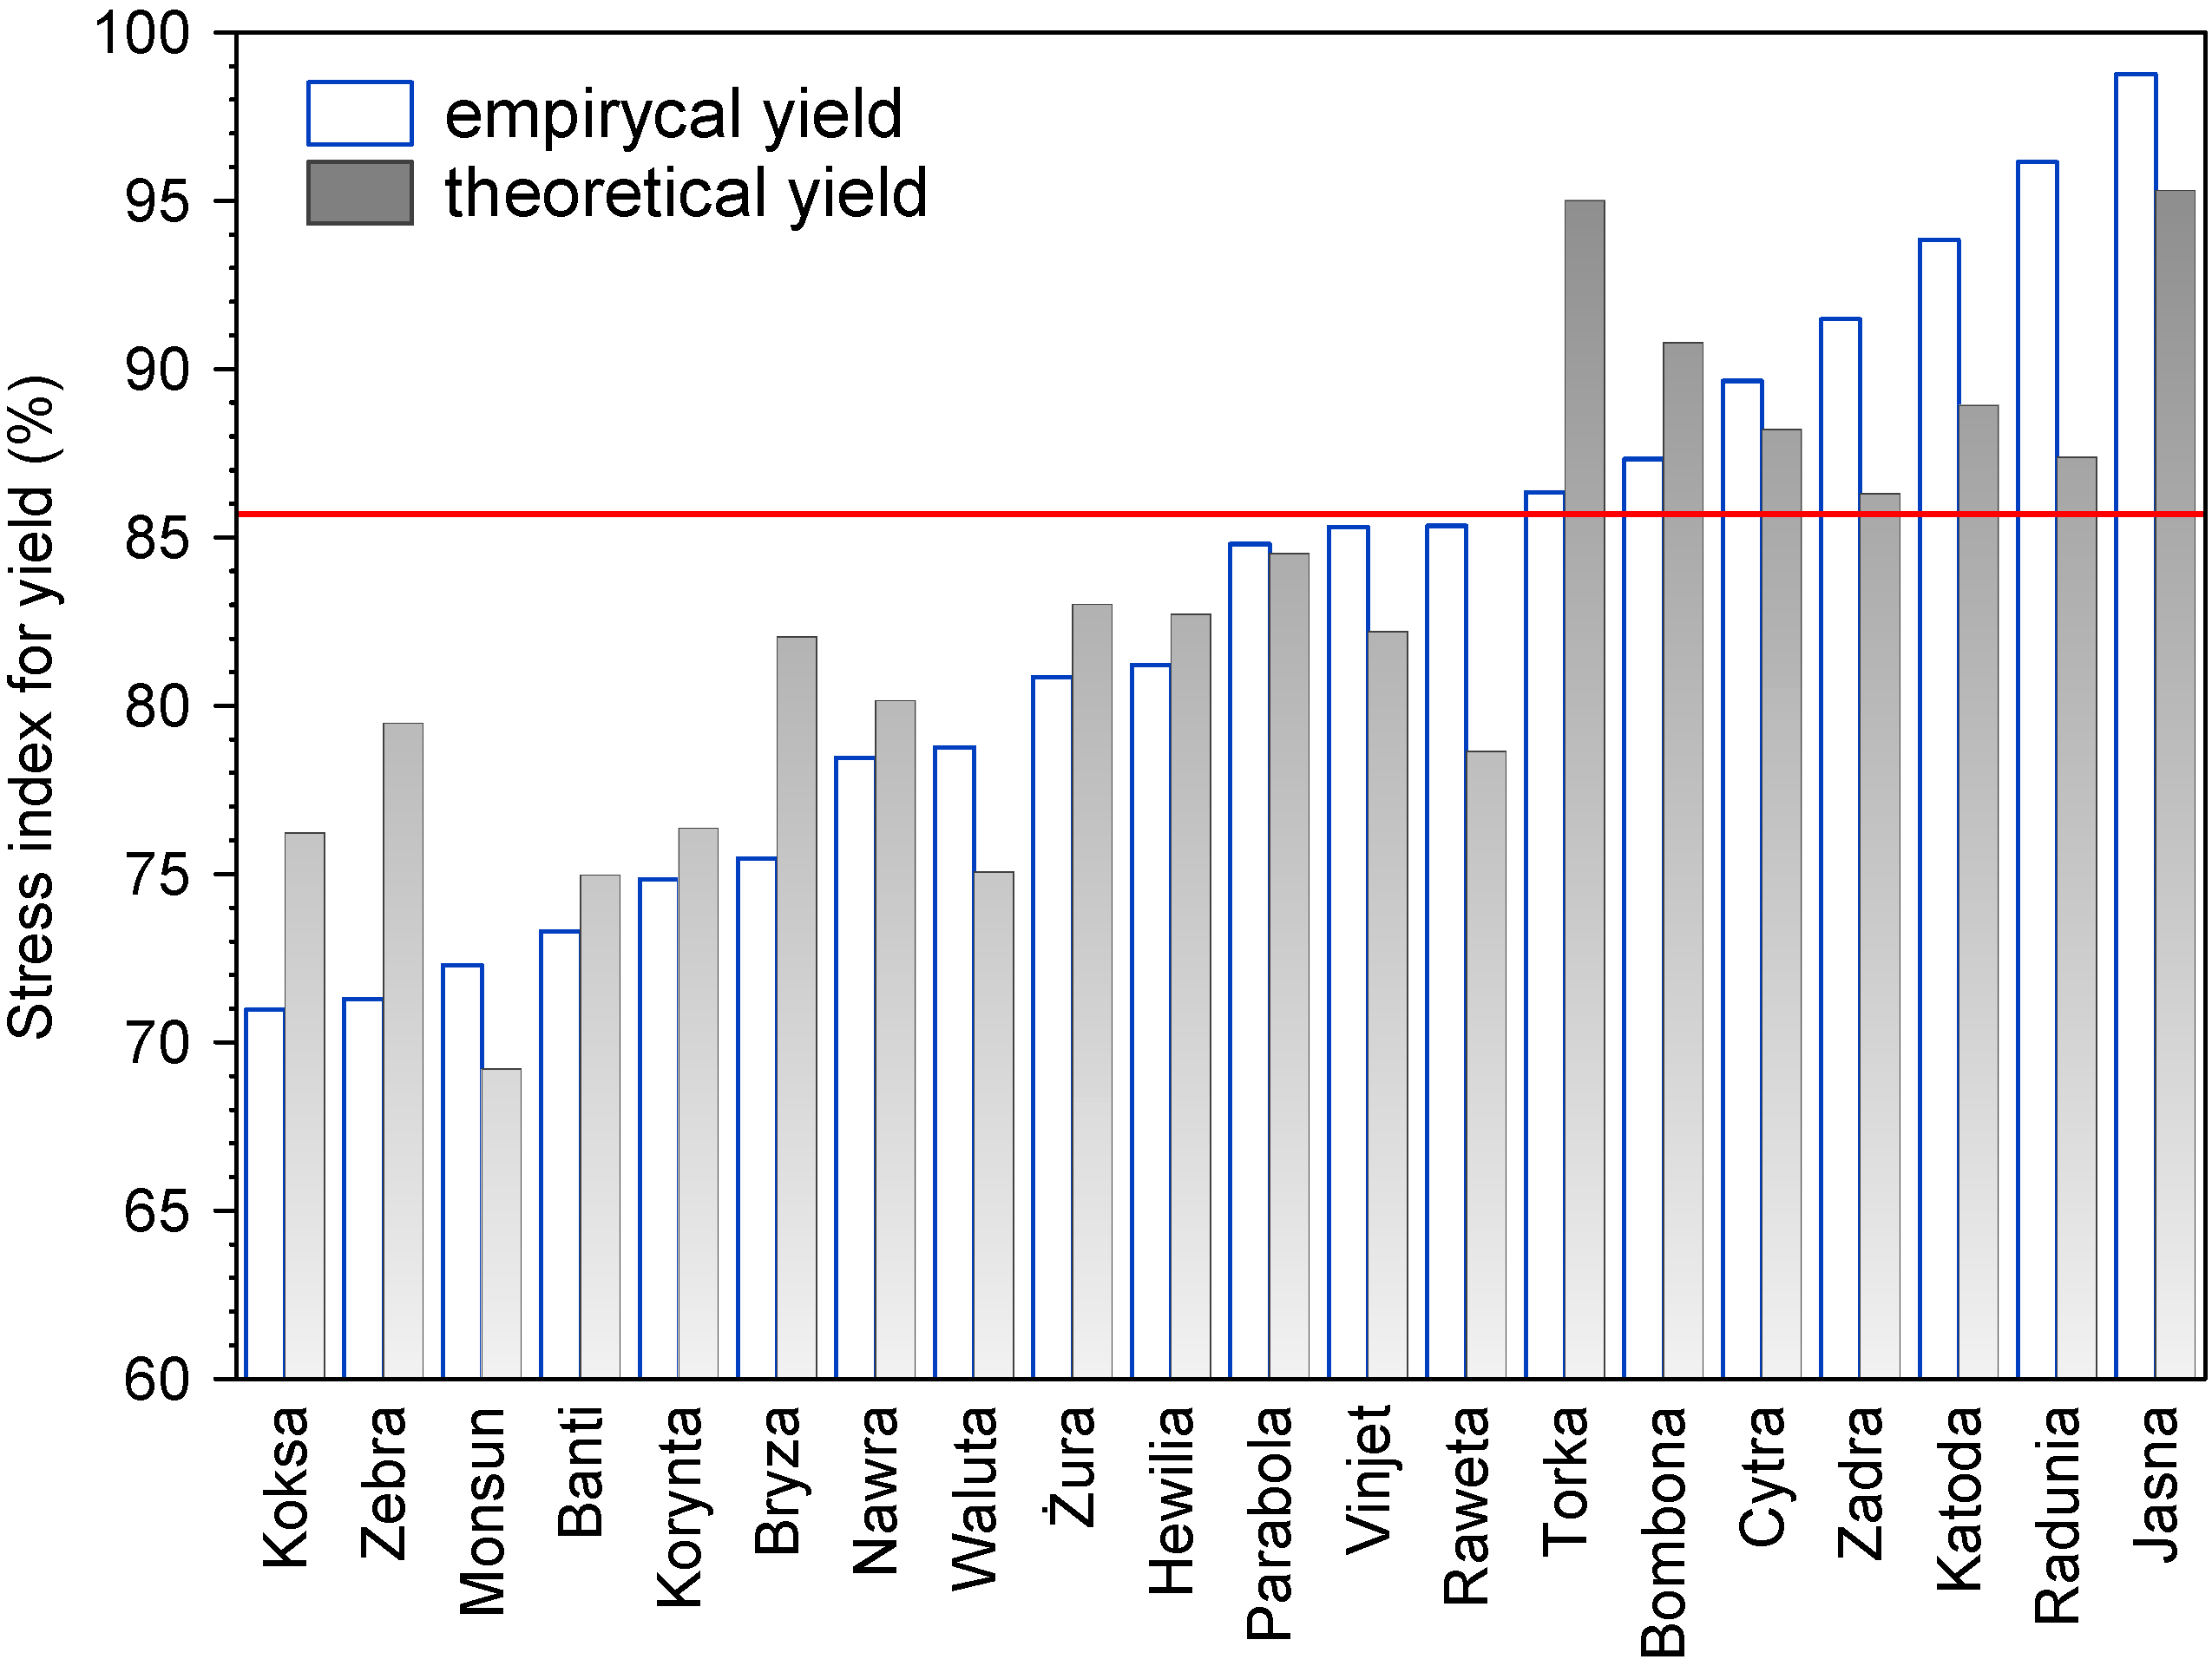
2.1.5. Consequent Effect on the Yield of Grain

Drought at the seedling stage caused a reduction in the final yield of wheat varieties by an average of 18% (Table 1). For most varieties, a decrease of grain yield was statistically significant compared to the properly watered controls (Table 3). The varieties “Jasna” and “Radunia” did not show a significant change in the yield compared to control, which indicated their tolerance to stress. Good tolerance to drought was demonstrated by “Zadra”, “Cytra”, “Bombona” and “Torka” varieties. The highest decrease in yield was recorded for “Koksa”, “Monsun” and “Zebra” varieties.
Table 3. Values of stress index of gas exchange, chlorophyll and carotenoids contents, parameters of photochemical efficiency (PSII) of seedling and final weight of seeds of 20 wheat varieties after 10 days of drought stress.
OdmianaPNWUEChl (a + b)CarotenoidsABS/CSTRo/CSETo/CSDIo/CSRC/CSWeight of Seeds
Banti13.3 *79.2 *77.3 *85.7 *93.9 *93.9 *94.993.7 *96.773.3 *
Bombona4.8 *54.8 *89.0 *93.694.8 *95.898.691.8 *95.487.3 *
Bryza15.8 *180.6 *92.095.393.7 *92.8 *91.0 *96.989.3 *75.5 *
Cytra11.7 *192.3 *97.398.397.896.192.0 *103.492.5 *89.7 *
Hewillia21.3 *121.3 *91.994.995.394.6 *97.997.392.7 *81.2 *
Jasna13.3 *76.4 *97.198.496.496.099.197.696.398.8
Katoda15.7 *266.9 *80.8 *88.3 *97.698.1101.695.7 *96.793.8 *
Koksa7.3 *260.4 *83.7 *89.5 *87.1 *84.8 *82.7 *95.283.1 *71.0 *
Korynta10.4 *85.8 *85.2 *90.9 *88.6 *86.3 *78.7 *96.383.2 *74.8 *
Monsun4.3 *48.7 *86.9 *91.292.7 *92.1 *92.894.5 *91.8 *72.3 *
Nawra6.3 *92.1 *93.786.8 *92.0 *92.0 *92.792.0 *92.2 *78.5 *
Parabola13.6 *124.6 *97.798.799.197.899.9103.497.884.8 *
Radunia12.5 *240.9 *89.3 *93.489.9 *88.0 *84.3 *96.2 *86.1 *96.2
Raweta11.5 *48.8 *93.295.698.698.8100.798.1102.685.3 *
Torka19.5 *118.1 *93.195.995.1 *94.8 *98.496.193.586.3 *
Vinjet4.5 *97.3 *88.8 *93.090.0 *90.4 *94.788.5 *92.4 *85.3 *
Waluta4.3 *35.5 *81.6*88.4 *93.2 *92.5 *92.195.6 *92.1 *78.8 *
Zadra19.5 *125.0 *79.8*87.1 *93.5 *93.0 *94.995.1 *91.0 *91.5 *
Zebra4.1 *512 *81.6*88.1 *91.9 *91.7 *94.192.5 *92.8 *71.3 *
Żura15.4 *79.6 *93.196.297.196.993.998.0102.280.9 *
F14.9113.621.941.852.943.073.184.783.5211.02
p0.0000.0000.0130.0190.0000.0000.0000.0000.0000.000
The significance of differences in varieties was determined by the analysis of variance using the F-test and probability p. Asterisks indicate significant differences (p < 0.05) between control and drought treated plants – according to F-test.

2.1.6. Correlation between Seedlings Tolerance, Final Yield and Drought

There was a relatively small number of statistically significant linear correlation coefficients between the relative tolerance to drought of plant traits studied (Table 4). SI index of the final yield of grains was rather poorly related and showed correlation only with the weight of seedlings and NAR. The weight of seedlings was correlated with the leaves area and RGRa. Since the correlation coefficients between the single traits of the seedlings and the final yield were low, multiple correlations were calculated, providing an opportunity to measure the collective impact of seedlings’ traits on yield (Table 5). Calculations carried out stepwise, revealed a steep increase of the determination coefficient (R2) when fourth trait was introduced to the regression equation. SI values of the yield calculated on the basis of this equation (theoretical yield) were compared with the respective data of the actual yield (Figure 1). The equation indicated seven most tolerant wheat varieties, which stayed in agreement with experimental observations. An analysis of discrimination carried out for the same data also confirmed the possibility of predicting the tolerance of wheat varieties to drought based on SI of selected traits of seedlings (Table 6).

2.2. Discussion

2.2.1. Water Management and Growth of Seedlings

Growth processes are generally very vulnerable to water deficit [10]. Keeping a high value of water content provides an opportunity not only to better protect physiological processes during drought, but also to improve recovery of plants after re-watering. Maintaining a high value of this parameter during drought provides an opportunity not only to better protect physiological processes, but also to improve recovery of plants after re-watering. In our work, variation observed in varieties with respect to RWC under stress, measured by the coefficient of variation, was about four-fold higher than the variation observed in well-watered plants (Table 1). It probably reflects considerable variation resources among varieties of wheat tested. The water shortage in the soil causes a reduction in the growth of leaf area by an average of 30%, and a reduction in the dry weight of seedlings by 19%, the restriction in RGRa and NAR. Under the adopted criterion, the majority of plant’s growth features were highly diversified between the varieties (Table 2).
Soil drought has caused a significant increase in electrolyte leakage from leaves, similarly as in the study by Bajji et al. [20]. Unfortunately, in our work, the drought pressure has contributed to the reduction of differences between varieties, which might indicate their inability to more effectively protect the membranes against dehydration.
Figure 1. The values of drought stress index for the final empirical grain yield and yield calculated based on multiple regression equation—theoretical yield (Table 4) for the 20 varieties of spring wheat. Horizontal line defines seven most tolerant varieties to drought in empirical and theoretical terms.
Agriculture 04 00096 g001
Table 4. Values of stress index of gas exchange, pigment contents, parameters of photochemical efficiency (PSII) of seedling and final weight of seeds after drought stress.
234567891011121314151617
10.701nsnsns0.489nsnsnsnsnsnsnsns0.471nsns
21.000ns0.476ns0.671ns0.475nsnsnsnsnsns0.631nsns
3 1.000nsnsnsnsnsnsnsnsnsnsnsnsnsns
4 1.0000.7050.958nsnsnsnsnsnsnsnsns−0454ns
5 1.0000.6270.783nsnsnsnsnsnsnsnsns0.546
6 1.000nsns0.444nsnsnsnsnsnsnsns
7 1.000nsnsnsnsnsnsnsnsns0.444
8 1.000nsnsnsnsnsns0.478nsns
9 1.000nsnsnsnsnsnsnsns
10 1.0000.8680.459nsns0.521nsns
11 1.0000.519nsns0.628nsns
12 1.0000.9750.8010.5980.839ns
13 1.0000.890ns0.902ns
14 1.000ns0.833ns
15 1.000nsns
16 1.000ns
Only statistically significant values (p < 0.05) are shown; ns, not significant (N = 20); 1–water content; 2–RWC; 3–EL; 4–leaf area; 5–dry weight of seedling; 6–RGRa; 7–NAR; 8–PN; 9–WUE; 10–chl (a + b); 11–carotenoid; 12–ABS/CS; 13–TRo/CS; 14–ETo/CS; 15–DIo/CS; 16–RC/CS; 17–weight of seeds.
Table 5. Results of stepwise multiple regression for SI indexes of the final yield of grains and seedlings parameters after drought stress (N = 20).
StepTraitR2FStandard Deviation
1dry weight of seedling0.5467.637.28
2photosynthesis (PN)0.6827.406.53
3leaf area0.6887.386.42
4NAR0.8137.335.54
Table 6. Summary of discriminatory function analysis and squares of Mahalanobis distance from the centroids for SI index of selected traits.
Wilkins’s lambdaPartial lambdaF Removalp
dry weight of seedling0.6860.43319.600.000
leaf area0.6020.49415.380.001
NAR0.6280.47416.670.001
photosynthesis (PN)0.6560.45418.070.001
F(4,15) = 8.86, p < 0.0007.

2.2.2. Gas Exchange

Reducing the intensity of net photosynthesis by drought nearly by 90% proved to be stronger than the NAR (Table 1). This is understandable, since the NAR index is the average of the initial and final (after 10 days of drought) state of plant’s growth and PN measurements recorded only consequences of stress at the end of the period. Some varieties of wheat (Table 3) had a relatively good ability to maintain high intensity of net assimilation and/or net photosynthesis (“Hewilla”, “Torka”, “Zadra”). It is known that soil drought occurring over several days can cause both stomatal and non-stomatal inhibition of photosynthesis. With a sudden decrease in water supply to plants, the stomata closed resulting in rapid reduction of water losses in the transpiration process and increased diffusion resistances to CO2 [21]. The process of photosynthesis is very sensitive to changes in water supply to leaves and responds quickly to water deficit [4,22]. This depends not only on the increase in the diffusion resistance towards CO2, but also on damaging the structures in the chloroplasts, mainly PSII [8]. As a result, the rate of CO2 assimilation decreases markedly during drought conditions. In C3 plants, closing of stomata is considered as the most important mechanism for protecting against dehydration of tissues, but at the same time it results in reduced CO2 assimilation. The rate of decrease of transpiration and PN in drought was not uniform in the varieties studied in this work. The effect of this phenomenon was both a reduction and an increase of the WUE value in some varieties under drought conditions. The diversity of wheat varieties in this regard has already been observed, but on a very limited number of varieties [13]. The ability to assimilate CO2 at relatively low transpiration losses was observed in this study in the varieties “Katoda”, “Koksa” and “Radunia”. High value of WUE is desirable because of the possibility of higher biomass accumulation without large losses of water compared to other varieties. Considering the high drought tolerance of photosynthetic electron transport process [23], the high intensity of the absorption of CO2 prevents the transfer of electrons to O2 molecules, which, in turn inhibits the formation of reactive oxygen species (ROS) [24]. Generation of ROS has adverse consequences, causing lethal damage to the tissues [25]. The reduction of chlorophyll and carotenoid pigments was rather low, which may be indicative of a moderate intensity of drought stress. On the other hand, chlorophyll content in the wheat leaves during drought is dependent on the type of N ions present in the nutrient solution [26]. An initial increase of the chlorophyll content during drought took place in the presence of NH4+, which was followed by a decrease in severity of the drought. By contrast in the presence of NO3−, the chlorophyll content in leaves decreased immediately at the initiation of the drought until the end of the experiment.

2.2.3. PSII Photochemical Activity and the Final Yield

The analysis of photochemical efficiency of PSII showed that the described changes in wheat are not very sensitive to moderate soil drought (Table 1). This observation is consistent with the opinions of other authors [27,28]. Our study confirmed a slight decrease in the absorption of energy by the antenna system and reduction of the size of energy streams reaching PSII photochemical reaction center and beyond the center. An undesirable effect of stress detected was also a low diversification of responses to drought of studied varieties. Therefore, it seems that the attempts to select wheat genotypes resistant to drought based on the analysis of photochemical activity are likely to be unsuccessful.
The inhibition of the rate of photosynthesis causes a drop in productivity and agricultural yield [29,30]. The rates of biomass growth do not increase to the level observed prior to the stress, which usually results in a reduced yield. After the stress is overcome, the resulting agricultural yield represents the balance between damage, regeneration and post-stress compensation [31]. In our work, due to the application of drought at the seedling stage, the final reduction in grain yield varied depending on the variety, because some of the genotypes were distinctly tolerant to this stress (Table 3).

2.2.4. The Relationship between Seedlings Traits under Drought and the Final Yield

The regression equation derived on the basis of an index value of stress demonstrated a correlation of some traits of seedlings and the final yield of grain (Table 5). Traits of seedlings were related to the tolerance of the trait of growth vigor (weight and size of seedling leaves) to drought and the intensity of assimilation throughout the whole period of drought (NAR) and its transient value at the end of the drought period (PN). Repeating the calculations with the discrimination analysis (Table 6), confirmed the accuracy of the selection of these traits of seedlings for predicting the tolerance of varieties. The presented value of Wilks’ lambda test statistics can range from 0 (perfect discrimination) to 1 (no discrimination), while the value of the partial statistics of Wilks’ lambda test is related to the individual contribution of the variable to the discriminatory power of resulting model. F and p removals are statistics related to the corresponding value of the partial lambda test. A good illustration of the use of data to predict the tolerance is squared values of Mahalanobis distances from the centroids (Table 7).
The greater the distance, the farther apart the respective groups of varieties (tolerant/sensitive), resulting in higher power of the model applied. Data obtained in this work indicate a relatively high probability of correct classification of varieties to the appropriate group of sensitivity to drought stress.
Measurements carried out in this experiment revealed differences of wheat varieties studied in terms of consequent effect of soil drought at seedling stage on the final grain yield. Tolerant to stress in this regard were varieties “Jasna” and “Radunia”, as well as “Zadra”, “Cytra”, “Bombona” and “Torka”. Drought caused a particularly strong reduction in the growth vigor of the seedlings, net photosynthesis rate and caused an increase in the leakage of electrolytes from the leaves. Varieties tested were highly variable in terms of the stress response of processes of gas exchange and growth of seedlings, which may indicate potential variation resources to drought. Photochemical processes in PSII showed high tolerance to drought and simultaneously low variation between varieties.
Table 7. Squares of Mahalanobis distance from centroids.
Variety *Sensitivity to Stressp = 0.65
Sensitive
p = 0.35
Tolerant
KoksaSensitive1481512
ZebraSensitive2861255
MonsunSensitive8832752
BantiSensitive5472492
KoryntaSensitive3711532
BryzaSensitive618763
NawraSensitive492980
WalutaSensitive3601745
ŻuraSensitive205460
HewillaSensitive5041234
ParabolaSensitive293683
VinjetSensitive343519
RawetaSensitive3141583
TorkaTolerant2026295
BombonaTolerant1458360
CytraTolerant596068
ZadraTolerant1065570
KatodaTolerant702061
RaduniaTolerant607277
JasnaTolerant1921205
* variations ordered by increasing stress index value calculated for grain yield.

3. Experimental Section

3.1. Plant Material

The study was performed on 20 varieties of spring wheat (Triticum aestivum). Seeds were obtained from following Polish breeding companies: DANKO Plant Breeders Ltd. (cv. “Bombona”, “Katoda” “Vinjett”, “Waluta”, “Zebra”), Strzelce Plant Breeders Ltd. (cv. “Cytra”, “Koksa”, “Korynta”, “Nawra”, “Torka”, “Zadra”), Nasiona Kobierzyc Crop Breeding Station Ltd. (cv. “Banti”, “Hewilla”, “Jasna”, “Parabola”, “Radunia”, “Żura”), Institute for Plant Breeding Radzików (cv. “Raweta”) and Lochow Petkus Bergen (cv. “Bryza”, “Monsun”). In our experiment, we have used the most popular varieties currently grown in Poland.

3.2. Plant Growth Condition

Plants were grown in a growth chamber in nine dm3 pots (six pots per genotype with 12 plants each) filled with mixture of sieved soil and sand (1:1, v/v) [32]. Vegetation was held at a 15 h photoperiod, an irradiance of 400 μmol (photon) m−2 s−1, temperature of 20/17 °C (day/night) and in 50% air humidity. Plants were watered and fertilized with Hoagland nutrient solution as required [33]. Up to the third leaf stage (18 days after emerging), soil water content was kept at 75% maximum water capacity (MWC) by adding an appropriate amount of water each day. The drought treatment started by discontinuing the watering of plant, and reaching 30% of MWC (four days). This level of soil humidity was maintained during next 10 days. After this time, symptoms of visual drought as turgor loss of leaves became apparent. At this time, the control plants were grown at 75% of MWC.
Physiological measurements were performed (a) after reaching 30% of MWC (only the leaves’ area and seedlings’ mass associated with the RGRa and NAR measurements at time t1); and (b) after 10 days of drought stress (all other measurements at time t2).

3.3. Plant Measurements

For every variety, the measurements were taken on plants subjected to drought and control plants. According to Bouslama and Schapaugh [34], stress index (SI) was calculated for some of the parameters measured where:
SI (%) = (X2/X1) × 100%
and X2 and X1 represent the mean values of the parameters measured under drought stress and control.

3.3.1. The Rates of Growth and Accumulation of Biomass

The analysis of growth included measurements of mass (seedlings and leaves) and area of leaves. The following different growth indices were used: relative growth rate—area (RGRa) and net assimilation rate (NAR). The surface of leaves was measured using a ScanMaker3880 (Microtek, Hsinchu, Taiwan), and Delta-T Skan 2.03 software (Delta-T Devices, Cambridge, UK). The plant material was dried for 48 h at 65 °C. The following formulas were used [35]:
RGRa = (lnA2−lnA1)/10
NAR = [(W2−W1)/(t2−t1)] × [(A2α−1 – A1α−1)/(A2α−A1α)] × [α/(α−1)]
where
10—number of days of drought (30% MWC)
W—dry mass of plant, W1; W2 at the time t1 and t2, respectively
α = RGRw/RGRa
RGRw = (lnW2−lnW1)/(t2−t1)
A—leaves area, A1; A2 at the time t1 and t2, respectively.
The measurements were taken in 12 replicates.

3.3.2. The Integrity of Plasma Membrane and Water Balance

Plasma membrane integrity was determined by means of an electrolyte leakage (EL) test [36,37]. For each genotype, 12 segments (three per leaf) 1 cm in length were cut from the third leaf. Samples were washed in deionized water and immersed in 5 cm3 of deionized water. After 24 h (EL1) of shaking at room temperature, samples were frozen at −40 °C for 24 h, then heated and shaken again (24 h, room temperature, EL2). EL was calculated as follows:
EL = (EL1/EL2) × 100%
Measurements of electrical conductance were performed by means of a microcomputer conductivity meter CC-317 (Elmetron, Warsaw, Poland) with a platinum electrode at a frequency of 3 kHz.
The water balance in seedlings was determined by measuring the water contents of all leaves and the relative water content (RWC) on the third leaves. RWC was determined according to Barrs [38]:
RWC = [(FW−DW)/(TW−DW)] × 100%
Where FW is fresh weight, DW is dry weight and TW is turgid weight. To measure TW, leaves were placed in darkness for 24 h in vials containing water, which permitted complete rehydration. All these measurements were performed in 12 replicates (plants).

3.3.3. Gas Exchange

Net photosynthetic (PN) and transpiration (E) rates were measured using an infrared gas analyser (Ciras-1, PP Systems, Hitchin, UK) with a Parkinson leaf chamber (PLC6, PP Systems, Hitchin, UK). The flow rate of air with constant CO2 concentration (400 μmol (CO2) mol−1 (air)) through the assimilation chamber was 350–400 cm3 min−1. The measurements were made in the middle part of the second leaf at 22 °C (the leaf temperature), where irradiance was equal to 500 μmol (quanta) m−2 s−1 and RH equal to 30%. The measurements were performed in 12 replicates. WUE was calculated as (PN/E).

3.3.4. Photochemical Efficiency

Photochemical efficiency was measured in the middle part of the second leaf by a Plant Efficiency Analyzer PEA (Hansatech, Kings Lynn, UK). Before measurements, the LED-light source of the fluorimeter was calibrated using an SQS light meter (Hansatech Ltd, Kings Lynn, UK). The excitation irradiance had an intensity of 3000 μmol (quanta) m−2 s−1 (peak at 650 nm). Measurements were taken after 30 min of leaves adaptation to darkness. Changes in fluorescence were registered during irradiation between 10 μs and 1 s. During the initial 2 ms, data were collected every 10 μs with 12 bit resolution. After this period, the frequency of measurements was reduced automatically. The following equations were used for the quantification of PSII [39]:
(a)
The energy fluxes (per active cross section of leaf, CS) for absorption, ABS (ABS/CS), trapping (TRo/CS), electron transport (ETo/CS) and dissipation (DIo/CS):
In this work, we used the proportionality ABS/CS ≈ Fm,
TRo/CS = φPo × (ABS/CS)
ETo/CS = φPo × ψo × (ABS/CS)
DIo/CS = ABS/CS−TRo/CS
where:
φPo = 1−(Fo/Fm)
ψo = 1−VJ
Fo is the fluorescence intensity at 50 μs, Fm is the maximum fluorescence intensity,
VJ = (F2ms−Fo)/(Fm−Fo)
F2ms is the fluorescence intensity at 2 ms.
(b)
The amount of active PSII reaction centers per CS (RC/CS):
RC/CS = ABS/CS × φPo × (VJ/Mo)
where:
Mo = 4 × (F300μs−Fo)/(Fm−Fo)
F300μs is the fluorescence intensity at 300 μs.
The measurements were performed in 20 replicates.

3.3.5. Leaf Pigment Content

For the extraction of chlorophyll and carotenoids, 0.25 g of the second leaf was homogenized with 80% (v/v) acetone then crude extract was centrifuged at 3000 g for 5 min, at 4 °C. The absorbance of supernatant was measured spectrophotometrically at 450, 645 and 663 nm. The formulas of Arnon [40] and Jaspars [41] were used to calculate chlorophyll and carotenoids levels, respectively. The measurements were performed in 12 replicates on the second leaf.

4. Conclusions

Drought caused a particularly strong reduction in vigor of growth of seedlings, net photosynthesis rate and triggered an increase in electrolyte leakage from the leaves. In some varieties, drought induced ability to assimilate CO2 at a relatively low loss of water through transpiration.
Varieties tested showed high variations in terms of the stress response of processes of gas exchange and growth of seedlings, which may indicate the existence of potential variability resources to drought. Photochemical processes in PSII showed high tolerance to drought and at the same time low differentiation among varieties.
The results obtained suggest that tolerance of seedlings to drought with respect to certain growth parameters and CO2 assimilation may alleviate subsequent depression of the final yield of grains.

Acknowledgments

This research was supported by the program of COST ACTION project (Acronym TRITIGEN) N0 192/N-COST/2008/0.

Author Contributions

Jolanta Biesaga-Kościelniak, Agnieszka Ostrowska, Maria Filek and Janusz Kościelniak designed the research; Jolanta Biesaga-Kościelniak, Agnieszka Ostrowska, Maria Filek, Michał Dziurka, Piotr Waligórski, Magdalena Mirek and Janusz Kościelniak conducted the research; Jolanta Biesaga-Kościelniak, Agnieszka Ostrowska and Michał Dziurka analyzed the data; Jolanta Biesaga-Kościelniak, Agnieszka Ostrowska and Janusz Kościelniak wrote the paper; Jolanta Biesaga-Kościelniak has primary responsibility for the final content. All authors have read and approved the final manuscript.

Conflicts of Interest

The authors declare no conflict of interest.

References

  1. Morgan, J.M. Growth and yield of wheat lines with differing osmoregulative capacity at high soil water deficit in seasons of varying evaporative demand. Field Crops Res. 1995, 40, 143–152. [Google Scholar] [CrossRef]
  2. Hasegawa, M.; Bressan, R.; Pardo, J.M. The dawn of plant salt tolerance genetics. Trends Plant Sci. 2000, 5, 317–319. [Google Scholar] [CrossRef]
  3. Moussa, H.R.; Abdel-Aziz, S.M. Comparative response of drought tolerant and drought sensitive maize genotypes to water stress. Aust. J. Crop Sci. 2008, 1, 31–36. [Google Scholar]
  4. Lawlor, D.W.; Cornic, G. Photosynthetic carbon assimilation and associated metabolism in relation to water deficits in higher plants. Plant Cell Environ. 2002, 25, 275–294. [Google Scholar] [CrossRef]
  5. Guo, P.; Baum, M.; Varshney, R.K.; Graner, A.; Grando, S.; Ceccarelli, S. QTLs for chlorophyll and chlorophyll fluorescence parameters in barley under post-flowering drought. Euphytica 2008, 163, 203–214. [Google Scholar] [CrossRef]
  6. Robredo, A.; Pérez-López, U.; Sainz de la Maza, H.; González-Moro, B.; Lacuesta, M.; Mena-Petite, A.; Muñoz-Rueda, A. Elevated CO2 alleviates the impact of drought on barley improving water status by lowering stomatal conductance and delaying its effect on photosynthesis. Environ. Exp. Bot. 2007, 59, 252–263. [Google Scholar]
  7. Araus, J.L.; Amaro, T.; Voltas, J.; Nakkoul, H.; Nachit, M.M. Chlorophyll fluorescence as a selection criterion for grain yield in durum wheat under Mediterranean conditions. Field Crop Res. 1998, 55, 209–223. [Google Scholar] [CrossRef]
  8. Lu, C.; Zhang, J. Effects of water stress on photosystem II photochemistry and its thermostability in wheat plants. J. Exp. Bot. 1999, 50, 1199–1206. [Google Scholar] [CrossRef]
  9. Kocheva, K.V.; Busheva, M.C.; Georgiev, G.I.; Lambrev, P.H.; Goldsev, V.N. Influence of short-term osmotic stress on the photosynthetic activity of barley seedlings. Biol. Plant. 2005, 49, 145–148. [Google Scholar] [CrossRef]
  10. Oukarroum, A.; El Madidi, S.; Schansker, G.; Strasser, R.J. Probing the responses of barley cultivars (Hordeum vulgare L.) by chlorophyll a fluorescence OLKJIP under drought stress and re-watering. Environ. Exp. Bot. 2007, 60, 438–446. [Google Scholar] [CrossRef]
  11. Jedmowski, C.; Ashoub, A.; Brüggemann, W. Reactions of Egyptian landraces of Hordeum vulgare and Sorghum bicolor to drought stress, evaluated by the OJIP fluorescence transient analysis. Acta Physiol. Plant. 2013, 35, 345–354. [Google Scholar] [CrossRef]
  12. Chen, G.; Sagi, M.; Weining, S.; Krugman, T.; Fahima, T.; Korol, A.B.; Nevo, E. Wild barley eibi1 mutation identifies a gene essential for leaf water conservation. Planta 2004, 219, 684–693. [Google Scholar]
  13. Bencze, S.; Bamberger, Z.; Janda, T.; Balla, K.; Bedő, Z.; Veisz, O. Drought tolerance in cereals in terms of water retention, photosynthesis and antioxidant enzyme activities. Cent. Eur. J. Biol. 2011, 6, 376–387. [Google Scholar] [CrossRef]
  14. Babu, R.C.; Zhang, J.; Blum, A.; Ho, T.-H.; Wu, R.; Nguyen, H.T. HVA1, a LEA gene from barley confers dehydration tolerance in transgenic rice (Oryza sativa L.) via cell membrane protection. Plant Sci. 2004, 166, 855–862. [Google Scholar] [CrossRef]
  15. Geravandia, M.; Farshadfara, E.; Kahrizia, D. Evaluation of some physiological traits as indicators of drought tolerance in bread wheat genotypes. Russ. J. Plant Physiol. 2011, 58, 69–75. [Google Scholar] [CrossRef]
  16. Shao, H.B.; Liang, Z.S.; Shao, M.A. Changes of anti-oxidative enzymes and MDA content under soil water deficits among 10 wheat (Triticum aestivum L) genotypes at maturation stage. Coll. Surf. B Biointerfaces 2005, 45, 7–13. [Google Scholar] [CrossRef]
  17. Huseynova, I.; Rustanamova, S.M. Screening for drought stress tolerance in wheat genotypes using molecular markers. Proc. ANAS Biol. Sci. 2010, 65, 132–139. [Google Scholar]
  18. Pantuwan, G.; Fukai, S.; Cooper, M.; Rajatasereekul, S.; O’Toole, J.C. Yield response of rice (Oryza sativa L) genotypes to drought under rained lowlands. II. Selection of drought resistant genotypes. Field Crop Res. 2002, 73, 169–180. [Google Scholar] [CrossRef]
  19. Passioura, J. The drought environment physical, biological and agricultural perspectives. J. Exp. Bot. 2007, 5, 113–117. [Google Scholar]
  20. Bajji, M.; Kinet, J.M.; Lutts, S. The use of the electrolyte leakage method for assessing cell membrane stability as a water stress tolerance test in durum wheat. Plant Growth Regul. 2002, 36, 61–70. [Google Scholar] [CrossRef]
  21. Robredo, A.; Pérez-López, U.; Lacuesta, M.; Mena-Petite, A.; Muñoz-Rueda, A. Influence of water stress on photosynthetic characteristics in barley plants under ambient and elevated CO2 concentrations. Biol. Plant. 2010, 54, 285–292. [Google Scholar] [CrossRef]
  22. Lawson, T.; Oxborough, K.; Morison, J.I.L.; Baker, N.R. The responses of guard and mesophyll cell photosynthesis to CO2, O2, light and water stress in a range of species are similar. J. Exp. Bot. 2003, 54, 1743–1752. [Google Scholar] [CrossRef]
  23. Lu, C.M.; Zhang, J.H. Effect of water stress on photosynthesis, chlorophyll fluorescence and photoinhibition in wheat plants. Aust. J. Plant Physiol. 1998, 25, 883–892. [Google Scholar] [CrossRef]
  24. Acar, O.; Türkan, I.; Özdemir, F. Superoxide dismutase and peroxidase activities in drought sensitive and resistant barley. Acta Physiol Plant. 2001, 23, 351–356. [Google Scholar] [CrossRef]
  25. Farrat, J.M.; Bailly, C.; Leymarie, J.; Hamman, B.; Come, D.; Corbineau, F. Wheat seedlings as a model to understand the desiccation tolerance and sensitivity. Physiol Plant. 2004, 120, 563–574. [Google Scholar] [CrossRef]
  26. Mihailović, N.; Jelić, G.; Filipović, R.; Durdević, M.; Dżeletović, Ż. Effect of nitrogen form on maize response to drought stress. Plant Soil 1992, 144, 191–197. [Google Scholar] [CrossRef]
  27. Cornic, G.; Briantais, J.M. Partioning of photosynthetic electron flow between CO2 and O2 reduction in a C3 leaf (Phaseolus vulgaris L) at different CO2 concentrations during drought stress. Planta 1991, 183, 178–184. [Google Scholar]
  28. Liang, J.; Zhang, J.; Wong, M. Can stomatal closure caused by xylem ABA explain the inhibition of leaf photosynthesis under soil drying? Photosynth. Res. 1997, 51, 149–159. [Google Scholar] [CrossRef]
  29. Berkowitz, G.A.; Gibbs, M. Reduced osmotic potential effects on photosynthesis Identification of stromal acidification as a mediating factor. Plant Physiol. 1983, 71, 905–911. [Google Scholar] [CrossRef]
  30. Condon, A.G.; Richards, R.A.; Rebetzke, G.J.; Farquhar, G.D. Improving intrinsic water-use efficiency and crop yield. Crop Sci. 2002, 42, 122–131. [Google Scholar] [CrossRef]
  31. Quarrie, S.A.; Stojanovic, J.; Pekic, S. Improving drought tolerant in small-grained cereals, a case study, progress and prospects. Plant Growth Regul. 1999, 29, 1–21. [Google Scholar] [CrossRef]
  32. Ekoziem. Available online: http://www.ekoziem.com.pl/?ziemia-uniwersalna,19 (accessed on 2 April 2014).
  33. Hoagland, D.R.; Arnon, D.I. The water-culture method for plants without soil. Univ. Calif. Agric. Exp. Sta. Circ. 1938, 347, 29–32. [Google Scholar]
  34. Bouslama, M.; Schapaugh, W.T., Jr. Stress tolerance in soybeans. I. Evaluation of three screening techniques for heat and drought tolerance. Crop Sci. 1984, 24, 933–937. [Google Scholar] [CrossRef]
  35. Květ, J.; Ondok, J.P.; Nečas, J.; Jarvis, P.G. Methods of Growth Analysis. In Plant. Photosynthetic Production Manual of Methods; Šesták, Z., Čatský, Z., Jarvis, P.G., Eds.; Springer: Hague, The Netherlands, 1971; pp. 343–391. [Google Scholar]
  36. Markowski, A.; Skrudlik, G. Electrolyte leakage, ATP content in leaves and intensity of net photosynthesis in maize seedlings at permanent of different daily exposure to low. J. Agron. Crop Sci. 1995, 175, 109–117. [Google Scholar] [CrossRef]
  37. Songstad, D.D.; Duncan, D.R.; Widholm, J.M. Proline and polyamine involvement in chilling tolerance of maize suspension cultures. J. Exp. Bot. 1990, 41, 289–294. [Google Scholar] [CrossRef]
  38. Barrs, H.D. Determination of Water Deficits in Plant Tissues. In Water Deficits and Plant Growth; Kozlowski, T.T., Ed.; Academic Press: New York, NY, USA, 1968; pp. 236–259. [Google Scholar]
  39. Strasser, R.J.; Tsimilli-Michael, M. Stress in plants, from daily rhythm to global changes, detected and quantified by the JIP-test. Chem. Nouv. 2001, 75, 3321–3326. [Google Scholar]
  40. Arnon, D.I. Copper enzymes in isolated chloroplasts Polyphenol oxidase in Beta vulgaris. Plant Physiol. 1949, 24, 1–15. [Google Scholar] [CrossRef]
  41. Jaspars, E.M.J. Pigmentation of tobacco crown-gall tissues cultured in vitro in dependence of the composition of the medium. Physiol. Plant. 1965, 18, 933–940. [Google Scholar] [CrossRef]

