Article

Salinity-Induced Changes of Multiparametric Fluorescence Indices of Tomato Leaves

Institute of Crop Science and Resource Conservation—Horticultural Science, University of Bonn, Auf dem Hügel 6, 53121 Bonn, Germany
*
Author to whom correspondence should be addressed.
Agriculture 2014, 4(2), 132-146; https://doi.org/10.3390/agriculture4020132
Submission received: 11 January 2014 / Revised: 22 April 2014 / Accepted: 22 April 2014 / Published: 30 April 2014

Abstract

:
The aim of our study was to identify appropriate multiparametric fluorescence ratios to evaluate the response of tomato (Solanum lycopersicum) genotypes to salinity. In this context, we hypothesized that the fluorescence indices BFRR_UV, FLAV, NBI and SFR provided by the multiparametric fluorescence technique reveal the impact of salinity on tomato leaves. For this purpose, the tomato genotypes H-2274, Harzfeuer and Rio Grande were grown in the greenhouse under standard or saline conditions. As reference measurements, we recorded the maximum photochemical efficiency of photosystem II (Fv/Fm) via pulse-amplitude-modulated (PAM) chlorophyll fluorescence (ChlF) and analyzed the concentrations of sodium (Na), potassium (K), magnesium (Mg), proline and chlorophyll (Chl). In general, “Harzfeuer” showed a more pronounced response to salinity, as revealed by the increase in Na and proline as well as the decrease in K concentration. Significant differences between the control and the salt treatment were also assessed with Fv/Fm. The ratios BFRR_UV, FLAV, SFR_G and NBI_G increased significantly in the salinity-exposed plants. These ratios, compared with Fv/Fm, also provide precise but more rapid information about the impact of salinity on tomato leaves. On this basis, we demonstrate that the multiparametric fluorescence indices provide a valuable, rapid and practical tool for the in situ monitoring of the physiological status of plants exposed to salinity.

1. Introduction

The problem of salinity and its increasing relevance for horticultural crops is well described in the literature ([1,2,3]). Particularly for tomato, most of the salinity studies have evaluated morpho-physiological modifications such as vegetative development, fresh and dry matter and marketable yield [1,4]. In many cases, biochemical parameters, e.g., the concentrations of ions, sugars and secondary compounds, were also analyzed [5]. For example, it is well known that plants respond to salinity by accumulating specific compounds, such as proline, sugars, organic acids and flavonoids [6] as key components in plant resistance. Phenolic compounds can also be accumulated as a stress response in susceptible cultivars [7]. All these parameters are relevant for understanding how cultivars deal with adverse environmental conditions. However, the recording of these data is time consuming and often requires costly laboratory analysis after sampling. In contrast, rapid and non-destructive techniques offer a timely evaluation of the physiological status of the plants and might contribute to the precise selection of stress-tolerant genotypes.
As one of the most traditional non-destructive techniques, pulse-amplitude modulated (PAM) chlorophyll fluorescence (ChlF) recorded at 680–690 nm provides several parameters for sensing environment-triggered physiological changes at the leaf level [8,9,10]. The major limitation of this technique is that reliable recordings require a time-consuming dark-adaptation and measurements performed in the dark.
In contrast, the detection of fluorescence in the entire range of visible light (380–750 nm) provides information about the localization, type and concentration of specific fluorophores, including chlorophyll (Chl) molecules, in the plant tissue [11]. Chl molecules emit their fluorescence in the red and far-red bands, whereas cinnamic acids and a small fraction of phenolics, covalently bound to the cell walls, are the principal emitters in the blue and green bands [12,13,14]. To overcome variations in intensity resulting from measuring conditions and leaf morphology, fluorescence ratios might be adopted to provide more reliable information for treatment comparisons [11]. The suitability and the use of multispectral fluorescence based indices for stress detection is gaining importance for field [15,16] and horticultural [17,18] crops. However, there is still a high demand for the further development and use of fluorescence sensors in different research fields of stress physiology and practical applications, including salinity-induced stress.
The objective of this work was to evaluate the suitability of multiparametric fluorescence indices for sensing salinity-induced stress in tomato (Solanum lycopersicum) plants in situ without dark-adaptation. For this purpose, we evaluated three tomato genotypes grown in standard or saline environments. As a reference, we recorded the traditional Fv/Fm ChlF parameter and analyzed sodium (Na), potassium (K), magnesium (Mg) and proline as well as chlorophyll (Chl) concentrations for a precise characterization of the salinity-triggered stress. In this context, we hypothesized that the fluorescence indices BFRR_UV (ratio of BF (blue fluorescence) to FRF (far-red fluorescence), both excited with UV (ultraviolet)-light), FLAV (logarithm of the ratio of red-excited FRF to UV-excited FRF), NBI (ratio of UV-excited FRF to green-excited red fluorescence) and SFR (ratio of FRF to RF after green-light excitation) of the multiple fluorescence technique, allow the identification of the impact of salinity on the leaves of the three tomato genotypes.

2. Experimental Section

2.1. Genotypes and Growth Conditions

Experiments were conducted under greenhouse conditions from August to October. Seeds of Solanum lycopersicum L. F1 hybrid Harzfeuer (Volmary GmbH, Münster, Germany), S. lycopersicum var. H-2274 and var. Rio Grande (both donations from Mustafa Demirkaya, Erciyes University, Kayser, Turkey) were used in the present study. Tomato seeds were steeped in the dark at 20 °C for three days. The germinated seeds were transferred into rock wool trays and cultivated until the third leaf stage. The plantlets were transplanted into 10 L pots filled with perlite (Lerligran G, Knauf Perlite GmbH, Dortmund, Germany) and placed on two greenhouse tables. Fertigation was based on Kristallon Blau (Yara GmbH & Co. KG, Dülmen, Germany) and amended with calcium nitrate tetrahydrate (Ca(NO3)2) (99% purity, AppliChem GmbH, Darmstadt, Germany). Nutrient solution in excess was drained off at the bottom of the pots after perlite saturation. The nutrient solution and its spillover were isolated from each other, and the nutrient solution was not recycled.

2.2. Treatments

Plants of each genotype were separated into two treatments (n = 10 plants per treatment group): T1, control plants provided with standard nutrient solution (electrical conductivity, EC = 2 mS·cm−1); T2, plants provided with nutrient solution amended with sodium chloride (NaCl) (99% purity, Carl Roth GmbH & Co. KG, Karlsruhe, Germany) targeting an EC value of 12.4 mS cm−1. To avoid osmotic shock in the NaCl-treated plants, the EC of the solution was increased in three steps starting at 7 mS cm−1 in the 1st week to EC = 9.6 mS cm−1 in the second week, reaching a final concentration of 12.4 mS cm−1 in the third week.

2.3. Analytical Determinations

2.3.1. Mineral Concentrations

The mineral concentrations were analyzed at the end of the experiment from freeze-dried (Gamma 1-16 LSC, Martin Christ Gefriertrocknungsanlagen GmbH, Osterode am Harz, Germany) and ground samples of middle-aged leaves. After acid-digestion of 0.1 g ground dry matter (DM) in a microwave, the concentration of Mg, K and Na was determined by atomic absorption spectrometry (AAS, Perkin-Elmer, Analyst 300, Wellesley, MA, USA) as described by Hunsche et al. [3].

2.3.2. Proline Concentration

Proline concentration in the leaves was determined as described by Bates et al. [19]. A mixture of 3 mL sulfosalicylic acid and 0.1 g DM grounded leaves was centrifuged at 4200 rpm for 20 min at 20 °C. A total of 1.8 mL sulfosalicylic acid, 2 mL glacial acetic acid and 2 mL ninhydrin acid was then added to 0.2 mL of the supernatant. The mixture was boiled at 100 °C for one hour in a hot water bath. After the sample cooled down to 20 °C, 4 mL toluene was added to the mixture. The upper, organic portion was collected for spectrophotometric measurements (Lambda 35 UV/VIS Spectrophotometer, PerkinElmer, Waltham, MA, USA). The absorbance of the extracts was measured at 520 nm.

2.3.3. Chlorophyll Concentration

The chlorophyll (Chl) concentration (Chl a + b) of the samples was determined from 0.05 g ground DM [20]; the material was mixed with 5 mL methanol and centrifugated at 4000 rpm for 15 min at 4 °C. The supernatant was transferred to 50 mL volumetric flasks. The extraction procedure with methanol was repeated three times; the flasks were then filled up to 50 mL with methanol. The absorbance of the extracts was determined at 647 nm (A647) and 664 nm (A664) with a UV-VIS spectrophotometer (Lambda 35 UV/VIS Spectrophotometer, PerkinElmer, Waltham, MA, USA).

2.4. Fluorescence Measurements

Fluorescence measurements were performed on detached leaves under laboratory conditions, either immediately after sampling in the case of the multiparametric fluorescence excitation system (Multiplex®3, Force-A, Orsay, France) or after dark adaptation to the room conditions in the case of pulse-amplitude-modulated (PAM) chlorophyll fluorescence (Imaging-PAM®, Heinz-Walz GmbH, Effeltrich, Germany). Fluorescence determination over the time-course of the experiment was performed on leaves of different physiological ages: the first measurements were conducted on the fourth leaf level counted from the bottom (cotyledons excluded), and every 6–8 days the upper leaf level was selected, according to the growth of the plant.

2.4.1. Pulse-Amplitude-Modulated (PAM) Chlorophyll Fluorescence

ChlF parameters were recorded from the adaxial side of dark-adapted (30 min) leaves with our system as described elsewhere [21]. Briefly, the light source (0.5 μmol m−2 s−1 PAR) used for fluorescence excitation and actinic illumination at 470 nm contains 96 blue light diodes. Fluorescence images were recorded with a black and white CCD (8.458 mm chip with 640 × 480 pixels) camera operated in 10 bit mode at 30 frames per second. Determinations of the ground (Fo) and maximum fluorescence (Fm) were used to calculate the variable fluorescence Fv (Fv = Fm − Fo) and to estimate the maximum quantum efficiency of PSII photochemistry (Fv/Fm) [8]. Data evaluation was based on the recorded pictures. In each single image, three areas of interest (AOI), at the leaf edge, apex and center, were selected. The mean of the three AOIs was calculated before running the statistical analysis.

2.4.2. Multiple Fluorescence Excitation and Fluorescence Ratios

The fluorescence in the blue (BF), red (FR) and far-red (FRF) spectral bands, excited with UV and green (G) light, was recorded on detached leaves with a multiparametric hand-held fluorescence sensor [16,18]. The fluorescence recordings were performed immediately after harvesting the leaves. Leaves were fixed horizontally on a sample holder at a defined distance (10.5 cm) to the sensor. A frontal cover plate having an aperture of 6 cm in diameter was used to standardize the area to be measured. As indicative parameters, we selected four fluorescence ratios: the BF to FRF ratio after UV light excitation (BFRR_UV); the FLAV Index (FLAV), as expressed by the logarithm of the ratio of FRF after red light excitation to the FRF after excitation with UV light, the Nitrogen Balance Index (NBI), given by the ratio of FRF after UV light excitation to RF after G light excitation; and the FRF to RF ratio after G light excitation (SFR_G).

2.5. Data Analysis

The statistical analysis was performed with IBM SPSS Statistics 20.0 (IBM Corporation, New York, NY, USA). Means were compared with a t-test (p ≤ 0.05), and graphs (mean ± SE) were drawn using SigmaPlot 11.0 (Systat Software Inc., San Jose, CA, USA).

3. Results

3.1. Mineral, Proline and Chlorophyll Concentrations

Leaves of the three tomato genotypes significantly accumulated Na over the 40 days of the experiment in salinity-grown plants compared with the control (Table 1); the concentration increase in the salinity-exposed plants ranged from 231% in “H-2274” to 525% in “Harzfeuer”. In contrast, the K concentration in leaves decreased in a range of −8% (“H-2274”) to −47% (“Harzfeuer”), whereas the Mg concentration was between −14% (“Rio Grande”) and −33% (“Harzfeuer”) lower in the salinity-grown plants.
Table 1. Sodium, potassium, magnesium, proline and total Chl (Chl a + b) concentrations in tomato leaves. Samples were taken 40 days after initiation of the treatments.
Tomato CultivarTreatmentsNa [mg/g DM]K [mg/g DM]Mg [mg/g DM]Proline [mg/g DM]Chl a + b [mg/g DM]
Rio GrandeControl4.74 ± 0.20 *70.95 ± 1.44 *3.74 ± 0.14 *0.54 ± 0.04 *12.67 ± 0.26 *ns
NaCl20.95 ± 7.2653.97 ± 2.353.20 ± 0.074.14 ± 0.1813.69 ± 0.63
H-2274Control4.99 ± 0.21 *69.07 ± 1.84 *3.32 ± 0.12 *0.44 ± 0.07 *12.28 ± 0.28 *ns
NaCl16.56 ± 1.2063.36 ± 1.972.87 ± 0.053.36 ± 0.2412.40 ± 0.29
HarzfeuerControl5.40 ± 0.13 *73.04 ± 2.40 *2.47 ± 0.07 *0.25 ± 0.03 *14.32 ± 0.35 *
NaCl33.79 ± 1.2738.71 ± 1.871.83 ± 0.091.79 ± 0.2112.54 ± 0.41
* Significant differences according to t-test (p ≤ 0.05; n = 10) between control and NaCl treatment for each genotype and measuring day; all data were expressed as the mean ± SE; *ns, non-significant.
As a biochemical indicator of plant stress, proline concentration increased more than 600% in all genotypes (Table 1). In addition, we observed significant differences among the genotypes; here, the proline concentration in “Harzfeuer” was significantly lower than in “Rio Grande” and “H-2274”. Lastly, the Chl concentration decreased due to salinity in the leaves of “Harzfeuer” only, whereas it remained unaffected in the other genotypes.

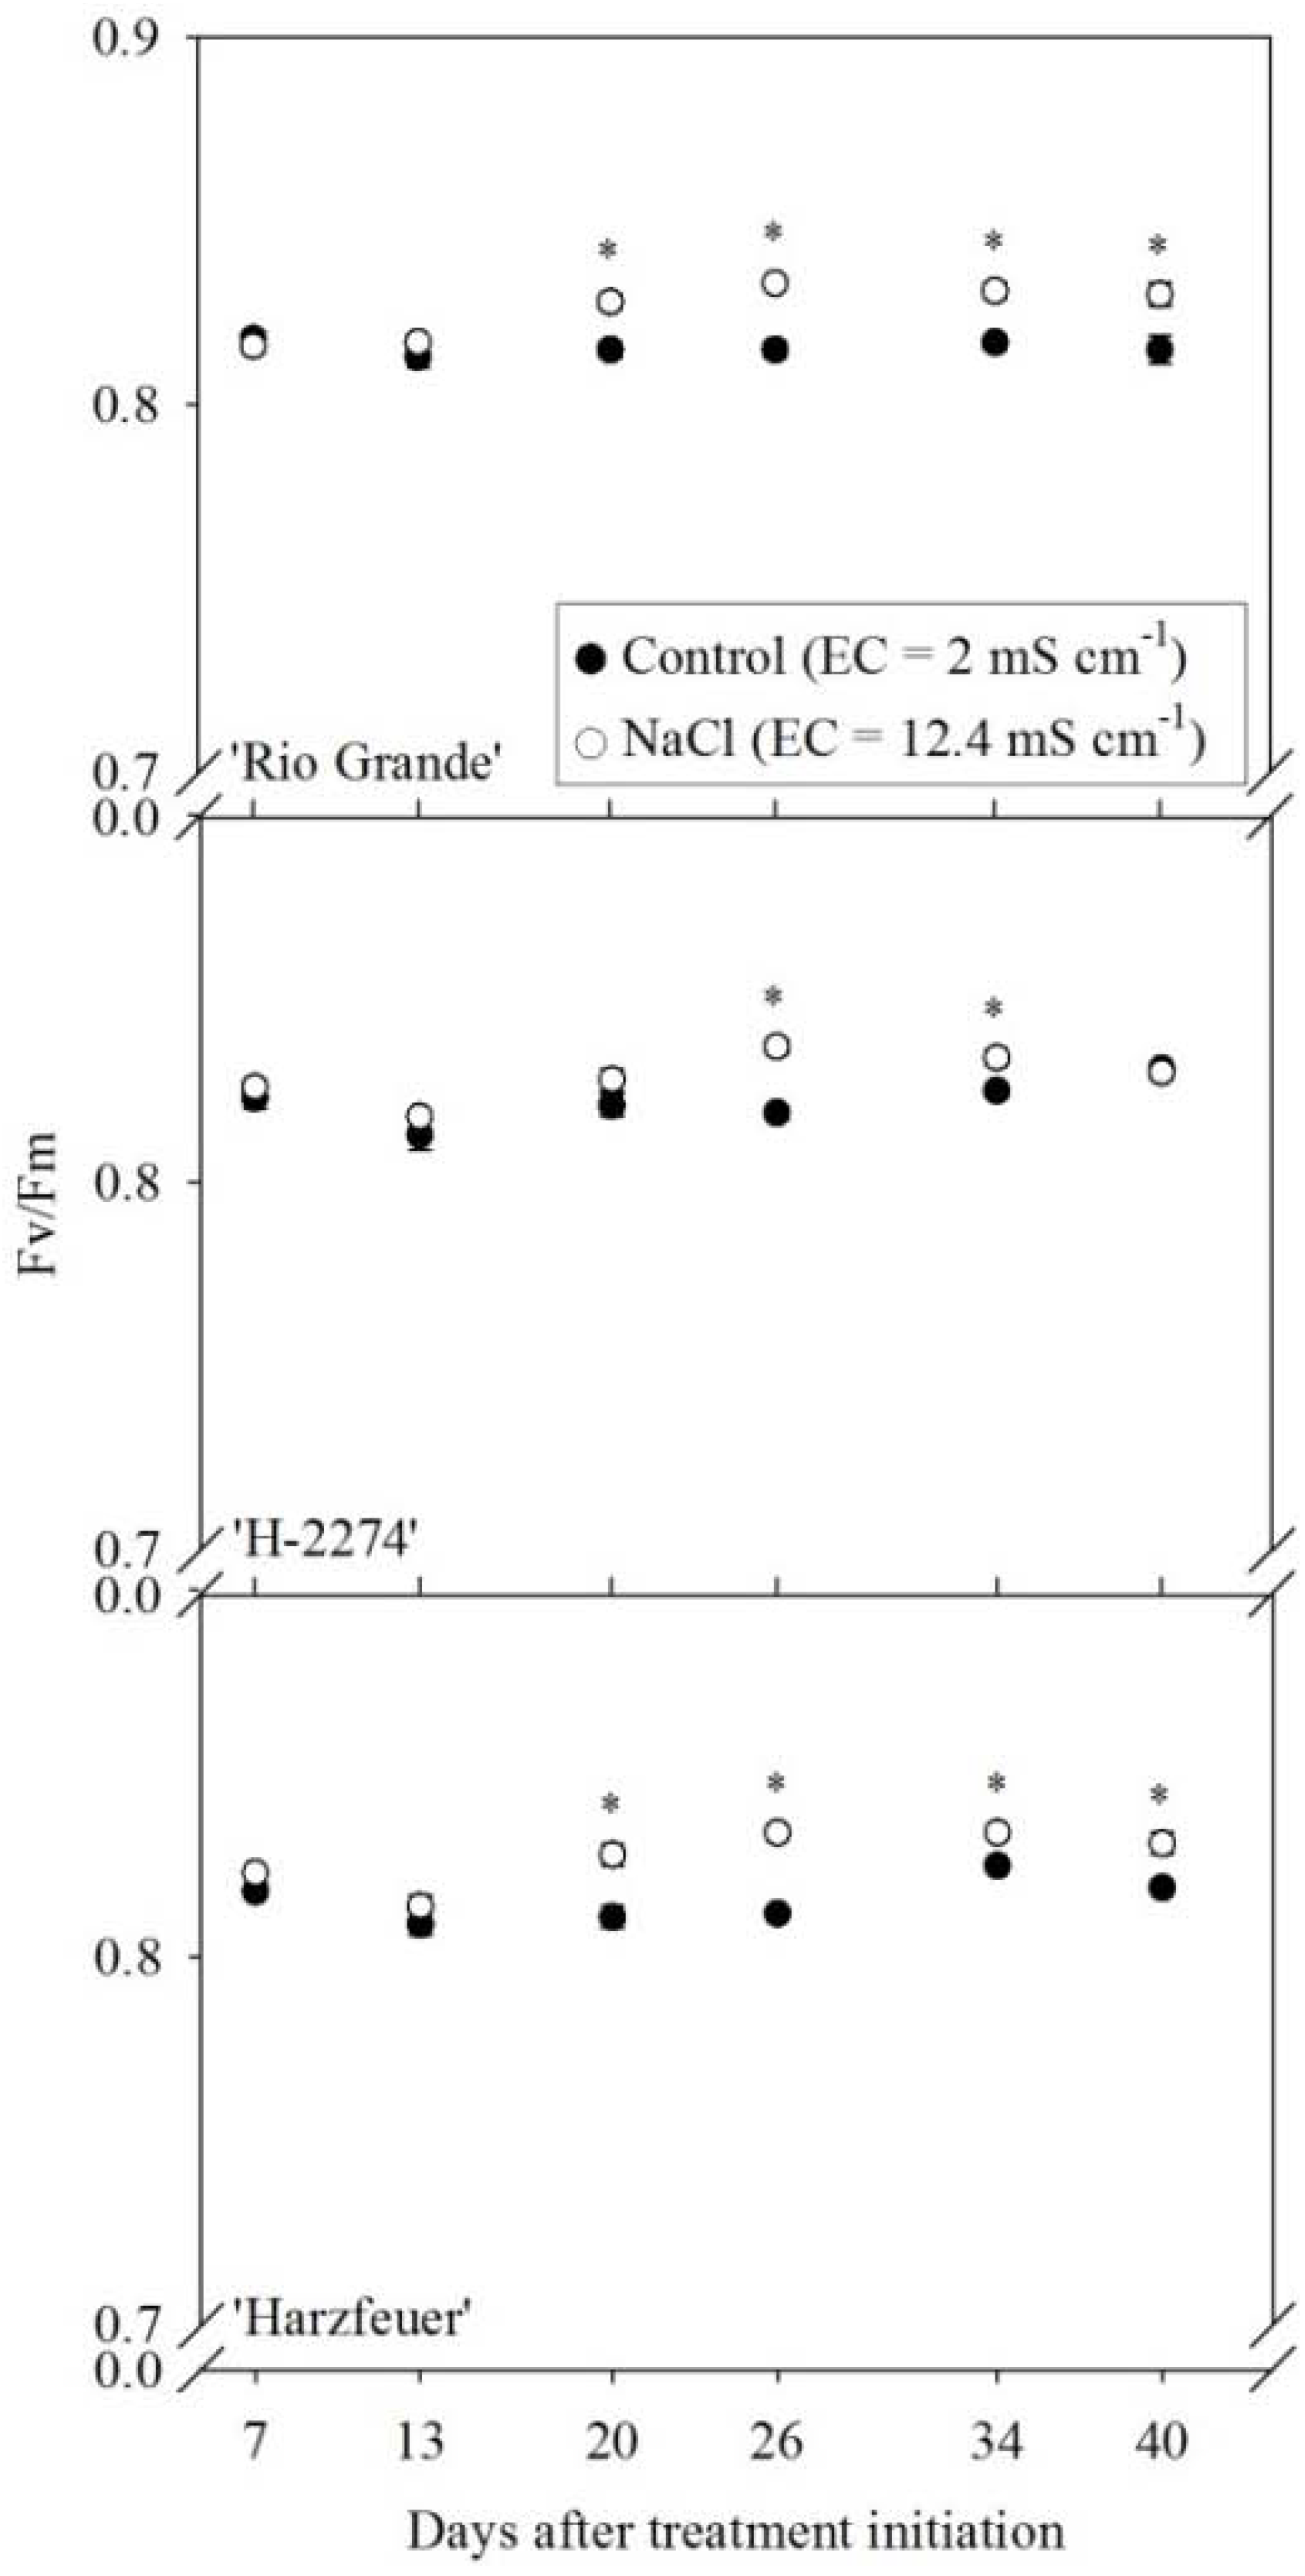
3.2. Maximum Quantum Efficiency of Photosystem II (Fv/Fm)

Fv/Fm values indicated no significant differences at 7 and 13 days after treatment initiation (DAT), irrespective of the genotype (Figure 1). Significantly higher values in the NaCl treatment group were observed at 20 DAT in “Rio Grande” and “Harzfeuer” and at 26 DAT in “H-2274”. More pronounced differences between salinity and control treatment were observed in “Rio Grande”.
Figure 1. Maximal photochemical efficiency (Fv/Fm) of tomato leaves. Measurements were taken from “Rio Grande”, “H-2274” and “Harzfeuer” in the course of the experiment. * Significant differences according to t-test (p ≤ 0.05; n = 10) between control and NaCl treatment for each genotype and measuring day; all data were expressed as the mean ± SE.
Agriculture 04 00132 g001

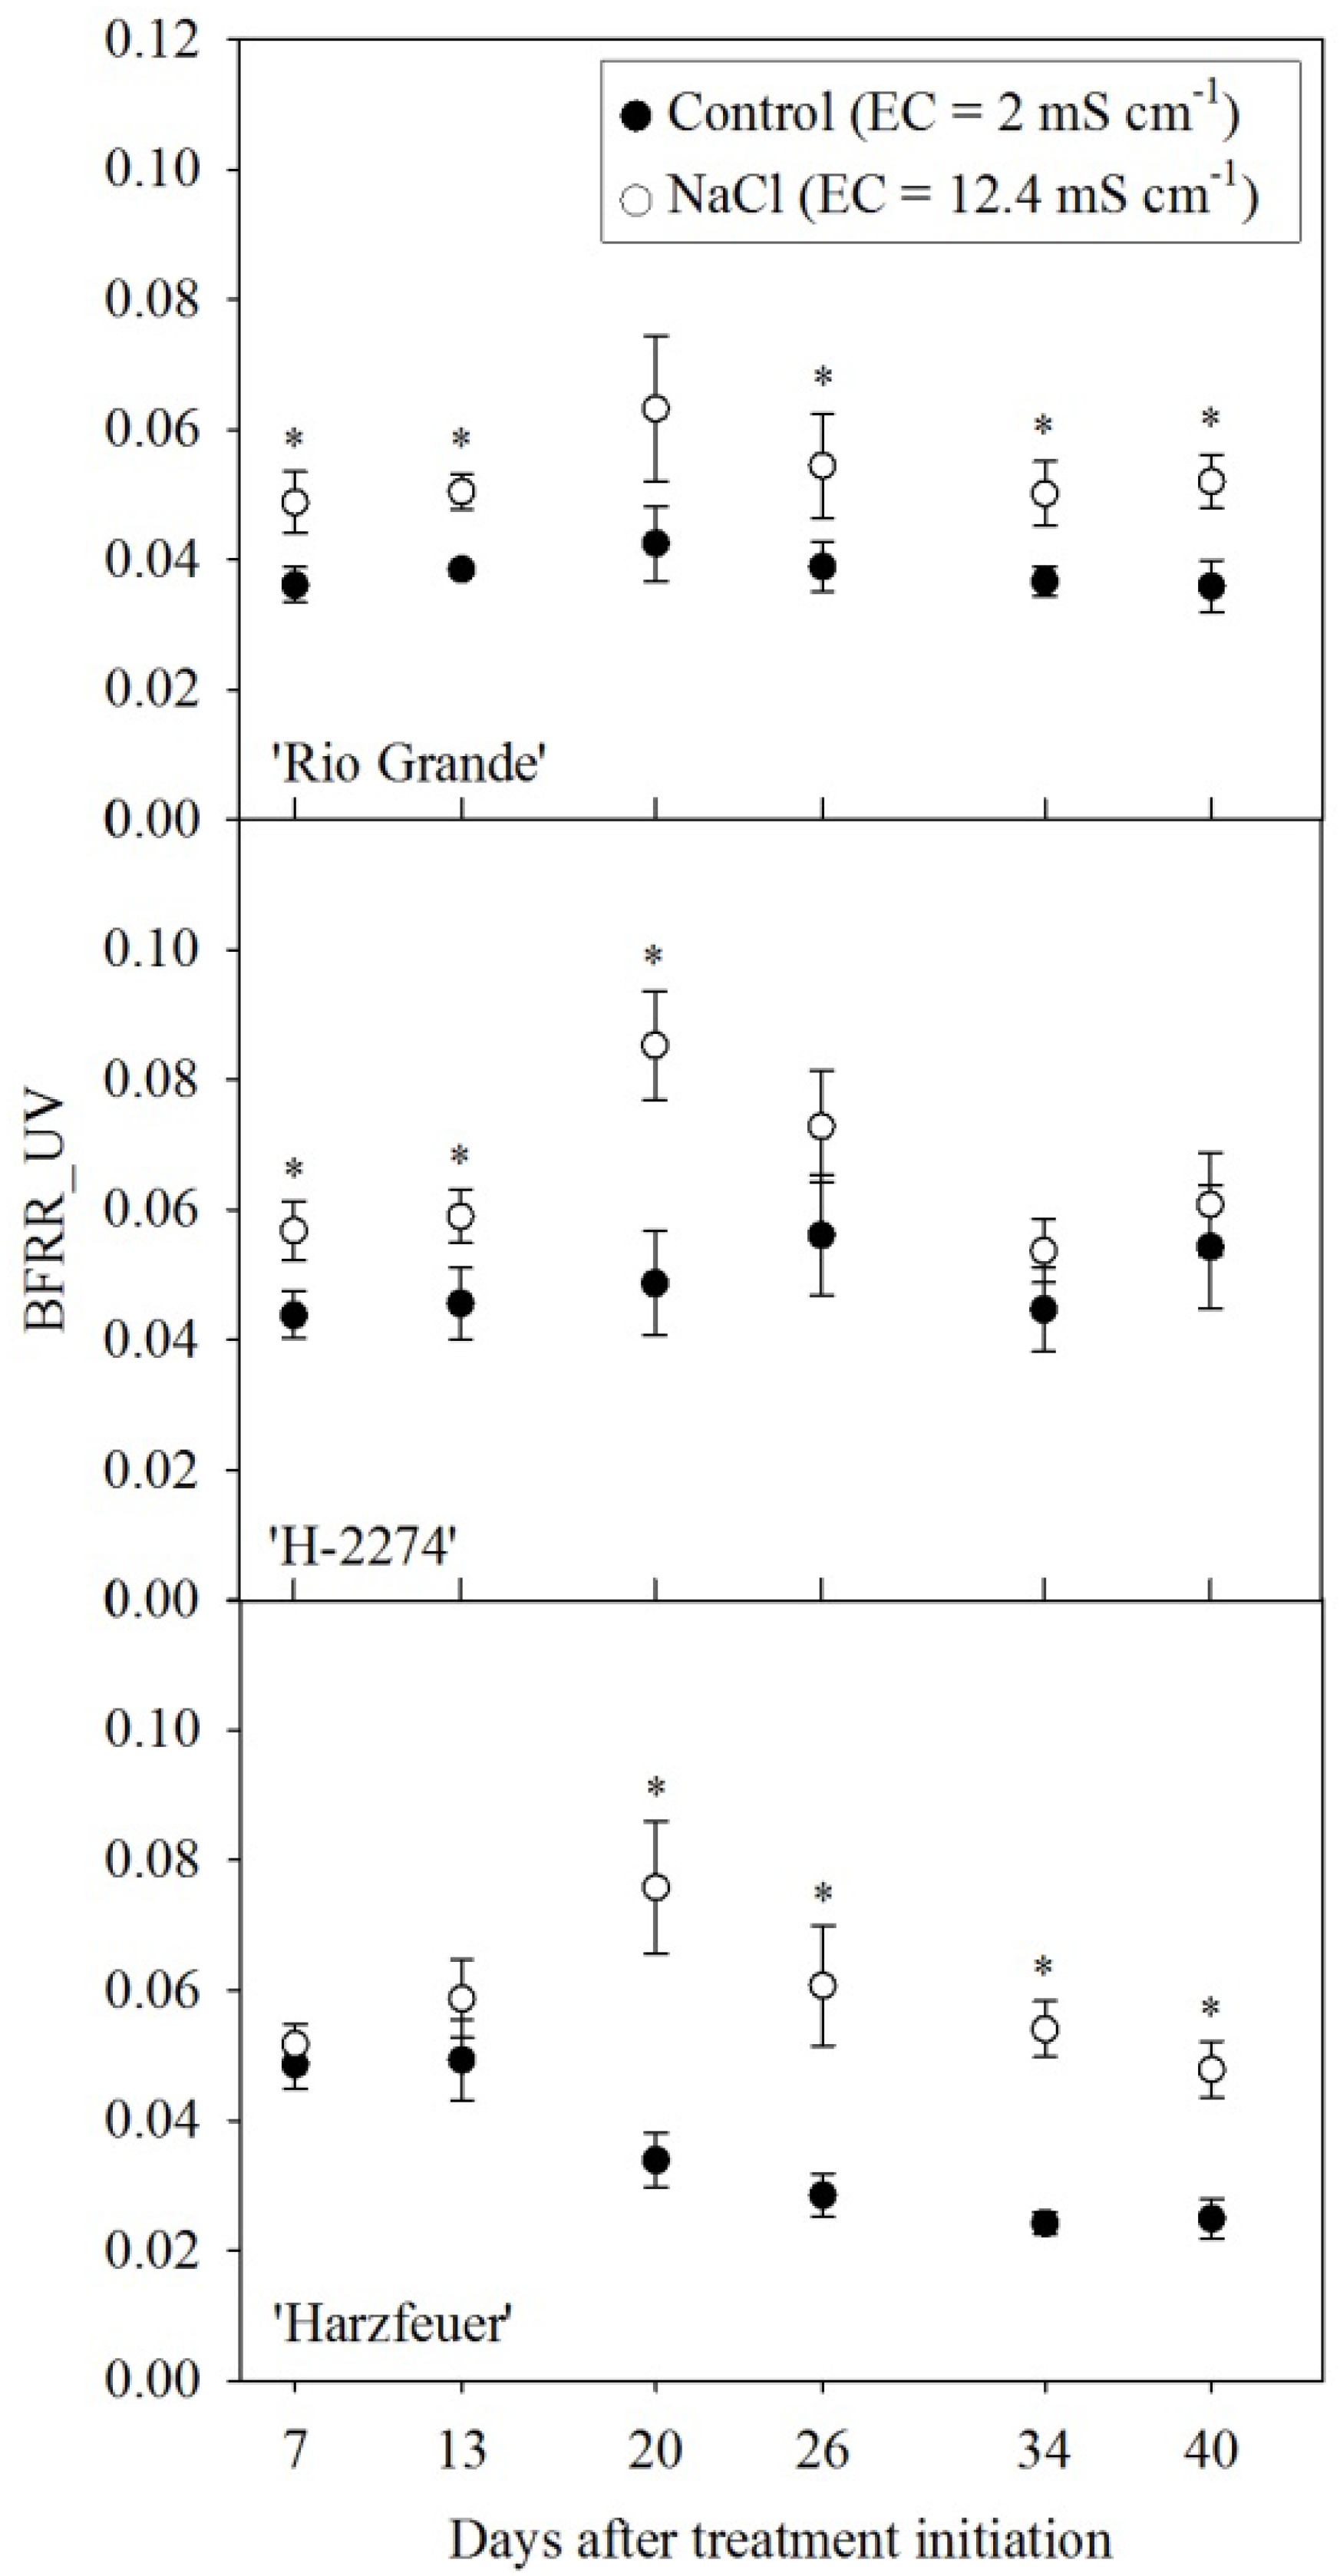
3.3. Blue-to-Far-Red Fluorescence Ratio (BFRR_UV)

In general, the BFRR_UV was significantly higher in salinity exposed plants. Already at 7 DAT, the BFRR_UV was significantly higher due to NaCl in “Rio Grande” and “H-2274” compared with the respective control plants (Figure 2). “Harzfeuer” had a delayed response, showing significant differences between the experimental treatments at 20 DAT (Figure 2). Unexpectedly, the values in the NaCl treatment of “H-2274” approached the control values at 26 DAT and thereafter. In contrast, the values for the NaCl-treated plants of “Rio Grande” and “Harzfeuer” remained higher than those for the control plants.
Figure 2. Blue-to-far-red fluorescence ratio (BFRR_UV) after excitation with UV light displayed over the time course of the experiment. Readings were taken on tomato leaves from the genotypes Rio Grande, H-2274 and Harzfeuer. Values represent the mean ± SE (standard error, n = 10). * Significant differences (p ≤ 0.05) between control and NaCl treatment for each genotype and measuring day, assessed by t-test.
Agriculture 04 00132 g002

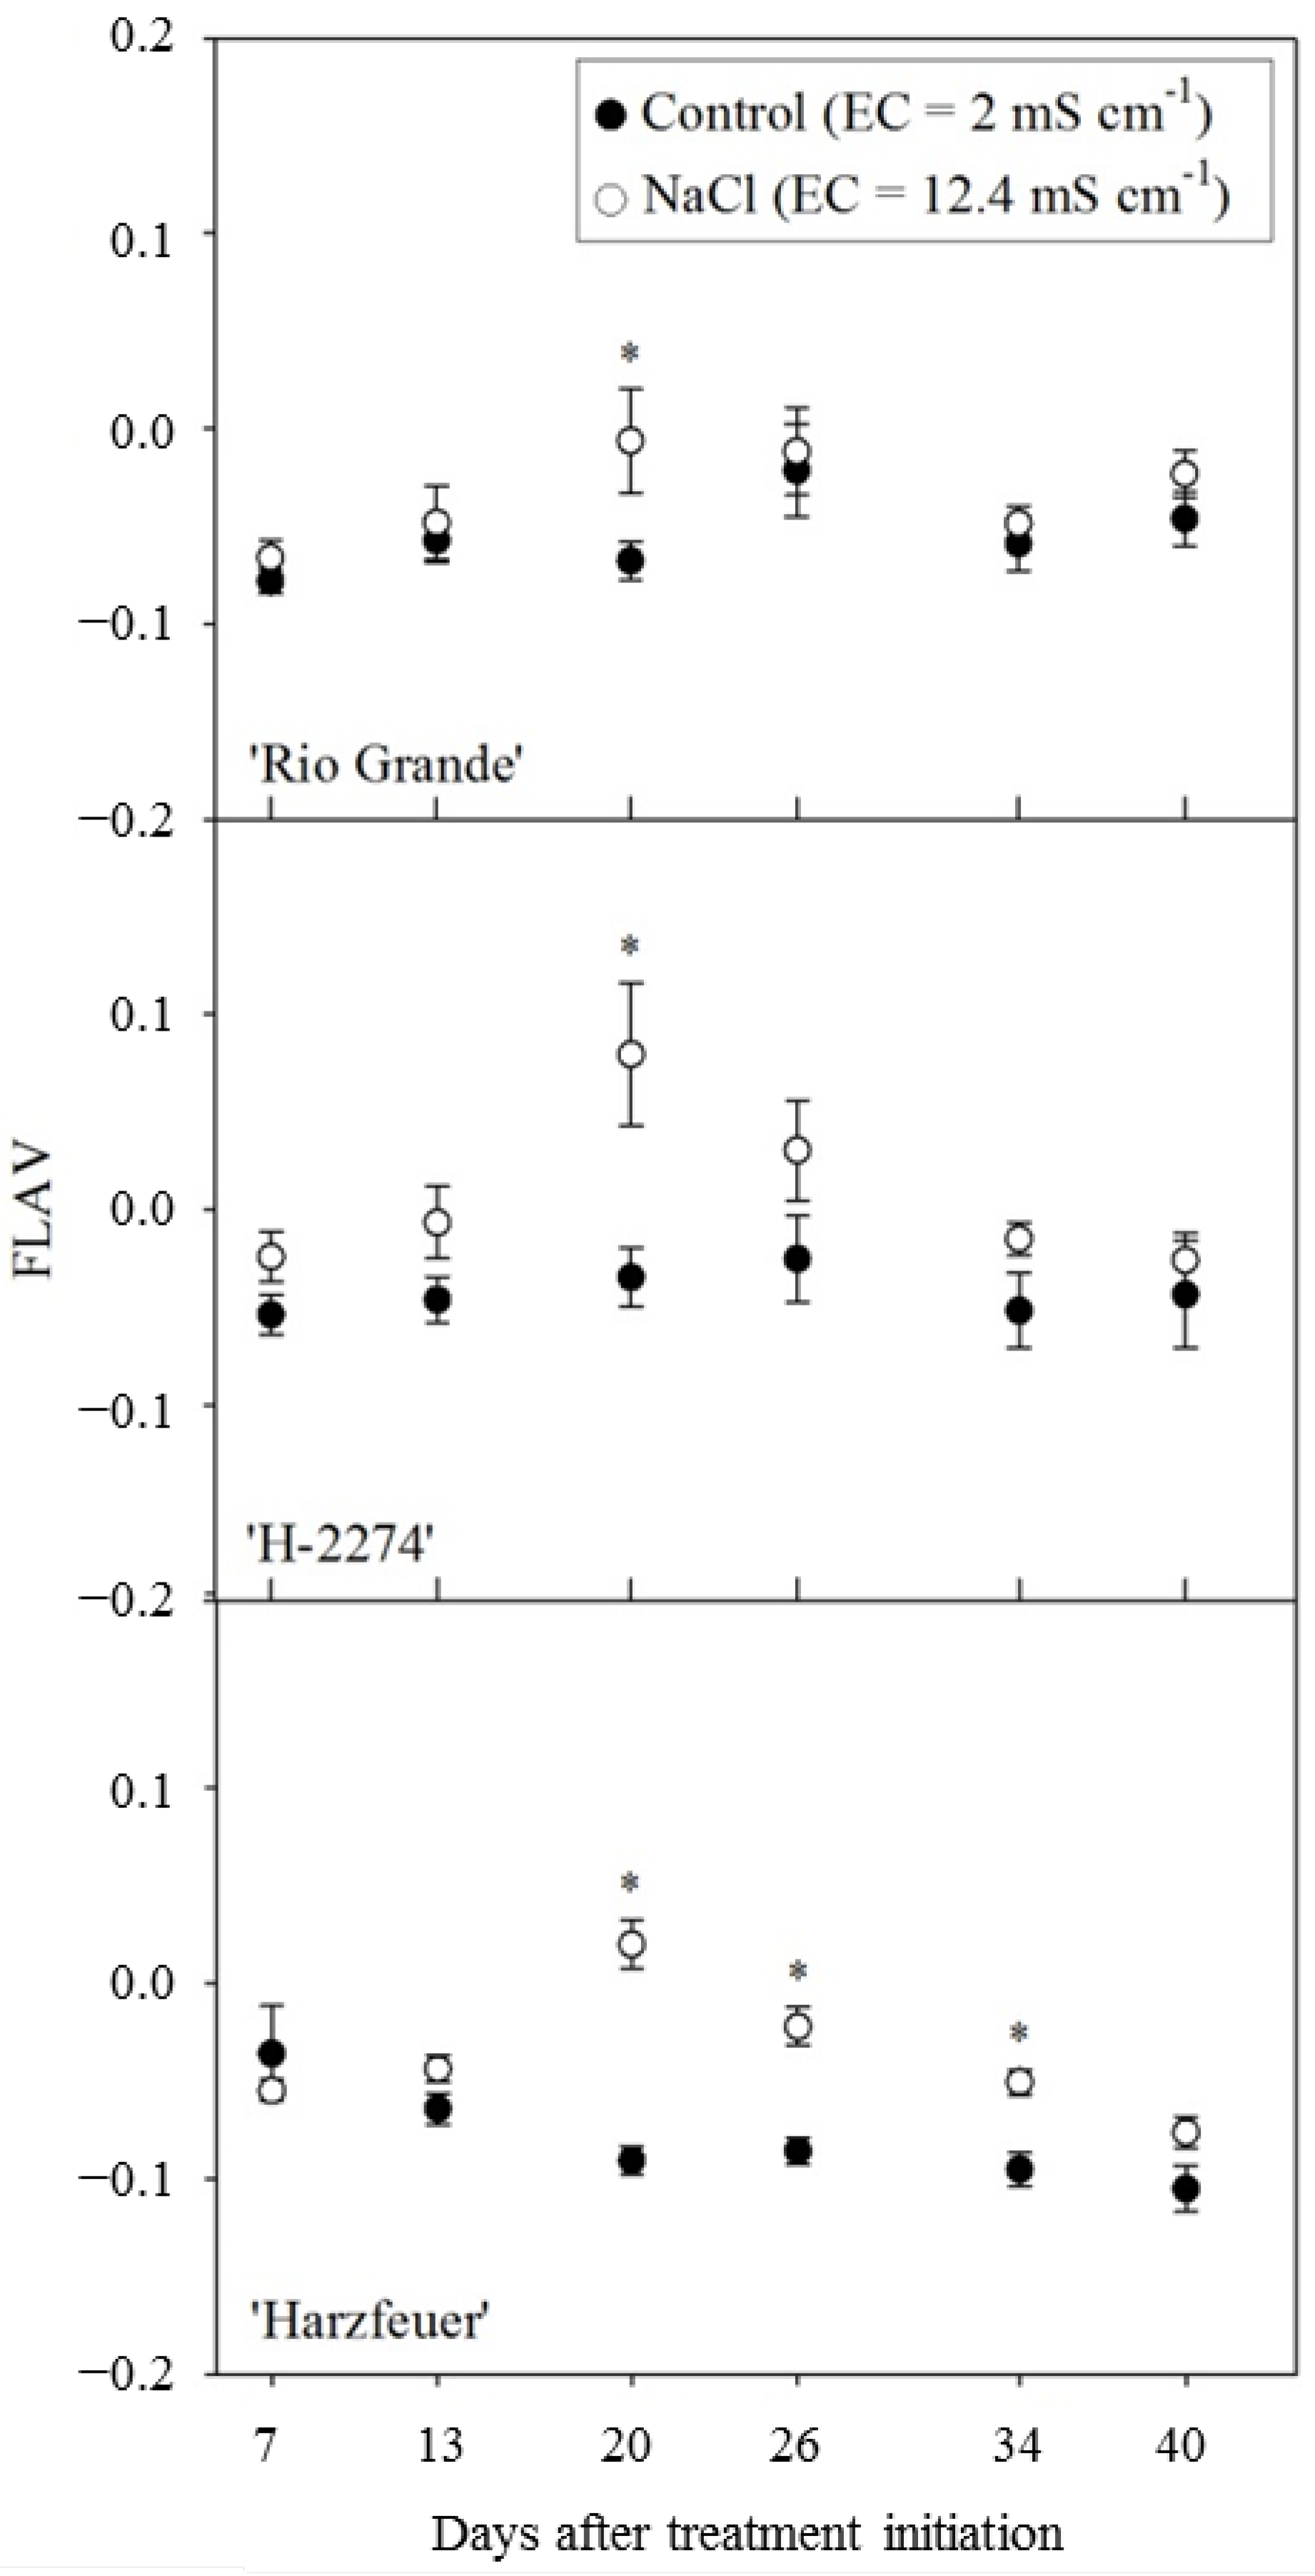
3.4. Flavonol-Index (FLAV)

The FLAV, which is related to the accumulation of flavonols in the leaf epidermis, showed a delayed response to salinity. The first significant responses were observed at 20 DAT (Figure 3). The salt-exposed plants had higher FLAV values than the control plants. Generally, “Harzfeuer” responded with a stronger increase compared with the control treatment than “Rio Grande” and “H-2274”. However, no significant differences between the control and salt treatments could be measured at the end of the experiment.
Figure 3. The FLAV-Index expressing the logarithm of the ratio of far-red fluorescence after red light excitation to far-red fluorescence after excitation with UV-light displayed over the time course of the experiment. Readings were taken on tomato leaves from the genotypes Rio Grande, H-2274 and Harzfeuer. Values represent the mean ± SE (n = 10). * Significant differences (p ≤ 0.05) between control and NaCl treatment for each genotype and measuring day, assessed by t-test.
Agriculture 04 00132 g003

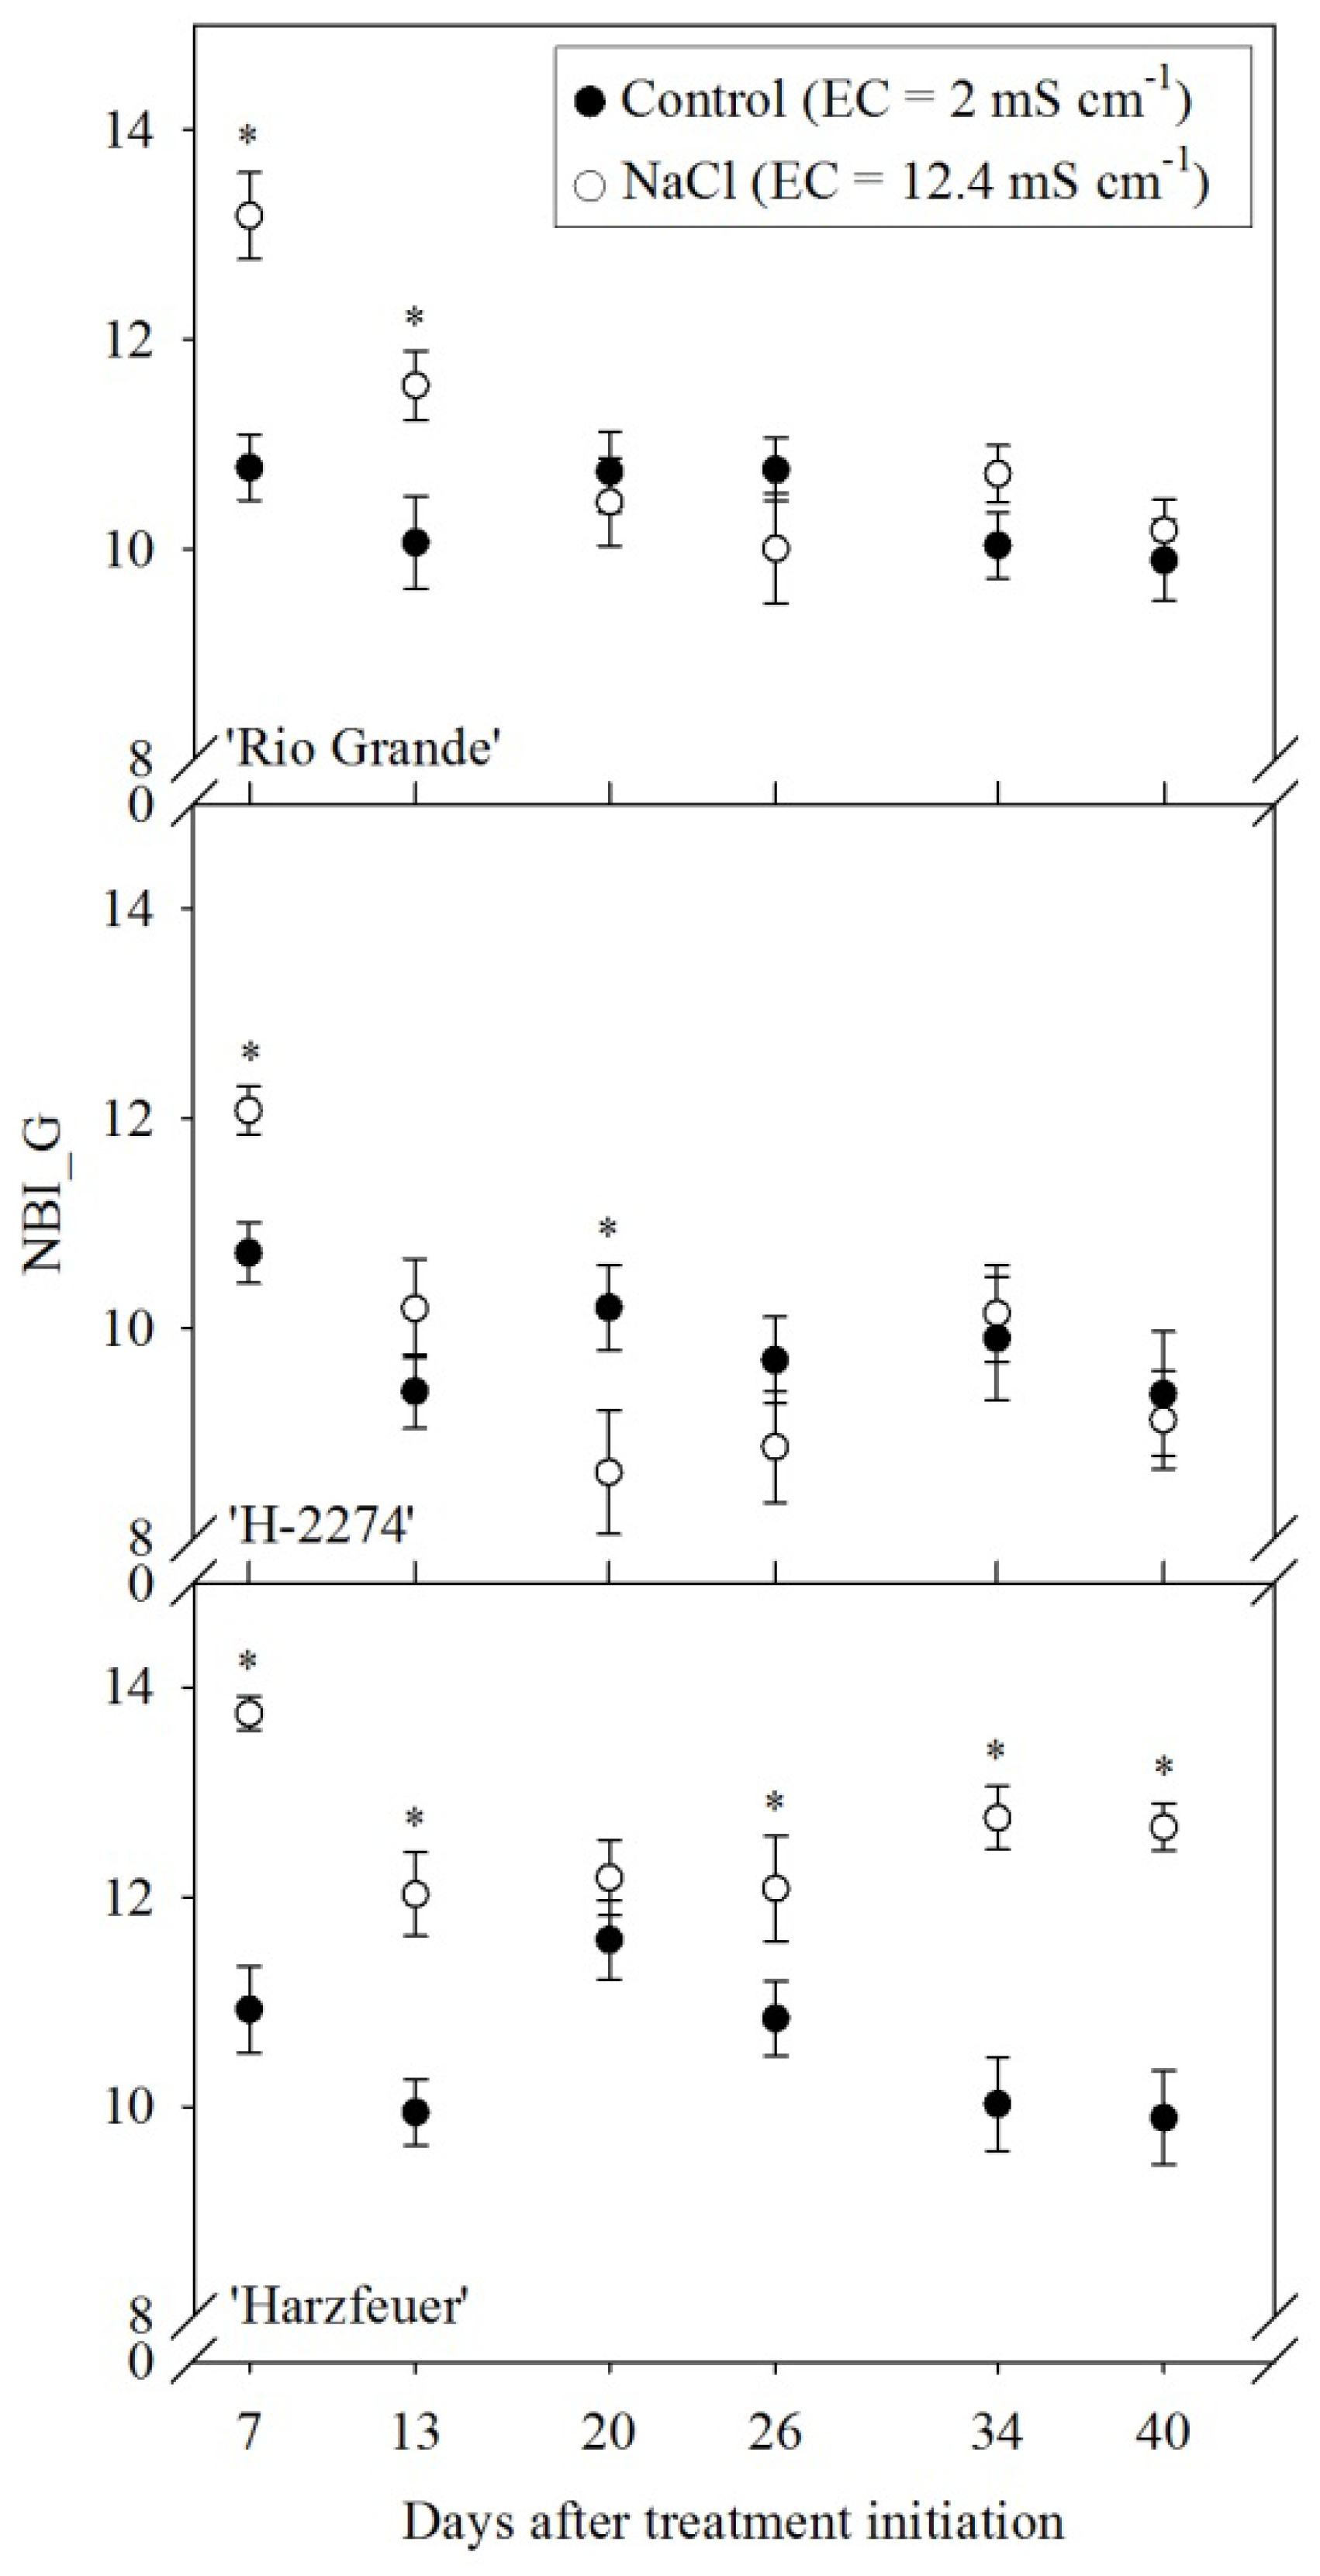
3.5. Nitrogen Balance Index (NBI_G)

The NBI_G values of the salinity-exposed plants were higher than those of the control plants (Figure 4). At 7 DAT, significant differences between the salinity and control treatments were observed in all genotypes. Subsequently, the three genotypes showed distinct courses of development over the time. In the case of “Harzfeuer”, significant differences in the salt-treated plants were observed until the end of the experiment, whereas the values for “Rio Grande” and “H-2274” declined to the level of the control treatments.
Figure 4. The ratio of UV-excited far-red fluorescence to green-excited red fluorescence (NBI_G). Readings were taken on tomato leaves from “Rio Grande”, “H-2274” and “Harzfeuer”. Values represent the mean ± SE (n = 10). * Significant differences (p ≤ 0.05) between control and NaCl treatment for each genotype and measuring day, assessed by t-test.
Agriculture 04 00132 g004

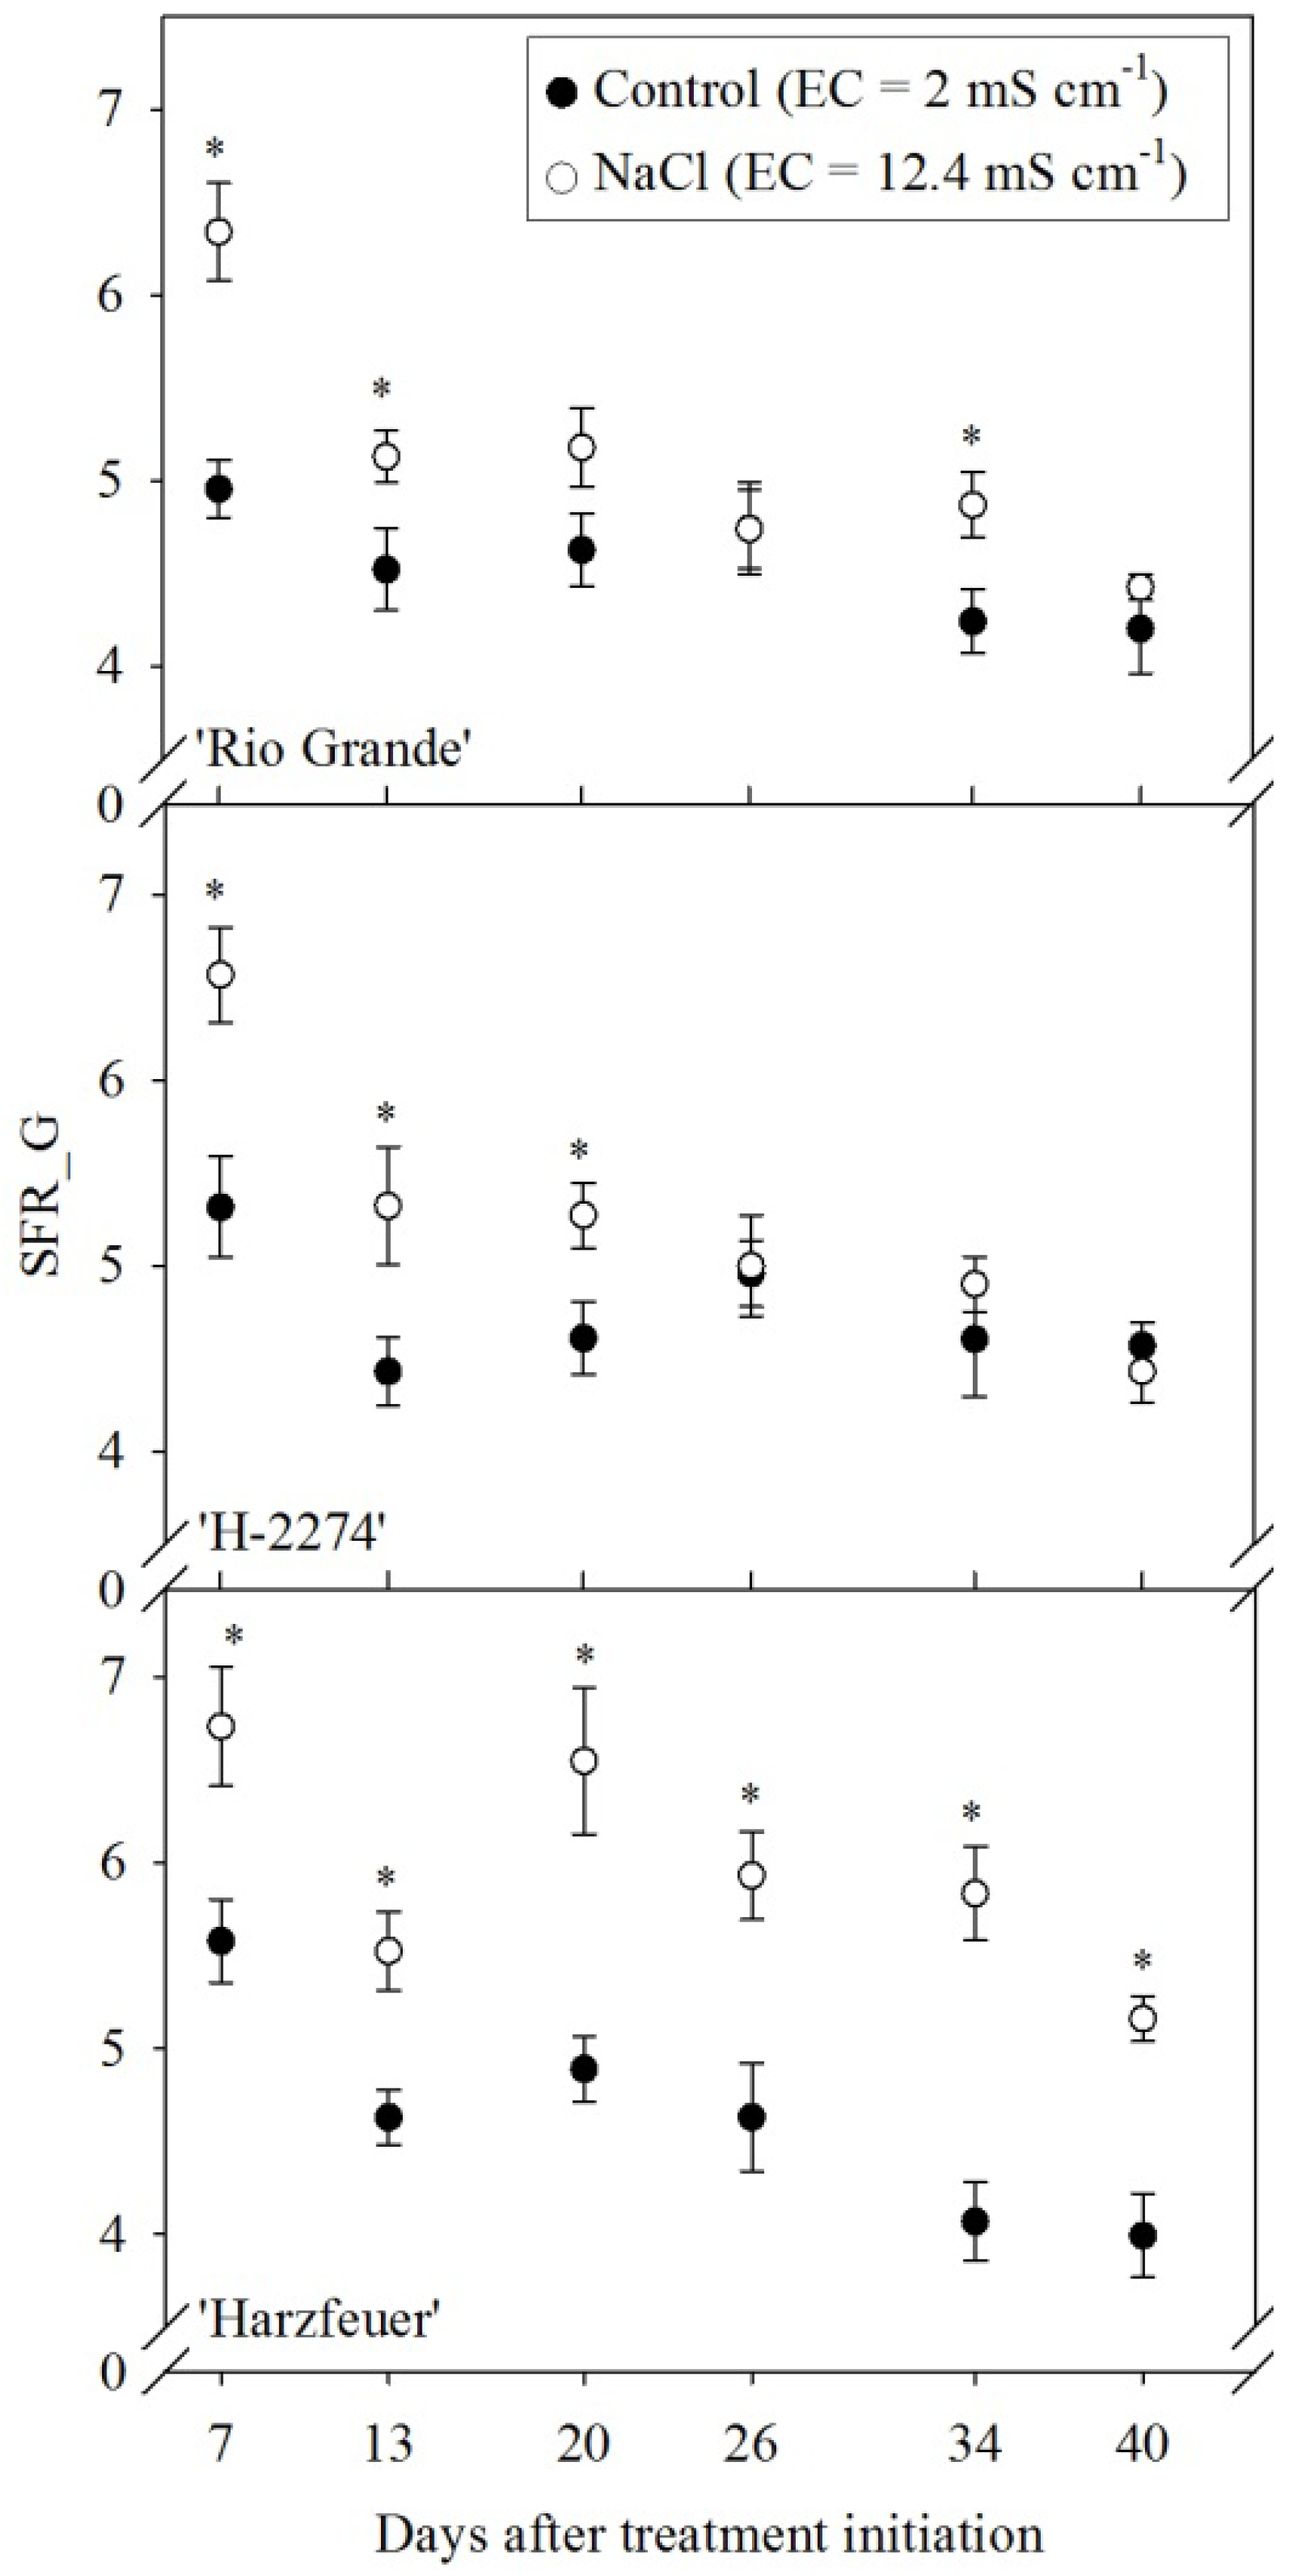
3.6. Simple Fluorescence Ratio (SFR_G)

Salinity-exposed plants had higher SFR_G values than control plants at 7 DAT (Figure 5). The ratios for the salt treatment in “Rio Grande” and “H-2274” approached the control treatments over the course of the experiment. In contrast, SFR_G of the salt treated plants in “Harzfeuer” remained higher than the control treatments.

4. Discussion

In the present work, we demonstrate that selected indices of the multiparametric fluorescence technique reveal the impact of rootzone salinity on tomato leaves and plants. Biochemical parameters, such as the content of Na, K, Mg, proline and Chl a + b, as well as parameters recorded with the classical PAM chlorophyll fluorescence technique, served as a reference.
Figure 5. The ratio of far-red fluorescence to red fluorescence after green light (SFR_G). Readings were taken on tomato leaves from “Rio Grande”, “H-2274” and “Harzfeuer”. Values represent the mean ± SE (n = 10). * Significant differences (p ≤ 0.05) between control and NaCl treatment for each genotype and measuring day, assessed by t-test.
Agriculture 04 00132 g005
Salinity negatively affects plant growth and development [3]. In addition to mineral imbalances at the root zone, causing a lower uptake of minerals such as K and Mg (Table 1), the high Na uptake and transport to the cells in the leaves alters specific biochemical and physiological processes. For example, cells might undergo a hyperosmotic shock by lowering the water potential, which causes the reduction of turgor [22]. As a protective measure, tissues accumulate proline (Table 1), a well-known indicator of drought and salinity-stress [6,23]. Proline supports intracellular osmotic adjustment [24,25]. In certain organisms, it serves to scavenge reactive oxygen species as well as to stabilize membranes and proteins [26]. As suggested, high intracellular proline concentrations contribute to improve the stability of chlorophyll molecules [27], as demonstrated in our study by the non-significant difference between the Chl concentrations in “Rio Grande” and “H-2274”. Overall, the analytical results confirm that the experimental plants suffered from salinity-induced stress.
Similarly, the maximum photochemical efficiency of the photosystem II (Fv/Fm) indicated particular responses of the genotypes. Significant differences between the treatment groups, as indicated by the increase of Fv/Fm in the salt-stressed plants, were observed at 20 DAT and thereafter. This finding is in agreement with Li et al. [28], who detected an increase in Fv/Fm as a consequence of salinity. In contrast, studies of other plant species did not show any significant impact of abiotic stress on photosystem II [29,30]. Given that Fv/Fm shows the maximum efficiency at which light absorbed by the light-harvesting antennae of PSII is converted to chemical energy [8], plants exposed to salinity appear to have a more efficient PSII. Consequently, the long-term saline environment could produce an adaptation process in the plants.
To cite promising results of the study, several multiple fluorescence excitation indices, such as BFRR_UV (Figure 2), NBI_G (Figure 4) and SFR_G (Figure 5), already showed physiological changes in the salt-exposed plants at 7 DAT. We observed different responses of the cultivars to salinity. Early responses, as indicated by BFRR_UV, were more pronounced and long-lasting in “Rio Grande” and “H-2274” than in “Harzfeuer”. The indices NBI_G and SFR_G also indicated cultivar-specific modification patterns.
The BFRR_UV, as a complex fluorescence index calculated from the blue fluorescence divided by far-red fluorescence after excitation with UV light, increased in those plants exposed to salinity (Figure 2). This result was primarily driven by a significant (“Harzfeuer”), moderate (“Rio Grande”) and low (“H-2274”) decrease in the absolute intensities of ChlF in the far-red spectral region, whereas changes in blue fluorescence were virtually absent. Lastly, these changes in the FRF might be associated with alterations in the amount of chlorophyll and the efficiency of light use in the photosystems as well as the shielding of the excitation light by epidermal UV-absorbing compounds [31].
The accumulation of epidermal flavonols in the leaves can be monitored by the fluorescence screening technique [32], indicated by the fluorescence index FLAV (Figure 3). Previous observations by our group indicate that the FLAV-Index might be adopted for use as a reliable indicator of drought stress in wheat [15]. In contrast, FLAV did not outperform the other indices in the present study of the impact of salinity on tomatoes (Figure 2).
The NBI_G and SFR_G are two other complex excitation emission indices [33] that support the rapid and non-destructive detection of changes in the Chl a + b concentration [34] and epidermal phenolics. In our study, we observed a significant increase in NBI_G in salt-exposed tomato genotypes 7 DAT (Figure 4), which was less accentuated in “H-2274”. Although these results are consistent with the trends indicated by SFR_G (Figure 5), they do not agree with the chlorophyll content. Moreover, we observed lower absolute intensities of RF than of FRF emission, a result that is consistent with the findings of previous studies [35,36]. However, we observed an increase in NBI_G and SFR_G due to the NaCl treatment, in contradiction to results in the literature [37,38]. In view of this finding, the weak differences between untreated and salt-affected plants, in, e.g., Chl a + b in “H-2274” and “Rio Grande”, are not consistent with the results of other studies [39].
An explanation for these controversial data could be an increase in leaf thickness due to salinity [39], changing the penetration of the excitation light and reducing the fluorescence emission. Another important reason might be the use of a higher leaf level for the sequential measurements. Young leaves tend to have lower leaf ion concentrations than mature leaves [40]. Accordingly, their physiology is less affected than that of old leaves. Moreover, compared with the older leaves at the bottom of the plant, the young leaves had less time for synthesizing fluorescing pigments and flavonols, and this observation would explain the minor differences between the control and salt-exposed plants. Lastly, plants might also adapt to the stressful environment, so that the stress factors did not affect plant physiology as strongly as initially expected.

5. Conclusions

Compared with the PAM method, multiparametric fluorescence ratios (BFRR_UV, NBI_G, SFR_G) provide an effective and timely technique for sensing salt stress without the need for dark adaptation. BFRR_UV and SFR_G were the most sensitive ratios for the rapid sensing of salinity. Of the evaluated genotypes, the fluorescence emissions in “Harzfeuer” revealed the strongest responses to salinity. Overall, the temporal development of NBI_G and SFR_G in “Rio Grande” and “H-2274”, allied to the low Na and the high proline concentrations as well as the unchanged chlorophyll content, provide evidence that these genotypes are more salt tolerant than “Harzfeuer”. Nevertheless, further in-depth physiological studies are required to analyze salinity-induced changes in the composition pattern of fluorophores. Lastly, additional validation studies with other genotypes and plant species are required.

Acknowledgments

Special thanks are extended to Libeth Schwager for performing the AAS, chlorophyll and proline analyses. Thanks are also extended to Mustafa Demirkaya, Erciyes University, Turkey for the donation of tomato seeds (Rio Grande and H-2274). This study was supported by the individual scholarship for graduates of the University of Bonn.

Author Contributions

Burkard Kautz conducted the trials, collected the experimental data and performed statistical analysis; Mauricio Hunsche worked as advisor (planning and conduction of experiments, data analysis and interpretation) and contributed in writing and proofreading the manuscript. Georg Noga provided the required research funds, gave scientific advice and contributed with manuscript proofreading.

Abbreviations

BF
blue fluorescence
BFRR_UV
blue-to-far-red fluorescence ratio
Chl
chlorophyll
ChlF
chlorophyll fluorescence
G
green
DAT
days after treatment induction
DM
dry matter; FLAV, flavonol-index
FRF
far-red fluorescence
Fo
ground fluorescence
Fm
maximum fluorescence
Fv/Fm
maximum quantum efficiency of photosystem II
H-2274
Solanum lycopersicum L. var. H-2274
Harzfeuer
Solanum lycopersicum L. F1 hybrid Harzfeuer
NBI
nitrogen balance index
PAM
pulse-amplitude-modulated chlorophyll fluorescence
RF
red fluorescence
SFR
simple fluorescence ratio
UV
ultraviolet
var.
variety

Conflicts of Interest

The authors declare no conflict of interest.

References

  1. Cuartero, J.; Bolarín, M.C.; Asíns, M.J.; Moreno, V. Increasing salt tolerance in the tomato. J. Exp. Bot. 2006, 57, 1045–1058. [Google Scholar] [CrossRef]
  2. Hunsche, M.; Bürling, K.; Saied, A.S.; Schmitz-Eiberger, M.; Sohail, M.; Gebauer, J.; Noga, G.; Buerkert, A. Effects of NaCl on surface properties, chlorophyll fluorescence and light remission, and cellular compounds of Grewia tenax (Forssk.) fiori and Tamarindus inidica L. leaves. Plant Growth Regul. 2010, 61, 253–263. [Google Scholar] [CrossRef]
  3. Hunsche, M.; Lankes, C.; Hoffstall, H.; Noga, G. Vegetative performance, leaf water potential, and partitioning of minerals and soluble sugars: Traits for ranking the NaCl-tolerance of tomato genotypes. Plant Growth Regul. 2010, 62, 151–162. [Google Scholar] [CrossRef]
  4. Gautier, H.; Lopez-Lauri, F.; Massot, C.; Murshed, R.; Marty, I.; Grasselly, D.; Keller, C.; Sallanon, H.; Génard, M. Impact of ripening and salinity on tomato fruit ascorbate content and enzyme activities related to ascorbate recycling. Funct. Plant Sci. Biotechnol. 2010, 4, 66–75. [Google Scholar]
  5. Incerti, A.; Navari-Izzo, F.; Pardossi, A.; Mensuali, A.; Izzo, R. Effect of sea water on biochemical properties of fruit of tomato (Lycopersicon esculentum Mill.) genotypes differing for ethylene production. J. Sci. Agric. 2007, 87, 2528–2537. [Google Scholar] [CrossRef]
  6. Cayuela, E.; Pérez-Alfocea, F.; Caro, M.; Bolarín, M.C. Priming of seeds with NaCl induces physiological changes in tomato plants grown under salt stress. Physiol. Plant. 1996, 96, 231–236. [Google Scholar] [CrossRef]
  7. Juan, M.; Rivero, R.M.; Romero, L.; Ruiz, J.M. Evaluation of some nutritional and biochemical indicators in selecting salt-resistant tomato cultivars. Environ. Exp. Bot. 2005, 54, 193–201. [Google Scholar] [CrossRef]
  8. Baker, N.R.; Rosenqvist, E. Applications of chlorophyll fluorescence can improve crop production strategies: An examination of future possibilities. J. Exp. Bot. 2004, 55, 1607–1621. [Google Scholar] [CrossRef]
  9. Bilger, W.; Schreiber, U.; Bock, M. Determination of the quantum efficiency of photosystem II and of non-photochemical quenching of chlorophyll fluorescence in the field. Oecologia 1995, 120, 425–432. [Google Scholar] [CrossRef]
  10. Lichtenthaler, H.K.; Lang, M.; Sowinska, M.; Heisel, F.; Miehé, J.A. Detection of vegetation stress via a new high resolution fluorescence imaging system. J. Plant Physiol. 1996, 148, 599–612. [Google Scholar] [CrossRef]
  11. Cerovic, Z.G.; Samson, G.; Morales, F.; Tremblay, N.; Moya, I. Ultraviolet-induced fluorescence for plant monitoring: Present state and prospects. Agronomic 1999, 19, 543–578. [Google Scholar] [CrossRef]
  12. Buschmann, C.; Lichtenthaler, H.K. Principles and characteristics of multi-colour fluorescence imaging of plants. J. Plant Physiol. 1998, 152, 297–314. [Google Scholar] [CrossRef]
  13. Morales, F.; Cerovic, Z.G.; Moya, I. Time-resolved blue-green fluorescence of sugar beet (Beta vulgaris L.) leaves. Spectroscopic evidence for the presence of ferulic acid as the main fluorophore of the epidermis. Biochim. Biophys. Acta 1996, 1273, 251–262. [Google Scholar] [CrossRef]
  14. Lichtenthaler, H.K.; Schweiger, J. Cell wall bound ferulic acid, the major substance of the blue-green fluorescence emission of plants. J. Plant Physiol. 1998, 152, 272–282. [Google Scholar] [CrossRef]
  15. Bürling, K.; Cerovic, Z.G.; Cornic, G.; Ducruet, J.-M.; Noga, G.; Hunsche, M. Fluorescence-based sensing of drought-induced stress in the vegetative phase of four contrasting wheat genotypes. Environ. Exp. Bot. 2013, 89, 51–59. [Google Scholar] [CrossRef]
  16. Leufen, G.; Noga, G.; Hunsche, M. Physiological response of sugar beet (Beta vulgaris) genotypes to a temporary water deficit, as evaluated with a multiparameter fluorescence sensor. Acta Physiol. Plant. 2013, 35, 1763–1774. [Google Scholar] [CrossRef]
  17. Kautz, B.; Noga, G.; Hunsche, M. Sensing drought- and salinity-imposed stresses on tomato leaves by means of fluorescence techniques. Plant Growth Regul. 2014. [Google Scholar] [CrossRef]
  18. Müller, V.; Lankes, C.; Schmitz-Eiberger, M.; Noga, G.; Hunsche, M. Estimation of flavonoid and centelloside accumulation in leaves of Centella asiatica L. Urban by multiparametric fluorescence measurements. Environ. Exp. Bot. 2013, 93, 27–34. [Google Scholar] [CrossRef]
  19. Bates, L.S.; Waldren, R.P.; Teare, I.D. Rapid determination of free proline for water stress studies. Plant Soil 1973, 39, 205–207. [Google Scholar] [CrossRef]
  20. Munné-Bosch, S.; Alegre, L. Changes in carotenoids, tocopherols and diterpenes during drought and recovery, and the biological significance of chlorophyll loss in Rosmarinus officinalis plants. Planta 2000, 210, 925–931. [Google Scholar] [CrossRef]
  21. Bürling, K.; Hunsche, M.; Noga, G. Quantum yield of non-regulated energy dissipation in PSII (Y(NO)) for early detection of leaf rust (Puccinia triticina) infection in susceptible and resistant wheat (Triticum aestivum L.) cultivars. Precis. Agric. 2010, 11, 703–716. [Google Scholar] [CrossRef]
  22. Kishor, K.P.B.; Sreenivasulu, N. Is proline accumulation per se correlated with stress tolerance or is proline homeostasis a more critical issue? Plant Cell Environ. 2014, 37, 300–311. [Google Scholar] [CrossRef]
  23. Santa-Cruz, A.; Acosta, M.; Rus, A.; Bolarin, M.C. Short-term salt tolerance mechanisms in differentially salt tolerant tomato species. Plant Physiol. Biochem. 1999, 37, 65–71. [Google Scholar] [CrossRef]
  24. Botella, M.A.; Rosado, A.; Breassan, R.A.; Hasegawa, P.M. Plant adaptive responses to salinity stress. In Plant Abiotic Stress; Jenks, M.A., Hasegawa, P.M., Eds.; Blackwell Publishing Ltd.: Berlin, Germany, 2005; pp. 37–70. [Google Scholar]
  25. Chinnusamy, V.; Zhu, J.-K. Plant salt tolerance. In Plant Responses to Abiotic Stress; Hirt, H., Shinozaki, K., Eds.; Springer: Berlin/Heidelberg, Germany, 2004; pp. 241–270. [Google Scholar]
  26. Takagi, H. Proline as a stress protectant in yeast: Physiological functions, metabolic regulations, and biotechnological applications. Appl. Microbiol. Biotechnol. 2008, 81, 211–223. [Google Scholar] [CrossRef]
  27. Kumar, S.G.; Reddy, A.; Sudhakar, C. NaCl effects on proline metabolism in two high yielding genotypes of mulberry (Morus alba L.) with contrasting salt tolerance. Plant Sci. 2003, 165, 1245–1251. [Google Scholar] [CrossRef]
  28. Li, G.; Wan, S.; Zhou, J.; Yang, Z.; Qin, P. Leaf chlorophyll fluorescence, hyperspectral reflectance, pigments content, malondialehyde and proline accumulation responses of castor bean (Ricinus communis L.) seedlings to salt stress levels. Ind. Crop Prod. 2010, 31, 13–19. [Google Scholar]
  29. Havaux, M. Stress tolerance of photosystem II in vivo. Plant Physiol. 1992, 100, 424–432. [Google Scholar] [CrossRef]
  30. Lu, C.; Qiu, N.; Lu, Q.; Wang, B.; Kuang, T. Does salt stress lead to increased susceptibility of photosystem II to photoinhibition and changes in photosynthetic pigment composition in halophyte Suaeda salsa grown outdoors. Plant Sci. 2002, 163, 1063–1068. [Google Scholar] [CrossRef]
  31. Buschmann, C.; Langsdorf, G.; Lichtenthaler, H.K. Imaging of the blue, green, and red fluorescence emission of plants: An overview. Photosynthetica 2000, 38, 483–491. [Google Scholar] [CrossRef]
  32. Bilger, W.; Veit, M.; Schreiber, L.; Schreiber, U. Measurement of leaf epidermal transmittance of UV radiation by chlorophyll fluorescence. Physiol. Plant. 1997, 101, 754–763. [Google Scholar] [CrossRef]
  33. Tremblay, N.; Wang, Z.; Cerovic, Z.G. Sensing crop nitrogen status with fluorescence indicators. A review. Agron. Sustain. Dev. 2012, 32, 451–464. [Google Scholar] [CrossRef]
  34. Gitelson, A.A.; Buschmann, C.; Lichtenthaler, H.K. The chlorophyll fluorescence ratio F735/F700 as an accurate measure of the chlorophyll content in plants. Remote Sens. Environ. 1999, 69, 296–302. [Google Scholar] [CrossRef]
  35. Lichtenthaler, H.K.; Rinderle, U. The role of chlorophyll fluorescence in the detection of stress conditions in plants. Crit. Rev. Anal. Chem. 1998, 19, 29–85. [Google Scholar] [CrossRef]
  36. Lichtenthaler, H.K. Vegetation stress: An introduction to the stress concept in plants. J. Plant Physiol. 1996, 148, 4–14. [Google Scholar] [CrossRef]
  37. Buschmann, C. Variability and application of the chlorophyll fluorescence emission ratio red/far-red of leaves. Photosynth. Res. 2007, 92, 261–271. [Google Scholar] [CrossRef]
  38. Cerovic, Z.G.; Goutouly, J.-P.; Hilbert, G.; Destrac-Irvine, A.; Martinon, M.; Moise, N. Mapping winegrape quality attributes using portable fluorescence-based sensors. In Proceedings of the FRUTIC 09, Conception, Chile, Progap INIA, Santiago, Chile, January 2009; Best, S., Ed.; Instituto de Investigaciones Agropecuarias: Santiago, Chile, 2009; pp. 301–310. [Google Scholar]
  39. Bhivare, V.N.; Nimbalkar, J.D. Salt stress effects on growth and mineral nutrition of French beans. Plant Soil 1984, 80, 91–98. [Google Scholar] [CrossRef]
  40. Maggio, A.; Raimondi, G.; Martino, A.; de Pascale, S. Salt stress response in tomato beyond the salinity tolerance threshold. Environ. Exp. Bot. 2007, 59, 276–282. [Google Scholar] [CrossRef]

