Article

Effect of Different Feed Structures and Bedding on the Horizontal Spread of Campylobacter jejuni within Broiler Flocks

1
Nofima, Norwegian Institute of Food, Fisheries and Aquaculture Research, 1430 Ås, Norway
2
Department of Animal and Aquacultural Sciences, Norwegian University of Life Sciences, 1432 Ås, Norway
3
Department of Chemistry, Biotechnology and Food Science, Norwegian University of Life Sciences, 1432 Ås, Norway
4
Centre for Ecological and Evolutionary Synthesis, University of Oslo, 0316 Oslo, Norway
*
Author to whom correspondence should be addressed.
Agriculture 2013, 3(4), 741-760; https://doi.org/10.3390/agriculture3040741
Submission received: 15 July 2013 / Revised: 10 October 2013 / Accepted: 20 October 2013 / Published: 30 October 2013
(This article belongs to the Special Issue Food Safety Management and Poultry Production)

Abstract

:
In this study, we investigated the effects of different feed structures and beddings on the spread of C. jejuni in broiler flocks, and the effect on the cecal microbiota. Broiler chickens raised in 24 eight-bird group cages on either rubber mat or wood shavings were fed either a wheat-based control diet (Control), a diet where 50% of the ground wheat was replaced by whole wheat prior to pelleting (Wheat), or a wheat-based diet, such as the control diet diluted with 12% oat hulls (Oat). Samples from the cloacal mucosa of all birds were taken daily for C. jejuni quantification and cecum samples were collected at the end of the experiment for C. jejuni quantification and microbiota analyses. We have shown a statistically significant effect of increased feed structure on the reduced spread of C. jejuni in chicken flocks, but no significant differences were detected between types of structure included in the feed. No significant changes in the dominating microbiota in the lower lower gastrointestinal (GI) tract were observed, which indicates that feed structure only has an effect on the upper GI tract. Delaying the spread of C. jejuni in broiler flocks could, at time of slaughter, result in fewer C. jejuni-positive broilers.

Graphical Abstract

1. Introduction

Campylobacter spp. is a leading cause of bacterial food-borne gastroenteritis in humans in the developed world [1,2]. Most cases of campylobacteriosis are caused by Campylobacter jejuni [3,4]. C. jejuni is zoonotic, with a low infection dose needed for disease, and poultry is an important source for human infections [4,5,6,7]. C. jejuni spreads rapidly within broiler flocks through horizontal transmission. The prevalence within the flock may increase from <5% to >95% in a week [8,9,10]. The principal site of colonization is the lower gastrointestinal (GI) tract, especially in the cecum [5,11,12,13]. The C. jejuni positive broiler flocks can cause carcass contamination during slaughter [14,15] with a high risk of cross-contamination to other food products at the consumer level [9]. In order to reduce the colonization of C. jejuni in poultry, there have been major intervention efforts targeting the lower GI tract [16]. However, few efforts have been on modifying the upper GI tract in order to combat C. jejuni colonization in lower GI tract. The chicken has several natural barriers in the upper GI track to kill pathogens. The crop contains lactic acid bacteria [17], and the gizzard contains hydrochloric acid to aid digestion of the feed and may also have a sterilizing effect where food-pathogens might get killed time dependently in the acid environment [18]. Huang et al. [19] proposed that the gizzard may be a critical control point for reducing Salmonella contamination in growing broilers, and we have recently shown that a stimulated gizzard delays the horizontal spread of C. jejuni in broiler flocks [20]. Inclusions of hulls or whole cereals in feed have been shown to modify the upper GI tract of broilers, with increased gizzard weights and lower pH levels [21]. It has also been shown that birds eat or may eat litter, and that the extent to which birds eats litter is dependent on the amount of structural components in the diet [22,23]. Structural components in the diet may therefore also affect horizontal spread of pathogens through a smaller consumption of litter material.
The aim of this work was to investigate the effects of different feed structures and beddings (with or without litter) on the spread of C. jejuni in broiler flocks and the effect on the cecal microbiota. Our hypothesis is that modification of the upper GI tract increases the killing of pathogens entering the gizzard, without influencing the dominating microbiota in the lower digestive track. To investigate the effect on the total microbiota in the lower GI track we performed in depth 16S rRNA gene sequencing (pyrosequencing) on selected cecum samples as well as real-time PCR to quantify some well-known gut-bacteria.

2. Materials and Methods

2.1. Experimental Design

One-day-old broiler male chickens (Ross 308) were raised on commercial starter feed. At 7 days of age, the chickens were divided into three different groups of feed structure. They were given control diet (ground wheat, Control), a diet where 50% ground wheat was replaced by whole wheat (Wheat) prior to pelleting, or the control diet diluted with 12% oat hulls (Oat). All feeds were pelleted through a 3 mm pellet press, and produced at Centre for Feed Technology (Ås, Norway). Diet composition is shown in Table S1. In addition, four cages for each diet were covered by a rubber mat (non-litter floor), while the other four cages were covered with wood shavings (litter floor). Rubber mats were washed every day, by the use of a cleaning brush, to reduce the chickens’ contact with manure. There were a total of six treatments with four parallels of each treatment, in total 24 cages with 8 chickens per cage, in a 3 × 2 factorial experiment with diet and bedding as factors. All in vivo experiments were in accordance with guidelines approved by the Norwegian governmental committee for experimental animals [24].
Chickens and feed were weighed on a weekly basis during the experimental period. Analysis of variance (ANOVA) was performed using the GLM procedure of SAS 9.2 software [25] for detection of significant changes in weight gain, feed consumption, and feed/weight gain ratio.

2.2. Challenge Strains

C. jejuni strains used for infection in these experiments were strain C484 (isolated from poultry leg [26]), G109 (isolated from cecal dropping [27]), and G125 (isolated from dog feces [27]). All three strains have earlier shown to be able to colonize chickens [28]. Preparation of challenge strains and inoculation of chickens were as described by Moen et al. [20]. Briefly, the strains were grown micro-aerobically at 42 °C for 48 h in Mueller-Hinton broth (Oxoid Ltd., Basingstoke, UK), and then diluted into buffered peptone water (BPW) and incubated at 38 °C for 24 h. Over-night cultures of all strains were mixed 1:1:1. One chicken per cage, called the infected chicken, was inoculated orally with the Campylobacter mix at 32 days of age as described by Moen et al. [20]. The mixture of challenge strains contained approximately lg 4 cfu mL−1. Chickens challenged with C. jejuni appeared healthy and showed no signs of disease.

2.3. Sample Preparation

Cloacal swabs were used for pre-inoculation control of birds and for post-inoculation detection of C. jejuni. The cloacal mucosa of all birds in each cage was swabbed on days 1, 2, 3, 4, and 5 post-inoculation (pi) and once immediately before inoculation. Cloacal swabs were put into separate tubes with 5 mL of Campylobacter growth broth and incubated under micro aerobic conditions at 42 °C for 48 h. This incubation step was performed in order to increase the detection limit of C. jejuni. 500 mL of Campylobacter growth broth consisted of 475 mL Nutrient broth no. 2 (CM0067; Oxoid) supplemented with 25 mL Laked Horse Blood (SR0048C, Oxoid), one ampule of Campylobacter Growth Supplement (SR0232, Oxoid), and one ampule of CCDA Selective Supplement (SR0155, Oxoid).
Four random (the infected chicken not included) cecum samples per cage were collected the day of slaughter (Day 7 pi), and frozen immediately after sampling. The pH in gizzard was measured at Day 7 pi.

2.4. DNA Isolation

For cecum samples, swabs with cecal lumen contents were separately mixed with 1 mL of Solution 1 (25 mM Tris-HCl pH 8.0, 10 mM EDTA pH 8.0). For pre-inoculation control and detection of C. jejuni post-inoculation from cloacal swabs, 150 µL of Campylobacter growth broth was diluted 1:4 in 4 M guanidinium thiocyanate (GTC), and all samples were lysed by mechanical lysis (FastPrep®, Qbiogene Inc., Carlsbad, CA, USA). Isolation and purification of DNA was further performed using an automated procedure with silica particles (Bioclone Inc., San Diego, CA, USA) as described earlier by Skånseng et al. [28].
Bacterial cultures (see Table S2) were homogenized with use of FastPrep®, and DNA was isolated with use of DNeasy Blood & Tissue Kit (Qiagen GmbH, Hilden, Germany) following the manufacturer’s protocol. DNA from these cultures was used for testing of specificity for Lactobacillus spp. primers and probe designed for use in this experiment (see Section 2.7.2).

2.5. C. jejuni Detection

Quantification of C. jejuni was performed relative to the total microbiota [29] in cecum samples (Day 7 pi) using real-time PCR. For the cloacal swabs (after enrichment) the detection of C. jejuni was performed using only the C. jejuni-specific primer/probe set.
Universal 16S rDNA primers and probe [30] was used for quantification of the total microbiota. C. jejuni-specific real-time PCR was performed using the primer/probe set described by Nogva et al. [31]. The real-time PCR reaction mixture contained 1× Hot Start Buffer (Finnzymes Oy, Espoo, Finland), 0.5 µM ROX reference dye (Invitrogen, Carlsbad, CA, USA), and 200 µM dNTP mix. Universal 16S rDNA real-time PCR contained 0.2 µM of each primer, 0.1 µM probe, 1 U DyNAzyme™ II Hot Start DNA Polymerase, and 0.5 µL DNA in a 25 µL PCR reaction. C. jejuni-specific real-time PCR reactions contained 0.3 µM of each primer, 0.02 µM probe, 1 U DyNAzyme™ II Hot Start DNA Polymerase (Finnzymes) and 2 µL DNA in a 25 µL reaction. The amplification profile was 40 cycles of 95 °C for 30 s and 60 °C for 1 min, with an initial heating step of 94 °C for 10 min. The reactions were performed in an ABI PRISM® 7900 HT Sequence Detection System (Applied Biosystems, Foster City, CA, USA) and the data were analyzed using the SDS 2.2 Software [32].
In six of 24 cages, the infected chicken did not test positive for C. jejuni. Results from these six cages were not used in the analysis on spread of C. jejuni. Chi-square tests (SYSTAT 12 [33]) were performed for each day to see whether there were differences with respect to C. jejuni-positive and C. jejuni-negative birds between the feeding regimes. The p-values were computed for the homogeneity tests (chi-square tests). There are 3 models: first an “unfolded design” with 6 experimental levels (Control/Wood, Control/Rubber, Oat/Wood, Oat/Rubber, Wheat/Wood, Wheat/Rubber) and the 2 levels of the microbiological test (Positive/Negative) (Model 1). In the second model the results for Wood and Rubber have been summed together, leaving 3 experimental levels (Control, Oat, Wheat) (Model 2). In the third model the results for Control, Oat, and Wheat have been summed together, leaving 2 experimental levels (Wood, Rubber) (Model 3). The second and third models are conceptually related to testing the main effects in an ANOVA (the first model, however, is not related to ANOVA-interactions). All three models were analyzed separately for each day (Day 2–5 pi.).

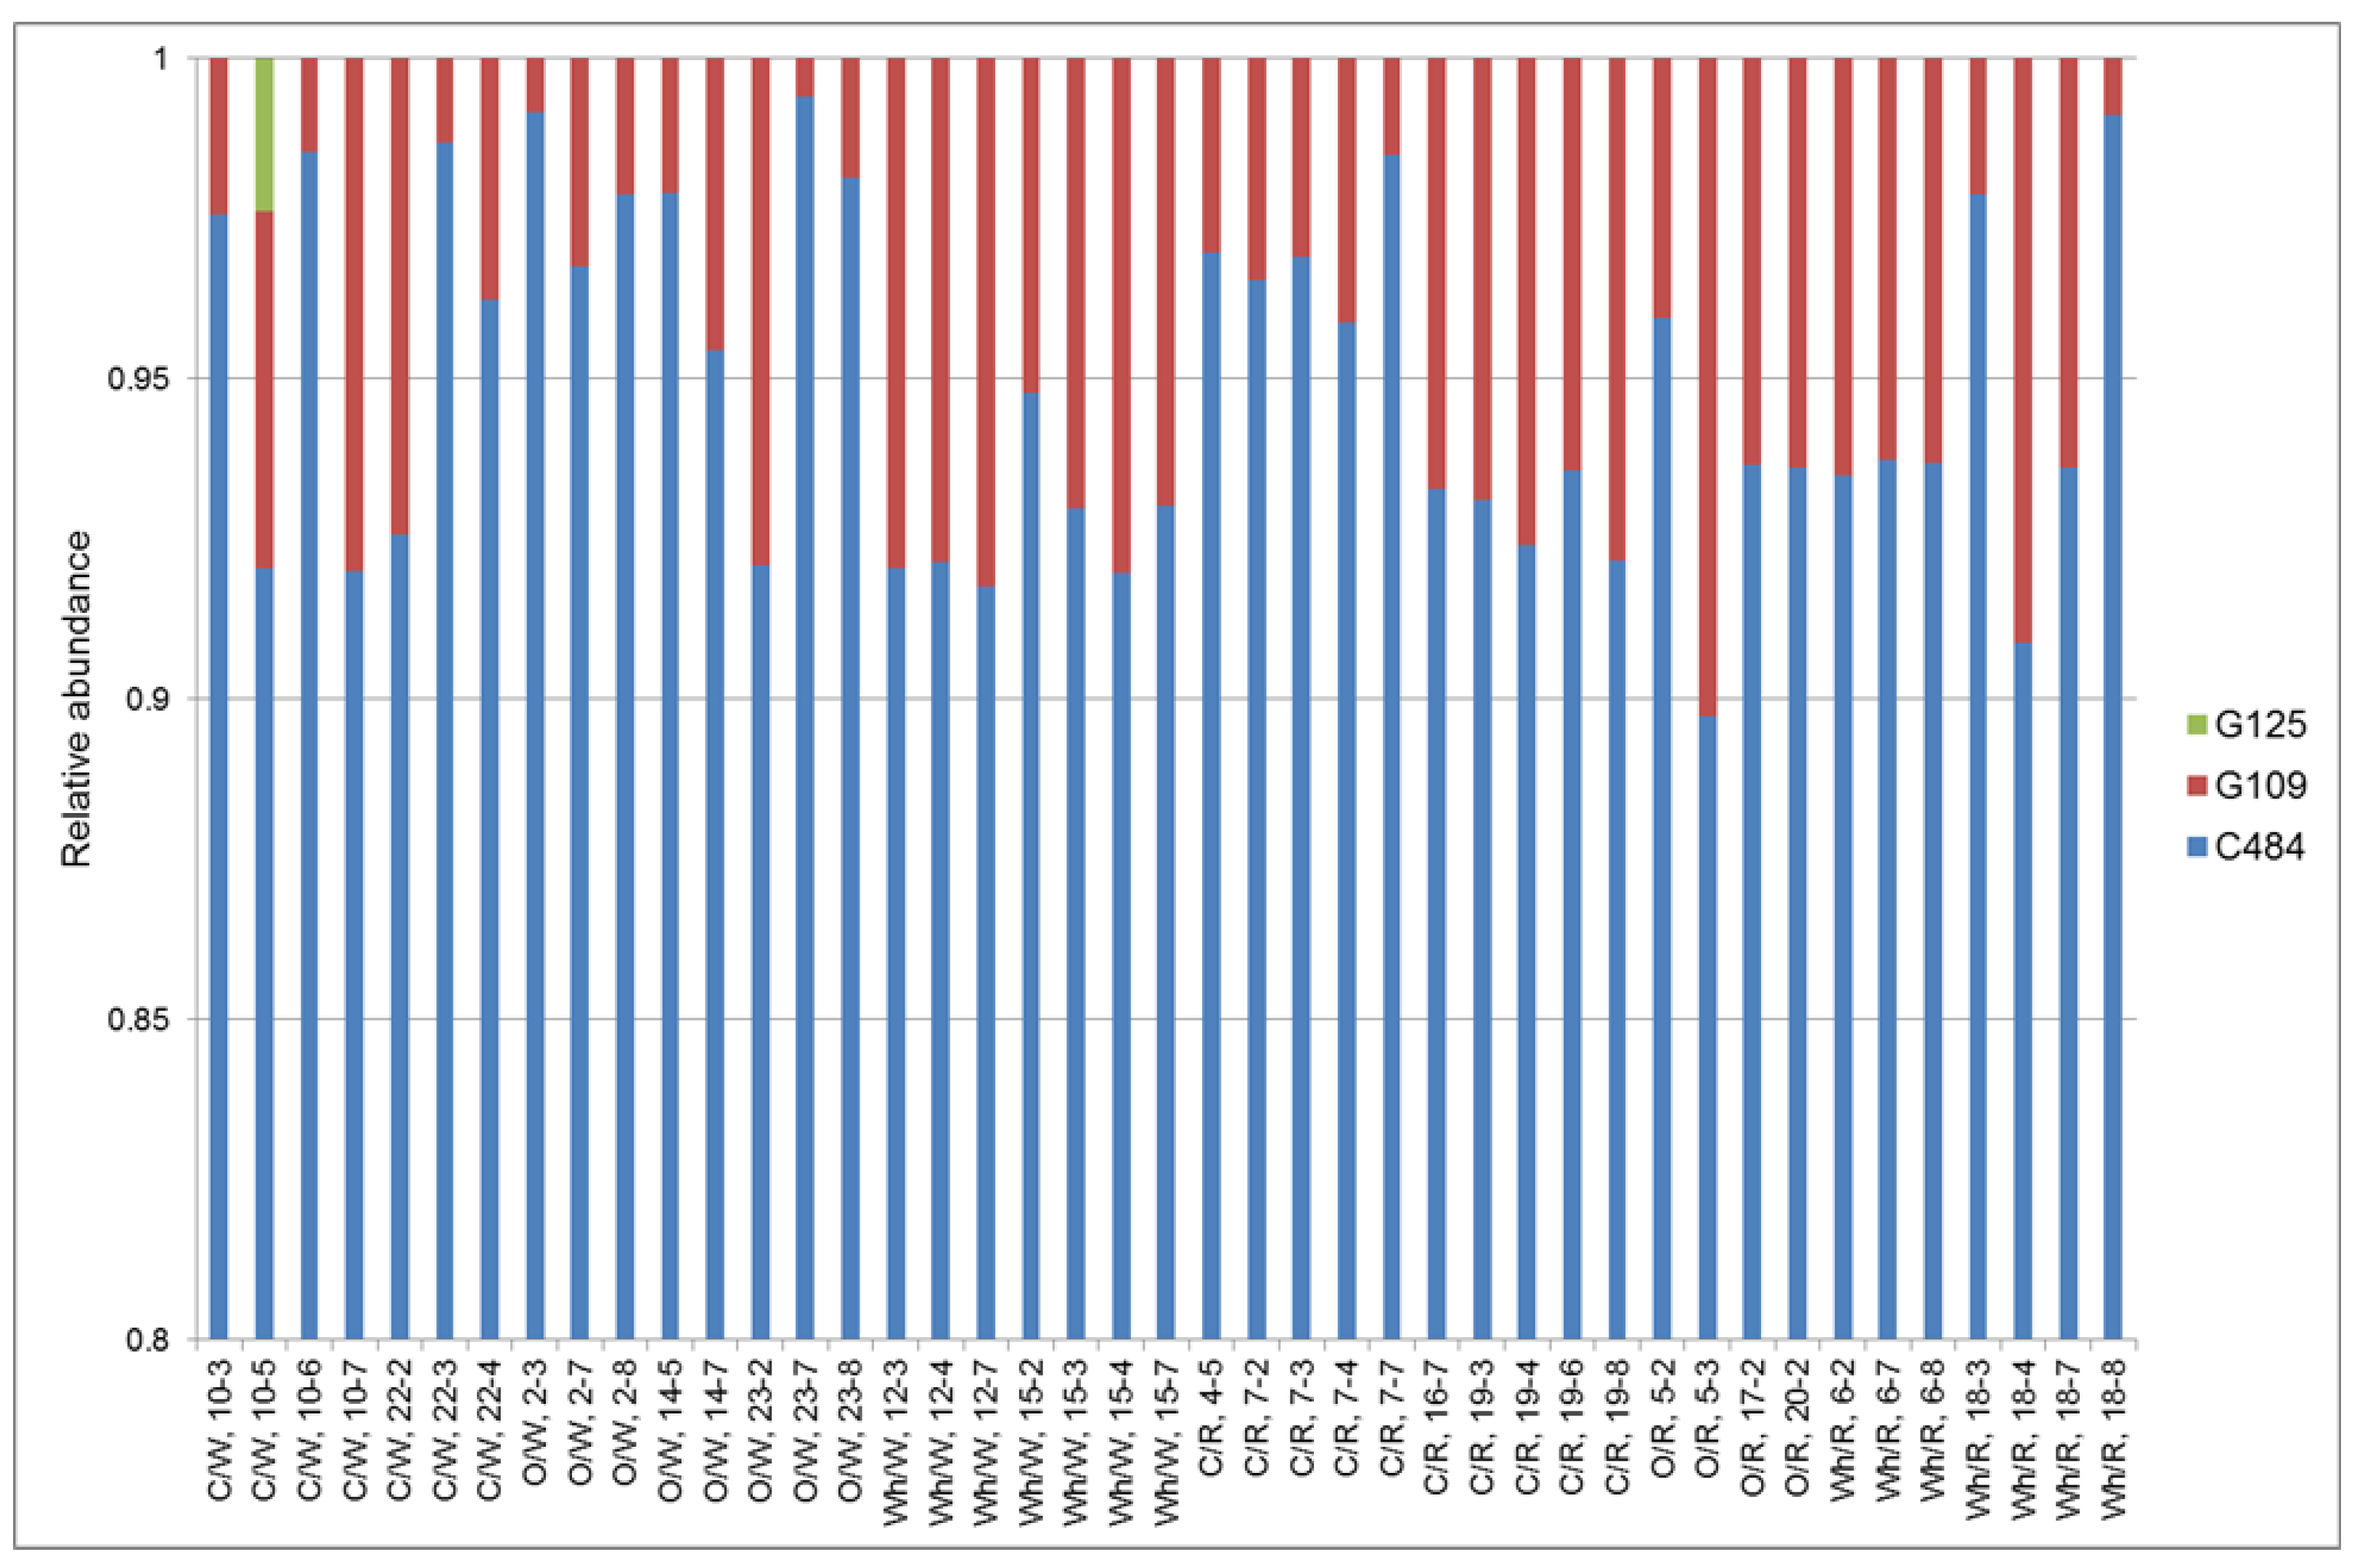
2.6. Typing of Colonizing C. jejuni Strain

Amplification of the C. jejuni gltA genes in the cecum samples from the experimental infection was performed using glt1F and glt1R [34]. The PCR amplification reactions contained 1× Hot Start Buffer (Finnzymes), 200 µM dNTP mix, 1U DyNAzyme II Hot Start DNA Polymerase (Finnzymes), 0.2 µM of each primer, and 1 µL DNA in a 25 µL reaction. The amplification profile was an initial step of 94 °C for 10 min, then 35 cycles of 94 °C for 30 s, 50 °C for 2 min, and 72 °C for 30 s, and a final extension at 72 °C for 7 min.
The PCR products were purified before sequencing, using 0.4 µL of ExoSap-IT (USB Corp., Cleveland, OH, USA) to 5 µL of PCR product. Thermal profile was 37 °C for 30 min and 80 °C for 15 min. The sequencing reaction contained 0.75× BigDye® v1.1/3.1 Sequencing Buffer (Applied Biosystems, Foster City, CA, USA), 1 µL BigDye® Terminator v1.1 Cycle Sequencing Kit, 0.25 µM of primer glt1F, and 1 µL of purified PCR product in a 10 µL reaction. The sequencing reactions were carried out in 25 cycles of 96 °C for 15 s, 50 °C for 10 s, and 60 °C for 4 min. A BigDye XTerminator Purification Kit (Applied Biosystems) was used according to the manufacturer’s recommendations to clean up the sequencing reactions. Sequencing was performed on an ABI PRISM 3130xl Genetic Analyzer (Applied Biosystems).
The relative proportions of C. jejuni strains were determined by multivariate decomposition of mixed gltA gene sequence electropherograms according to the direct PLSR method, as previously described [35].

2.7. Microbiota Analyses in Cecum

2.7.1. Pyrosequencing

Two cecum samples from each cage (in total 48 samples) were submitted for pyrosequencing. Amount of purified DNA was measured by NanoDrop ND-1000 (NanoDrop Technologies Inc., Wilmington, DE, USA) and diluted to the appropriate concentration of 10–20 ng/µL. Two µL of DNA was amplified by PCR using 16S rRNA gene primers, forward primer (5′-AYTGGGYDTAAAGNG-3′) and reverse primer (5′-TACNVGGGTATCTAATCC-3′) (RDP (Ribosomal Database Project [36])), producing a 240 bp fragment covering the variable region V4 in 16S rRNA genes. PCR reactions were performed using 50 µL (final volume) mixtures containing 1× FastStart Buffer #2 (Roche Ltd., Basel, Switzerland), 0.2 mM dNTP mix, 0.4 µM of each primer and 2.5 U FastStart HiFi Polymerase (Roche). The amplification protocol was 94 °C for 4 min, followed by 35 cycles of 94 °C for 50 s, 40 °C for 30 s and 72 °C for 1 min, and a final elongation step at 72 °C for 5 min. Purification of PCR products were performed using Agencourt AMPure PCR purification (Beckman Coulter Inc., Danvers, MA, USA). Concentrations of DNA were measured with use of Quant-iT PicoGreen dsDNA Assay Kit (Invitrogen), and the samples were pooled before running an emulsion-based clonal amplification (emPCR amplification, Roche). All samples were run as multiplex on the same picotiter plate in the GS Junior System (Roche) using nucleotide barcodes on primers as described on the RDP website.
The output sequences and the quality score file was processed together with the mapping file using the QIIME 1.4.0 (Quantitative Insights Into Microbial Ecology) pipeline. QIIME is an open source software package for comparison and analysis of microbial communities, primarily based on high-throughput amplicon sequencing data (such as SSU rRNA) [37]. The multiplexed reads were assigned to starting samples based on their nucleotide barcode, key tag, and primers were trimmed and sequences of low quality were removed. The sequences were clustered into Operational Taxonomic Units (OTUs) based on their sequence similarity using a 97% similarity threshold. Representative sequences for each OTU was identified and assigned to taxonomic identities using the RDP classifier. The representative sequence set was aligned using Python Nearest Alignment Space Termination (PyNAST) (default in QIIME), filtered and a phylogenetic tree and OUT table (abundance in each sample) was generated. Beta diversity (the change in species composition across geographical space) between samples were calculated by weighted (quantitative) and unweighted (qualitative) UniFrac [38,39]. UniFrac is a method to calculate a distance measure between organismal communities using phylogenetic information, and is widely used in metagenomics. The resulting distance matrices were visualized in 2-dimensional PCoA plots [40].

2.7.2. Real-Time Quantification of Specific Bacterial Groups

TaqMan PCR was used for detection of changes in relative amounts of specific bacteria in cecum samples (Day 7 pi). Samples were tested for Bifidobacterium spp. [41], Cl. perfringens [29], Enterococcus spp., and E. coli [42]. Lactobacillus spp. specific probe was designed for this study using Primer Express v3.0 based on 16S rRNA gene of lactobacilli, the FAM-TAMRA probe was (5′-FAM-CGGCTAACTACGTGCCAGCAGC-TAMRA-3′). The sequence of forward primer was (5′-AGCAGTAGGGAATCTTCCA-3′ [43]), and reverse primer (5′-CAC CGC TAC ACA TGG AG-3′; [44]). Primer and probe were tested for specificity to Lactobacillus spp., see Table S1 in Supporting Materials for results.
All real-time PCR reactions were performed as for C. jejuni (see Section 2.5). ANOVA of the quantitative data for all bacterial groups tested, were performed using the GLM procedure of SAS 9.2 software [25]. Tukey’s Studentized Range Test was used for grouping the treatments that were not significantly (α = 0.05) different from each other.

3. Results

3.1. Horizontal Spread of C. jejuni within Chicken Flocks

Increased feed structure (inclusion of oat hulls and whole wheat) delayed the spread of C. jejuni in broiler flocks (Table 1 and Table 2). This effect was particularly strong in birds kept on rubber mats, as indicated by a significant interaction effect. At Day 3–5 pi, there was a statistically significant difference in the spread of C. jejuni between chickens given different feeds, with the highest spread in flocks given control diet. The effect of bedding was only statistically significant at Day 5 pi, where the spread was lower in birds on rubber mats. Only at Day 4 pi, with rubber mat as bedding, a statistically significant difference (p = 0.004) between diets oat hulls and whole wheat was revealed by the chi-square model.
Table 1. Spread of C. jejuni in broiler flocks by time-points (Day 2–5 post-inoculation) for the different treatment groups based on cloacal swabs. The infected chicken is not included in the table.
TreatmentCage aDay 2 piDay 3 piDay 4 piDay 5 pi
FeedBeddingPositiveTotalPositiveTotalPositiveTotalPositiveTotal
ControlWood207273747
407274767
Sum0144147141014
OatWood107275777
307172747
407071737
Sum021 a3218211421
WheatWood107070727
207072756
307074767
Sum021 a0216211320 b
ControlRubber107176777
227376767
307172626
407277777
Sum2287282127 b2227
OatRubber107070727
307070707
407070717
Sum021 a0210 c21321
WheatRubber107073747
207070707
307074747
Sum021 a0217 c21821
Total 2126141264912570124
a Originally there were 4 cages included for each combination of feed and bedding. Due to that the infected chicken in some of the cages did not test positive for C. jejuni after being experimentally infected, these cages were further excluded from the study; b The total number of chickens are reduced because of death of chickens in two cages; c There were found statistically significant (p = 0.004) differences in spread of C. jejuni between chickens fed oat hulls and whole wheat on rubber mat at Day 4 pi.
Table 2. P-values for the effect of feed and bedding for the spread of C. jejuni in broiler flocks, using chi-square test.
Days Post-InoculationP-values
Feed × Bedding aFeed bBedding c
Day 2 pi0.2120.1310.202
Day 3 pi0.0070.0010.896
Day 4 pi<0.001<0.0010.578
Day 5 pi<0.0010.0020.030
The p-values were calculated as described in Materials and Methods using three different models: a Model 1; b Model 2 and c Model 3.

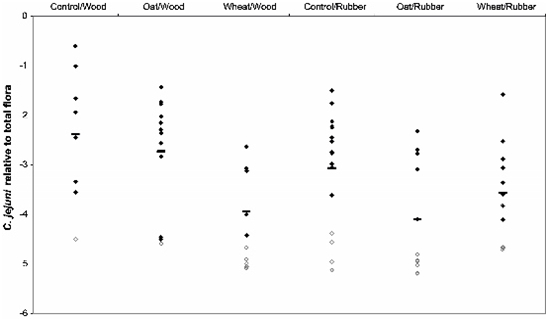
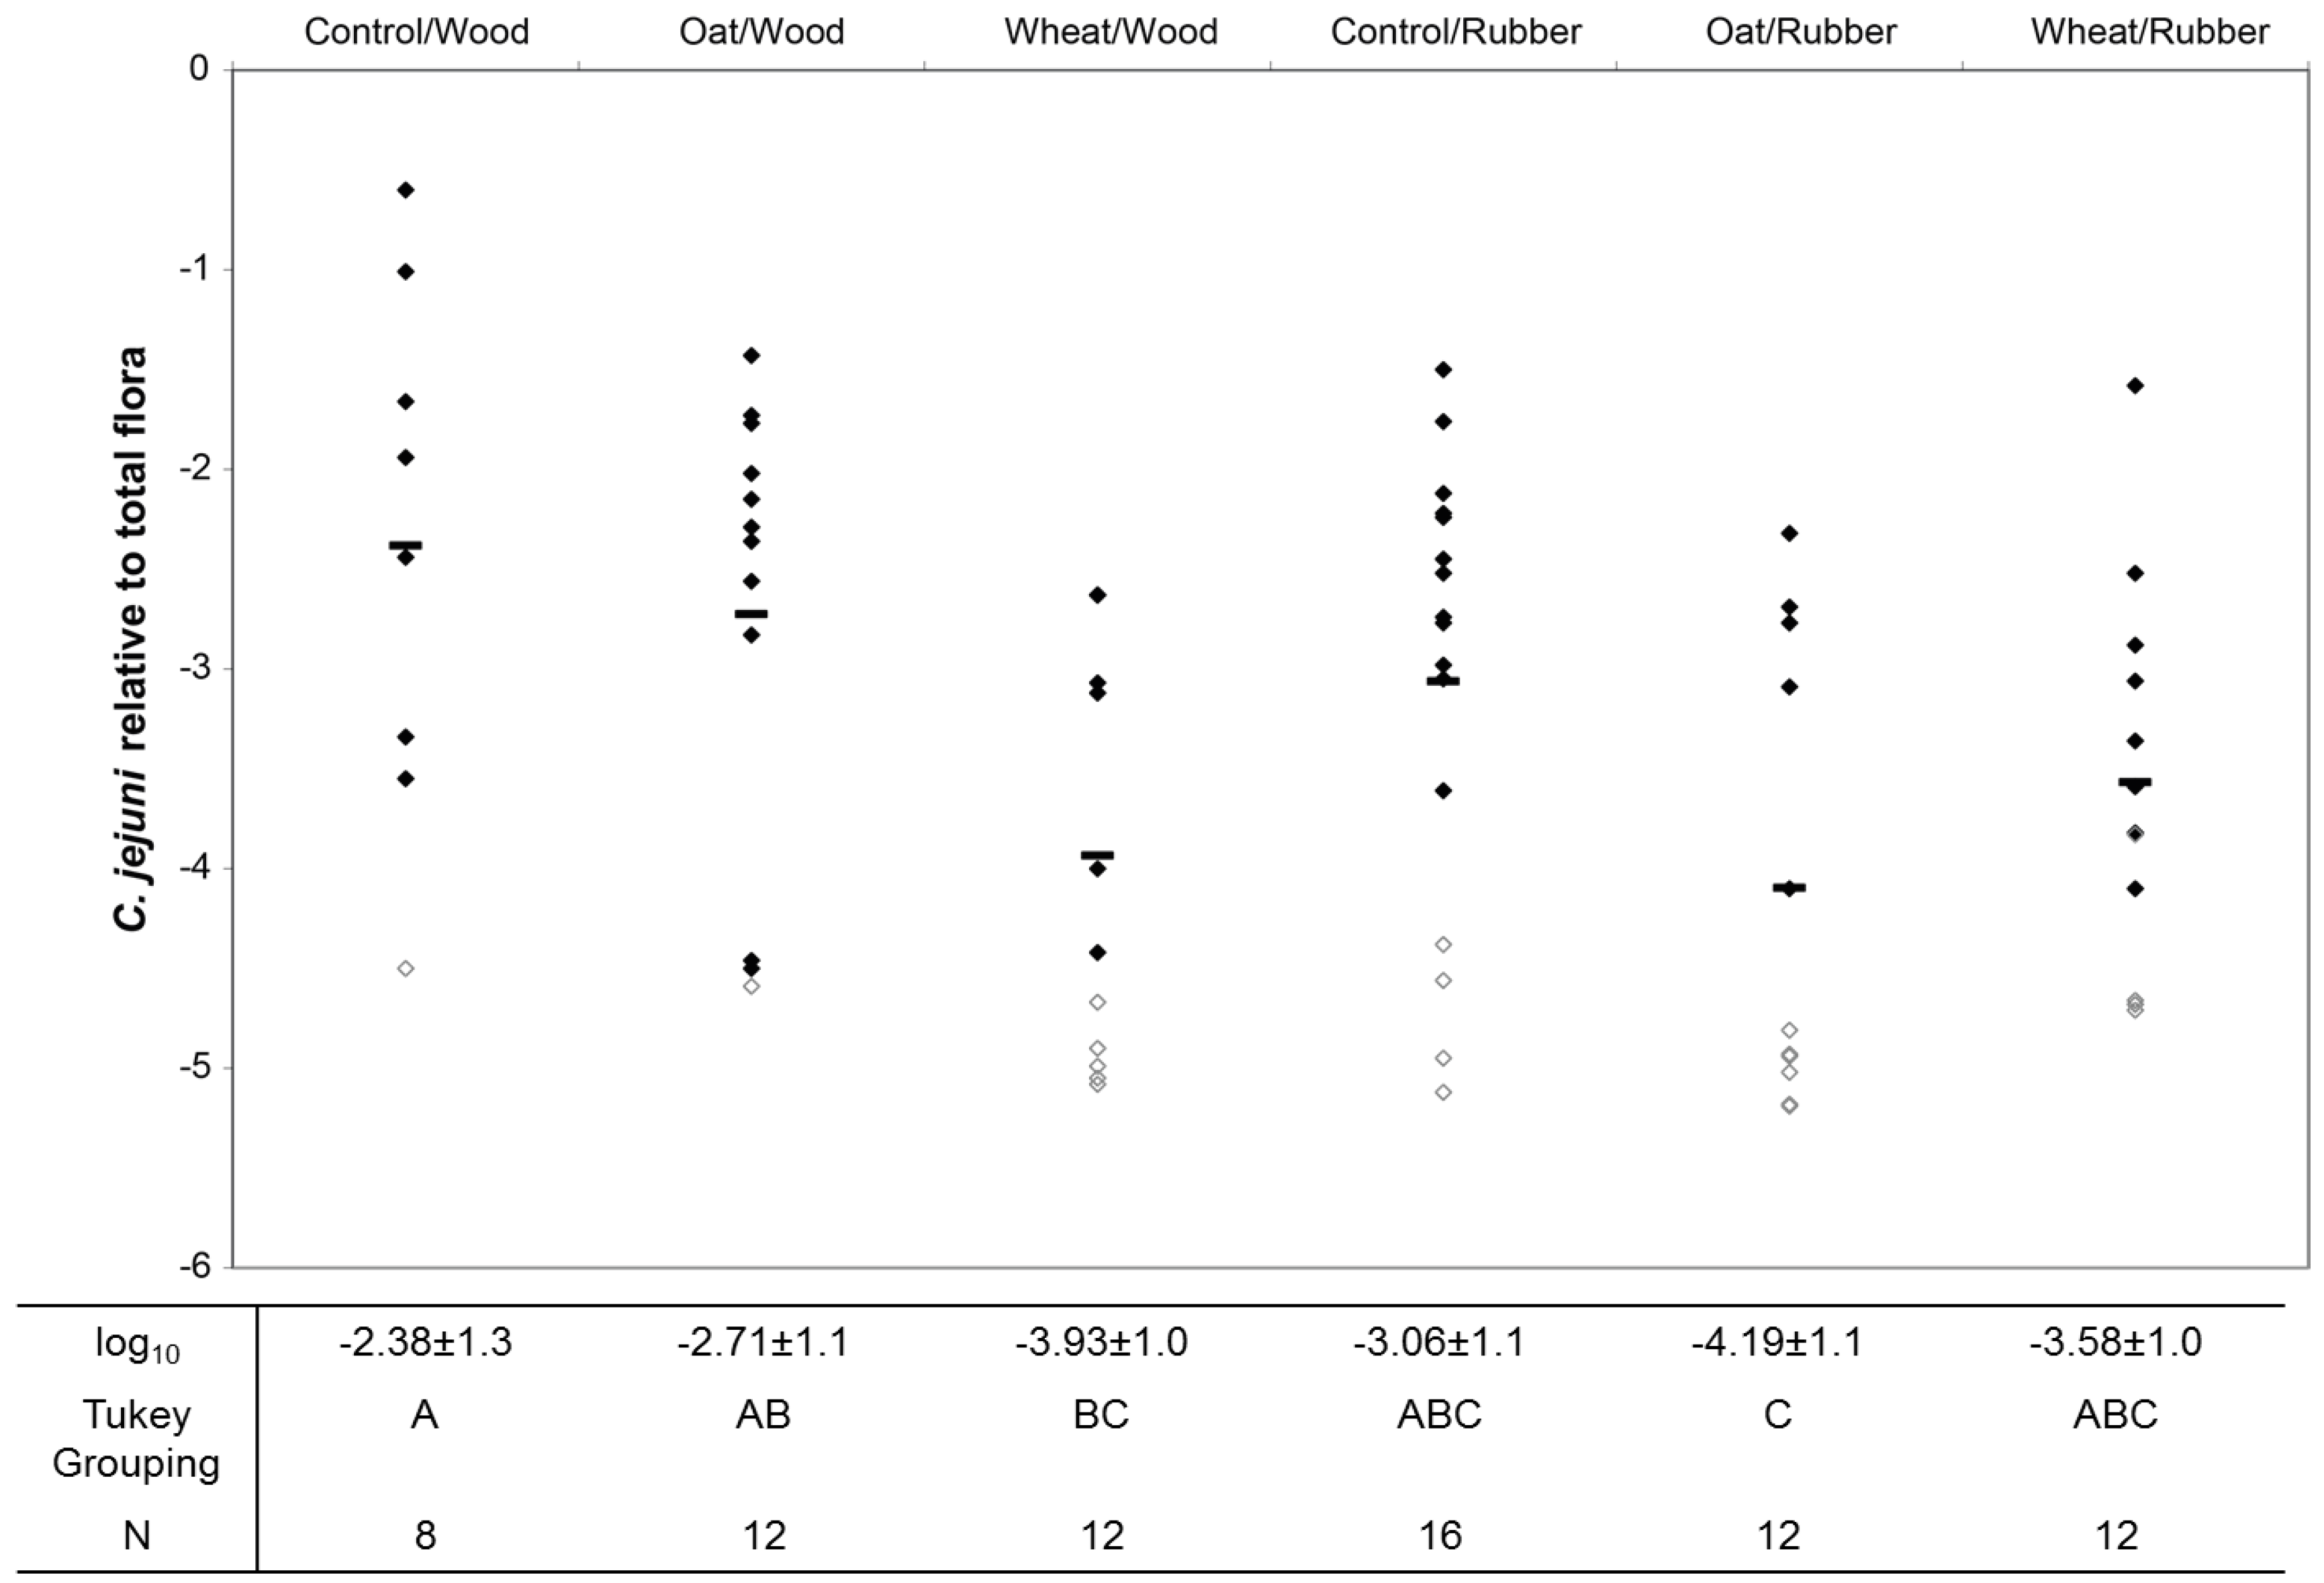
3.2. Colonization Levels of C. jejuni in Cecum

Colonization level of C. jejuni in cecum at the end of the study (Day 7 pi) is shown in Figure 1. There was a statistically significant (p = 0.009) effect of diet (control, oat hulls and whole wheat) on the mean colonization level of C. jejuni relative to the total microbiota, with the highest levels in chickens given control feed. Comparing the two types of feed structure (oat hulls and whole wheat), statistically significant (p = 0.01) differences in colonization levels were only found for chickens on wood shavings, where chickens fed oat hulls had the highest number (lg (−2.71 ± 1.1) relative to total microbiota). There was a lower amount of C. jejuni relative to total microbiota in chicken cecum in birds raised on rubber mat than on wood shavings (mean colonization level of lg (−3.55 ± 1.2) vs. lg (−3.08 ± 1.3), p = 0.03).
Figure 1. C. jejuni relative to the total microbiota in cecum Day 7 pi. Mean colonization value in graph is marked with (−), samples with no detected C. jejuni has the detection limit marked in grey (CT-value are set to 40 for calculation of the detection limit of the specific sample). Table below the graph shows mean colonization value with standard deviation, Tukey Grouping for treatment groups with the same letter are not significantly different, and number of samples (N) in each treatment group. Results are based on four cecum samples per cage, and cages where the infected chicken tested negative for C. jejuni during the study are not included in this figure.
Agriculture 03 00741 g001
The distribution of colonizing C. jejuni strains in cecum of positive chickens at Day 7 pi is shown in Supplementary Figure S1. We found that C. jejuni strain C484 dominated the Campylobacter flora in cecum independent of diet and bedding, with a relative abundance of approximately 90% in all chickens.

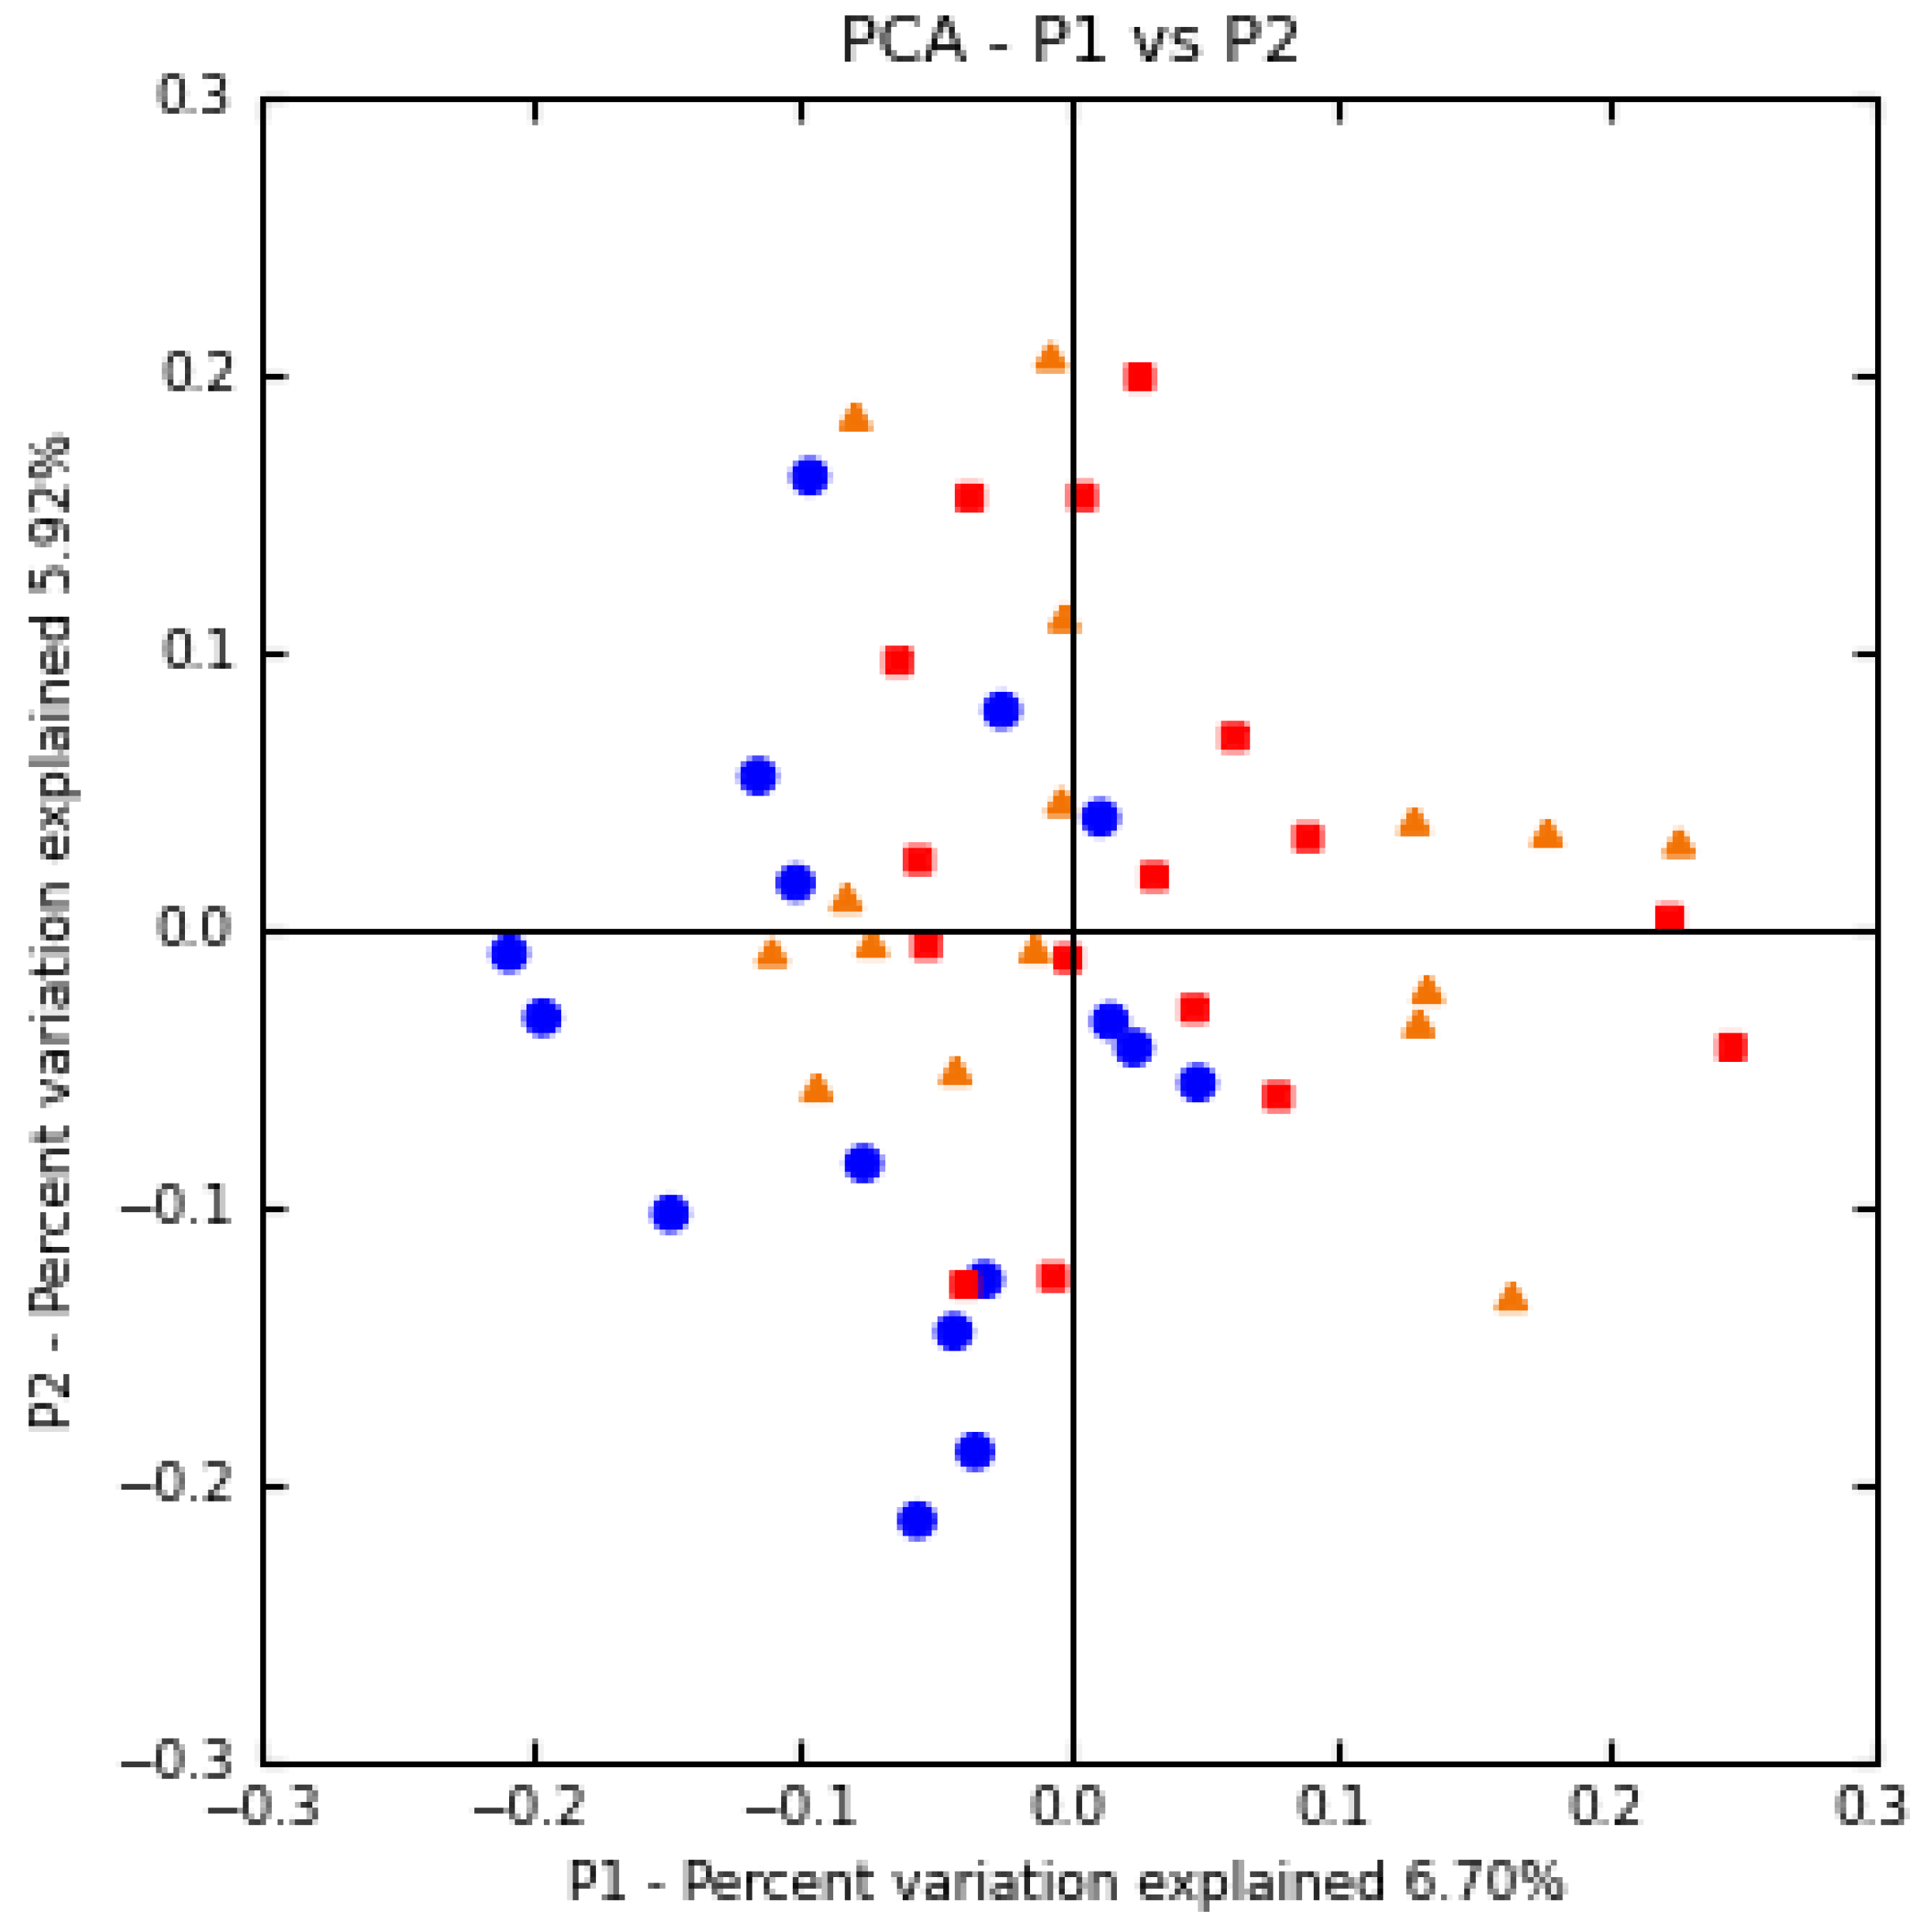
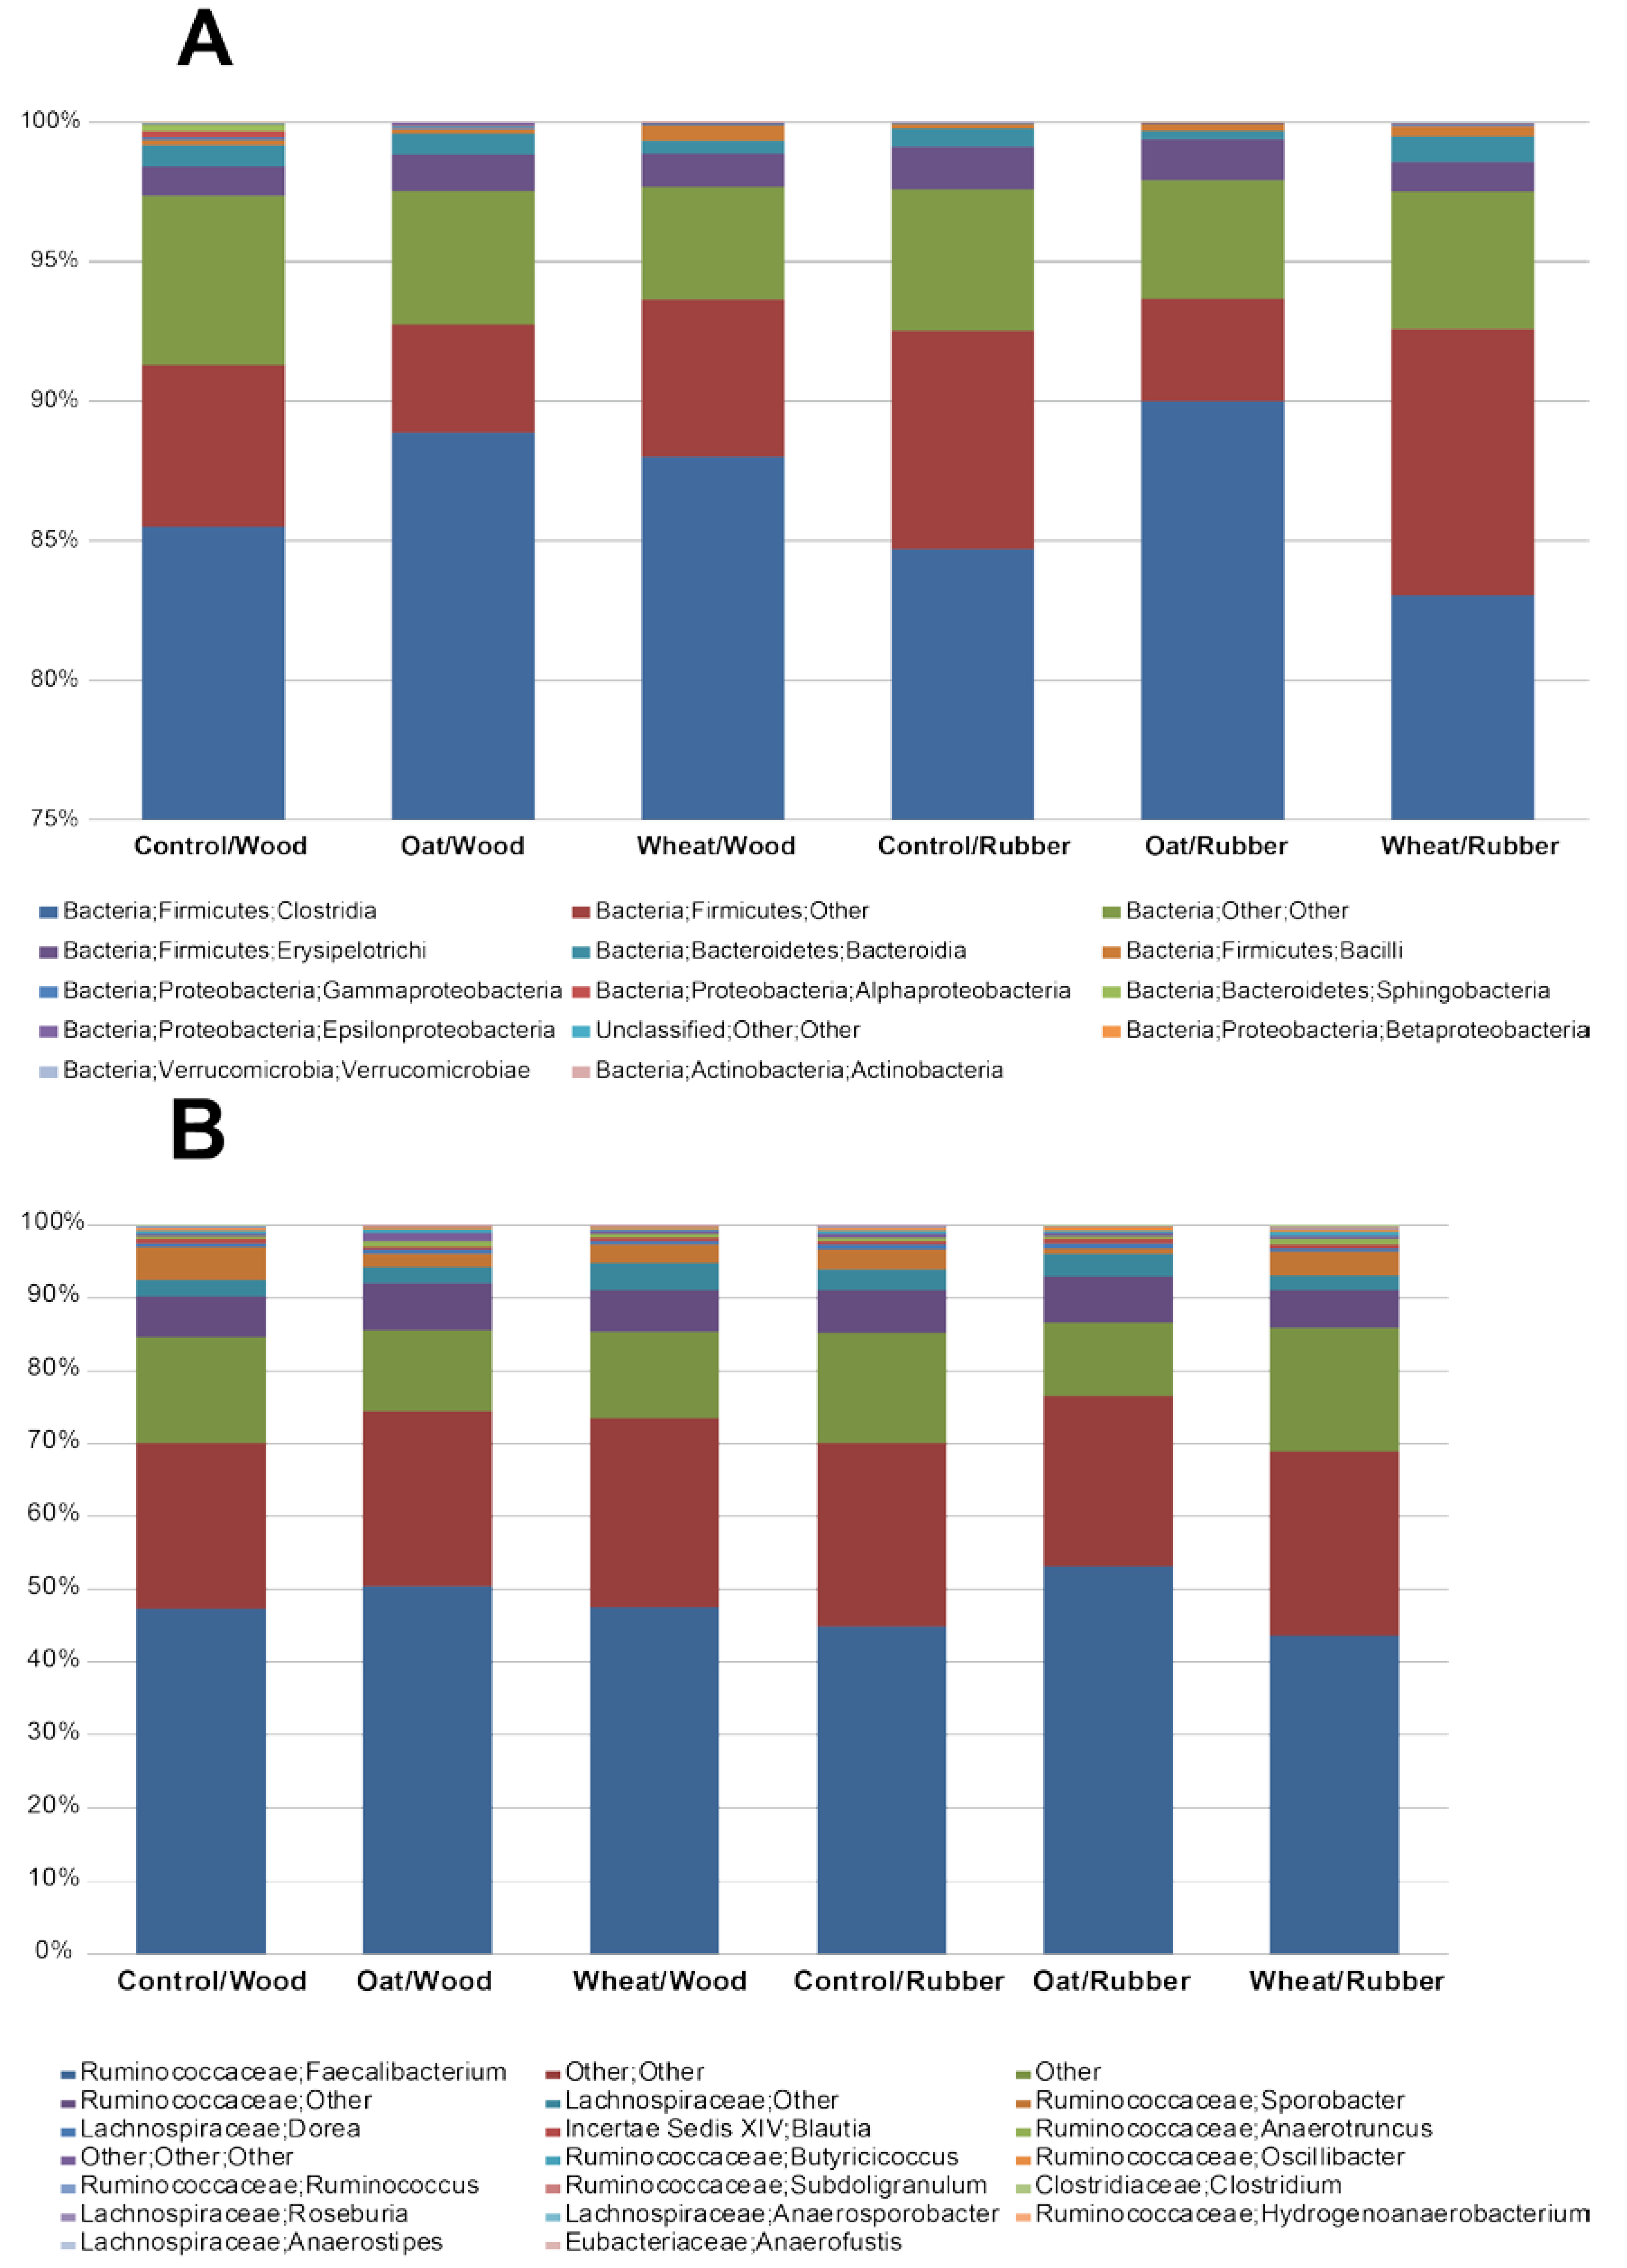
3.3. Effect of Treatment on the Microbiota in Cecum

A total of 100,532 raw sequences was obtained by pyrosequencing. Filtering in QIIME resulted in 42,480 sequences that were distributed on 48 samples (number of sequences per sample ranging from 404 to 1454, with an average of 885). QIIME analyses identified 1373 OUT’s, 188 OUT’s were represented by more the 20 sequences across all samples. Analyzing the 188 OUT’s, all samples were dominated by the order Clostridiales (class Clostridia, phylum Firmicutes) representing 86% of all sequences in the dataset (Supplementary Figure S2A). The most dominating genus was Faecalibacteium (order Clostridiales; Family Ruminococcaceae) represented by 47.9% of all sequences in the dataset (Supplementary Figure S2B). Analysis of beta diversity of the microbiota in cecum is shown in the unweighted PCoA plot in Figure 2, where samples are marked according to type of feed structure. There were no significant effects of different treatment groups, feed or bedding on the microbiota, analyzed by both unweighted and weighted UniFrac. Unweighted UniFrac is a qualitative measure, which compares communities due to presence or absence of organisms, while weighted UniFrac is a quantitative measure, which takes relative abundances of specific organisms into account [39].
Figure 2. The microbiota in cecum analyzed by pyrosequencing. PCoA plots show the β diversity analyzed by unweighted UniFrac. Samples are colored due to type of feed structure; red = control, blue = oat hulls, orange = whole wheat.
Agriculture 03 00741 g002
In-depth analyses of specific bacterial groups were performed by real-time PCR (Table 3). The results showed statistically significant lower amount of Lactobacillus spp. in chickens given control feed than in chickens given feed with structure (p = 0.001); however, bedding had no effect on this bacterial group. There was a tendency of higher amounts of Enterococcus spp. in chickens living on wood shavings, but no effects of bedding was seen on levels of neither E. coli nor Cl. perfringens. Diets had no significant effects on the relative levels of Enterococcus spp., E. coli and Cl. perfringens. However, there was observed a tendency of higher levels of E. coli and lower levels of Cl. perfringens in birds given control feed. Effect of type of feed structure (oat hulls vs. whole wheat) was found for E. coli on rubber mat, with a higher level of E. coli in oat hull fed chickens (lg (−4.48 ± 0.5) vs. lg (−5.10 ± 0.7), p = 0.01). Bifidobacterium spp. was not detected in any of the cecal samples with use of real-time PCR or pyrosequencing.

3.4. Slaughter Weight and pH in Gizzard

Slaughter weight was significantly affected by different treatments. Inclusion of oat hulls in the feed gave reduced slaughter weight (Table 4). Chickens raised on wood shavings had a slightly higher slaughter weight than chickens raised on rubber mat.
The pH measured in gizzard (Table 4) was significantly lower in both whole wheat- and oat hull-fed chickens than in chickens given control feed (p < 0.001). Oat hull-fed chickens had the lowest measured pH-values. pH in gizzard was not influenced by the type of floor bedding.

4. Discussion

We have shown a statistically significant effect of increased feed structure on the reduced spread of C. jejuni in chicken flocks. However, the form in which the structure was presented, oat hulls or whole wheat, did not significantly alter the effect. Feed with increased structure has been shown to stimulate the gizzard [21]. Huang et al. [19] proposed that the gizzard may be a critical control point for reducing Salmonella contamination in growing broilers. They found that chickens with the largest gizzard had the lowest Salmonella concentrations in cecum. We have also previously shown a correlation between increased gizzard and lower relative abundance of C. jejuni in the cecum [20]. Bjerrum et al. [45] suggested that the reduction of Salmonella was probably due to lowered pH in gizzard and longer retention time in gizzard in chickens fed whole wheat. Svihus et al. [46], however, did not observe an increased retention time in the gizzard when broiler chickens were fed whole wheat. Optimum pH for C. jejuni growth is between 6.5 and 7.5, and the cell numbers significantly decrease when the pH is below 4.0 [47]. A reduction in pH, from approximately pH 4.0 in control chickens to below pH 3.0 in chickens fed oat hulls, would clearly have an effect on the survival of C. jejuni in passing through the gizzard and upper GI tract. We observed that both whole wheat and oat hull fed chickens had a reduced pH in gizzard compared to chickens fed fine diet, which is in accordance with the findings of Bjerrum et al. [45], and Amerah and Ravindran [48].
Litter, shown to be eaten by the birds [22,23], can be a source of insoluble fiber but could also increase the horizontal spread of pathogens. Access to litter has been shown to have an impact on the relative gizzard weight [49,50]. In addition to increased gizzard weight, Santos et al. [50] also observed a tendency to lower pH in gizzard for chickens raised on litter. Our results, however, did not reveal significant differences in gizzard pH between chickens raised on different beddings. The effect of bedding on spread of C. jejuni was only significant at Day 5 pi, when the highest number of positive chickens were found on wood shavings. Wood shavings could have an impact on the relative gizzard weight, but this type of bedding does also have a higher probability of C. jejuni-spread due to litter consumption. This in fact indicates that the beneficial effect of structural components is mainly due to the sterilizing properties of a well-functioning gizzard.
The amount of C. jejuni in cecum was significantly lower in chickens fed whole wheat on wood shavings than in chickens given control feed. However, we could not detect significant differences between the two types of structure on the effect of spread and colonization levels of C. jejuni in chickens. The treatment groups with the lowest colonization levels of C. jejuni in cecum were the same groups that had a delay in the spread of C. jejuni. There had probably not been sufficient time to establish a full colonization level in the lower GI tract at the time of sampling in these chickens. A delay in the spread of C. jejuni can lead to a reduced level of C. jejuni in cecum at time of slaughter. It has been reported that a 2-log reduction in C. jejuni numbers on chicken carcasses can lead to a 30 times lower risk of human campylobacteriosis [51].
We also observed that only one strain, C484, was dominating the colonization of C. jejuni positive chickens, even though three challenge strains were used. In our previous study by Moen et al. [20], the same three strains were used but here the chickens were mainly colonized by strain G125 and some chickens dominated by strain C484. Studies of natural colonized chickens have shown that broiler flocks often are colonized by multiple strains [52], and that the dominating strain can change during an infection period [27], which shows the importance of using multiple strains when performing infection trials.
The effect of feed structure and bedding on the microbiota in the lower GI tract was also investigated. Pyrosequencing did not reveal any major changes in the dominating microbiota in cecum due to the inclusion of increased feed structure. This lack of changes in lower GI tract microbiota is in accordance with observations by Gabriel et al. [53], who found effects mainly in the upper part of the digestive tract (increased relative weights of gizzard and pancreas) and no effects on the microbial counts in cecum when feeding whole wheat. To get more information about specific bacterial groups, we chose to quantify some well-known gut bacteria [54,55], together with two human pathogens Cl. perfringens [56] and C. jejuni [5] by real-time PCR. Except from C. jejuni, Lactobacillus spp. were the only group with significant different levels between treatment groups, with the lowest relative level of this bacterium in chickens given control feed. There was a tendency of lower levels of E. coli and Cl. perfringens in chickens fed coarse feed. Others have hypothesized that chickens fed coarse feed (Brewer’s spent grain) had a stronger barrier for releasing two phylogroups related to E. coli/Shigella and Lactobacillus through the digestive system than those fed fine Brewer’s spent grain [57]. That study was based on direct sequencing of 16S rDNA in feces. Our study, using cecum samples and more in depth techniques, identified the opposite effect for Lactobacillus spp., but for E. coli the effect was the same (although the p-value was just above 0.05). Sekelja et al. [57], also found that the cecum/colon was dominated by a phylogroup related to unclassified Clostridiales and unclassified Lachnospiraceae. This is in accordance with our study, which identified the Clostridiales family dominating the ceca. Lactobacillus spp. and other lactic acid bacteria are usually considered to be beneficial for the host [58]. Culture-based methods have reported relatively high numbers of bifidobacteria in chicken cecum [54]. Bifidobacteria were not detected in any of the samples by use of pyrosequencing or specific real-time PCR in our study. This concurs with previous studies that DNA-based methods have reported low frequencies of bifidobacteria in chickens [59,60].
Table 3. Quantification of specific groups of the total microbiota in cecum at Day 7 pi, measured by real-time PCR. Mean colonization values are given relative to the total microbiota (lg) with standard deviation. Samples with target bacteria below the detection limit were given a CT-value of 40. P-values are estimated for the effect of feed, bedding and feed × bedding.
StrainsControl/Wood
(n =16)
Oat/Wood
(n =16)
Wheat/Wood
(n =16)
Control/Rubber
(n =16)
Oat/Rubber
(n =15)
Wheat/Rubber
(n =15)
P-value
FeedBeddingF × B
Lactobacillusspp.−2.73 ± 0.6−2.21 ± 0.6−2.10 ± 0.5−2.40 ± 0.3−2.25 ± 0.4−2.18 ± 0.40.0010.4700.160
Enterococcusspp.−3.63 ± 0.8−4.11 ± 0.8−3.98 ± 0.7−4.28 ± 0.9−4.19 ± 1.0−4.11 ± 0.50.6290.0840.304
E. coli−4.45 ± 0.9−4.98 ± 0.9−4.93 ± 0.7−4.63 ± 0.8−4.48 ± 0.5−5.10 ± 0.70.0520.7590.138
Cl. Perfringens−4.65 ± 0.6−4.44 ± 0.7−4.19 ± 0.7−4.49 ± 0.8−4.40 ± 0.9−4.06 ± 0.90.0680.4800.946
Table 4. Mean and standard deviation for the slaughter weight of chickens and pH measured in gizzard according to different treatment groups (at Day 7 pi, n = 16 for all treatment groups).
Gizzard Weight/pHControl/WoodOat/WoodWheat/WoodControl/RubberOat/RubberWheat/RubberP-value
FeedBeddingF × B
Weight (g)2981 ± 1722853 ± 1973009 ± 2022921 ± 2212745 ± 1912920 ± 2340.0020.0430.893
pH in gizzard3.89 ± 0.42.98 ± 0.73.63 ± 0.43.79 ± 0.32.98 ± 0.63.37 ± 0.6<0.0010.2580.563

5. Conclusions

In this study, we have reported that the spread of C. jejuni is delayed due to increased feed structure, while the microbiota of the lower GI tract is mostly unchanged. There were no significant differences detected between types of structure included in the feed. These findings support our theory that the modification of the upper GI tract is essential for preventing C. jejuni colonization of the lower GI tract. A stimulated gizzard with a low pH will create a barrier for pathogens to reach the lower GI tract in chickens. If the pathogens manage to pass the upper GI tract, there will not be significant effect on the colonization levels of the pathogen in the lower GI tract. Our results show that increased feed structure in general is a promising intervention strategy in order to reduce the occurrence of C. jejuni in poultry products and to obtain safer food.

Acknowledgments

This work was supported by grant 178267/I10 from the Research Council of Norway, The Norwegian Centre for Poultry Science, the Fund for Research Levy on Agricultural Products, and Research funds from the Norwegian Agricultural Authority. The authors would like to thank Nortura SA for supporting the project. We wish to thank Teshome Yifter and Marianne Bratberg Skarra for helpful management of the animal facilities, Magne Kaldhusdal for excellent technical assistance with the inoculation of chickens, Merete Rusås Jensen, Ida Henriksen, Janina Berg and Catherine Halvorsen for excellent technical assistance, and Ingrid Måge and Per Lea for statistical analyses.

Conflicts of Interest

The authors declare no conflict of interest.

References

  1. Blaser, M.J. Epidemiologic and clinical features of Campylobacter jejuni infections. J. Infect. Dis. 1997, 176, S103–S105. [Google Scholar]
  2. Silva, J.; Leite, D.; Fernandes, M.; Mena, C.; Gibbs, P.A.; Teixeira, P. Campylobacter spp. as a foodborne pathogen: A review. Front. Microbiol. 2011, 2, 200. [Google Scholar]
  3. Gillespie, I.A.; O’Brien, S.J.; Frost, J.A.; Adak, G.K.; Horby, P.; Swan, A.V.; Painter, M.J.; Neal, K.R. A case-case comparison of Campylobacter coli and Campylobacter jejuni infection: A tool for generating hypotheses. Emerg. Infect. Dis. 2002, 8, 937–942. [Google Scholar] [CrossRef]
  4. Wilson, D.J.; Gabriel, E.; Leatherbarrow, A.J.; Cheesbrough, J.; Gee, S.; Bolton, E.; Fox, A.; Fearnhead, P.; Hart, C.A.; Diggle, P.J. Tracing the source of campylobacteriosis. PLoS Genet. 2008, 4, e1000203. [Google Scholar] [CrossRef]
  5. Hermans, D.; van Deun, K.; Martel, A.; van Immerseel, F.; Messens, W.; Heyndrickx, M.; Haesebrouck, F.; Pasmans, F. Colonization factors of Campylobacter jejuni in the chicken gut. Vet. Res. 2011, 42, 82. [Google Scholar] [CrossRef]
  6. Janssen, R.; Krogfelt, K.A.; Cawthraw, S.A.; van Pelt, W.; Wagenaar, J.A.; Owen, R.J. Host-pathogen interactions in Campylobacter infections: The host perspective. Clin. Microbiol. Rev. 2008, 21, 505–518. [Google Scholar] [CrossRef]
  7. Solomon, E.B.; Hoover, D.G. Campylobacter jejuni: A bacterial paradox. J. Food Saf. 1999, 19, 121–136. [Google Scholar] [CrossRef]
  8. Humphrey, T.; O’Brien, S.; Madsen, M. Campylobacters as zoonotic pathogens: A food production perspective. Int. J. Food Microbiol. 2007, 117, 237–257. [Google Scholar] [CrossRef]
  9. Nauta, M.; Hill, A.; Rosenquist, H.; Brynestad, S.; Fetsch, A.; van der Logt, P.; Fazil, A.; Christensen, B.; Katsma, E.; Borck, B.; et al. A comparison of risk assessments on Campylobacter in broiler meat. Int. J. Food Microbiol. 2009, 129, 107–123. [Google Scholar] [CrossRef]
  10. Van Gerwe, T.; Miflin, J.K.; Templeton, J.M.; Bouma, A.; Wagenaar, J.A.; Jacobs-Reitsma, W.F.; Stegeman, A.; Klinkenberg, D. Quantifying transmission of Campylobacter jejuni in commercial broiler flocks. Appl. Environ. Microbiol. 2009, 75, 625–628. [Google Scholar] [CrossRef]
  11. Beery, J.T.; Hugdahl, M.B.; Doyle, M.P. Colonization of gastrointestinal tracts of chicks by Campylobacter jejuni. Appl. Environ. Microbiol. 1988, 54, 2365–2370. [Google Scholar]
  12. Shane, S.M. The significance of Campylobacter jejuni infection in poultry—A review. Avian Pathol. 1992, 21, 189–213. [Google Scholar] [CrossRef]
  13. Stern, N.J.; Bailey, J.S.; Blankenship, L.C.; Cox, N.A.; McHan, F. Colonization characteristics of Campylobacter jejuni in chick ceca. Avian Dis. 1988, 32, 330–334. [Google Scholar] [CrossRef]
  14. Rosenquist, H.; Sommer, H.M.; Nielsen, N.L.; Christensen, B.B. The effect of slaughter operations on the contamination of chicken carcasses with thermotolerant Campylobacter. Int. J. Food Microbiol. 2006, 108, 226–232. [Google Scholar] [CrossRef]
  15. Solis de los Santos, F.; Donoghue, A.M.; Venkitanarayanan, K.; Reyes-Herrera, I.; Metcalf, J.H.; Dirain, M.L.; Aguiar, V.F.; Blore, P.J.; Donoghue, D.J. Therapeutic supplementation of caprylic acid in feed reduces Campylobacter jejuni colonization in broiler chicks. Appl. Environ. Microbiol. 2008, 74, 4564–4566. [Google Scholar] [CrossRef]
  16. Hariharan, H.; Murphy, G.A.; Kempf, I. Campylobacter jejuni: Public health hazards and potential control methods in poultry: A review. Vet. Med. 2004, 49, 441–446. [Google Scholar]
  17. Saris, P.E.J.; Hilmi, H.T.A.; Surakka, A.; Apajalahti, J. Identification of the most abundant Lactobacillus species in the crop of 1- and 5-week-old broiler chickens. Appl. Environ. Microb. 2007, 73, 7867–7873. [Google Scholar] [CrossRef]
  18. Engberg, R.M.; Hedemann, M.S.; Jensen, B.B. The influence of grinding and pelleting of feed on the microbial composition and activity in the digestive tract of broiler chickens. Br. Poult. Sci. 2002, 43, 569–579. [Google Scholar] [CrossRef]
  19. Huang, D.S.; Li, D.F.; Xing, J.J.; Ma, Y.X.; Li, Z.J.; Lv, S.Q. Effects of feed particle size and feed form on survival of Salmonella typhimurium in the alimentary tract and cecal S. typhimurium reduction in growing broilers. Poult. Sci. 2006, 85, 831–836. [Google Scholar]
  20. Moen, B.; Rudi, K.; Svihus, B.; Skånseng, B. Reduced spread of Campylobacter jejuni in broiler chickens by stimulating the bird’s natural barriers. J. Appl. Microbiol. 2012, 113, 1176–1183. [Google Scholar] [CrossRef]
  21. Svihus, B. The gizzard: Function, influence of diet structure and effects on nutrient availability. World Poult. Sci. J. 2011, 67, 207–224. [Google Scholar] [CrossRef]
  22. Hetland, H.; Svihus, B. Inclusion of dust bathing materials affects nutrient digestion and gut physiology of layers. J. Appl. Poult. Res. 2007, 16, 22–26. [Google Scholar]
  23. Hetland, H.; Svihus, B.; Choct, M. Role of insoluble fiber on gizzard activity in layers. J. Appl. Poult. Res. 2005, 14, 38–46. [Google Scholar]
  24. Norwegian Food Safety Authority. Available online: http://www.mattilsynet.no/fdu/ (accessed on 6 June 2013).
  25. SAS; Version 9.2; SAS Institute Inc.: Cary, NC, USA, 2008.
  26. Rudi, K.; Moen, B.; Drømtorp, S.M.; Holck, A.L. Use of ethidium monoazide and PCR in combination for quantification of viable and dead cells in complex samples. Appl. Environ. Microbiol. 2005, 71, 1018–1024. [Google Scholar] [CrossRef]
  27. Skånseng, B.; Trosvik, P.; Zimonja, M.; Johnsen, G.; Bjerrum, L.; Pedersen, K.; Wallin, N.; Rudi, K. Co-infection dynamics of a major food-borne zoonotic pathogen in chicken. PLoS Pathog. 2007, 3, e175. [Google Scholar] [CrossRef]
  28. Skånseng, B.; Kaldhusdal, M.; Moen, B.; Gjevre, A.G.; Johannessen, G.S.; Sekelja, M.; Trosvik, P.; Rudi, K. Prevention of intestinal Campylobacter jejuni colonization in broilers by combinations of in-feed organic acids. J. Appl. Microbiol. 2010, 109, 1265–1273. [Google Scholar] [CrossRef]
  29. Skånseng, B.; Kaldhusdal, M.; Rudi, K. Comparison of chicken gut colonisation by the pathogens Campylobacter jejuni and Clostridium perfringens by real-time quantitative PCR. Mol. Cell. Probes 2006, 20, 269–279. [Google Scholar] [CrossRef]
  30. Nadkarni, M.A.; Martin, F.E.; Jacques, N.A.; Hunter, N. Determination of bacterial load by real-time PCR using a broad-range (universal) probe and primers set. Microbiology 2002, 148, 257–266. [Google Scholar]
  31. Nogva, H.K.; Bergh, A.; Holck, A.; Rudi, K. Application of the 5′-nuclease PCR assay in evaluation and development of methods for quantitative detection of Campylobacter jejuni. Appl. Environ. Microbiol. 2000, 66, 4029–4036. [Google Scholar] [CrossRef]
  32. SDS Plate Utility Software; Version 2.2; Applied Biosystems: Foster City, CA, USA, 2004.
  33. SYSTAT 12; Version 9.2; Systat Software Inc.: Chicago, IL, USA, 2007.
  34. Berget, I.; Heir, E.; Petcovic, J.; Rudi, K. Discriminatory power, typability, and accuracy of single nucleotide extension microarrays. J. AOAC Int. 2007, 90, 802–809. [Google Scholar]
  35. Trosvik, P.; Skånseng, B.; Jakobsen, K.S.; Stenseth, N.C.; Næs, T.; Rudi, K. Multivariate analysis of complex DNA-sequence electropherograms for high-throughput quantitative analysis of mixed microbial populations. Appl. Environ. Microbiol. 2007, 73, 4975–4983. [Google Scholar] [CrossRef]
  36. Michigan State University. RDP’s Pyrosequencing Pipeline. Available online: http://pyro.cme.msu.edu/pyro/help.jsp (accessed on 6 June 2013).
  37. Caporaso, J.G.; Kuczynski, J.; Stombaugh, J.; Bittinger, K.; Bushman, F.D.; Costello, E.K.; Fierer, N.; Pena, A.G.; Goodrich, J.K.; Gordon, J.I.; et al. QIIME allows analysis of high-throughput community sequencing data. Nat. Methods 2010, 7, 335–336. [Google Scholar] [CrossRef]
  38. Lozupone, C.; Knight, R. UniFrac: A new phylogenetic method for comparing microbial communities. Appl. Environ. Microbiol. 2005, 71, 8228–8235. [Google Scholar] [CrossRef]
  39. Lozupone, C.A.; Hamady, M.; Kelley, S.T.; Knight, R. Quantitative and qualitative β diversity measures lead to different insights into factors that structure microbial communities. Appl. Environ. Microbiol. 2007, 73, 1576–1585. [Google Scholar] [CrossRef]
  40. Krzanowski, W.J. Principles of Multivariate Analysis. A User’s Perspective; Oxford University Press: Oxford, UK, 2000. [Google Scholar]
  41. Haarman, M.; Knol, J. Quantitative real-time PCR assays to identify and quantify fecal Bifidobacterium species in infants receiving a prebiotic infant formula. Appl. Environ. Microbiol. 2005, 71, 2318–2324. [Google Scholar] [CrossRef]
  42. Frahm, E.; Obst, U. Application of the fluorogenic probe technique (TaqMan PCR) to the detection of Enterococcus spp. and Escherichia coli in water samples. J. Microbiol. Methods 2003, 52, 123–131. [Google Scholar] [CrossRef]
  43. Walter, J.; Hertel, C.; Tannock, G.W.; Lis, C.M.; Munro, K.; Hammes, W.P. Detection of Lactobacillus, Pediococcus, Leuconostoc, and Weissella species in human feces by using group-specific PCR primers and denaturing gradient gel electrophoresis. Appl. Environ. Microbiol. 2001, 67, 2578–2585. [Google Scholar]
  44. Heilig, H.G.; Zoetendal, E.G.; Vaughan, E.E.; Marteau, P.; Akkermans, A.D.; de Vos, W.M. Molecular diversity of Lactobacillus spp. and other lactic acid bacteria in the human intestine as determined by specific amplification of 16S ribosomal DNA. Appl. Environ. Microbiol. 2002, 68, 114–123. [Google Scholar] [CrossRef]
  45. Bjerrum, L.; Pedersen, A.B.; Engberg, R.M. The influence of whole wheat feeding on Salmonella infection and gut flora composition in broilers. Avian Dis. 2005, 49, 9–15. [Google Scholar] [CrossRef]
  46. Svihus, B.; Hetland, H.; Choct, M.; Sundby, F. Passage rate through the anterior digestive tract of broiler chickens fed on diets with ground and whole wheat. Br. Poult. Sci. 2002, 43, 662–668. [Google Scholar] [CrossRef]
  47. Jackson, D.N.; Davis, B.; Tirado, S.M.; Duggal, M.; van Frankenhuyzen, J.K.; Deaville, D.; Wijesinghe, M.A.; Tessaro, M.; Trevors, J.T. Survival mechanisms and culturability of Campylobacter jejuni under stress conditions. Antonie Van Leeuwenhoek 2009, 96, 377–394. [Google Scholar] [CrossRef]
  48. Amerah, A.M.; Ravindran, V. Influence of method of whole-wheat feeding on the performance, digestive tract development and carcass traits of broiler chickens. Anim. Feed Sci. Tech. 2008, 147, 326–339. [Google Scholar] [CrossRef]
  49. Hetland, H.; Svihus, B.; Krogdahl, A. Effects of oat hulls and wood shavings on digestion in broilers and layers fed diets based on whole or ground wheat. Br. Poult. Sci. 2003, 44, 275–282. [Google Scholar] [CrossRef]
  50. Santos, F.B.; Sheldon, B.W.; Santos, A.A., Jr.; Ferket, P.R. Influence of housing system, grain type, and particle size on Salmonella colonization and shedding of broilers fed triticale or corn-soybean meal diets. Poult. Sci. 2008, 87, 405–420. [Google Scholar] [CrossRef]
  51. Rosenquist, H.; Nielsen, N.L.; Sommer, H.M.; Nørrung, B.; Christensen, B.B. Quantitative risk assessment of human campylobacteriosis associated with thermophilic Campylobacter species in chickens. Int. J. Food Microbiol. 2003, 83, 87–103. [Google Scholar] [CrossRef]
  52. Hermans, D.; Pasmans, F.; Heyndrickx, M.; van Immerseel, F.; Martel, A.; van Deun, K.; Haesebrouck, F. A tolerogenic mucosal immune response leads to persistent Campylobacter jejuni colonization in the chicken gut. Crit. Rev. Microbiol. 2012, 38, 17–29. [Google Scholar] [CrossRef]
  53. Gabriel, I.; Mallet, S.; Leconte, M.; Travel, A.; Lalles, J.P. Effects of whole wheat feeding on the development of the digestive tract of broiler chickens. Anim. Feed Sci. Tech. 2008, 142, 144–162. [Google Scholar] [CrossRef]
  54. Rehman, H.U.; Vahjen, W.; Awad, W.A.; Zentek, J. Indigenous bacteria and bacterial metabolic products in the gastrointestinal tract of broiler chickens. Arch. Tierernahr. 2007, 61, 319–335. [Google Scholar]
  55. Yegani, M.; Korver, D.R. Factors affecting intestinal health in poultry. Poult. Sci. 2008, 87, 2052–2063. [Google Scholar] [CrossRef]
  56. Van Immerseel, F.; de Buck, J.; Pasmans, F.; Huyghebaert, G.; Haesebrouck, F.; Ducatelle, R. Clostridium perfringens in poultry: An emerging threat for animal and public health. Avian Pathol. 2004, 33, 537–549. [Google Scholar] [CrossRef]
  57. Sekelja, M.; Rud, I.; Knutsen, S.H.; Denstadli, V.; Westereng, B.; Naes, T.; Rudi, K. Abrupt temporal fluctuations in the chicken fecal microbiota are explained by its gastrointestinal origin. Appl. Environ. Microbiol. 2012, 78, 2941–2948. [Google Scholar]
  58. Choct, M. Managing gut health through nutrition. Br. Poult. Sci. 2009, 50, 9–15. [Google Scholar] [CrossRef]
  59. Jozefiak, D.; Rutkowski, A.; Kaczmarek, S.; Jensen, B.B.; Engberg, R.M.; Højberg, O. Effect of beta-glucanase and xylanase supplementation of barley- and rye-based diets on caecal microbiota of broiler chickens. Br. Poult. Sci. 2010, 51, 546–557. [Google Scholar] [CrossRef]
  60. Zhu, X.Y.; Zhong, T.Y.; Pandya, Y.; Joerger, R.D. 16S rRNA-based analysis of microbiota from the cecum of broiler chickens. Appl. Environ. Microbiol. 2002, 68, 124–137. [Google Scholar] [CrossRef]

Supplementary Information

Table S1. Composition of experimental diets.
Control/Whole Wheat DietOat Hulls Diet
Corn, %25.3422.30
Ground/whole wheat, %42.0036.96
Soybean meal, %17.3415.26
Fish meal, %7.006.16
Coarse oat hulls, %0.0012.00
Soybean oil, %4.003.52
Limestone, %1.301.14
Monocalcium phosphate, %1.000.88
l-lysine-HCl, %0.500.44
dl-methionine, %0.300.26
l-threonine, %0.100.09
Salt, %0.200.18
Sodium bicarbonate, %0.300.26
Choline chlorate, %0.150.13
Microminerals/vitamins, %0.440.39
Table S2. Bacterial strains used for validation of Lactobacillus spp. primers and probe.
SpeciesStrain aMedium bTaqMan PCR cRelative to total DNA dStd e
Positive Controls
Lb. acidophilusATCC 4356MRS++−0.650.03
Lb. brevisDSM 20556MRS++−0.610.09
Lb. caseiATCC 393MRS++−0.720.04
Lb. curvatusDSM 20019MRS++−0.670.11
Lb. delbrueckii subsp. lactisATCC 12315MRS++−0.620.01
Lb. gasseriATCC 33323MRS++−0.660.02
Lb. helveticusATCC 15009MRS++−0.610.08
Lb. pentosusATCC 8041MRS++−0.640.04
Lb. plantarumNCIMB 8826MRS++−0.730.07
Lb. reuteriDSM 17938MRS++−0.590.04
Lb. rhamnosus (GG)ATCC 53103MRS++−0.660.10
Lb. sakeiDSM 20017MRS++−0.510.30
Lb. salivariusDSM 20555MRS++−0.550.14
Other LAB
Lactococcus cremorisATCC 19257MRS-−5.640.06
Lc. LactisATCC 15346MRS-−5.410.07
Leuconostoc mesenteroides fATCC 19255MRS++−0.610.05
Carnobacterium divergens fNCDO 2306MRS+−3.850.09
Enterococcus faecalisDSM 12956MRS-−6.040.02
Streptococcus thermophilusMF2403MRS-−5.470.07
Negative controls
Bifidobacterium longumDSM 20219W-C-−5.080.09
Staphylococcus aureus fATCC 12600BHI+−3.960.02
Bacillus cereusATCC 4516BHI-−6.610.08
Clostridium perfringensATCC 13124BHI-−6.250.14
Escherichia coliATCC 47076BHI-−6.860.13
Campylobacter jejuniDSM 4688M-H-−6.290.19
a ATCC, American Type Culture Collection, Manassas, VA, USA; DSM, Deutsche Sammlung von Mikroorganismen und Zellkulturen GmbH, Braunschweig, Germany; NCIMB, National Collections of Industrial and Marine Bacteria Ltd., Aberdeen, Scotland, UK; NCFB/NCDO, National Collection of Food Bacteria, c/o NCIMB Ltd., Aberdeen, Scotland, UK; MF, strain located at Nofima, Ås, Norway; b MRS, de man, Rogosa, Sharpe Agar (Oxoid, CM0361); W-C, Wilkins-Chalgren Anaerobe Agar (Oxoid, CM0619); BHI, Brain Heart Infusion Agar (Oxoid, CM1136); M-H, Mueller-Hinton Agar (Oxoid, CM0337); c Specificity of Lactobacillus-primers; positive, ++ (≥−2); low detection, + (≥−4); not detected, - (≤−4); d Quantified amount of Lactobacillus spp. relative to total microbial DNA; e Standard deviation based on three technical replicates; f Except from Lactobacillus spp., the primer- and probe set did also detect Leuc. mesenteroides and had a low detection of Carnob. divergens and S. aureus.
Figure S1. Quantification of the colonizing C. jejuni strains in chicken cecum at Day 7 pi. Y-axis starts at 0.8, and the relative abundances are given for the three C. jejuni strains; C484 in light greyblue, G109 in red, and G125 in green. Samples are marked with C = control, O = oat hull, Wh = whole wheat, W = wood, R = rubber. Numbers indicates cage number and chicken individual.
Agriculture 03 00741 g003
Figure S2. Relative abundance (%) of the microbiota in the chicken cecum. (A) Relative abundance of the class, the Y-axis start at 75%; (B) Relative abundance of groups under the class Clostridiales.
Agriculture 03 00741 g004

