Article

Biological Characterization of Cynara cardunculus L. Methanolic Extracts: Antioxidant, Anti-proliferative, Anti-migratory and Anti-angiogenic Activities

1
Center for Marine Sciences (CCMAR), Universidade do Algarve Campus de Gambelas, 8005-139 Faro, Portugal
2
Centro de Biotecnologia Agrícola e Agro-Alimentar do Baixo Alentejo e Litoral (CEBAL), Instituto Politécnico de Beja (IPBeja), 7801-908 Beja, Portugal
3
Centre for Research in Ceramics & Composite Materials (CICECO), University of Aveiro, 3810-193 Aveiro, Portugal
4
Institute of Molecular Pathology and Immunology of the University of Porto (IPATIMUP), University of Porto, 4200-465 Porto, Portugal
5
Department of Pathology and Oncology, Medical Faculty of University of Porto, 4200-319 Porto, Portugal
*
Author to whom correspondence should be addressed.
Agriculture 2012, 2(4), 472-492; https://doi.org/10.3390/agriculture2040472
Submission received: 12 October 2012 / Revised: 12 November 2012 / Accepted: 10 December 2012 / Published: 19 December 2012

Abstract

:
Cynara cardunculus (Cc) is a multipurpose species; beyond its use in southwestern European cuisine, it is also used for the production of solid biofuel, seed oil, biodiesel, paper pulp and cheese, as well as animal feed. In addition, Cc has a long tradition of use in folk medicine as a diuretic and liver protector. The value of this species as a source of bioactive compounds is known; however, pharmacological use would further increase its cultivation. The main goal of the current work was to evaluate the potential of Cc as source of anti-carcinogenic phytochemicals. Different methanolic extracts obtained from wild and cultivated plants were tested for antioxidant activity and effect on breast tumor cell viability. The most effective extract, both as antioxidant and inhibition of tumor cell viability, was tested for effects on angiogenesis and tumor cell migration capacity. All the extracts tested had high antioxidant activity; however, only green leaves and dry head extracts exhibit anti-proliferative activity. Green cultivated leaves (GCL) were the most effective extract both as antioxidant and inhibiting the proliferation of tumor cells; it is equally active inhibiting tumor cell migration and in vivo angiogenesis. GCL extract is an effective inhibitor of several key points in tumor development and thus a promising source of anti-carcinogenic phytochemicals.

Graphical Abstract

1. Introduction

Cynara cardunculus (Cc) is a Mediterranean halophyte, belonging to the Asteraceae family [1,2]. It comprises three taxa: two domesticated forms, globe artichoke (var. scolymus L.) and cultivated cardoon (var. altilis) and the wild cardoon (var. sylvestris) [3,4]. Recent studies showed that wild cardoon is the ancestor of both cultivated forms [5]. This species grows naturally in harsh conditions characterized by high temperatures, elevated salinity and low rainfall. Cc is used worldwide and represents a significant ingredient of the Mediterranean diet. Cc flowers have been long used in the preparation of cheese because of their aspartic proteases [6]. This crop is also used in the production of seed oil, paper pulp [7], forage for livestock, and is currently shows promise in solid biofuel production [8]. In addition, Cc is known since Roman times for its therapeutic application as hepatoprotector and diuretic. Despite its use in folk medicine, the therapeutic potential of Cc is poorly studied and its putative application as source of bioactive compounds is completely unexplored. The use of this crop as source of pharmacological bioactive compounds would add even more value to its cultivation. Previous analytical chemical studies carried out on Cc extracts and infusions, have reported high phenolic contents. Most of the identified compounds, namely 3-, 4-, and 5-caffeoylquinic acids, 1,3-dicaffeoylquinic acid (cynarin), 1,5-dicaffeoylquinic acid, luteolin, luteolin 7-glucoside, luteolin 7-rutinoside, luteolin 7-malonylglucoside, luteolin aglycone, ferulic acid and cumaric acid [9,10,11,12,13,14,15], are known to carry important biological roles in terms of hepatoprotection [16], anti-oxidative [10,16], anti-inflammatory [13], anti-microbial [15], anti-mutagenic [17] and anti-proliferative [18,19] potential. The well known application of cardoon in folk medicine together with the previously described bioactivity of some phenols known to be present in Cc extracts; makes this plant a good candidate as source of bioactive compounds with anti-carcinogenic activity.
Carcinogenesis is a multistep process involving three main stages; initiation, promotion and progression. It is characterized by a series of cellular and genetic alterations that ultimately reprogram cells to undergo uncontrolled cell division. Many plants extracts have anti-carcinogenic activity, inhibiting both initiation and promotion stages of carcinogenesis [20]. Antioxidants are believed to prevent the initiation stage of carcinogenesis, mainly due to their capacity to protect cells from the damage caused by free radicals [21,22]. After the initiation stages, tumor promotion and progression implies uncontrolled cell division, metastasis (tumor cell migration and tissue invasion) and angiogenesis [23]. The current work aimed to evaluate anticarcinogenic potential of Cc extracts by assessing their effect on the main stages of tumor development. To achieve this, the antioxidant and anti-proliferative activities of Cc extracts obtained from leaves, stalks and inflorescences of wild (var. sylvestris) and cultivated (var. altilis) cardoon collected from different developed stages (green plants with immature inflorescence and dry plants with mature inflorescence) were accessed. The most effective extract (green cultivated leaves), both as antioxidant and inhibition of tumor cell viability, was tested for its effect on angiogenesis and cell migration. In addition, a putative relation between bioactivity and phenol content was also evaluated. Most of the studies carried with Cc have focused on leaf extracts and infusions [24,25,26]; the phenolic composition and bioactivity of other plant organs is poorly studied [25,27]. As far as the authors are aware, this is the first screening approach evaluating the bioactivity of different part of the plant (leaves, stalks, and inflorescences). Additionally, considering the reported qualitative and quantitative differences between phenolic contents in wild and cultivated Cc leaves [12] and due to the fact that pharmacological application of cardoon will require the use of cultivated plants, this study was carried out on both wild and cultivated plants.

2. Results and Discussion

2.1. Results

2.1.1. Total Phenolic Content
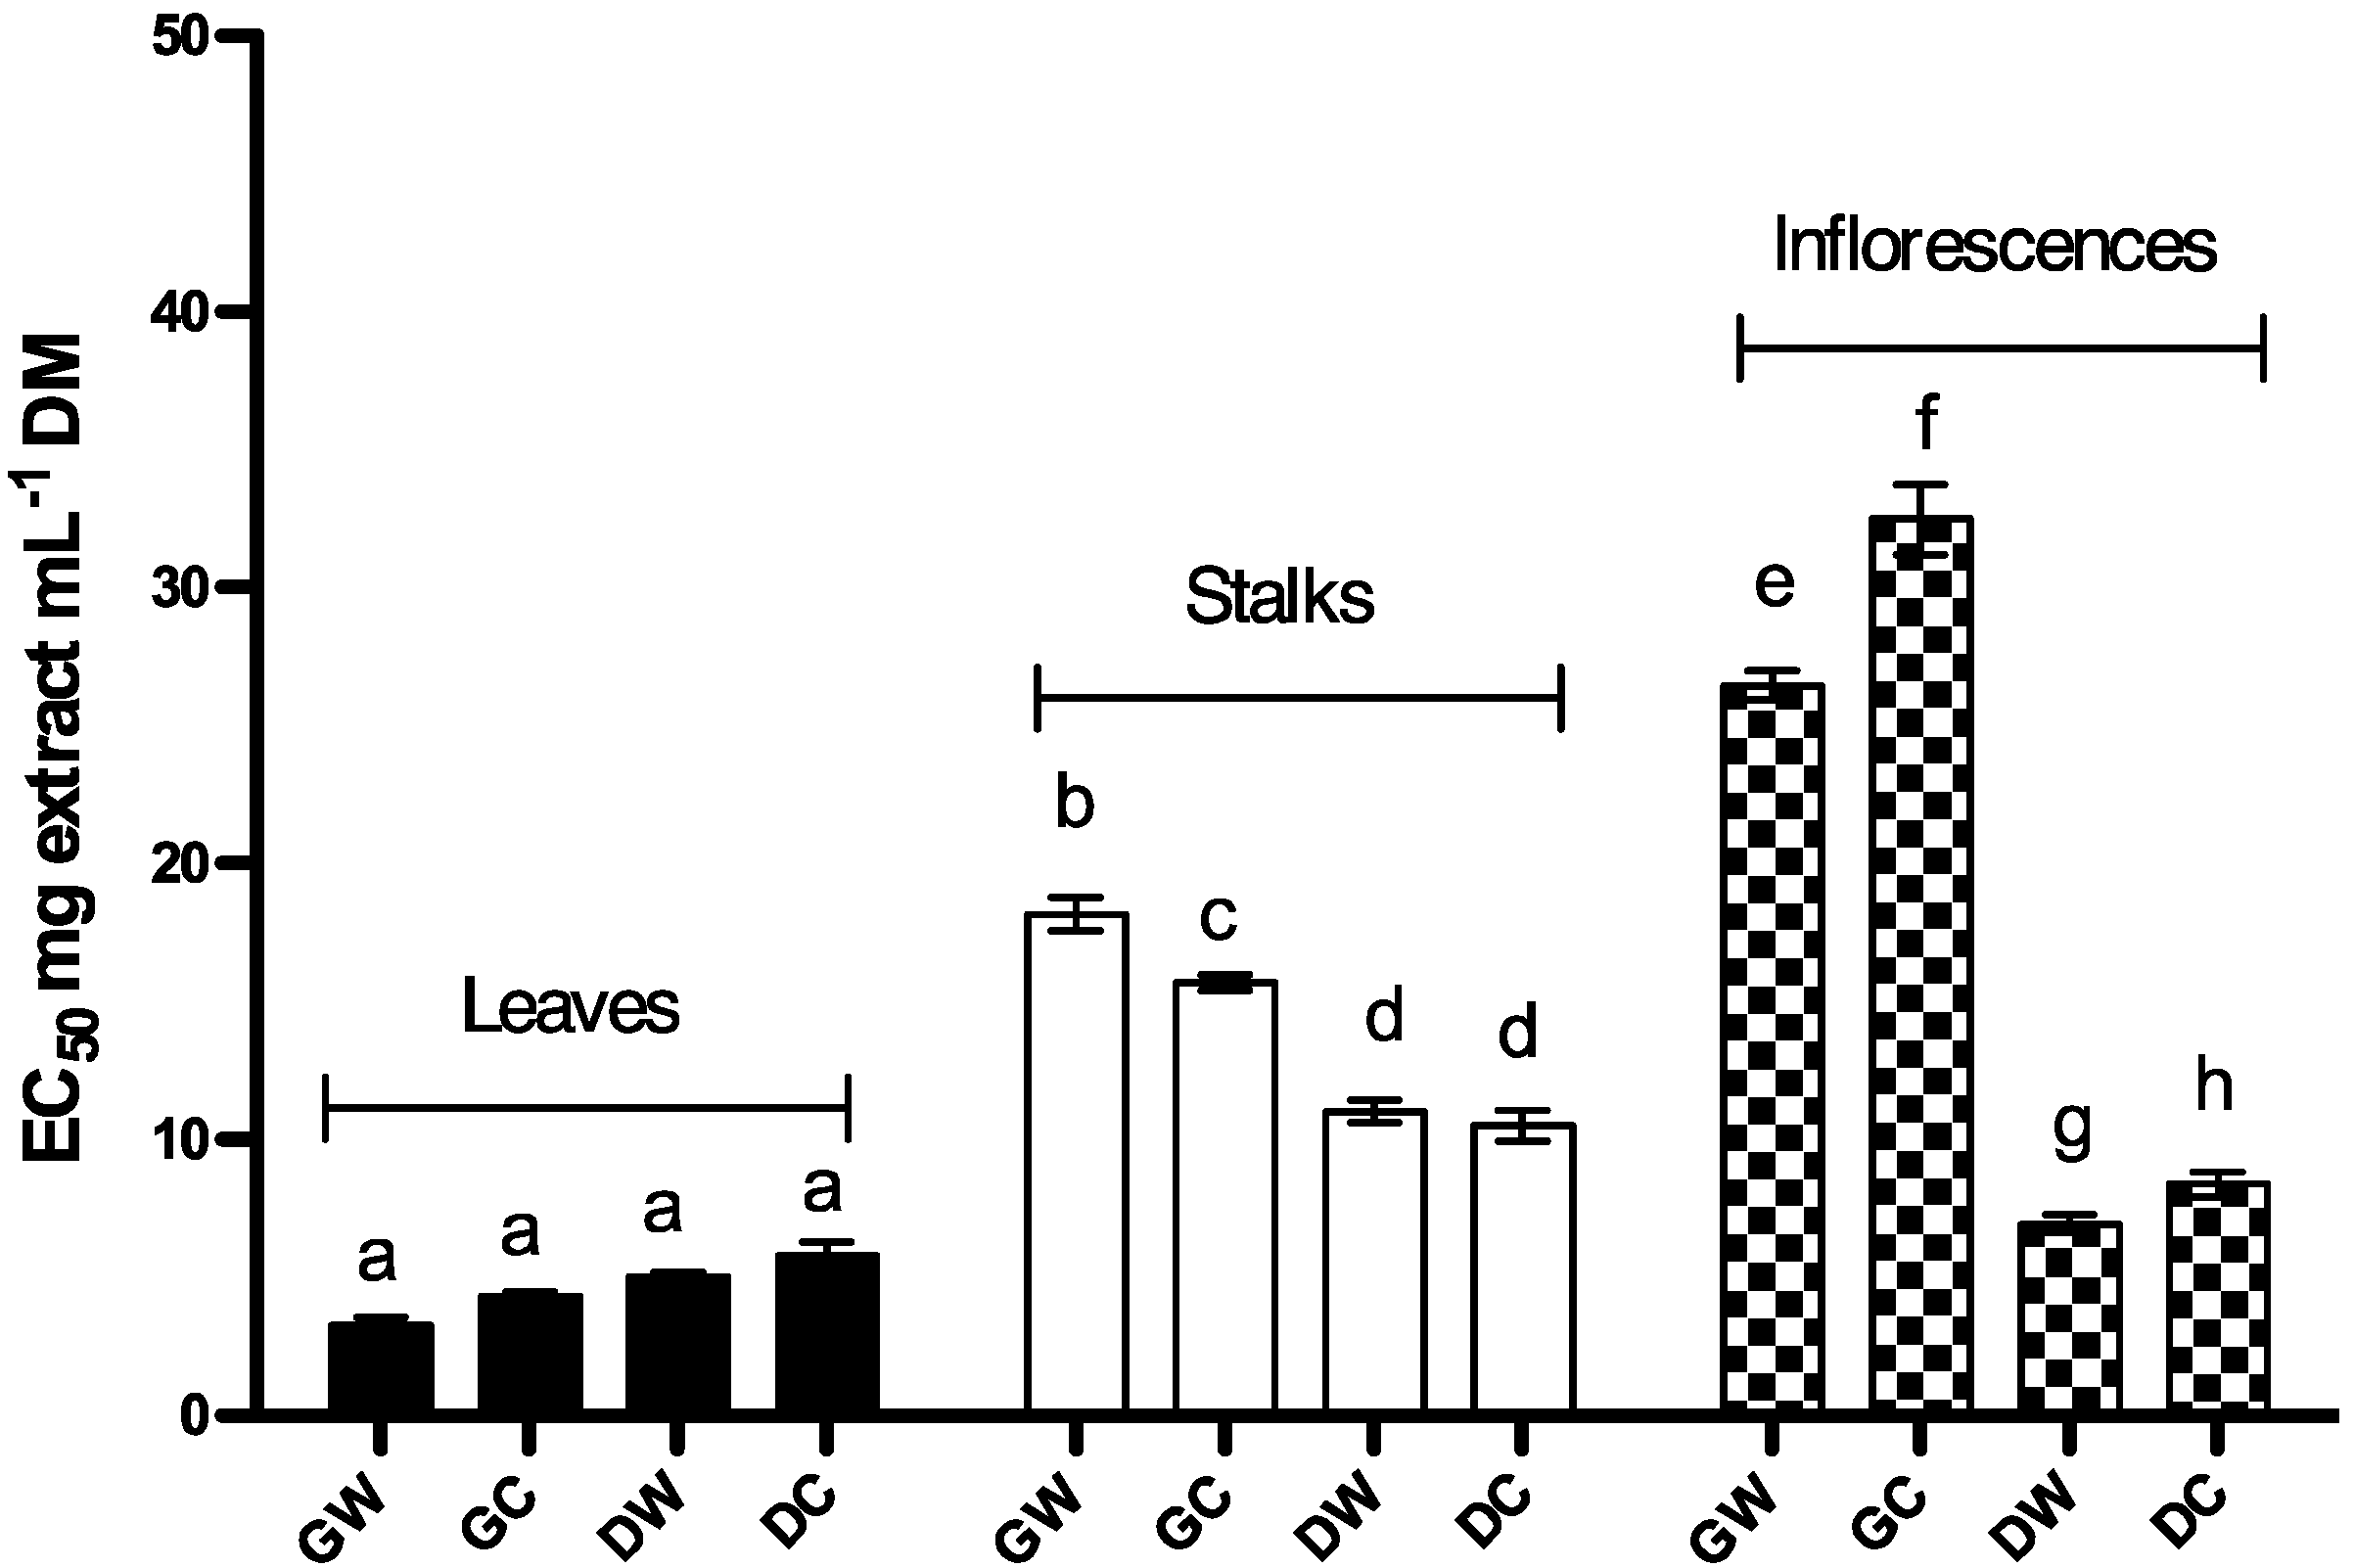
Phenolic content of methanolic extracts in wild and cultivated plants depend on the part of the plant and physiological plants stage (Figure 1). Phenolic contents were measured in a concentration range between 0.66 ± 0.07 and 9.25 ± 0.29 mg GAE g−1 DM (dry mater), in green cultivated stalks (GCS) and green cultivated leaves (GCL), respectively. The highest phenolic contents were found in leaf extracts, with a concentration range between 5.22 ± 0.1 and 9.25 ± 0.29 mg GAE g−1 DM in dry wild leaves (DWL) and GCL, respectively (Table 1).
Three Way Analysis of Variance showed a significant interaction (P < 0.001) between botanical variety (Cc var. altilis and Cc var. sylvestris), harvest time (dry and green plants) and plant part (leaves, stalks and inflorescences). Interactions between botanical varieties vs. harvest time were analyzed across different plant parts. There was a significant difference (P < 0.001) between the mean values of wild and cultivated plant extracts (averaging over levels of harvest time). In addition, there was no difference (P = 0.611) between the mean values of different harvest time over levels of botanical variety. These results suggest that, regardless the harvest time, the phenolic content of leaf extracts obtained from cultivated cardoons are different (higher) from those obtained from the wild variety (Figure 1). In stalks, there was significant interaction between botanical variety and harvest time (P < 0.005). There was no statistical difference in the mean values among different levels of botanical variety over levels of harvest time (P = 0.813); however, there was significant difference (P < 0.001) between harvest times (averaging over botanical variety). These results suggest that, concerning stalks extracts, phenolic content depends mainly on the harvest time; extracts obtained from mature plants are richer in phenols than those obtain from immature plants (Figure 1). There is significant interaction between botanical variety and harvest time in the phenolic content of extracts obtained from inflorescences (P < 0.001). Both the mean values of levels of botanical variety (over levels of harvest time) and the mean values of levels of harvest time (over levels of botanical variety) are significantly different. Phenol concentration in inflorescences depends on both the harvest time and cardoon variant. Extracts obtained from mature inflorescences exhibit higher phenol concentrations than those obtained from immature inflorescences. On the other hand, between plants with the same harvest time, the amount of phenols is higher in wild cardoon (var. sylvestris) than in cultivated cardoon (var. altilis);
Table 1. Total phenolic contents and EC50 values for reducing capacity and 2,2-diphenyl-1-picrylhydrazyl (DPPH) scavenging activity of different Cynara cardunculus (Cc) extracts. Each value represents the mean ± S.D. of three determinations.
Phenolic content (mg/g Cc DM)EC50 Reducing capacity (mg/mL DM)EC50 DPPH scavenging activity (mg/mL DM)
LeavesDryCultivated7.31 ± 1.015.79 ± 0.476.97 ± 1.28
Wild5.22 ± 0.105.02 ± 0.186.95 ± 1.37
GreenCultivated9.25 ± 0.294.32 ± 0.143.44 ± 0.96
Wild5.56 ± 0.013.28 ± 0.2915.78 ± 2.99
StalksDryCultivated2.86 ± 0.2410.52 ± 0.5713.63 ± 3.11
Wild2.88 ± 0.2411.04 ± 0.4113.98 ± 2.85
GreenCultivated0.66 ± 0.0715.70 ± 0.2934.33 ± 7.46
Wild0.67 ± 0.1218.17 ± 0.6146.67 ± 2.46
InflorescencesDryCultivated4.06 ± 0.148.39 ± 0.4511.15 ± 1.88
Wild3.58 ± 0.026.96 ± 0.329.16 ± 1.89
GreenCultivated2.62 ± 0.0532.49 ± 1.2815.76 ± 4.21
Wild1.20 ± 0.0726.46 ± 0.5366.08 ± 8.77
Figure 1. Total phenolic contents of different Cc extracts expressed in mg of gallic acid per gram of plant used to obtain the extract (mg GAE g−1 DM). Each value represents the mean ± S.D. of three determinations. At least one same letter means no significant differences at P ≤ 0.05. Abbreviations: GW: green wild; GC: green cultivated; DW: dry wild; DC: dry cultivated.
Agriculture 02 00472 g001

2.1.2. Reduction Capacity

To evaluate the reduction capacity of Cc extracts, the iron (III) to iron (II) reduction assay was performed [28]. In this assay, the strongest antioxidant compounds convert the oxidation form of iron (Fe3+) in ferric chloride to ferrous (Fe2+), as a consequence the yellow color (of the test solution) changes to various shades of green and blue depending on the reducing power of extracts or compounds tested. Therefore, the production of Fe2+ can be monitored by measurement of Perl’s Prussian blue formation at 700 nm. Figure 2 shows Fe3+ reduction evaluated by the increase in absorbance at 700 nm, and expressed in terms of EC50 values. A lower EC50 implies higher reduction power of the extract; thus, the highest reduction activity was found in leaves extracts while the lowest reduction activity was found in immature inflorescences (Figure 2; Table 1). Statistical comparison between the extracts shows significant interaction between botanical variety, harvest time and plant part (P < 0.001). Within leaf extracts there was no significant interaction between botanical variety and harvest time (P = 0.662) and there was no difference between reduction capacity of leaves extracts. In stalks and inflorescences extracts there was significant interaction between botanical variety and harvest time (P = 0.005 and P < 0.001 respectively). Within stalk extracts obtained from green plants, there was a significant difference between wild and cultivated plants (P < 0.001); however, there was no difference between botanical varieties in extracts obtained from dry plants (P = 0.256). Concerning biological variety, both wild and cultivated cardoon extracts presented significant differences depending on harvest time (P < 0.001). Averaging over levels of plant variety, EC50 for reduction capacity of extracts obtained from green plants was higher than that from dry plants.
Figure 2. Reduction capacity of Cc extracts expressed in terms of EC50. Each value represents the mean ± S.D. of three determinations. At least one same letter means no significant differences at P ≤ 0.05. Abbreviations: GW: green wild; GC: green cultivated; DW: dry wild; DC: dry cultivated.
Agriculture 02 00472 g002
Within inflorescences, there were significant differences between biological varieties both for extracts obtained from green (P < 0.001) and dry (P = 0.004) plants; the EC50 was higher for green plants (immature inflorescences). Concerning the harvest time, there were significant differences between extracts obtained from immature and mature inflorescence for wild and cultivated plants (P < 0.001). Averaging over the levels of plant variety, EC50 for reduction capacity of extracts obtained from green plants (immature inflorescence) was higher than that of dry plants (mature inflorescence).
Summarizing the Multiple Comparison (Tukey test) results; the reduction capacity of the extracts decreased in the following order: leaf extracts > dry wild inflorescence (DWI) > dry cultivated inflorescence (DCI) > dry wild stalks (DWS) and DCS > green wild stalks (GWS) > GWS > green wild inflorescence (GWI) and green cultivated inflorescence (GCI) (Figure 2).
Pearson Product Moment analysis showed a negative correlation between reduction capacity (expressed as EC50) and phenolic contents (r = −0.553). Given that higher EC50 implies lower reduction capacity, a negative correlation between EC50 and total phenolic concentration means that reduction capacity increases with phenols concentration.

2.1.3. Free DPPH Radical-Scavenging Activity

DPPH is a stable organic free radical with adsorption band at 515–528 nm. When accepting an electron or a free radical species it loses this adsorption, resulting in discoloration from purple to yellow [29]. Extracts’ capacity to scavenge DPPH free radicals was evaluated based on DPPH discoloration. In this assay, antiradical compounds induce DPPH solution discoloration, which can be measured at 517 nm. Figure 3 shows the scavenging capacity of Cc extracts expressed in terms of extract concentration providing a decrease of 50% in absorbance. A lower EC50 implies higher scavenging capacity. Thus, our results showed that the highest scavenging capacity was found in leaf extracts (Figure 3; Table 1). Three Way Analysis of Variance showed that, for scavenging activity, there was a significant interaction between botanical variety, harvest time and plant part. Concerning leaves extracts, there was no significant interaction between botanical variety and harvest time (P = 0.019). GCL extracts exhibit the highest scavenging capacity; EC50 for GCL extract is significantly lower than EC50 for green wild leaf (GWL) extract. For stalks and inflorescences extracts there was significant interaction between botanical variety and harvest time (P = 0.006 and P < 0.001 respectively). For green stalks extracts there was significant differences between wild and cultivated plants (P < 0.001); however, there was no difference between biological varieties within extracts obtained from dry plants (P = 0.92). Both for extracts obtained from stalks of wild and cultivated plants there was a significant difference between harvest times (P < 0.001). Concerning extracts obtained from immature inflorescences; there was a significant difference between wild and cultivated plants (P < 0.001); however, there was no difference between biological variety within extracts obtained from mature inflorescence (P = 0.573). There was a significant difference between mature and immature inflorescence within extracts obtained from wild cardoon (P < 0.001). For extracts obtained from inflorescences of cultivated plants there was no difference between harvest times (P = 0.199). All Pairwise Multiple Comparison analysis showed that the scavenging activity of GWL extracts was statistically equal to DWL, dry cultivated leaf (DCL), DWS, dry cultivated stalks (DCS), GCI, dry wild inflorescence (DWI) and DCI; being significantly lower than the activity of GCL extracts (Figure 3). DWL, DCL, DWI and DCI extracts activity was statistically equal to both GWL and GCL extracts. In summary, the scavenging capacity of the extracts decreased in the following order: GCL > DWL, DCL, DWI and DCI > GWL, DWS, DCS and GCI > GCS > GWS > GWI. Scavenging capacity was statistically correlated with the total phenolic content (r = −0.716); higher total phenolic content implies higher scavenging capacity (lower EC50).
Figure 3. DPPH free radical scavenging capacity of Cc methanolic extracts, expressed in terms of EC50. Each value represents the mean ± S.D. of three determinations. At least one same letter means no significant differences at P ≤ 0.05. Abbreviations: GW: green wild; GC: green cultivated; DW: dry wild; DC: dry cultivated.
Agriculture 02 00472 g003

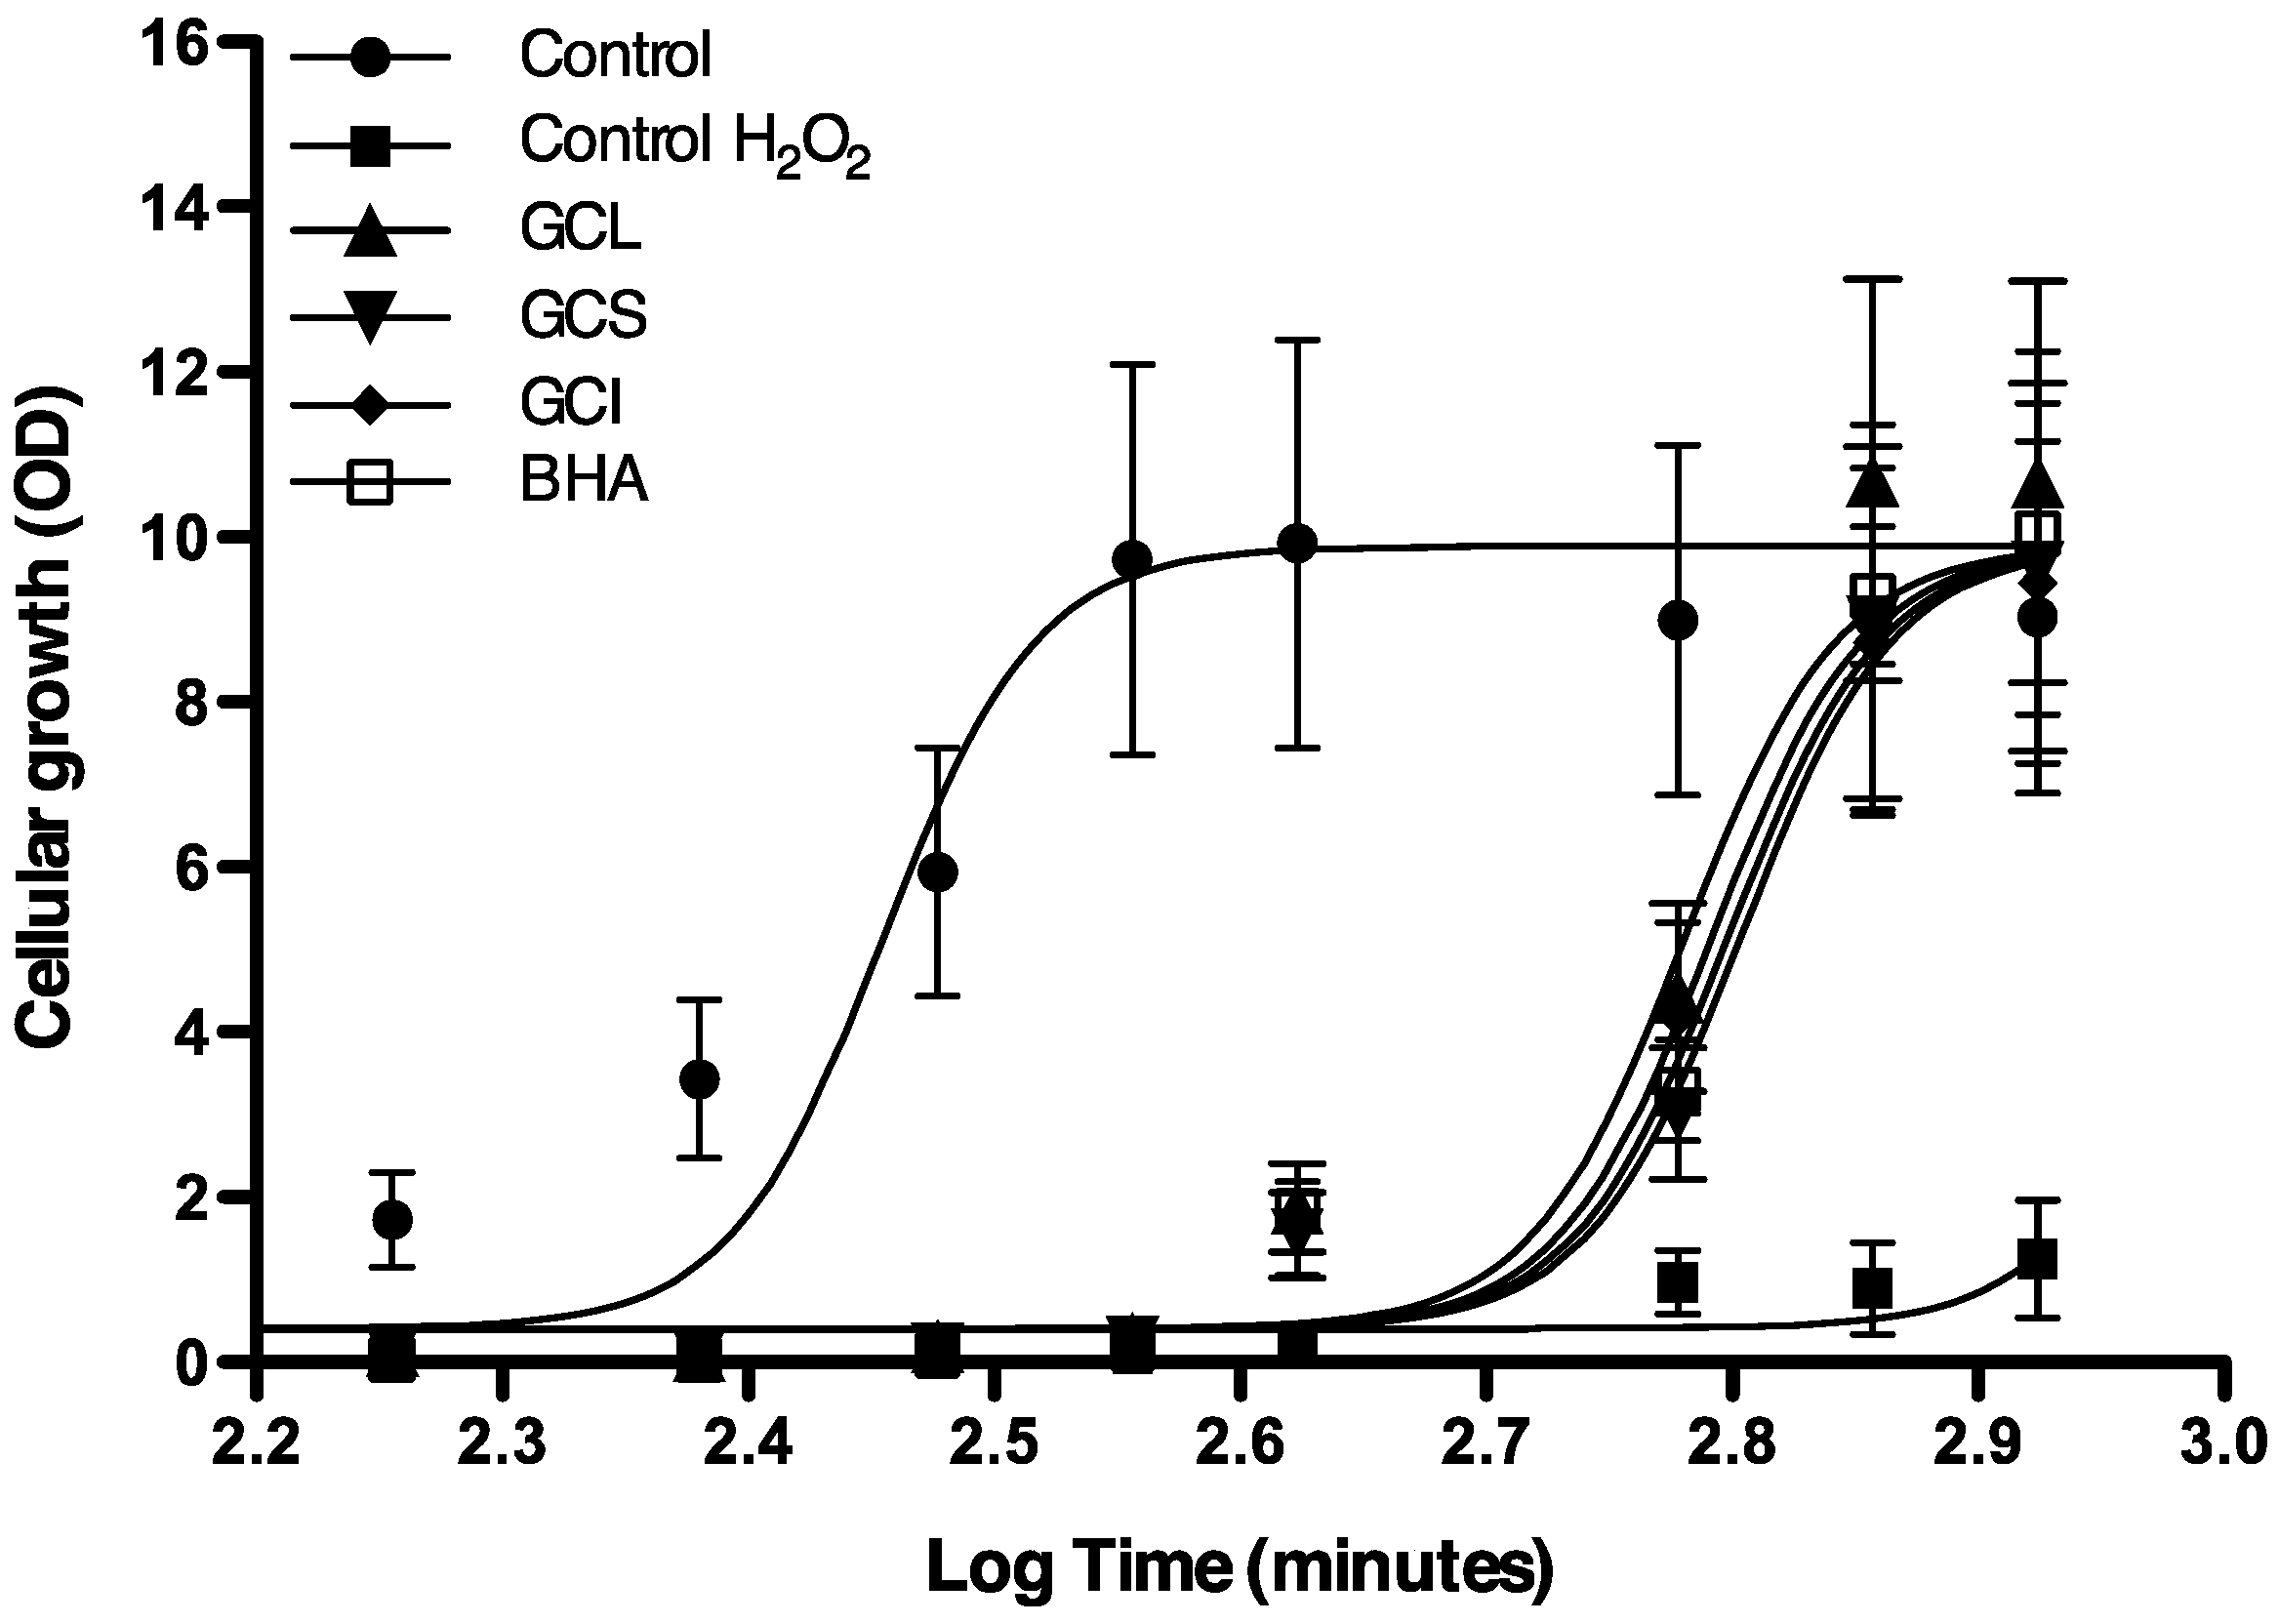
2.1.4. Protective Effect of Cc Extracts against H2O2 Radicals in Saccharomyces cerevisiae

To evaluate whether in vitro results could be extrapolated to in vivo systems; yeast (Saccharomyces cerevisiae) were incubated with an oxidative agent (H2O2) together with Cc extracts or 2-tert-butyl-4-methoxyphenol (BHA, a commercial antioxidant). Cellular growth in cells incubated with Cc extracts and H2O2 was monitored during 16 hours and compared with cellular growth in standard conditions (only YPD medium) and in cells incubated solely with the oxidative agent (H2O2). Yeast incubated with H2O2 in the absence of extracts or BHA does not grow (Figure 4). Cells incubated with Cc extracts or BHA exhibited a delay in growth compared to control; nevertheless, they were able to recover and reach the maximum cellular growth after 16 hours (Figure 4). Statistical comparison between GC50, defined as the time required to reach 50% of maxim cellular growth, showed that the protective effect of Cc extracts at 25 μg GAE mL−1 was statistically comparable to the effect of BHA at equivalent concentration (Figure 5). Differences between extracts activity were more tenuous than those found in vitro; nevertheless, similar to in vitro trials, the strongest effect was found in leaf extracts (Figure 5). It is noteworthy that 25 μg GAE mL−1 in leaf extract corresponds to an extract concentration, of 2.702 expressed as mg plant tissue mL−1, considerably low in relation to stalks (38.12 mg·mL−1) or inflorescence (9.55 mg·mL−1) extracts.
Figure 4. Cellular growth during 16 hours of S. cerevisiae in YPD medium (filled circles), YPD medium with 0.1 mM H2O2 (filled squares), YPD medium with 0.1 mM H2O2 + 25 μg GAE mL−1 of green cultivated leaves (GCL) (filled triangles), green cultivated stalks (GCS) (inverted filled triangles), green cultivated inflorescence (GCI) (filled diamond) and 25 µg·mL−1 2-tert-butyl-4-methoxyphenol (BHA) (open squares). Each value represents the mean ± S.D. of three determinations.
Agriculture 02 00472 g004
Figure 5. Protective effect of Cc extracts and BHA at 25 μg·mL−1against 0.1 mM H2O2 oxidative damage, expressed in terms of GC50. Each value represents the mean ± S.D. of three determinations. At least one same letter means no significant differences at P ≤ 0.05.
Agriculture 02 00472 g005

2.1.5. Effect of Cc Extracts in Tumor Cell Proliferation

Anti-proliferative potential of Cc extracts was evaluated by determination of percentage of viability in cells treated with Cc extracts compared with cells growing in control conditions. Within the concentration range tested (10 μg to 1 mg Cc mL−1), only GCL, GWL, DCI and DWI extracts exhibited anti-proliferative potential (Figure 6). Stalks, dry leaves and green inflorescences extracts had no effect on cellular viability (data not shown). Bioactive extracts exhibited a dose-dependent effect (Figure 6) with an IC50 of 259.4 μg Cc mL−1 for GCL, 316.4 μg Cc mL−1 for GWL, 407.7 μg Cc mL−1 for DCI and 400.5 μg Cc mL−1 for DWI (Figure 7). Green cultivated leaf extracts were significantly more effective decreasing tumor cells viability than green wild leaves (P = 0.001), dry wild heads (P = 0.002) and dry cultivated heads (P = 0.002). There were no statistically significant differences between the IC50 of GWL, DCI and DWI extracts (Figure 7).
Figure 6. Dose response curve representative of the effect of GCL (A) green wild leaves (GWL) (B), dry cultivated inflorescence (DCI) (C) and dry wild inflorescence (DWI) (D) extracts on human breast cancer MDA-MB-231 cell viability. Extracts concentration range from 10 to 1000 μg Cc mL−1.
Agriculture 02 00472 g006
Figure 7. Anti-proliferative effect of Cc extracts on MDA-MB-231 cells, expressed in terms of IC50. Each value represents the mean ± S.D. of three determinations. At least one same letter means no significant differences at P ≤ 0.05.
Agriculture 02 00472 g007

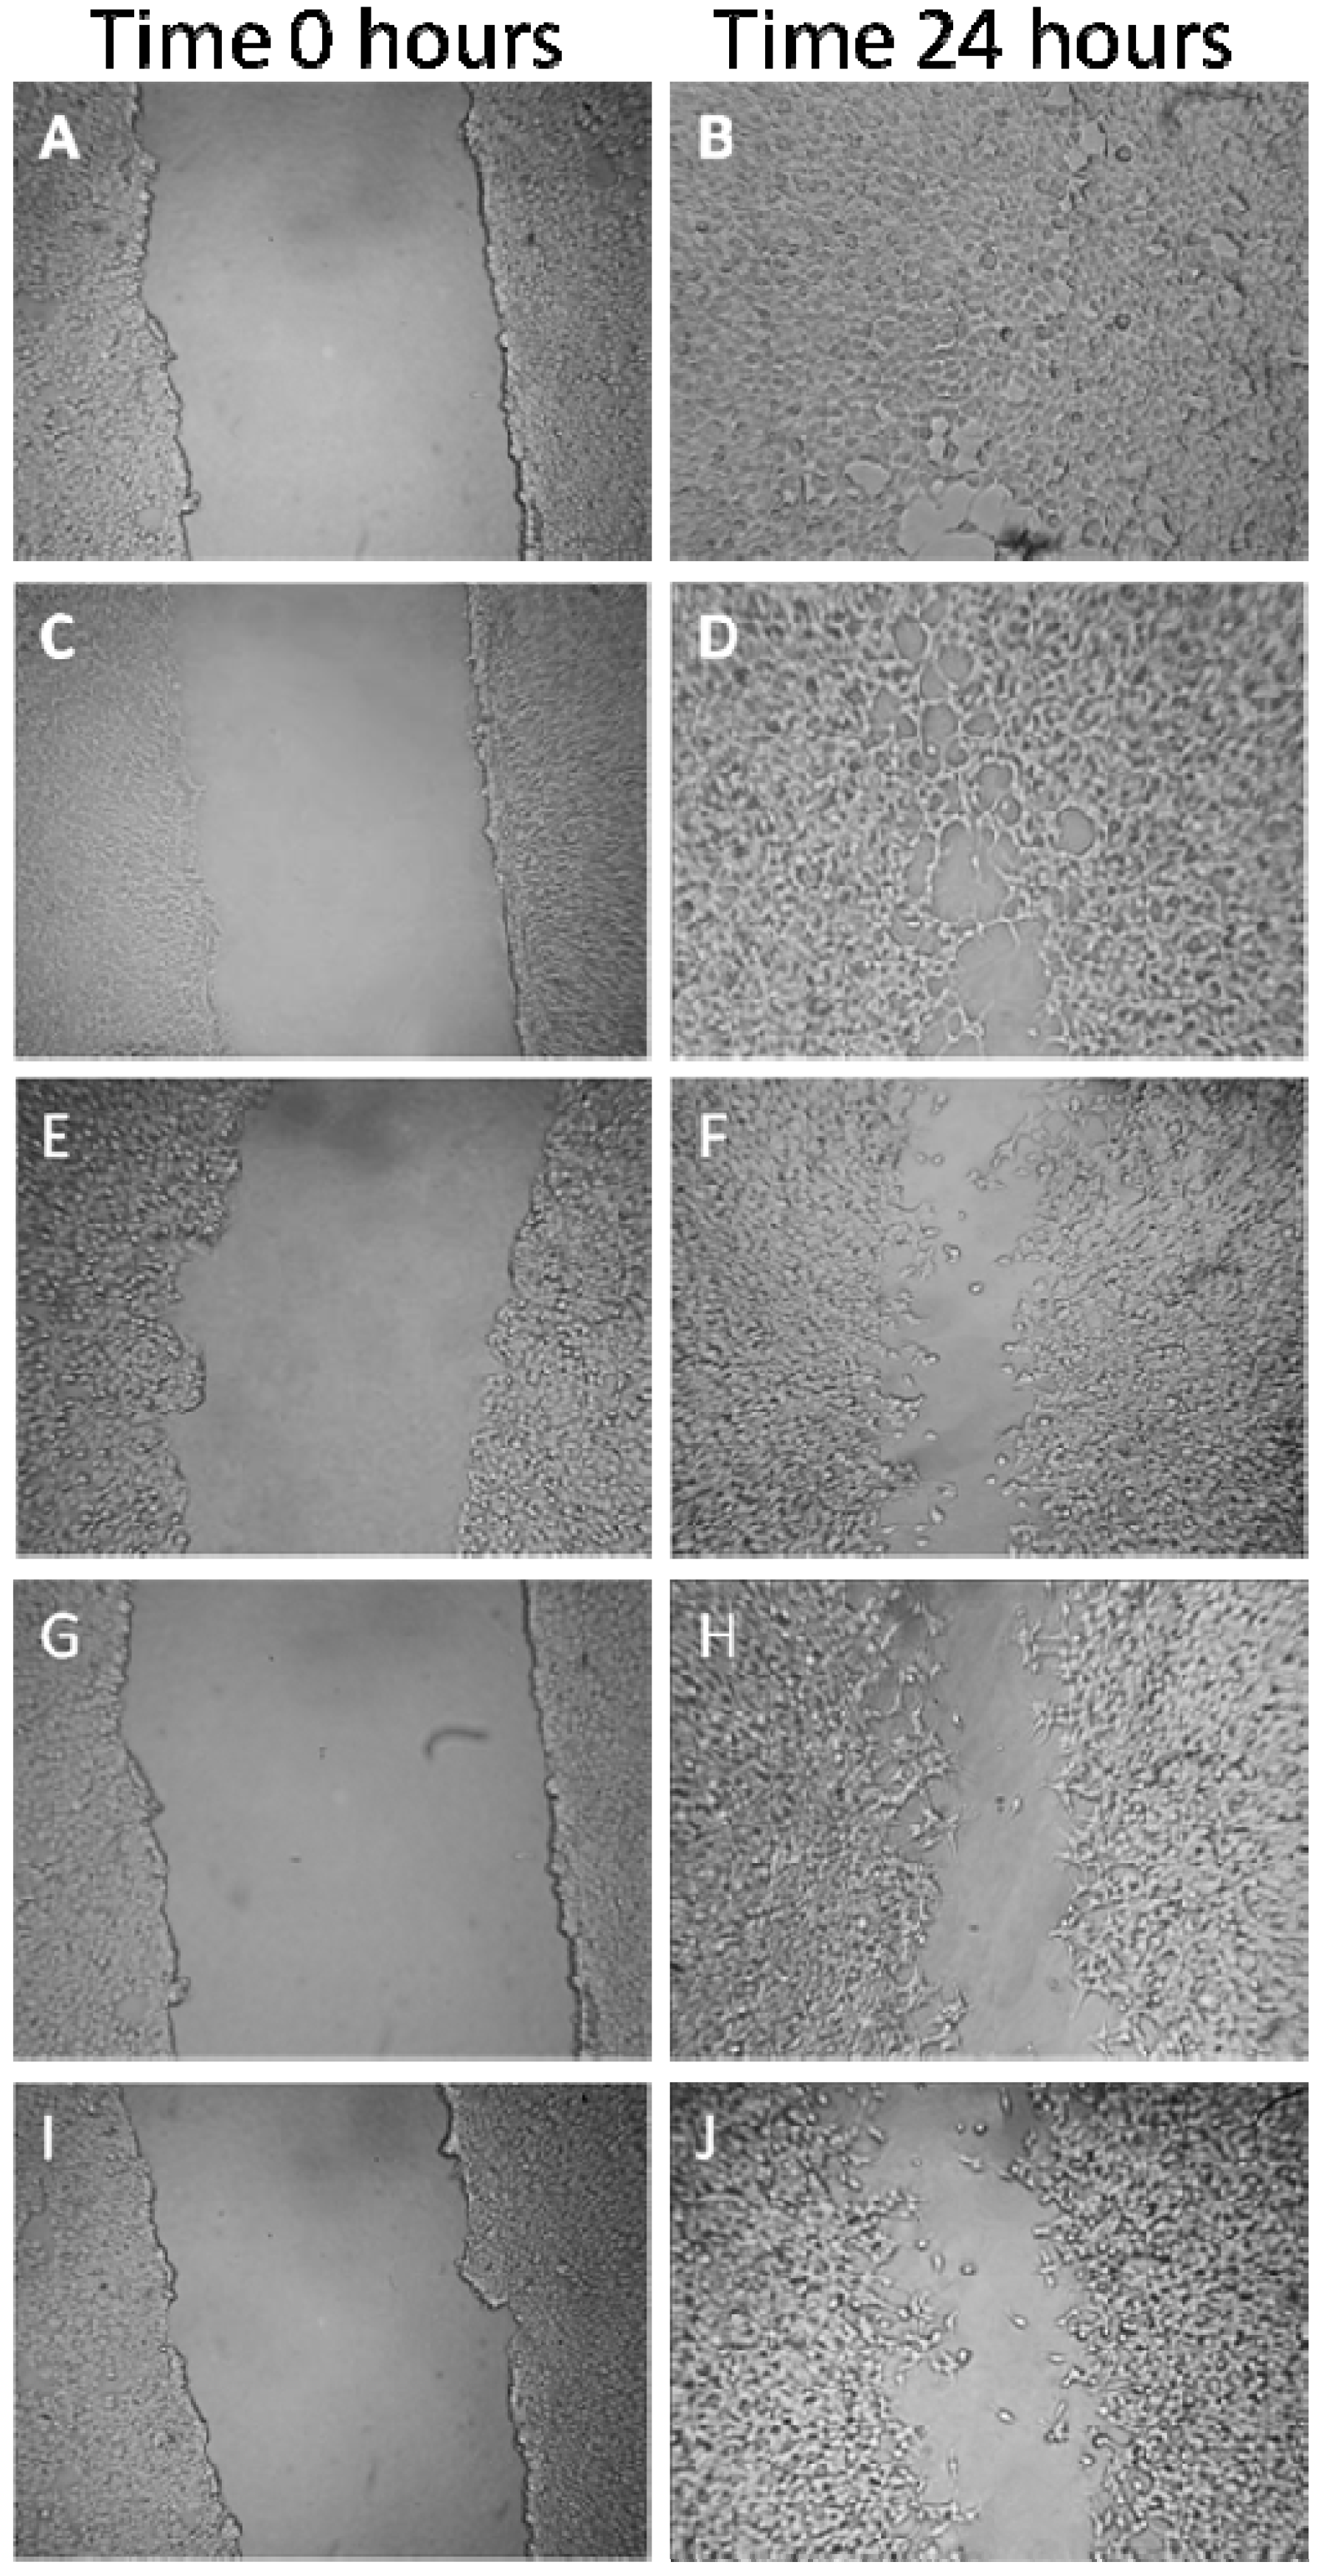
2.1.6. Effects on MDA-MB-231 Cells Migration Capability

The effect of GCL extract on the ability of tumor cells to migrate was evaluated by wound healing assay. The % of wound healed was evaluated in MDA-MB-231 incubated for 24 h with a range of GCL extract concentrations (35 μg·mL−1, 70 μg·mL−1, 140 μg·mL−1 and 280 μg·mL−1). GCL extract had a dose-dependent effect on cell viability (Figure 8 and Figure 9). The percentage of wound healed in control cells after 24 h was 89.9% ± 3.3; in cells incubated with 35 μg·mL−1, 70 μg·mL−1, 140 μg·mL−1 and 280 μg·mL−1 was 81.1% ± 0.48%, 76.3% ± 1.9%, 66.5% ± 4.9% and 45.7% ± 15.7% respectively (Figure 9). After the incubation period cells were tested for cell viability; only cells incubated with 280 μg·mL−1 of GCL extract exhibited a percentage of cell viability below 90%. Although GCL extract effect on cell migration was dose-dependent, only in cells incubated with 140 μg·mL−1 and 280 μg·mL−1 the percentage of cell migration was statistically lower than in control conditions. In cells incubated with 140 μg·mL−1 of GCL extracts cell viability was 92% and cell migration decreased around 20% compared to controls.

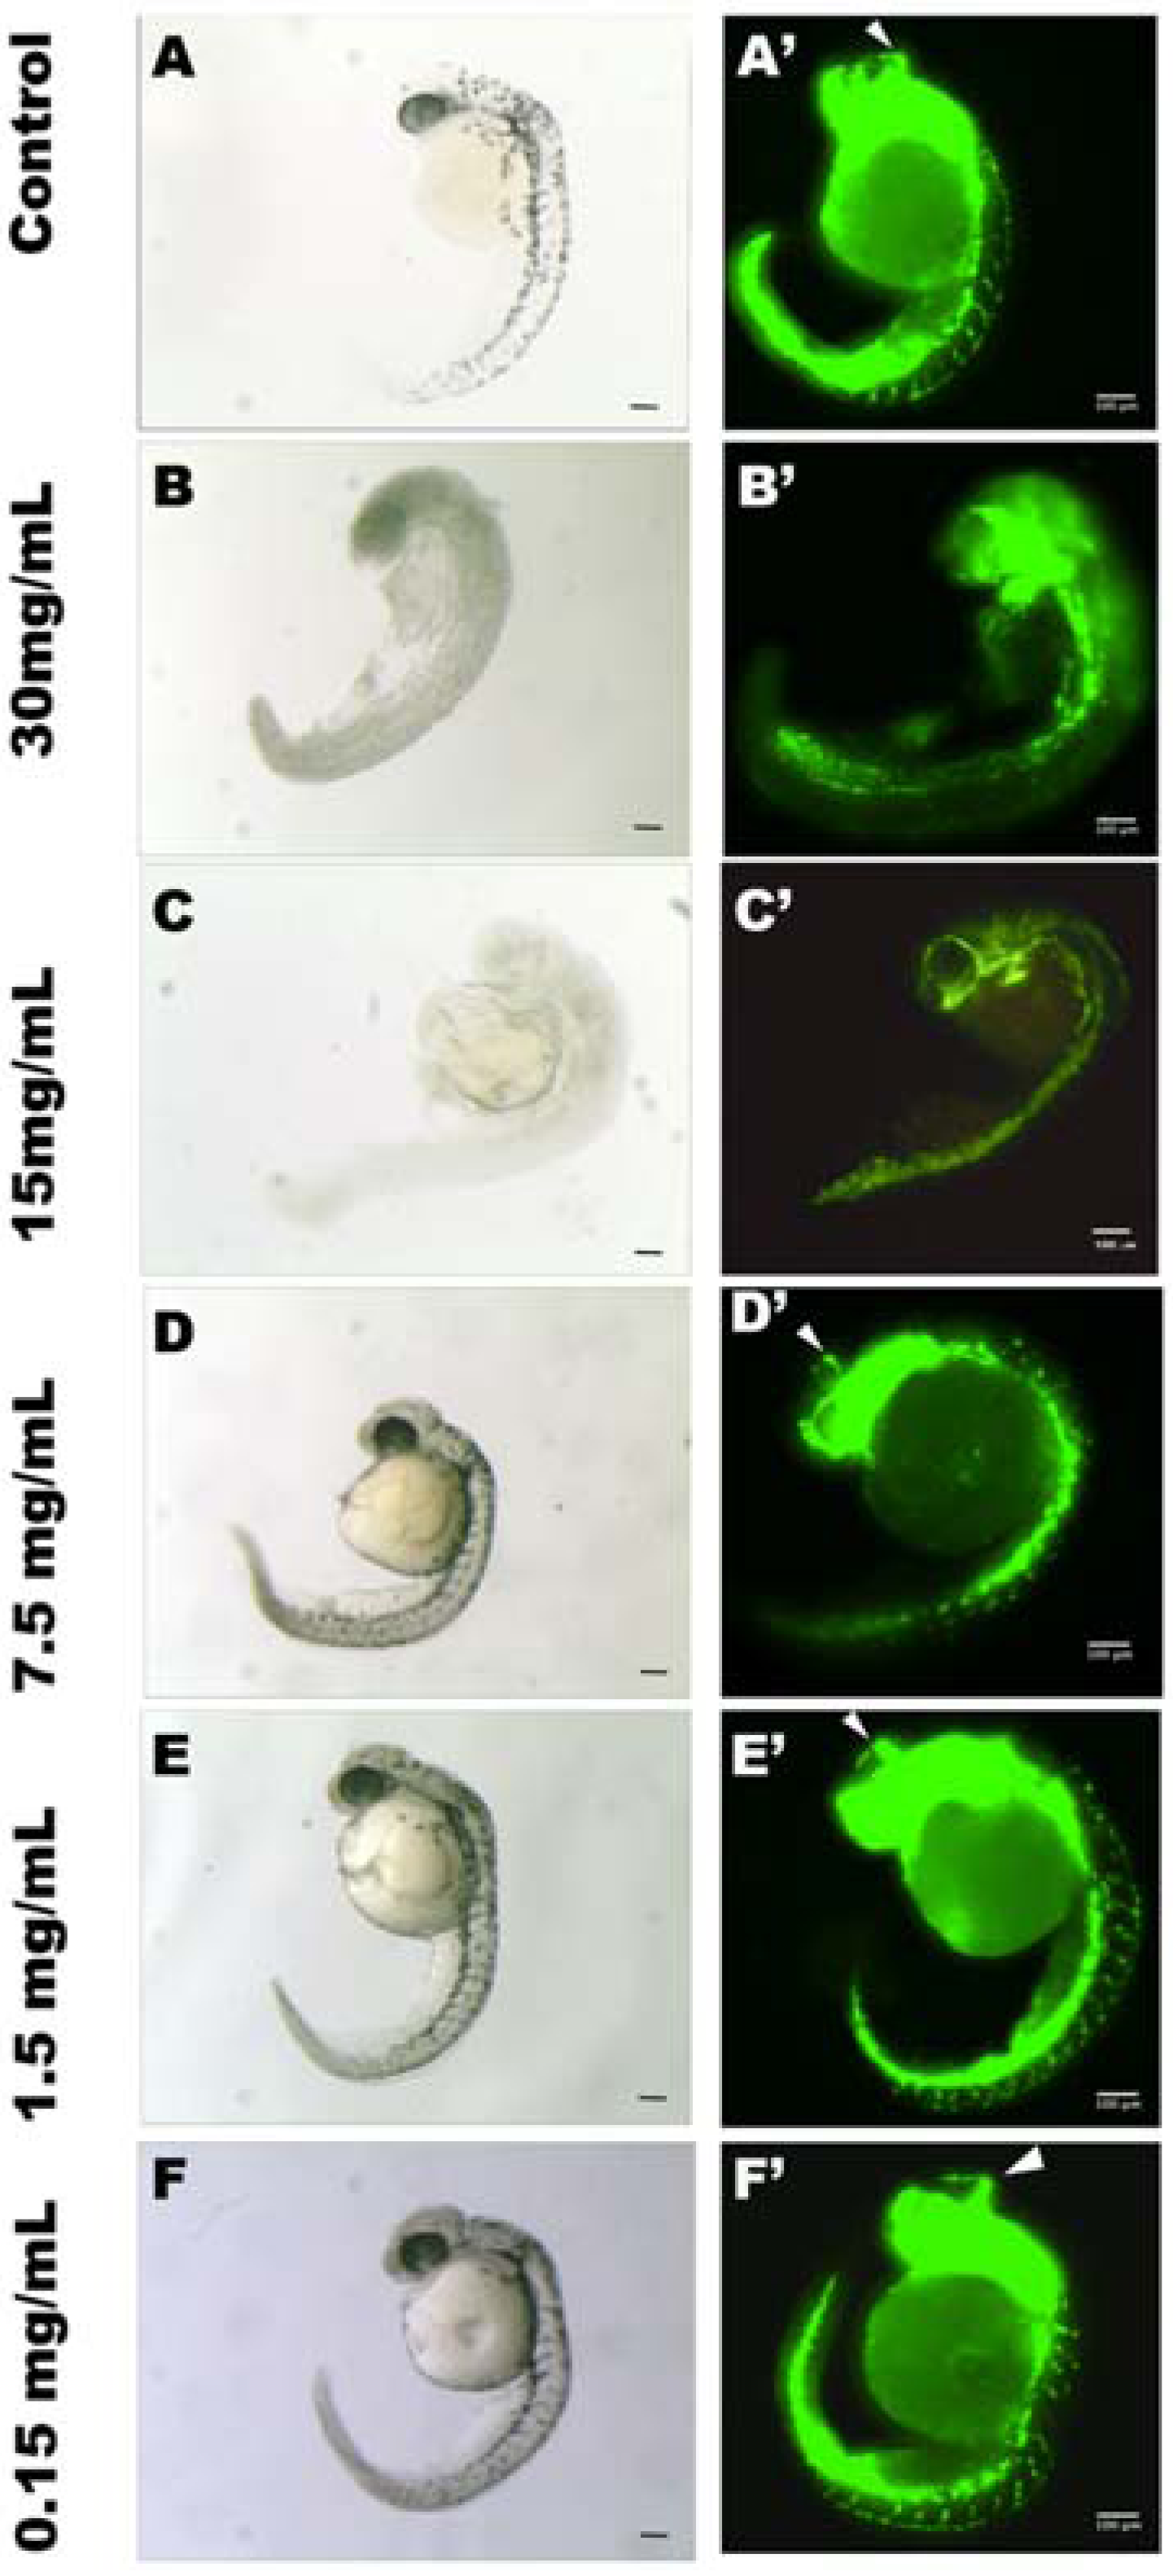
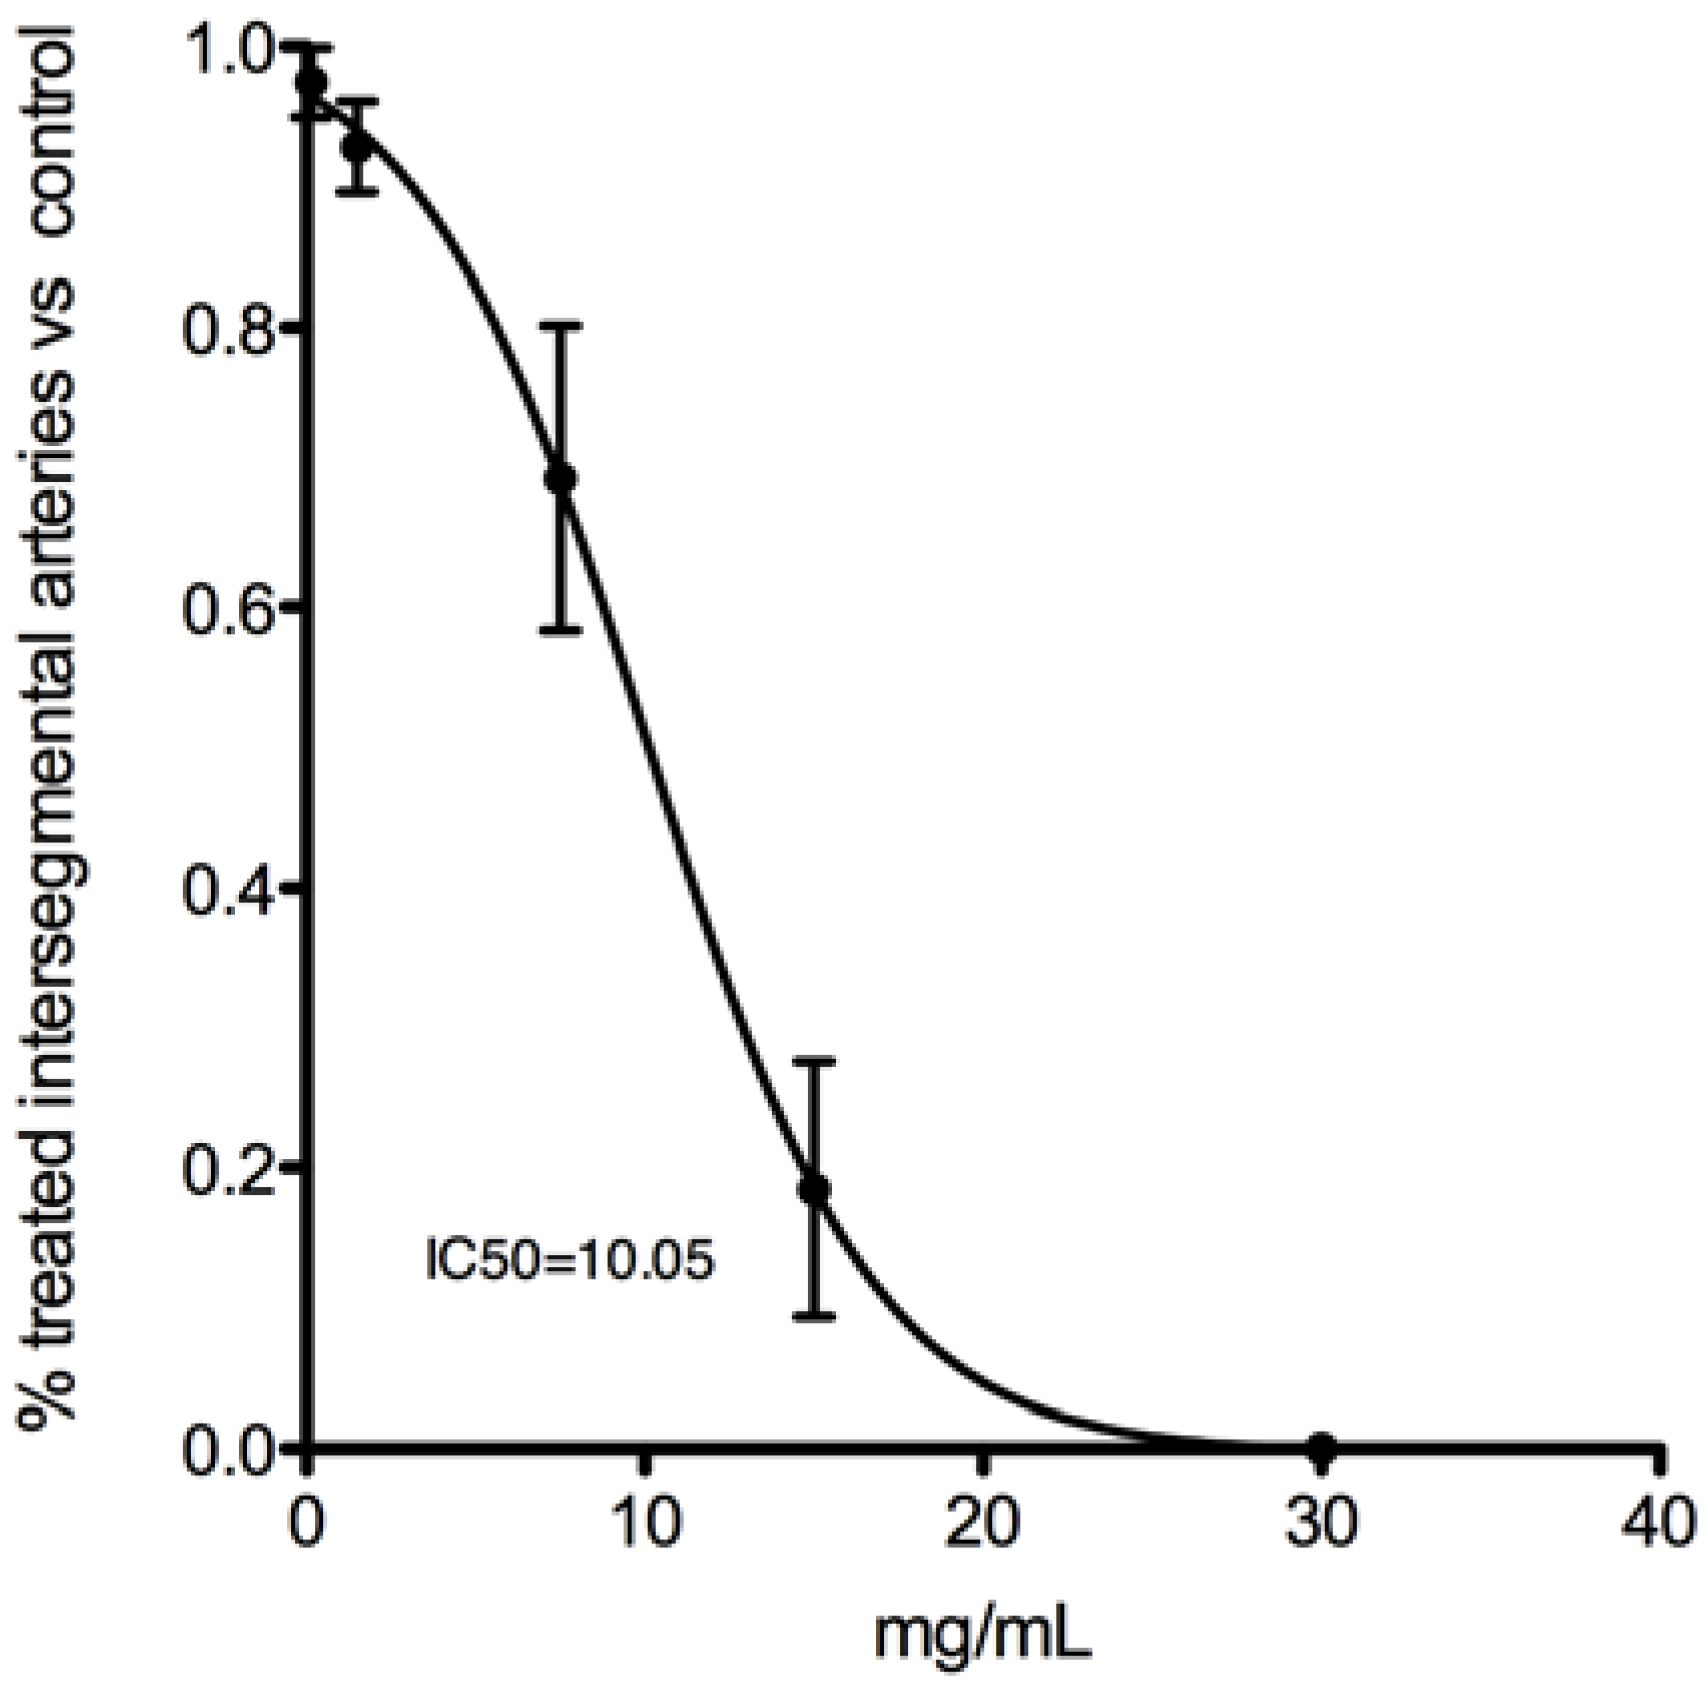
2.1.7 In Vivo Anti-Angiogenic Activity

Within the concentration range tested (0.15–30 mg/mL), GCL extract showed no toxicity (no mortality was observed). However, in the 30 and 15 mg GCL mL−1 experimental groups, zebrafish presented altered morphology compared to controls (Figure 10). Animals from the remaining experimental conditions did not present any morphological or developmental alteration when compared to control (Figure 10). Notably, all GCL extract concentrations tested had a significant effect on zebrafish angiogenesis (Figure 10); the experimental group incubated with 30 mg GCL mL−1 showed an absence of intersegmental vessel formation. In fish incubated with 15 mg GCL mL−1 only a few vessels started to develop (Figure 10C,C’). As the concentration of extract decreased there was a significant increase in the number of intersegmental vessels developing (Figure 10). The calculated IC50 for angiogenesis inhibition is 10.05 mg GCL mL−1 E3 medium (Figure 11). Treatment with concentrations bellow IC50 showed a specific effect on zebrafish angiogenic endothelial cells, but not on other developing vascular structures. In all treated animals the caudal and post-caudal vein, as well as the dorsal and caudal arteries were unaffected, even at the highest concentration tested. On the other hand, head vasculature was severely affected. At 15 and 30 mg GCL mL−1 there was no formation of the middle central vein (white arrowheads in Figure 10) nor of several other vascular head structures. In all other treated groups, the middle central vein was fully formed, as was most of the head vasculature.
Figure 8. Effects of Cc GCL extract on MDA-MB-231 cells migration. Migration in control conditions (A and B); in cells incubated with 35μg·mL−1 (C and D); 70 μg·mL−1 (E and F); 140 μg·mL−1 (G and H) and 280 μg·mL−1 (I and J).
Agriculture 02 00472 g008
Figure 9. Percentage of wound healing in MDA-MB-231 cells incubated with different concentrations of GCL extract during 24 h. Each value represents the mean ± S.D. of three determinations. At least one same letter means no significant differences at P ≤ 0.05.
Agriculture 02 00472 g009
Figure 10. Zebrafish angiogenicassay. Bright-field (AF) and 488 nm (A’–F’) images of 30hpf zebrafish Tg (fli1:GFP) embryos treated from 15 hpf to 30 hpf with 30 (B, B’), 15 (C, C’), 7.5 (D, D’), 1.5 (E, E’) and 0.15 (F, F’) μg·mL−1 of GCL extract in E3 medium. Control animals were cultivated only in E3 medium (A and A’).
Agriculture 02 00472 g010
Figure 11. Dose response curve representative of the effect of GCL extract on zebrafish embryonic angiogenesis. IC50 was calculated plotting the percentage of trunk vessels completely formed in treated animals vs. control animals against GCL extract concentration. Extract concentration ranged from 0.15 to 30 mg Cc mL−1.
Agriculture 02 00472 g011

2.2. Discussion

The current study showed that Cc extracts have, in general, high phenolic content. The highest phenolic contents were found in leaf extracts with a concentration range of 5.22 ± 0.1 and 9.25 ± 0.29 mg GAE g−1, in DWL and GCL, respectively. This phenolic concentration range is similar to previously reported Cc leaf methanolic extracts [30] and is comparable to that demonstrated for different aromatic and medicinal plants [31]. Concerning the antioxidant activity, our results showed that all extracts exhibit both reduction and DPPH free radical scavenging activities. Statistical analysis showed that for phenolic content, reduction capacity and DPPH scavenging activity there is significant interaction between botanical variety, harvest time and plant part; this indicates that the effect of one factor is not consistent at all combinations of the two other factors. Therefore, an unambiguous interpretation of the main effect is not possible. Thus significant interactions between factors were analyzed over the level of plant parts. Concerning the phenolic content, in leaf extracts, there is no difference between dry and green plants; however, there is significant difference between extracts obtained from wild and cultivated cardoon. These results showed that within leaf extracts the most important factor for phenolic content is the biological variety; extracts from cultivated plants are richer in phenols than those obtained from wild plants. Thus, cultivated plants are the most profitable to be used as source of natural phenolic compound. Regarding the reduction capacity and scavenging activity, leaf extracts are the most active. In addition, there is no interaction between harvest time and biological variety. This suggests that the antioxidant activity of leaf extracts does not depend on harvest time or biological variety. GCL extract presents the highest DPPH scavenging capacity.
In stalks, there is no differences between phenolic content of extracts from wild and cultivated Cc plants, however the phenolic content of extracts from green and dry plants are significant different. Extracts obtained from green plants are richer in phenols. Thus, within stalks extracts harvest time is the most important factor for phenol content. Regarding the reduction capacity and scavenging activity there are differences between green vs. dry and wild vs. cultivated Cc plants extracts. These results suggest that both factors are determinate for extracts anti-oxidant activity. Both for reduction capacity and scavenging activity extracts obtained from dry plants are more effective than those obtained from green plants.
Concerning extracts obtained from inflorescences there is statistical difference within harvest time and biological variety for phenolic content, reduction capacity and scavenging activity for both harvest time and plant variety. This suggests that both factors are important for determining the phenolic content and the antioxidant activity of the extracts. Extracts obtained from mature inflorescences present the highest levels of phenolic compounds; these extracts are also the most effective antioxidant (reduction capacity and scavenging activity).
In addition, there is a correlation between total phenolic concentration and antioxidant capacity, suggesting that extracts bioactivity depends, at least in part, on total phenolic contents. The highest concentration of phenols was found in cultivated leaf extracts, these extracts were also the more active antioxidants. Although differences between extracts activity in vivo are more tenuous than those found in vitro; leaf extracts are the more effective in protecting yeast against H2O2 damage. Our results showed that the antioxidant activity of Cc extracts in vitro can be extrapolated to in vivo systems. Furthermore, given that using an equal phenolic concentration the antioxidant effect of different Cc extracts is similar, these observations reinforce the hypotheses that antioxidant activity of Cc extracts strongly depends on phenol concentrations. Thus, Cc leaves extracts are a rich source of antioxidant compounds that could be used in preventive therapies in a number of diseases that are described to be related to oxidative stress, including cancer [32].
During the second stage of carcinogenesis (promotion) tumor cells acquire the capacity to undergo uncontrolled cell division. Most cancer therapies currently used target this phase of carcinogenesis; cancer chemotherapy relies mostly on cytotoxic drugs, which inhibit tumor cell proliferation and cause cell death. Our results showed that only four of the 12 Cc extracts tested are active in decreasing tumor cell viability. Thus, there is no correlation between total phenolic contents and the ability of Cc extracts to decrease cell viability. Unlike the antioxidant activity, total phenolic content does not seem to be essential for the anti-proliferative activity of Cc extracts; we hypothesize that the physiological mechanisms involved in decreasing tumor cell viability may require specific phenols. Alternatively, anti-proliferative effects of Cc extracts may be due to compounds other than phenols. Preliminary studies aiming to identify GCL bioactive phytochemicals in GCL are in progress; this extract was fractionated by solid phase extraction (SPE) and high performance liquid chromatography (HPLC) and the resultant fractions were tested for their anti-proliferative activity (data not published). Following this approach, a fraction with high bioactivity was obtained. Liquid chromatography coupled with mass spectrometry (LC-MS) analysis revealed that this fraction has a major peak which identification is ongoing.
The third stage of carcinogenesis is tumor progression, this stages involves metastasis and angiogenesis. Metastases are the cause of 90% of human cancer deaths [33]; the ability of a cancer cell to undergo migration and invasion allows tumor cells to escape from the primary tumor mass and spread to other parts of the body [34]. In addition, tumor growth relies on angiogenesis in order to receive an adequate supply of oxygen and nutrients. Tumors cannot grow more than 1–2 mm without blood supply for nutrient supply and waste removal [35]. GCL extract is effective in inhibition of breast tumor cell migration; however, metastasis involves other processes beyond the capacity of tumor cell to migrate. Further studies are needed to evaluate the in vivo effect of GCL extract on tumor cell metastization. Our results using the in vivo angiogenesis zebrafish model, point out GCL extract as a promising source of anti-angiogenic compounds. However, other experimental models should be use to evaluate the putative effect of Cc leaves extract on tumor induced angiogenesis.

3. Experimental Section

3.1. Chemicals

Methanol, yeast extract and sodium acetate were purchased from Merck (Darmstadt, Germany). The Folin-Ciocalteu reagent, sodium carbonate, gallic acid, potassium ferricyanide, ferric chloride, dextrose, peptone, 2-tert-butyl-4-methoxyphenol (BHA), 2,2-diphenyl-1-picrylhydrazyl (DPPH), Paraformaldheydo (PFA) Trichloroacetic acid (TCA) were obtain from Sigma-Aldrich (St. Louis, MO, USA); Dulbecco’s modified Eagle’s medium (DMEM), glucose, L-glutamine, fetal bovine serum (FBS), penicillin-streptomycin mixture solution, trypsin (5 g·L−1)—EDTA and trypan blue were purchased from Lonza (Verviers, Belgium).

3.2. Plant Material

Plants were collected at two different stages; during flowering (green plants) and after fructification (Cc plants dried naturally in field). Both wild (Cc var. sylvestris) and cultivated (Cc var. altilis) green Cc plants were collected in June 2009; dried plants were collected in August 2009. Wild plants were collected at Campo Experimental whereas cultivated plants were collected at Centro Hortofrutícola, both from Instituto Politécnico de Beja (south of Portugal). Green plants were storage at −80 °C; dried plants were kept in a dark dried container, at room temperature (RT) until used.

3.3. Sample Preparation

Twelve different extracts were prepared; green wild leaves (GWL), green cultivated leaves (GCL), green wild stalks (GWS), green cultivated stalks (GCS), green wild inflorescences (GWI), green cultivated inflorescences (GCI), dry wild leaves (DWL), dry cultivated leaves (DCL), dry wild stalks (DWS), dry cultivated stalks (DCS), dry wild inflorescences (DWI) and dry cultivated inflorescences (DCI). Dry (100 g) and fresh tissues (100 g) were cut into small pieces and left hydrating in water (100 g/L) overnight at RT. Thereafter, the water volume set to 400 mL in each recipient and 600 mL of methanol was added to achieve 60% methanol. Tissues were left in 60% methanol for 1 h, and then were homogenized with a blender and ultrasonicated (JP Selecta, Barcelona, Spain) for 5 min. Extracts in 60% methanol were then filtered using filter paper, followed by 0.2 μm filtration (VWR, vacuum filtration system 0.2 μm). The obtained extracts were completely evaporated (Laborota 4000 Efficient, Heidolph instruments GmbH, Schwaback, Germany) dissolved in water and stored at −80 °C until use. For dry matter (DM) determination, 10 g of fresh plants tissues was left in an oven at 70 °C and weight was recorded until stabilization. Measurements were made in triplicates. Concentrations for “green tissues extracts” were converted into dry matter. Extracts concentration was expressed in micrograms of Cc tissue DM per milliliter (μg Cc mL−1 DM).

3.4. Measurement of Total Phenolic Compounds

Total phenolic contents were determined using the Folin-Ciocalteu method [36]. Briefly, samples (100 μL) were mixed with Folin-Ciocalteu reagent (1.4 mL, diluted tenfold) and left for 5 min at RT. Then, 1.5 mL of sodium carbonate (60 g·L−1) was added and the mixture was then incubated at RT in the dark for 60 min. The absorbance was read at 725 nm in a Double-beam UV-Vis scanning spectrophotometer (Helios alpha, Thermo scientific, Bremen, Germany).
For the calibration curve different concentrations of gallic acid (500, 400, 300, 200, 100, 50, 10 µg·mL−1) were prepared in 60% methanol and treated as the samples. Total phenolic was expressed as milligrams of gallic acid equivalents per gram of DM (mg GAE g−1 DM). All samples were analyzed in three replications.

3.5. Reducing Power Assay

The reducing power was determined according to a previous described procedure [28]. Briefly, a serial dilution of the extracts was performed (100, 50, 30, 15, 10, 5 and 1 μg of Cc mL−1) and mixed with 2.0 mL of 200 mM sodium phosphate buffer (pH 6.6) followed by 2 mL of 1% potassium ferricyanide (w/v). The mixture was incubated in a water bath at 50 °C for 20 min. After incubation 2.0 mL of 10% TCA (w/v) was added and the mixture was centrifuged at 3000 rpm, for 10 min at 4 °C (Hermle Z323K, Hermle Labor Technik, Wehingen, Germany). The upper layer (1.0 mL) was mixed with 1.0 mL of 0.1% of ferric chloride (w/v), and the absorbance was measured spectrophotometrically at 700 nm in a Double-beam UV-Vis scanning spectrophotometer. Tests were carried out in triplicate. Increased absorbance of the reaction mixture indicates greater reducing power. The extract’s effective concentration (EC), providing 0.5 of absorbance (EC50), was calculated from the graph of absorbance registered at 700 nm against the correspondent extract concentration.

3.6. DPPH Radical Scavenging Assay

The radical scavenging activity of Cc extracts against DPPH free radical was assessed according to previously described [37,38]. A stock methanolic solution of 6 × 10⁻⁵ M DPPH was prepared. A serial dilution of the extracts was performed (100, 50, 30, 15, 10, 5 and 1 μg of Cc mL−1). Extract samples (300 μL) at different concentrations, a blank (containing methanol instead of DPPH solution) and a control (containing extracts solvent instead of the extract) were mixed with DPPH methanolic solution (2.7 mL). After mixing, they were left in dark for 60 min at RT. DPPH radical inhibition was measured at 517 nm against the blank. Tests were carried out in triplicate.
DPPH scavenging effect was calculated as percentage of DPPH discoloration using the following equation:
DPPH scavenging activity (%) = [1 − (Abs of sample/Abs DPPH control)] × 100
The percentage of scavenging activity was plotted against the sample concentration to obtain the EC50, defined as the concentration of sample necessary to cause 50% inhibition.

3.7. Protective Effect against H2O2 Radicals in Saccharomyces cerevisiae

Saccharomyces cerevisiae were cultured in YPD nutrient medium (1% yeast extract; 2% dextrose; and 2% peptone) at 30 °C under continuous stirring (130 rpm) (Orbital Shaker incubator, TEQ, Massamá, Portugal) for 24 h. Cells were incubated at an optic density (OD)600 of 0.3. Yeast was incubated with Cc extracts (GCL, GCS and GCF) in a concentration of 25 μg GAE mL−1 during 1 h. After this incubation period 0.1 mM H2O2 was added to the incubation medium and OD600 was immediately read (OD600 at time 0), yeast growth was monitored measuring the OD600 every hour for 16 h. In addition, cells were incubated with BHA (25 μg·mL−1) under the same conditions; BHA was used as reference compound. Two distinct controls were preformed; a positive control in which cells grew in standard conditions (just YPD medium) and a negative control in which cells grew in YPD medium containing H2O2. Cellular growth was accessed plotting OD600 against incubation time and GC50 (time required to reach 50% of maximum growth) was calculated from the obtain plots. The assay was performed in three independent experiments.

3.8. Cell Line and Culture

MDA-MB-231 human breast cancer cell line was obtained from American Type Culture Collection, and maintained in DMEM supplemented with 10% heat-inactivated FBS and 1% penicillin-streptomycin mixture solution. The cells were incubated in an atmosphere of 95% air and 5% CO2 at 37 °C (C150, Binder GmbH, Tuttlingen, Germany).

3.9. Analysis of Cell Viability

Cell viability was accessed using tetrazolium compound based CellTiter 96® AQueous One Solution Cell Proliferation (MTS) assay (Promega). MDA-MB-231 cells were seeded in 96-well plates at 2 × 10⁵ cells mL−1. After 24 h, cells were gently washed with 1X PBS, and then incubated with culture medium containing Cc extracts at various concentrations (10, 50, 100, 250, 500, 750, 1000 μg·mL−1) for 48 h. After the exposure period MTS assay was performed according to the manufacturer’s instruction.
IC50, defined as the extract concentration necessary to cause 50% inhibition of cell viability, was calculated plotting the percentage of cell viability compared to a control (no extract added) against the different Cc extracts concentration.

3.10. Wound Healing Assay

To evaluate cell motility, MDA-MB-231 cells (2.5 × 10⁵ cells mL−1) were seeded in 6-well plates and grown to 80%–90% confluence. After aspirating the growth medium, a linear wound 1 mm wide was made by scratching the monolayer with a sterile 200 μL micropipette tip. Cellular debris was removed by gently washing twice with 1× PBS. MDA-MB-231 cells were incubated with GCL extract at 35, 70, 140 and 280 μg of Cc leave mL−1 DM for 24 h. Wound healing of the cells was observed and photographed under phase-contrast microscope at time 0 and 24 h. Analyses were performed in triplicate. The area of the wound was measured in control and treated cells using the Motic Images Plus 2.0 software [39]. The percentage of wound healed was then calculated using the formula 100 (final area/initial area × 100%).

3.11. Animal Husbandry and Spawning

Adult zebrafish animals were maintained at 28 °C in a re-circulating water system (Tecnoplast, Milan, Italy). Zebrafish Tg(fli1:EGFP) parents crossed with wild-type (wt) parent pairs under 14 h:10 h (l:d) and made to spawn. Fertilized eggs were collected at 1-cell stage and incubated in E3 medium in Petri dishes at 28.5 °C. At 15 hours post-fertilization (hpf) [40] animals were screen and collected for green fluorescent protein (GFP) positive cells under a fluorescent SXZ 7 stereoscope system (Olympus, Tokyo, Japan).

3.12. Zebrafish Model for in Vivo Angiogenesis

Several dilutions of GCL extract were prepared in E3 medium as follows: 30, 15, 7.5, 1.5 and 0.15 mg GCL mL−1 E3 medium. Five experimental groups (with GCL extract) and a control (E3 medium) were assembled in a 6-well cell culture plate (Stardstar, Berlin, Germany).
Seven GFP-positive animals previously selected were incubated at 28.5 °C in each experiment group and control until 30 hpf [40]. At this time, animals were fixed at room temperature (RT) for 1 h in 1% PFA/1× PBS pH 7. Animals were rinsed 3× in 1× PBS pH 7 and immediately imaged in a Zeiss (Jena, Germany) Z2 microscope system. The number of intersegmental vessels and arteries developing in the trunk was counted. These data were used to plot a dose response curve as previously described [41].

3.13. Statistical Analysis

Each experiment was performed in triplicate. Results were expressed as means ± SD. Three-way analysis of variance (ANOVA; Sigma plot, San Jose, CA, USA) was used to test for differences between extracts activity (reduction capacity and DPPH scavenging activity) and total phenolic contents. One Way ANOVA was used to test for differences between extracts effect on cell migration capacity and cell viability). Where differences did exist, the source of the differences at a P < 0.05 significance level was identified by all pairwise multiple comparison procedure (Tukey test). Pearson Product Moment Correlation was applied to search for correlation between extracts activity and total phenols concentration.

4. Conclusions

The highest phenolic content was found in leaf extracts followed by inflorescences and stalks. Within leaf extracts, those obtain from cultivated plants are richer in phenols than those obtain from wild plants. Thus leaves from Cc var. altillis are good source of anti-oxidants, which could be used both as food supplements and conservatives.
Green cultivated leaf Cc extract exhibits pharmacological activity as an antioxidant, inhibiting angiogenesis, tumor cell viability and migration capacity. Thus, a single extract is effective in inhibiting the main key stages of carcinogenesis; initiation (antioxidant), promotion (anti-proliferative) and progression (anti-angiogenic and anti-migratory). Current results are very promising concerning the application of Cc extracts for tumor prevention and/or curative therapies; however, there is a long way to go. Further studies are required particularly focused on the identification of compounds responsible for the anticarcinogenic activities described (anti-proliferative, anti-angiogenesis and anti-migratory activities). In addition, a better understanding of the molecular pathways involved in these biological responses is also required.

Acknowledgments

This work was partially supported by research grants from Zélia Velez: FCT-SFRH/BPD/63417/2009; Marco A. Campinho: FCT-SFRH/BPD/66808/2009; and Patrícia Ramos: FCT-SFRH/BD/70845/2010. This research was co-financed by INALENTEJO 2007.2013/QREN, within the project BioEcos—Valorização Integrada de Biomassa. IPATIMUP and CICECO are Associated Laboratories of the Portuguese Ministry of Science, Technology and Higher Education, being partially supported by FCT, the Portuguese Foundation for Science and Technology.
The authors would like to thank Escola Superior Agrária, do Instituto Politécnico de Beja, for kindly supplying the Cynara cardunculus cultivated and wild plants.
The authors would like to thank D. M. Power and A. V. M. Canário from CCMar for the zebrafish facilities and equipments used in the anti-angiogenic assays and Paulo Gavaia (CCMar) for the zebrafish Tg(fli1:GFP) line.

References

  1. Ksouri, R.; Ksouri, W.M.; Jallali, I.; Debez, A.; Magne, C.; Hiroko, I.; Abdelly, C. Medicinal halophytes: Potent source of health promoting biomolecules with medical, nutraceutical and food applications. Crit. Rev. Biotechnol. 2011, 32, 289–326. [Google Scholar]
  2. Benlloch-Gonzalez, M.; Fournier, J.M.; Ramos, J.; Benlloch, M. Strategies underlying salt tolerance in halophytes are present in cynara cardunculus. Plant Sci. 2005, 168, 653–659. [Google Scholar] [CrossRef]
  3. Lanteri, S.; Acquadro, A.; Saba, E.; Portis, E. Molecular fingerprinting and evaluation of genetic distances among selected clones of globe artichoke (Cynara cardunculus L. var. scolymus L.). J. Hortic. Sci. Biotechnol. 2004, 79, 863–870. [Google Scholar]
  4. Portis, E.; Acquadro, A.; Comino, C.; Mauromicale, G.; Saba, E.; Lanteri, S. Genetic structure of island populations of wild cardoon [Cynara cardunculus L. var. sylvestris (Lamk) Fiori] detected by AFLPs and SSRs. Plant Sci. 2005, 169, 199–210. [Google Scholar] [CrossRef]
  5. Acquadro, A.; Portis, E.; Lee, D.; Donini, P.; Lanteri, S. Development and characterization of microsatellite markers in Cynara cardunculus L. Genome 2005, 48, 217–225. [Google Scholar] [CrossRef]
  6. Sarmento, A.C.; Lopes, H.; Oliveira, C.S.; Vitorino, R.; Samyn, B.; Sergeant, K.; Debyser, G.; van Beeumen, J.; Domingues, P.; Amado, F.; et al. Multiplicity of aspartic proteinases from Cynara cardunculus L. Planta 2009, 230, 429–439. [Google Scholar] [CrossRef]
  7. Abrantes, S.; Amaral, M.E.; Costa, A.P.; Duarte, A.P. Cynara cardunculus L. alkaline pulps: Alternatives fibres for paper and paperboard production. Bioresour. Technol. 2007, 98, 2873–2878. [Google Scholar] [CrossRef]
  8. Fernández, J.; Curt, M.D.; Aguado, P.L. Industrial applications of Cynara cardunculus L. for energy and other uses. Ind. Crops Prod. 2006, 24, 222–229. [Google Scholar] [CrossRef]
  9. Fratianni, F.; Tucci, M.; de Palma, M.; Pepe, R.; Nazzaro, F. Polyphenolic composition in different parts of some cultivars of globe artichoke (Cynara cardunculus L. var. scolymus (L.) Fiori). Food Chem. 2007, 104, 1282–1286. [Google Scholar] [CrossRef]
  10. Valentão, P.; Fernandes, E.; Carvalho, F.; Andrade, P.B.; Seabra, R.M.; Bastos, M.L. Antioxidative properties of cardoon (Cynara cardunculus L.) infusion against superoxide radical, hydroxyl radical, and hypochlorous acid. J. Agric. Food Chem. 2002, 50, 4989–4993. [Google Scholar] [CrossRef]
  11. Trajtemberg, S.P.; Apóstolo, N.M.; Fernández, G. Calluses of Cynara cardunculus var. cardunculus cardoon (Asteraceae): Determination of cynarine and chlorogenic acid by automated high-preformance capillary electrophoresis. In Vitro Cell. Dev. Biol. Plant 2006, 42, 534–537. [Google Scholar] [CrossRef]
  12. Pinelli, P.; Agostini, F.; Comino, C.; Lanteri, S.; Portis, E.; Romani, A. Simultaneous quantification of caffeoyl esters and flavonoids in wild and cultivated cardoon leaves. Food Chem. 2007, 105, 1695–1701. [Google Scholar] [CrossRef]
  13. Bezáková, L.; Grancai, D.; Oblozinsky, M.; Vanko, M.; Holková, I.; Pauliková, I.; Garaj, V.; Gáplovský, M. Effects of flavonoids and cynarine from Cynara cardunculus L. on lipoxygenase activity. Acta Fac. Pharm. Univ. Comen. 2007, Tomus LIV, 48–52. [Google Scholar]
  14. Sevcikova, P.; Glatz, Z.; Slanina, J. Analysis of artichoke (Cynara cardunculus L.) extract by means of micellar electrokinetic capillary chromatography. Electrophoresis 2002, 23, 249–252. [Google Scholar] [CrossRef]
  15. Zhu, X.; Zhang, H.; Lo, R. Phenolic compounds from the leaf extract of artichoke (Cynara scolymus L.) and their antimicrobial activities. J. Agric. Food Chem. 2004, 52, 7272–7278. [Google Scholar] [CrossRef]
  16. Gebhardt, R.; Fausel, M. Antioxidant and hepatoprotective effects of artichoke extracts and constituents in cultured rat hepatocytes. Toxicol. in Vitro 1997, 11, 669–672. [Google Scholar] [CrossRef]
  17. Krizkova, L.; Mucaji, P.; Nagy, M.; Krajcovic, J. Triterpenoid cynarasaponins from Cynara cardunculus L. reduce chemically induced mutagenesis in vitro. Phytomedicine 2004, 11, 673–678. [Google Scholar] [CrossRef]
  18. Zi, X.; Agarwal, R. Modulation of mitogen-activated protein kinase activation and cell cycle regulators by the potent skin cancer preventive agent silymarin. Biochem. Biophys. Res. Commun. 1999, 263, 528–536. [Google Scholar] [CrossRef]
  19. Varghese, L.; Agarwal, C.; Tyagi, A.; Singh, R.P.; Agarwal, R. Silibinin efficacy against human hepatocellular carcinoma. Clin. Cancer Res. 2005, 11, 8441–8448. [Google Scholar] [CrossRef]
  20. Yuan, Y.V.; Carrington, M.F.; Walsh, N.A. Extracts from dulse (Palmaria palmata) are effective antioxidants and inhibitors of cell proliferation in vitro. Food Chem. Toxicol. 2005, 43, 1073–1081. [Google Scholar] [CrossRef]
  21. Aruoma, O.I. Nutrition and health aspects of free radicals and antioxidants. Food Chem. Toxicol. 1994, 32, 671–683. [Google Scholar] [CrossRef]
  22. Fang, Y.Z.; Yang, S.; Wu, G. Free radicals, antioxidants, and nutrition. Nutrition 2002, 18, 872–879. [Google Scholar] [CrossRef]
  23. Barrett, J.C.; Wiseman, R.W. Cellular and molecular mechanisms of multistep carcinogenesis: Relevance to carcinogen risk assessment. Environ. Health Perspect. 1987, 76, 65–70. [Google Scholar] [CrossRef]
  24. Valentao, P.; Fernandes, E.; Carvalho, F.; Andrade, P.B.; Seabra, R.M.; Bastos, M.L. Antioxidative properties of cardoon (Cynara cardunculus L.) infusion against superoxide radical, hydroxyl radical, and hypochlorous acid. J. Agric. Food Chem. 2002, 50, 4989–4993. [Google Scholar] [CrossRef]
  25. Shen, Q.; Dai, Z.; Lu, Y. Rapid determination of caffeoylquinic acid derivatives in Cynara scolymus L. by ultra-fast liquid chromatography/tandem mass spectrometry based on a fused core C18 column. J. Sep. Sci. 2010, 33, 3152–3158. [Google Scholar] [CrossRef]
  26. Wider, B.; Pittler, M.H.; Thompson-Coon, J.; Ernst, E. Artichoke leaf extract for treating hypercholesterolaemia. Cochrane Database Syst. Rev. 2009. [Google Scholar] [CrossRef] [Green Version]
  27. Wang, M.; Simon, J.E.; Aviles, I.F.; He, K.; Zheng, Q.Y.; Tadmor, Y. Analysis of antioxidative phenolic compounds in artichoke (Cynara scolymus L.). J. Agric. Food Chem. 2003, 51, 601–608. [Google Scholar] [CrossRef]
  28. Oyaizu, M. Studies on products of browning reaction: Antioxidative activities of products of browning reaction prepared from glucosamine. Jpn. J. Nutr. 1986, 44, 307–315. [Google Scholar] [CrossRef]
  29. Zou, Y.; Lu, Y.; Wei, D. Antioxidant activity of a flavonoid-rich extract of Hypericum perforatum L. in vitro. J. Agric. Food Chem. 2004, 52, 5032–5039. [Google Scholar] [CrossRef]
  30. Ksouri, R.; Megdiche, W.; Falleh, H.; Trabelsi, N.; Boulaaba, M.; Smaoui, A.; Abdelly, C. Influence of biological, environmental and technical factors on phenolic content and antioxidant activities of tunisian halophytes. Compte Rendues de Biologies 2008, 331, 865–873. [Google Scholar] [CrossRef]
  31. Sengul, M.; Yildiz, H.; Gungor, N.; Okcu, Z. Total phenolic content, antioxidant activity, some physical and chemical properties of pestil. Asian J. Chem. 2010, 22, 448–454. [Google Scholar]
  32. Carmeliet, P. Angiogenesis in life, disease and medicine. Nature 2005, 438, 932–936. [Google Scholar] [CrossRef]
  33. Swerdlow, A.J.; dos Santos Silva, I.; Reid, A.; Qiao, Z.; Brewster, D.H.; Arrundale, J. Trends in cancer incidence and mortality in scotland: Description and possible explanations. Br. J. Cancer 1998, 77, 1–54. [Google Scholar]
  34. Hanahan, D.; Weinberg, R.A. The hallmarks of cancer. Cell 2000, 100, 57–70. [Google Scholar] [CrossRef]
  35. Bhat, T.A.; Singh, R.P. Tumor angiogenesis-a potential target in cancer chemoprevention. Food Chem. Toxicol. 2008, 46, 1334–1345. [Google Scholar] [CrossRef]
  36. Velioglu, Y.S.; Mazza, G.; Gao, L.; Oomah, B.D. Antioxidant activity and total phenolics in selected fruits, vegetables, and grain products. J. Agric. Food Chem. 1998, 46, 4113–4117. [Google Scholar] [CrossRef]
  37. Szabo, M.R.; Iditoiu, C.; Chambre, D.; Lupea, A.X. Improved DPPH determination for antioxidant activity spectrophotometric assay. Chem. Pap. 2007, 61, 214–216. [Google Scholar] [CrossRef]
  38. Molyneux, P. The use of the stable free radical diphenylpicryl-hydrazyl (DPPH) for estimating antioxidant activity. Songklanakarin J. Sci. Technol. 2004, 26, 211–219. [Google Scholar]
  39. Motic Images Plus 2.0 Software, version 2.0, Motic Spain, S.L.U.: Barcelona, Spain, 2010.
  40. Kimmel, C.B.; Ballard, W.W.; Kimmel, S.R.; Ullmann, B.; Schilling, T.F. Stages of embryonic development of the zebrafish. Dev. Dyn. 1995, 203, 253–310. [Google Scholar] [CrossRef]
  41. Tran, T.C.; Sneed, B.; Haider, J.; Blavo, D.; White, A.; Aiyejorun, T.; Baranowski, T.C.; Rubinstein, A.L.; Doan, T.N.; Dingledine, R.; et al. Automated, quantitative screening assay for antiangiogenic compounds using transgenic zebrafish. Cancer Res. 2007, 67, 11386–11392. [Google Scholar]

