
Exploring Barriers to the Adoption of Internet of Things-Based Precision Agriculture Practices
 ,
, 
Abstract
:1. Introduction
2. Background
2.1. Precision Agriculture (PA) Practices
2.2. Adoption of Precision Agriculture Practices among Midwestern Row Crop Producers
2.3. Barriers to Adoption of IoT-Based Precision Agriculture
3. Materials and Methods
3.1. Structured Literature Review
3.2. Focused Group Semi-Structured Interviews
3.3. Thematic Content Analysis
3.4. Validity and Reliability
4. Results
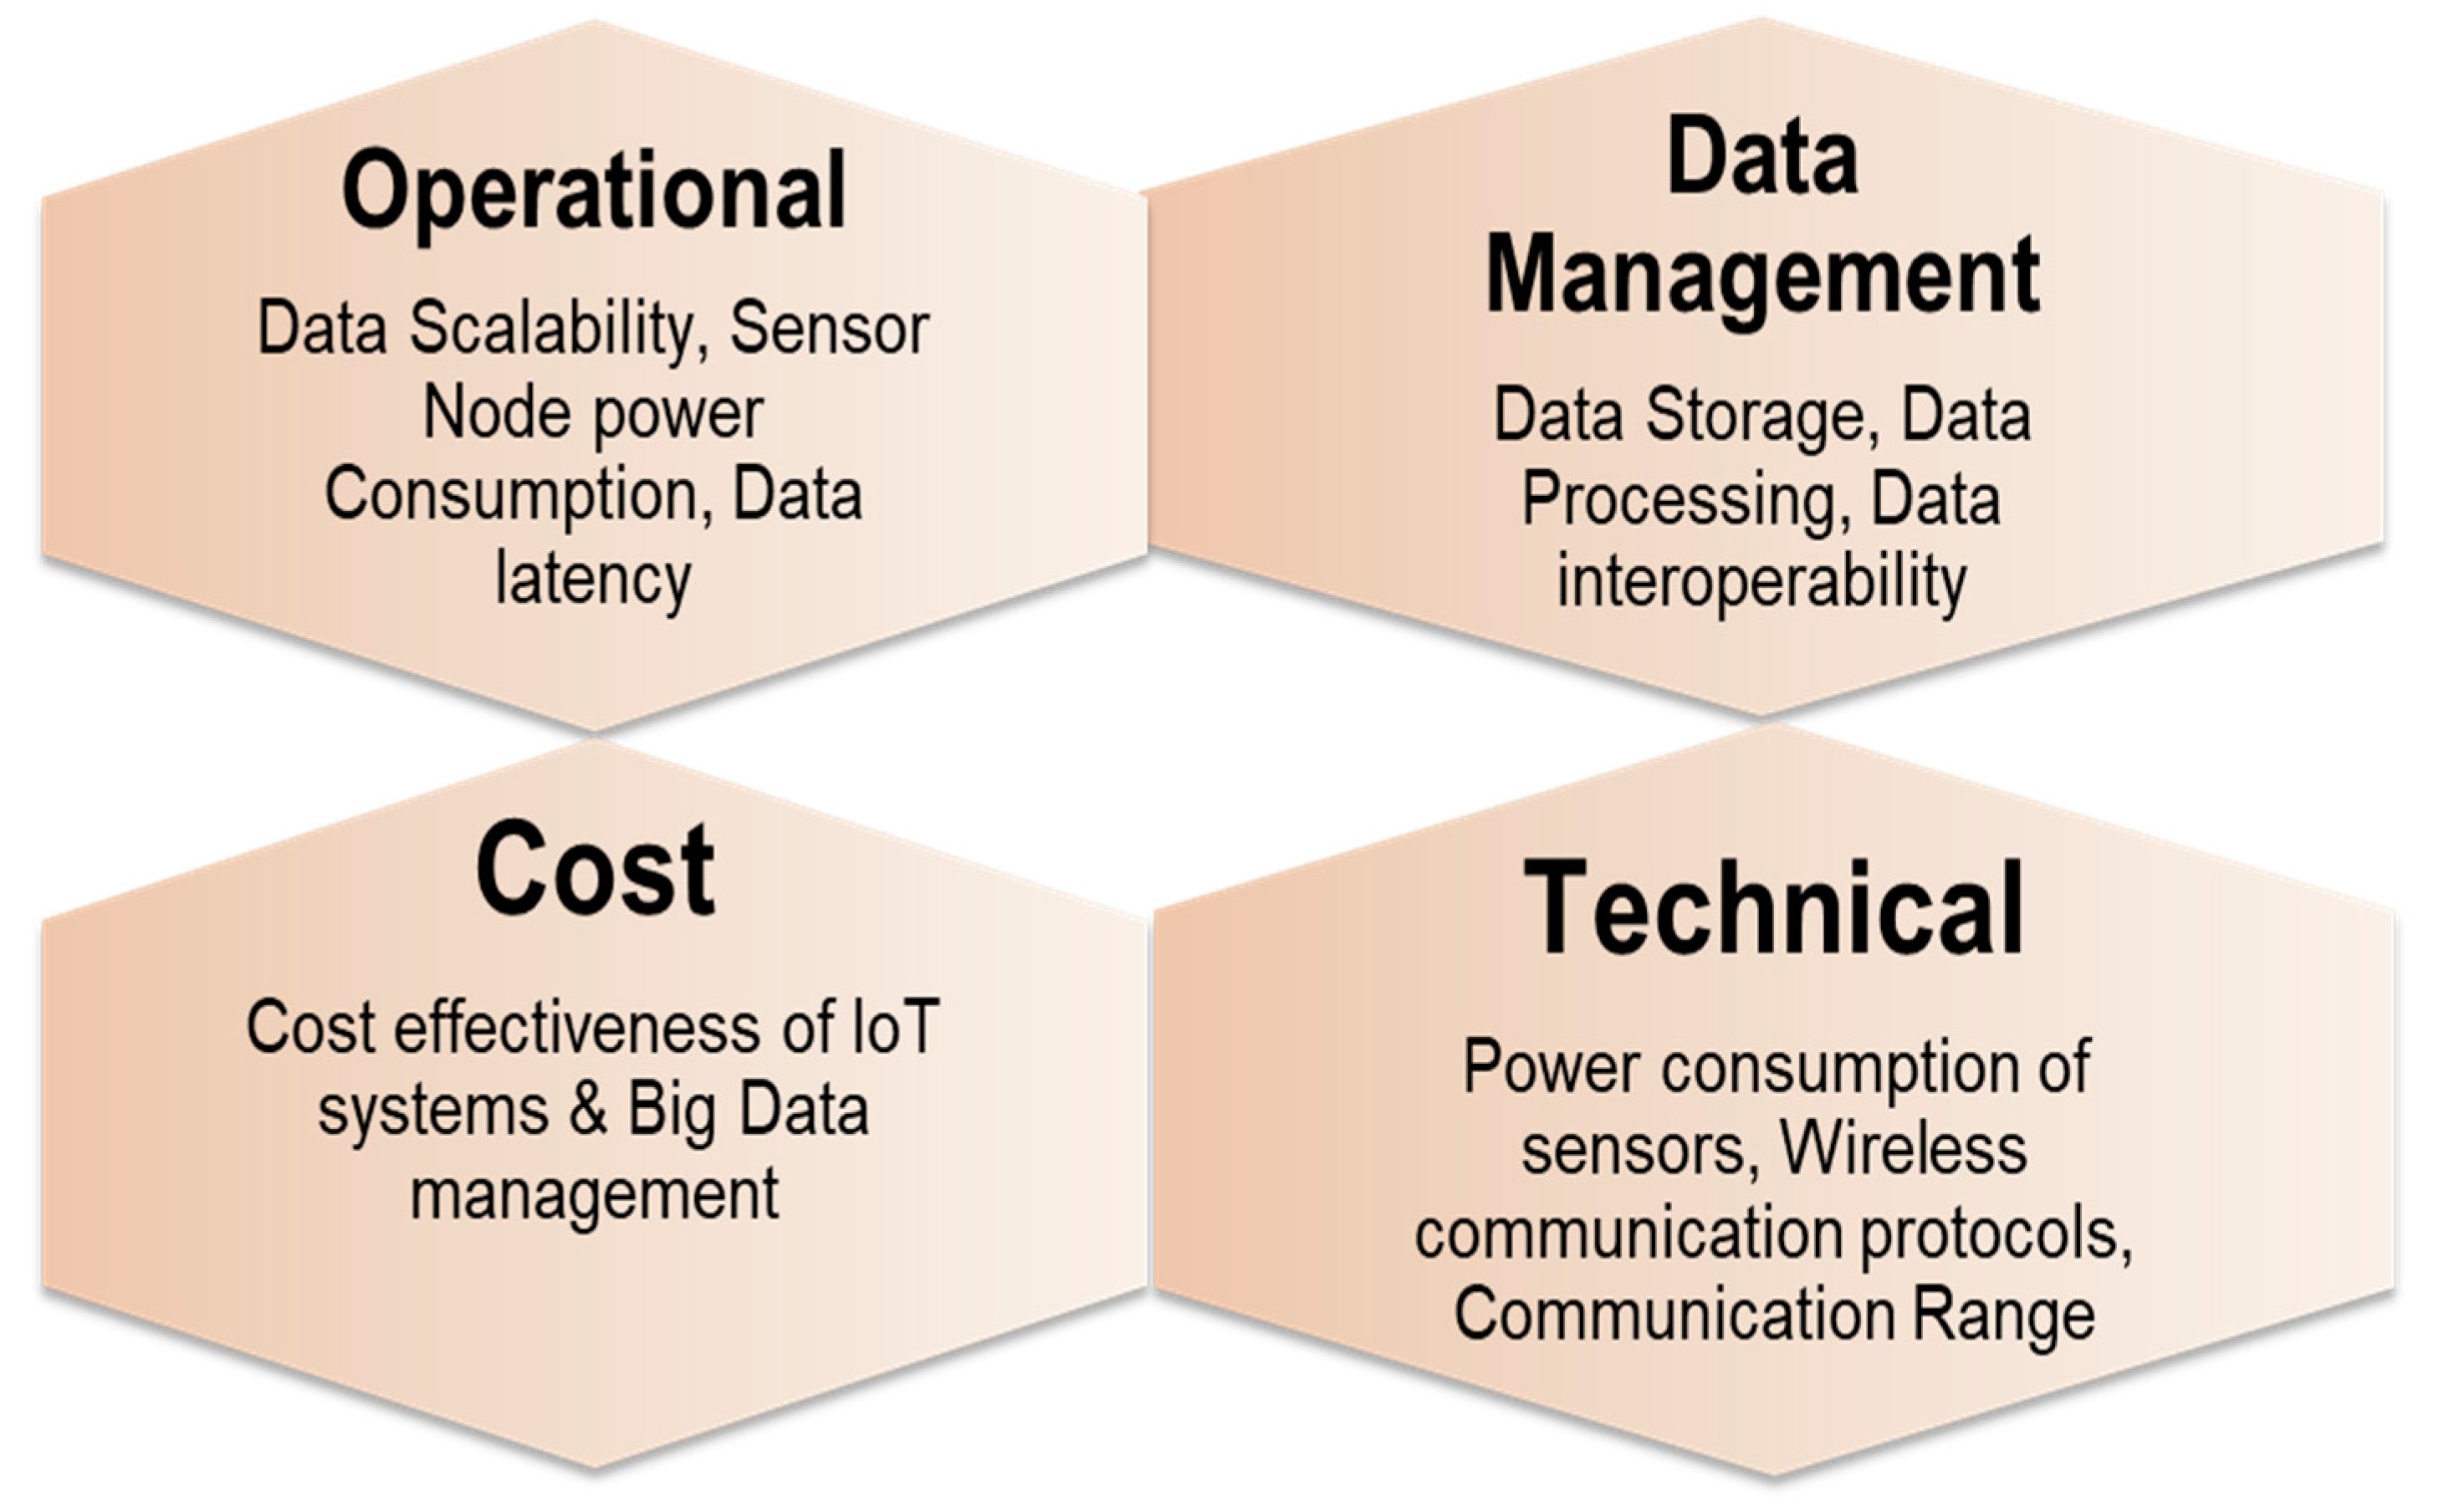
4.1. Themes from Content Analysis
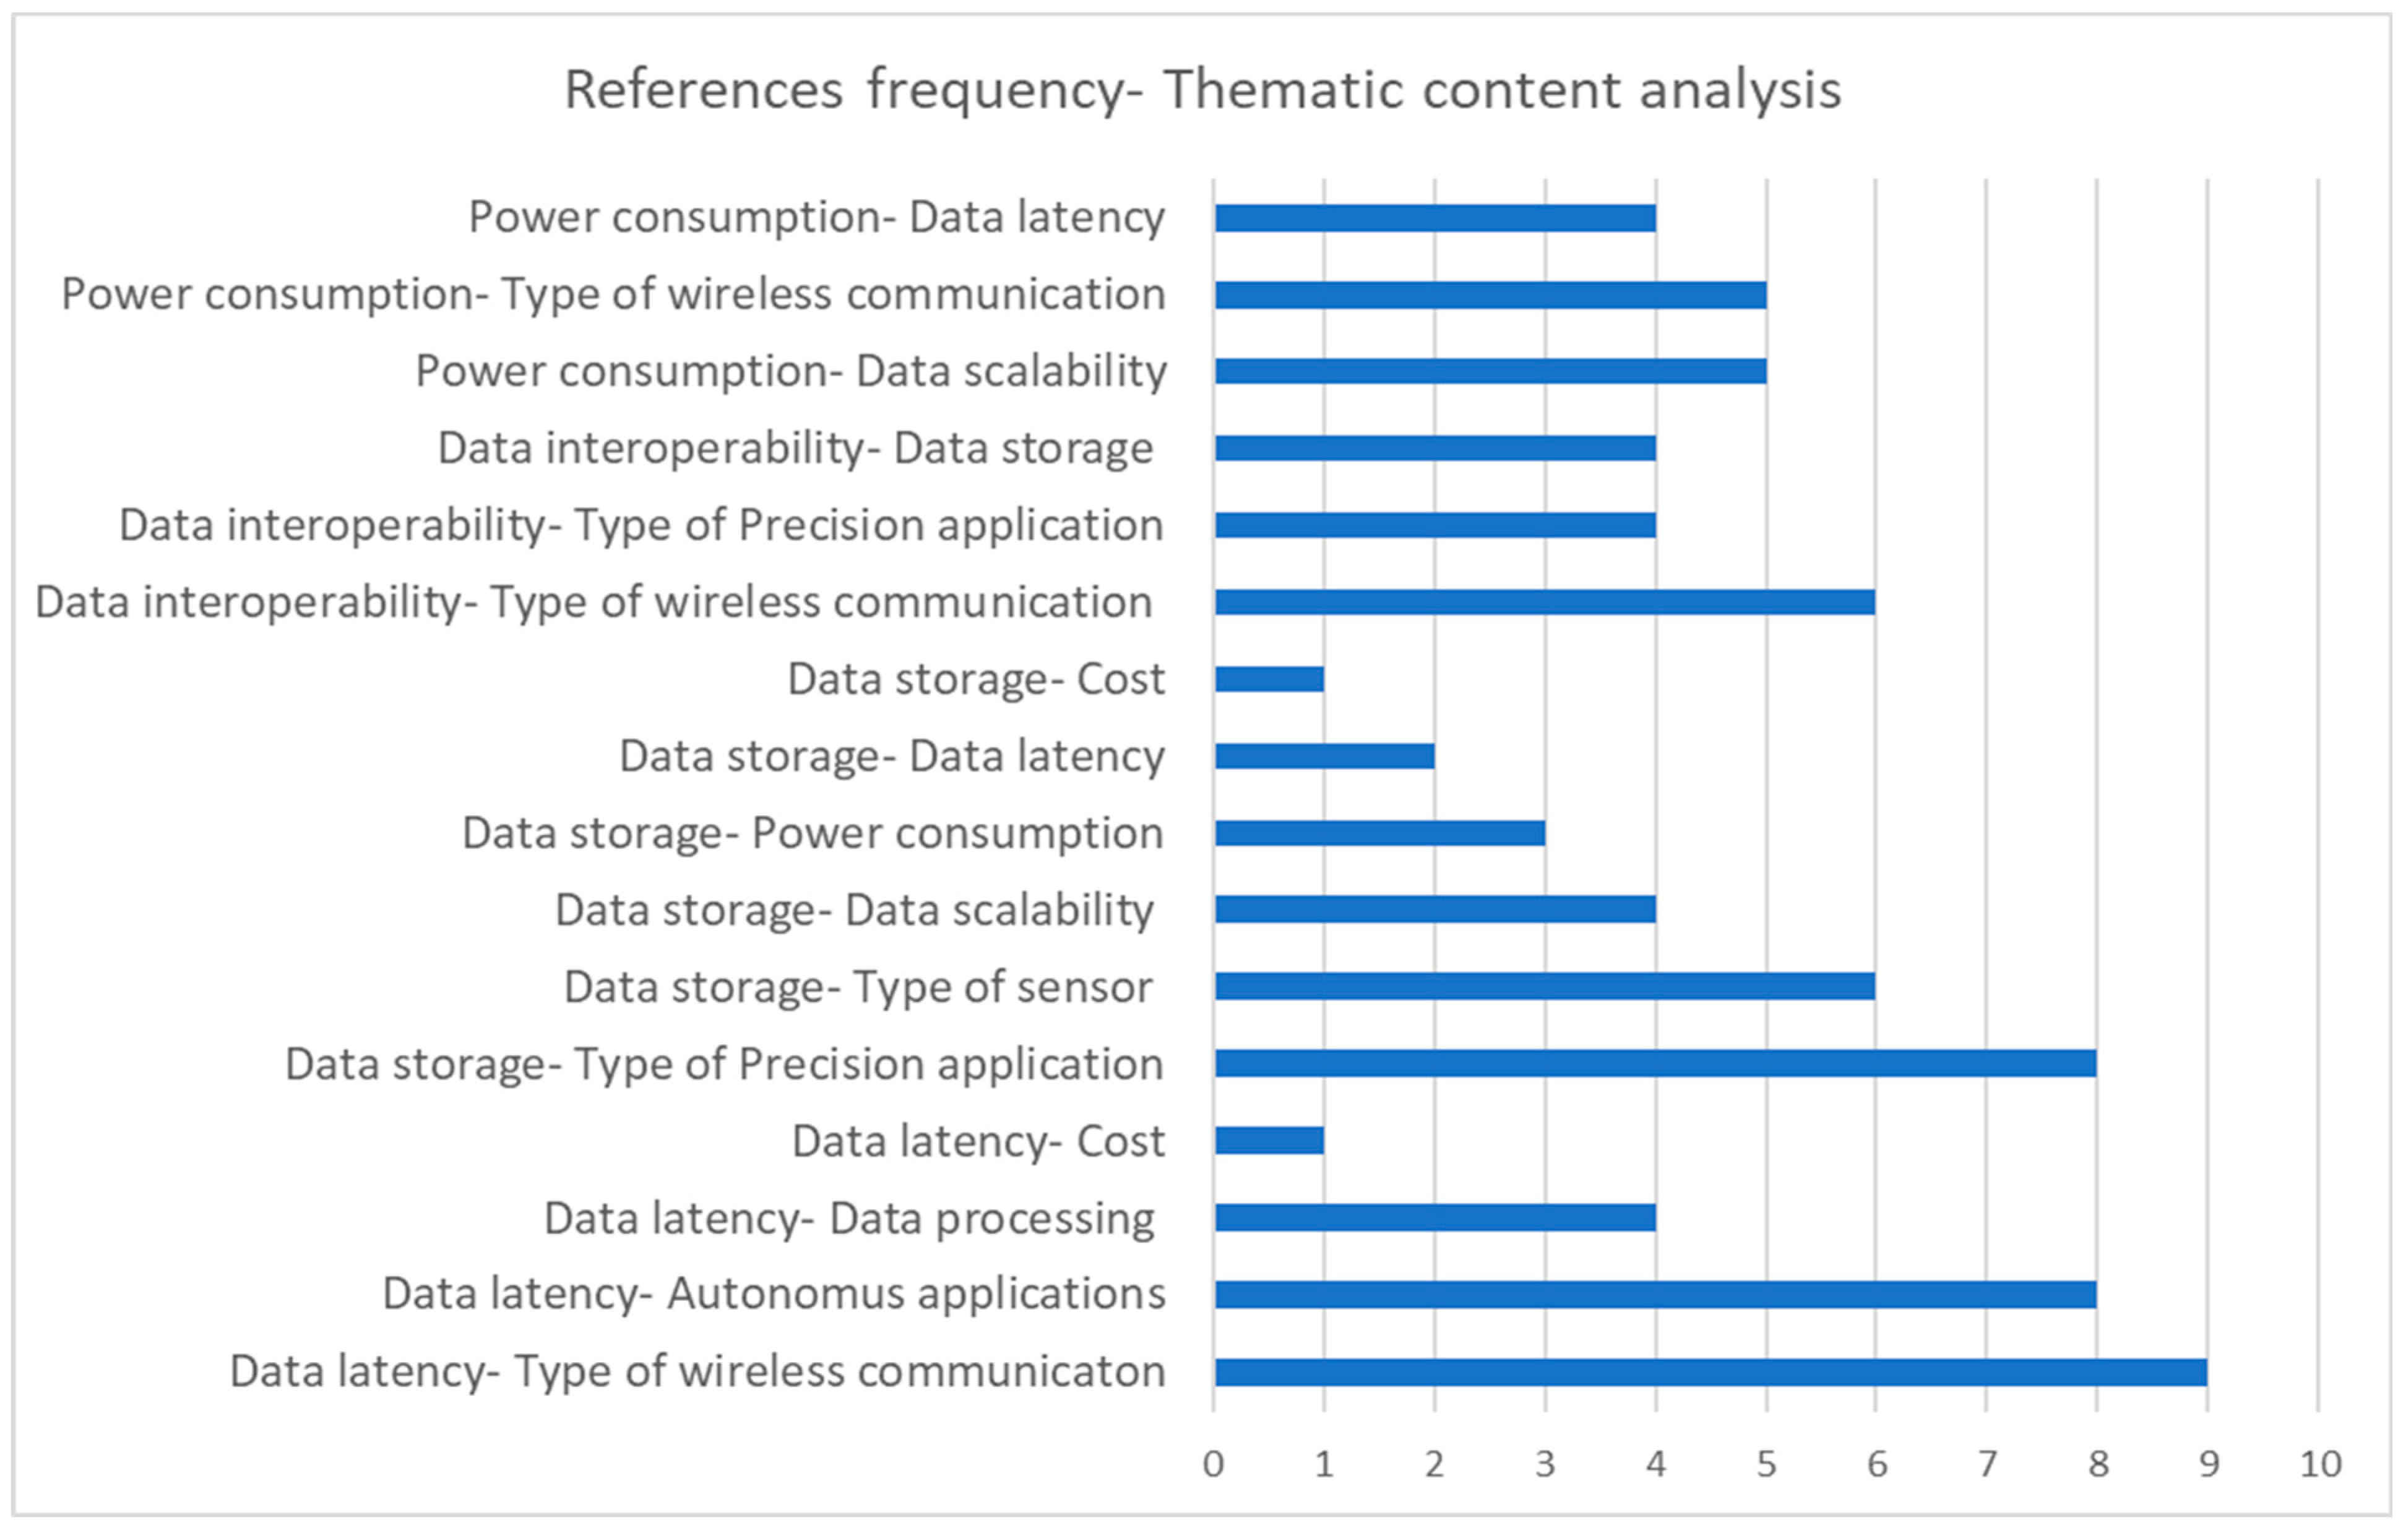
4.2. Variable Relationships
4.3. Operational Definitions
5. Discussion
6. Conclusions
Supplementary Materials
Author Contributions
Funding
Institutional Review Board Statement
Data Availability Statement
Acknowledgments
Conflicts of Interest
Appendix A. Participants Current Role and Expertise Area
| Participants | Current Role | Expertise in IoT Wireless Sensor Framework Layer |
|---|---|---|
| Participant 1 (P1) | Digital Agriculture Technology Consultant | Wireless Communication technologies (Communication Layer) |
| Participant 2 (P2) | Program Coordinator in Agriculture Technology | Big Data Telematics, Data Analytics, Aerial Imagery (Perception Layer) |
| Participant 3 (P3) | Global Technology consultant | Wireless Communication technologies (Communication Layer) |
| Participant 4 (P4) | Graduate Research Assistant | UAV-aided wireless communication systems, Intelligent transportation system applications in Digital agriculture (Communication Layer) |
| Participant 5 (P5) | Precision agriculture technologies consultant and Farm-owner | Digital agriculture practitioner, Smart irrigation & Autonomous precision agriculture application (Application Layer) |
| Participant 6 (P6) | Academic Faculty | Wireless Communication Technologies for Agriculture, Signal processing, Sensor network design (Communication Layer) |
| Participant 7 (P7) | Cloud technologies consultant | Cloud computing platforms for Digital Agriculture (Data processing Layer) |
| Participant 8 (P8) | Graduate Research Assistant | Wireless Communication technologies, Embedded systems & edge-computing (Communication Layer) |
| Participant 9 (P9) | Academic Faculty | Decision Support System, Cloud Computing, Mobile Apps (Application Layer) |
| Participant 10 (P10) | Graduate Research Assistant | Autonomous precision agriculture applications (Application Layer) |
| Participant 11 (P11) | Digital Agriculture Consultant | Internet of Things (IoT) for Farm machinery autonomous applications (Application Layer) |
| Participant 12 (P12) | Graduate Research Assistant | Software engineering, API for crop monitoring applications (Data processing Layer) |
| Participant 13 (P13) | Wireless communications Technology consultant | Wireless communication networking, long range and wide area networks (LoRa) for digital agriculture applications (Communication Layer) |
| Participant 14 (P14) | Graduate Research Assistant | Internet of Things sensors applications for precision agriculture (Perception Layer) |
| Participant 15 (P15) | Extension program coordinator | Digital Agriculture practitioner, Rural area sensor networking (Perception Layer) |
| Participant 16 (P15) | Digital Agriculture practitioner & Farmer | Digital agriculture technologies adoption and practitioner (Perception Layer) |
| Participant 17 (P17) | Software engineer | Cloud computing, Big Data Analytics for IoT in Agriculture (Data processing Layer) |
| Participant 18 (P18) | Application Programming Interface (API) developer | Software developer for Precision agriculture applications, Cloud-back end (Data Processing layer) |
Appendix B. Interview Script
- Understand the efficient (cost, power, data scalability, data management) and effective (communication range, data latency, data interoperability, data processing) wireless communication technologies that can be integrated with sensors for developing precision agriculture applications (monitoring row crop diseases, smart irrigation, smart fertilizing, and farm-machinery efficient navigation) for an average size row crop farm in Indiana region.
- Understand and identify the efficient (cost, power, data management) and effective (data latency, data interoperability and data management) data storage and processing application programming interfaces for developing precision agriculture applications (monitoring row crop diseases, smart irrigation, smart fertilizing and farm-machinery efficient navigation) for an average size row crop farm in Indiana region.
- Understanding the dependencies of variables namely type of sensors, type of wireless communication technologies, no. of devices-data scalability, communication range, data latency, data interoperability of application programming interfaces with cost, power consumption and type of precision agriculture applications (monitoring & autonomous).
- What is your educational background and current role in the organization you work?
- What is your experience with digital agriculture?
- What are the different types of sensors that can be used to develop applications for monitoring row crop diseases on an average size farm in the Indiana region?
- What are the different types of sensors that can be used to develop applications for smart irrigation applications on an average size row crop farm in the Indiana region?
- What are the different types of sensors that can be used to develop applications for smart fertilizing on an average size row crop farm in the Indiana region?
- What are the different types of sensors that can be mounted on farm- machinery for efficient navigation during planting and harvesting operations?
- How can we efficiently (cost, power, scalability) and effectively (communication range, data latency, data storage and processing) integrate different types of sensors with wireless communication technologies for monitoring row crop diseases precision application on an average size farm in the Indiana region?
- How can we efficiently (cost, power, scalability) and effectively (communication range, data latency, data storage and processing) integrate different types of sensors with wireless communication technologies for smart irrigation autonomous application on an average size row crop farm in the Indiana region?
- How can we efficiently (cost, power, scalability) and effectively (communication range, data latency, data storage and processing) integrate different types of sensors with wireless communication technologies for smart fertilizing autonomous application on an average size row crop farm in the Indiana region?
- How can we efficiently (cost, power, scalability) and effectively (communication range, data latency, data storage and processing) integrate different types of sensors with wireless communication technologies for farm- machinery efficient navigation on an average size row crop farm in the Indiana region?
- How can we (cost, power, scalability) and effectively (communication range, data latency, data interoperability) store and process data for developing monitoring of row crop diseases and precision application interfaces?
- How can we (cost, power, scalability) and effectively (communication range, data latency, data interoperability) store and process data for developing autonomous (smart irrigation, smart fertilization & Farm machinery navigation) alert application interfaces?
References
- USDA/NASS 2019 State Agriculture Overview for Indiana. 2019. Available online: https://www.nass.usda.gov/Quick_Stats/Ag_Overview/stateOverview.php?state=INDIANA (accessed on 18 December 2020).
- Erickson, B.; Lowenberg-DeBoer, J.; Bradford, J. Precision Agriculture Dealership Survey; Purdue University: West Lafayette, IN, USA, 2017. [Google Scholar]
- Jawad, H.M.; Nordin, R.; Gharghan, S.K.; Jawad, A.M.; Ismail, M. Energy-efficient wireless sensor networks for precision agriculture: A review. Sensors 2017, 17, 1781. [Google Scholar] [CrossRef] [Green Version]
- Ruan, J.; Wang, Y.; Chan FT, S.; Hu, X.; Zhao, M.; Zhu, F.; Lin, F. A life cycle framework of green IoT-based agriculture and its finance, operation, and management issues. IEEE Commun. Mag. 2019, 57, 90–96. [Google Scholar] [CrossRef]
- Castle, M.H.; Lubben, B.D.; Luck, J.D. Factors Influencing the Adoption of Precision Agriculture Technologies by Nebraska Producers. 2016. Available online: https://digitalcommons.unl.edu/ageconworkpap/49/ (accessed on 18 December 2020).
- Say, S.M.; Keskin, M.; Sehri, M.; Sekerli, Y.E. Adoption of precision agriculture technologies in developed and developing countries. Online J. Sci. Technol. 2018, 8, 7–15. [Google Scholar]
- Adrian, A.M.; Norwood, S.H.; Mask, P.L. Producers’ perceptions and attitudes toward precision agriculture technologies. Comput. Electron. Agric. 2005, 48, 256–271. [Google Scholar] [CrossRef]
- Griffin, T.W.; Shockley, J.M.; Mark, T.B. Economics of precision farming. Precision Agriculture Basics; Wiley Online Library: New York, NY, USA, 2018; pp. 221–230. [Google Scholar]
- Shockley, J.M.; Dillon, C.R.; Stombaugh, T.S. A whole farm analysis of the influence of auto-steer navigation on net returns, risk, and production practices. J. Agric. Appl. Econ. 2011, 43, 57–75. [Google Scholar] [CrossRef] [Green Version]
- Balafoutis, A.; Beck, B.; Fountas, S.; Vangeyte, J.; Wal TV, D.; Soto, I.; Eory, V. Precision agriculture technologies positively contribute to GHG emissions mitigation, farm productivity and economics. Sustainability 2017, 9, 1339. [Google Scholar] [CrossRef] [Green Version]
- Brown, R.M.; Dillon, C.R.; Schieffer, J.; Shockley, J.M. The carbon footprint and economic impact of precision agriculture technology on a corn and soybean farm. J. Environ. Econ. Policy 2016, 5, 335–348. [Google Scholar] [CrossRef]
- Van Evert, F.K.; Gaitán-Cremaschi, D.; Fountas, S.; Kempenaar, C. Can precision agriculture increase the profitability and sustainability of the production of potatoes and olives? Sustainability 2017, 9, 1863. [Google Scholar] [CrossRef] [Green Version]
- Blackmore, B.S. An Information System for Precision Farming. The Role of Yield Maps in Precision Farming. Ph.D. Thesis, Cranfield University, Cranfield, UK, 2003. [Google Scholar]
- Bongiovanni, R.; Lowenberg-DeBoer, J. Precision agriculture and sustainability. Precis. Agric. 2004, 5, 359–387. [Google Scholar] [CrossRef]
- Navarro, E.; Costa, N.; Pereira, A. A Systematic Review of IoT Solutions for Smart Farming. Sensors 2020, 20, 4231. [Google Scholar] [CrossRef]
- Tey, Y.S.; Brindal, M. Factors influencing the adoption of precision agricultural technologies: A review for policy implications. Precis. Agric. 2012, 13, 713–730. [Google Scholar] [CrossRef]
- Ferrández-Pastor, F.J.; García-Chamizo, J.M.; Nieto-Hidalgo, M.; Mora-Martínez, J. Precision agriculture design method using a distributed computing architecture on internet of things context. Sensors 2018, 18, 1731. [Google Scholar] [CrossRef] [Green Version]
- Berelson, B. Content Analysis in Communication Research. 1952. Available online: https://journals.sagepub.com/doi/abs/10.1177/000271625228300135 (accessed on 15 September 2022).
- Mayring, P.; Gläser-Zikuda, M. (Eds.) Die Praxis der Qualitativen Inhaltsanalyse; Beltz: Weinheim, Germany, 2008. [Google Scholar]
- Downe-Wamboldt, B. Content analysis: Method, applications, and issues. Health Care Women Int. 1992, 13, 313–321. [Google Scholar] [CrossRef]
- Krueger, R. Focus Groups: A Practical Guide for Applied Research; Sage: Newbury Park, CA, USA, 1988. [Google Scholar]
- Denzin, N.K.; Lincoln, Y.S. Introduction: The discipline and practice of qualitative research. In Strategies of Qualitative Inquiry; Sage Publications: Thousand Oaks, CA, USA, 2008; pp. 1–43. [Google Scholar]
- Wong, L.P. Focus group discussion: A tool for health and medical research. Singap. Med. J. 2008, 49, 256–260. [Google Scholar]
- Lewis, A. A focus group study of the motivation to invest: ‘ethical/green’and ‘ordinary’investors compared. J. Socio.-Econ. 2001, 30, 331–341. [Google Scholar] [CrossRef]
- Stewart, D.W.; Shamdasani, P.N. Focus Groups: Theory and Practice; Sage Publications: Thousand Oaks, CA, USA, 2014; Volume 20. [Google Scholar]
- Basit, T. Manual or electronic? The role of coding in qualitative data analysis. Educ. Res. 2003, 45, 143–154. [Google Scholar] [CrossRef]
- Tashakkori, A.; Teddlie, C. Integrating qualitative and quantitative approaches to research. SAGE Handb. Appl. Soc. Res. Methods 2009, 2, 283–317. [Google Scholar]
- Mathison, S. Why triangulate? Educ. Res. 1988, 17, 13–17. [Google Scholar] [CrossRef]
- Singleton, A.A.; Straits, B.C. Approaches to Social Research, 3rd ed.; Oxford University Press: New York, NY, USA, 1999. [Google Scholar]
- Sotiriadou, P.; Brouwers, J.; Le, T.A. Choosing a qualitative data analysis tool: A comparison of NVivo and Leximancer. Ann. Leis. Res. 2014, 17, 218–234. [Google Scholar] [CrossRef] [Green Version]
- Hruschka, D.J.; Schwartz, D.; St John, D.C.; Picone-Decaro, E.; Jenkins, R.A.; Carey, J.W. Reliability in coding open-ended data: Lessons learned from HIV behavioral research. Field Methods 2004, 16, 307–331. [Google Scholar] [CrossRef] [Green Version]
- Vasisht, D.; Kapetanovic, Z.; Won, J.; Jin, X.; Chandra, R.; Sinha, S.; Stratman, S. Farmbeats: An Iot Platform for Data-Driven Agriculture. 2017, pp. 515–529. Available online: https://www.usenix.org/conference/nsdi17/technical-sessions/presentation/vasisht (accessed on 18 December 2020).
- Talavera, J.M.; Tobón, L.E.; Gómez, J.A.; Culman, M.A.; Aranda, J.M.; Parra, D.T.; Garreta, L.E. Review of IoT applications in agro-industrial and environmental fields. Comput. Electron. Agric. 2017, 142, 283–297. [Google Scholar] [CrossRef]
- Silva, C.B.; do Vale SM, L.R.; Pinto, F.A.; Müller, C.A.; Moura, A.D. The economic feasibility of precision agriculture in Mato Grosso do Sul State, Brazil: A case study. Precis. Agric. 2007, 8, 255–265. [Google Scholar] [CrossRef]
- Schimmelpfennig, D. Farm Profits and Adoption of Precision Agriculture (No. 1477-2016-121190). 2016. Available online: https://www.ers.usda.gov/publications/pub-details/?pubid=80325 (accessed on 18 December 2020).
- Pierpaolia, E.; Carlia, G.; Pignattia, E.; Canavaria, M. Drivers of Precision Agriculture Technologies Adoption: A. Procedia Technol. 2013, 8, 61–69. [Google Scholar] [CrossRef]
- Patil, V.C.; Al-Gaadi, K.A.; Biradar, D.P.; Rangaswamy, M. Internet of things (Iot) and cloud computing for agriculture: An overview. In Proceedings of the Agro-Informatics and Precision Agriculture (AIPA 2012), Hyderabad, India, 1–3 August 2012; pp. 292–296. [Google Scholar]
- Holt-Giménez, E.; Altieri, M.A. Agroecology, food sovereignty, and the new green revolution. Agroecol. Sustain. Food Syst. 2013, 37, 90–102. [Google Scholar] [CrossRef]


| Variable Relationship | Participant Response | Avg. Kappa Value (Inter-Reliability) | Descriptive Analysis |
|---|---|---|---|
| Data interoperability- Data storage | P2: “You know interoperability of formats and everything, something that will happen as add data gets larger and you might want to go between different cloud environments, so we have some technology that we are developing to do some of that not entirely pivoted to other, but multi cloud is for example” P3: “Data interoperability it’s more at the software like application level. Different software companies may need to talk to each other to make sure the results generated by them can be used by each other.” | 0.33 (Weak agreement) | Data storage tends to depend upon the data interoperability requirement. The interoperability between sensors, wireless communication technologies and cloud storage-end. The requirements for storage less or more tend to depend upon the compatibility of storage (sensors, wireless communication gateway, cloud) with each other and precision agriculture application requirements. |
| Data interoperability -Type of sensors | P4: “If I install sensor A and now, I’m stuck with this product and I can’t use this one over here because they just don’t talk to each other. I mean like if we’re really going to get people to adopt, there needs to be choice and it needs to be some flexibility.” P5: “Data interoperability is important to find it’s a very hard thing to define. You’ve seen things like at Gateway. Try and maybe they went too far and got really specific in the weeds. There’s probably some middle ground. You know that that needs to be the first step. It’s like how do we identify the 90% most important data and just come up with formats for that?” | 0.44 (Fair Agreement) | Data interoperability tends to depend upon the type of sensors as interoperability might mean data coming from different types of sources. Participants reported that there will be more data interoperability between the same category of sensors as they get integrated well with a particular type of wireless communication protocol (LoRA, Zigbee, Sigfox, BLE, Wi-Fi, GPRS 3G/4G). |
| Data interoperability- Type of Wireless communication | P2: “I think open source obviously has its own benefits. There is the NB- IoT is definitely nice. You can have NB IoT tier towers, but it is more expensive. I think I know that they are connected by doing Lora-WAN connectivity which will be nice. It will have this open-source thing in addition” P5: “As long as this server has the ability to talk to the sensor using the correct wireless communication technology, it doesn’t matter much like which technology you are using. Just establish the link and the data flows along the link so in that sense the communication is like a very low level, almost like you don’t need to worry about it as long as it’s there. For data interoperability it’s more at the software like application level.” | 0.67 (Good Agreement) | Type of wireless communication technology tends to not depend upon the data interoperability and vice versa. The participants highlighted that data interoperability is more adaptable at the user interface, i.e., software or cloud storage end. |
| Data interoperability-Type of Precision application | P6: “Annotated data set so that you can exactly find out what is the disease and you can use that annotated data set into training your different machine learning or deep learning model. So that is one of the missing pieces, because although we reached out to Plant Village plant dog datasets, but then we had to do the annotation by ourselves. So, a very large-scale annotated data set is still needed and that is one area” P7: “Flow rate, pressure, pH of that so that it is very hard to join that piece of information. The Fertilizing team for the different sections of the farm. So as previously mentioned, integrating like different heterogeneous sensors.” | 0.67 (Good Agreement) | Data interoperability tends to depend upon the type of precision agriculture application, type of sensors and cloud-data storage user interface. For instance, as the participants mentioned for monitoring row crop diseases, application of open-source field topography, soil and satellite data apart from the sensors might be used easily to develop robust row- crop disease models. |
| Data Latency- Autonomous applications | P4: “Depending on how latency sensitive that specific activity is, and in general I don’t think the latency thing is ever at the millisecond level or the second level. It’s always at a higher level of granularity because you know if you’re like sensor monitoring, for example soil monitoring. The comparison that I’m making compared to self-driving cars. I guess some of the latency sensitive mapping from the self-driving car industry comes in where you might have to do on device analytics to take care of that latency issue.” P3: “Drone that is sensing and at the same time spring then I think it becomes important to at that sub millisecond level that you would actually have to do the computation.” | 0.75 (Excellent Agreement) | Autonomous applications tend to have low latency requirements in miliseconds or seconds specifically mentioned by participants for farm machinery navigation systems using GPS and accelerometer sensors. The smart irrigation and smart fertilization where the data from soil moisture, Ph and Nitrate sensors tends to have data latencies requirements in minutes or hours. The monitoring applications specifically for row crop diseases where data latency requirements may be in days or weeks. |
| Data latency- Data scalability | P7: “If there is remote sensing or otherwise you know yes there is time to move that to the right place. Do the computation, generate the prescription, and then send it out. But, also increasingly there are machines that on the front of the machine they sense what needs to happen here and on the back of the machine it happens so in that case there really is no latency like it’s. You know it’s gotta be within a fraction of a second depending on the speed of the vehicle, certainly anything that’s navigation related if it’s autonomous, has to be sub millisecond.” P8: “So, for autonomous applications one of if you’re thinking of autonomous driving in terms of tractors or whatever, you can have a lot of data and you can offline train the model right. So, if you can train the model offline using various kinds of temporal datasets that have been taken overtime, it’s going to just enable decisions to be taken at real time faster. Currently it is right you don’t want it to make bad decisions, especially for things related to autonomous driving, so I think it’s latency sensitive and plus the cost of a bad decision is high.” | 0.67 (Good Agreement) | Data latency tends to not depend upon the data scalability requirements as it depends upon the type of precision agriculture application requirements. |
| Data latency-Power consumption | P3: “Lora-WAN maybe more specific would be appropriate for like one of these, you know, hundreds or thousands of sensors spread out over a huge area. You know something like that would typically be power or battery, small battery or energy harvested kind of thing. The sensors, probably by nature, not a very fast update rate, or don’t measure very often. And so, it maps to that technology well, but LoRA won’t solve the problem in the space, one would be just machine automation. You’ll never be able to have a cloud connected machine that’s maybe utilizing the cloud’s ability to do real time computations and have that connected through LoRA like this is probably just never work for latency reasons.” P5: “LoRA gateways consume huge amounts of power so that their clients don’t have to. You know. I mean, it’s a balance. You can only get so much data latency for a certain amount of power.” | 0.67 (Good Agreement) | Data latency tends to depend upon the power consumption requirements as lower the latency requirements from sensors and wireless communication technologies higher the power consumption. LoRA is a low power and higher latency wireless communication technology. The 3G/4G/5G and wireless WIFI might have more power consumption as they have low latencies-high data transfer rate and are used for autonomous applications. Bluetooth wireless BLE is a low power- low latency option for shorter communication range precision applications such as for RFID, GPS and other short communication range sensor precision applications. |
| Type of Wireless Communication- Power consumption | P14: But for power we did a comparison for some of the different wireless technologies. We were interested in the power consumption for data transfer and our goal was to decrease the data transfer for it’s obviously much lower. Especially Bluetooth low energy, right. So, 85.8% for LoRA it is 99.9% for LoRA and SigFox. So, I think just to map to a higher granularity, BLE is quite a bit lower. So, you may have to consider that if you’re thinking of data transfer using these different wireless technologies” P18: “The latency requirements and the power consumption. So, we actually have found that if the latency requirements are low and you basically want to consume the power, and that’s where we did this comparison between the different wireless technologies that LoRA is much more power consuming than Bluetooth. Depending on what networking modality you will have and the battery requirements of that sensor, you might want to kind of bound the amount of data transfer that is happening from the sensor to the gateway.” | 0.67 (Good agreement) | Type of wireless communication technology tends to depend upon the power consumption requirements as lower latency requirements of the precision application such as autonomous tends to have higher throughput rate and higher power consumption. |
| Data Storage-Power consumption | P4: “Here’s the rest API that you can pull the data in from so we can’t quantify what the power consumption is for that. But then you have it on the plant side. Sometimes you might have sensors where you could determine how often you want this data. So, then that determines the power consumption that’s going to be drawing. And so that’s to give like different perspectives on sometimes you might not know how it’s affecting the power consumptions. And sometimes you can see immediately that the battery level is one of the sensors that you were looking at and how the power is being drained.” | 1 (Excellent agreement) | Data storage tends not to depend upon the power consumption requirements. Power consumption tends to depend upon the data latency requirements as mentioned by participants. |
| Data Scalability-Cost | P7: “If you get, you know that data all the time and then you know if you want to record with ISO-Blue. If you want your real data at the end of the year, you know you don’t need that. By the 2nd, get that at the end of the year, you know that the high bandwidth data you don’t necessarily need you know.” | 0.70 (Good Agreement) | Data scalability tends to depend upon the cost requirements as data from different types of sensors might require more storage capacity that involve costs. However, the increase in storage at the cloud-end or wireless communication gateway might not contribute significantly to cost increase. Deploying large scale and different types of sensors might contribute significantly to the input variable cost. |
| Variable (Themes) | Supporting Participant Quotes | Definition’s Interpretations-Content Analysis |
|---|---|---|
| Cost | P11: “You have to go out there and take subsamples and that isn’t near detailed enough to address the variability that’s in the field. And so, to me, the big game changer that we really need is some kind of a low-cost accurate phosphorus potassium soil Ph type of a sensor”. P2: “The coverage using wireless technologies and for soil sensors LoRA will be great. For typical applications, Wi-Fi will be cheaper. It’s like it can support higher throughput; cellular is very promising, but it can cost a lot”. | Fixed cost (sensor cost, communication gateway technology cost). Variable cost (sensor batteries cost, power consumption cost, cloud storage subscription cost). |
| Types of Sensors | P14: “So, if you’re talking about a piece of autonomous farm equipment, at least of the data latency requirements, they are going to be significantly higher. Anything that involves safety typically requires high data rates and often has redundancies.” | Monitoring row crop diseases (weather sensors (temperature, humidity, light, pressure, soil moisture), remote sensing (drones, GPS, LiDAR image sensors), smart fertilization (Ph, nitrate soil sensors), smart irrigation (soil moisture, Ph level), farm machinery autonomous operations (GPS, accelerometers, proximity, fuel level, sound). |
| Type of Wireless Communication | P18: “The latency requirements and the power consumption, we actually have found that if the latency requirements are low and you basically want to consume the power, and that’s where we did this comparison between the different wireless technologies that LoRA is much more power consuming than Bluetooth. | 3G/4G/5G, LoRaWAN, Sigfox, TVWS (long communication range > 5–10 miles), mid-range (<1 mile) Zigbee, Wi-Fi, short range (10–1000 m), Bluetooth (BLE), GPRS. |
| Type of Precision Agriculture application | P10: “Autonomous areas don’t really care about data that happened previously and you’re not really going to need to store historical data, with the exception of the monitoring applications So I don’t imagine there being a very high data storage requirement.” | Monitoring applications (row crop diseases), autonomous applications (smart irrigation, smart fertilization, farm machinery navigation autonomous operations. |
| Data Storage | P11:“Keeping terabytes of data costs next to nothing on the cloud side or on the edge side. We have 500 gigabyte SSD’s that doesn’t cost too much and is smaller than a credit card, so that’s more than enough for us”. | Data storage platforms consists of wireless communication gateway-end and cloud storage (user-end application interface). |
| Data Scalability | P16: “Something on the leaves of crops, then you would use satellite aerial or drone typically, and so, I mean these are sensors or few in number, but they’re collecting a lot of data over a wide area.” | The scale or amount of data transferred for storage and processing from different types (number) of sensors to edge (communication gateway-end) or cloud (user-end application interface) for developing precision agriculture applications. |
| Data Latency | P14: “If your variable doesn’t change too often then it’s overkill to be sampling 8 every second so you can’t save a lot and probably this is one of the biggest advantages of LoRa. You can cover a big range and send a very low rate.” | Refers to the data transfer rate (bits/secs, bytes/secs, kbps, mbps) requirements defined for sensors and wireless communication technologies integrated with sensors for transferring data. |
| Communication Range | P18: “Something like LoRa-WAN maybe more appropriate for hundreds or thousands of sensors spread out over a huge area. Something like that would typically be a small battery or energy harvested kind of thing. The sensors, by nature, not a very fast data transfer rate required, or don’t measure very often.” | Defined as the communication distance between the sensor node (the device integrated with different types of sensors) and wireless communication gateway technology. |
| Data processing | P10: “So, if you see noisier data, you can do more dimensionality reduction or noise removal. So that is one way of doing differential analytics. The other is related to latency, so if you’re concerned about latency you might want to do more of the processing on the device or on the edge or in the cloud depending on the latency requirements.” | Defined as the amount of data (bits/secs, bytes/secs, kbps, mbps) processed by the communication gateway technology and cloud storage-end. |
| Power consumption | P4: “Sometimes you might have sensors where you could determine how often you want this data. So, then that determines the power consumption that’s going to be drawing”. P5: “LoRA gateways consume huge amounts of power so that their clients don’t have to. I mean, it’s a balance and you can only get so much data latency for a certain amount of power.” | Defined as power consumption by sensors, wireless communications technology integrated with sensors along with backhaul networks (Wi-Fi, GPRS, 3G/4G/5G). The operating battery voltage for sensor nodes having different types of integrated sensors is the indicator for power consumption used in the empirical analysis for this research. |
| Data interoperability | P2: “You know interoperability of formats and everything, something that will happen as data gets larger and you might want to go between different cloud environments, so we have some technology that we are developing to do some of that not entirely pivoted to other, but multi cloud is for example.” | Defined as the ability of cloud storage (user-end application interface) to store and process data from different sources (different types of sensors, wireless communication mobile gateway edge, remote sensing, other open-source data) and communicate well with heterogeneous sensors and farm machinery for data transfer. |
Disclaimer/Publisher’s Note: The statements, opinions and data contained in all publications are solely those of the individual author(s) and contributor(s) and not of MDPI and/or the editor(s). MDPI and/or the editor(s) disclaim responsibility for any injury to people or property resulting from any ideas, methods, instructions or products referred to in the content. |
© 2023 by the authors. Licensee MDPI, Basel, Switzerland. This article is an open access article distributed under the terms and conditions of the Creative Commons Attribution (CC BY) license (https://creativecommons.org/licenses/by/4.0/).
Share and Cite
Hundal, G.S.; Laux, C.M.; Buckmaster, D.; Sutton, M.J.; Langemeier, M. Exploring Barriers to the Adoption of Internet of Things-Based Precision Agriculture Practices. Agriculture 2023, 13, 163. https://doi.org/10.3390/agriculture13010163
Hundal GS, Laux CM, Buckmaster D, Sutton MJ, Langemeier M. Exploring Barriers to the Adoption of Internet of Things-Based Precision Agriculture Practices. Agriculture. 2023; 13(1):163. https://doi.org/10.3390/agriculture13010163
Chicago/Turabian StyleHundal, Gaganpreet Singh, Chad Matthew Laux, Dennis Buckmaster, Mathias J Sutton, and Michael Langemeier. 2023. "Exploring Barriers to the Adoption of Internet of Things-Based Precision Agriculture Practices" Agriculture 13, no. 1: 163. https://doi.org/10.3390/agriculture13010163