Article

Tea Category Identification Using Wavelet Signal Reconstruction of Hyperspectral Imagery and Machine Learning

1
School of Information and Computer, Anhui Agricultural University, Hefei 230036, China
2
State Key Laboratory of Tea Plant Biology and Utilization, Anhui Agricultural University, 130 Changjiang West Road, Hefei 230036, China
*
Authors to whom correspondence should be addressed.
Agriculture 2022, 12(8), 1085; https://doi.org/10.3390/agriculture12081085
Submission received: 16 June 2022 / Revised: 18 July 2022 / Accepted: 18 July 2022 / Published: 23 July 2022
(This article belongs to the Special Issue Digital Innovations in Agriculture)

Abstract

:
Accurately distinguishing the types of tea is of great significance to the pricing, production, and processing of tea. The similarity of the internal spectral characteristics and appearance characteristics of different types of tea greatly limits further research on tea identification. However, wavelet transform can simultaneously extract time domain and frequency domain features, which is a powerful tool in the field of image signal processing. To address this gap, a method for tea recognition based on a lightweight convolutional neural network and support vector machine (L-CNN-SVM) was proposed, aiming to realize tea recognition using wavelet feature figures generated by wavelet time-frequency signal decomposition and reconstruction. Firstly, the redundant discrete wavelet transform was used to decompose the wavelet components of the hyperspectral images of the three teas (black tea, green tea, and yellow tea), which were used to construct the datasets. Secondly, improve the lightweight CNN model to generate a tea recognition model. Finally, compare and evaluate the recognition results of different models. The results demonstrated that the results of tea recognition based on the L-CNN-SVM method outperformed MobileNet v2+RF, MobileNet v2+KNN, MobileNet v2+AdaBoost, AlexNet, and MobileNet v2. For the recognition results of the three teas using reconstruction of wavelet components LL + HL + LH, the overall accuracy rate reached 98.7%, which was 4.7%, 3.4%, 1.4%, and 2.0% higher than that of LH + HL + HH, LL + HH + HH, LL + LL + HH, and LL + LL + LL. This research can provide new inspiration and technical support for grade and quality assessment of cross-category tea.

1. Introduction

Tea is a drink widely loved by consumers because of its unique flavor and health function [1]. In particular, unfermented green tea, lightly fermented yellow tea, and fully fermented black tea have received extensive attention and research. Among them, green tea contains polyphenols to help prevent cancer [2], and yellow tea and black tea have strong antioxidant activity [3,4,5]. Different categories of tea have different characteristics and quality standards. Even if the same type of tea leaves, it is difficult to distinguish the type of tea due to different processing techniques and geographical indications of origin. Therefore, fast and accurate tea classification has always been an active research hotspot, which is of great significance to the control of tea fermentation time, production process, and processing links.
The traditional methods of tea classification were generally based on physical and chemical indicators, and sensory evaluation. Among them, methods based on physical and chemical indicators, such as gas chromatography-mass spectrometry [6], were not easy popularized and applied because of time-consuming operations and destructive experiments. Some methods were costly and complicated, such as near-infrared spectroscopy detection [7], fluorescence spectroscopy detection [8], electronic tongue, and electronic nose [9,10,11], which might limit the universality of tea classification methods. Of course, the sensory evaluation method is one of the common methods in the tea field [12]. Although it could make up for the limitations of physical and chemical testing methods, it was susceptible to the influence of the subjective factors of review experts, which could lead to inaccurate tea classification [13,14]. Therefore, it is necessary to develop a method to classify different categories of tea objectively and reliably.
In fact, classification based on the appearance characteristics of tea was a relatively simple and effective method. Especially the classification of tea based on machine vision has been widely used [15]. However, the resolution of the tea sample image and the shooting environment may affect the classification accuracy [16]. With the rapid development of hyperspectral image processing technology, its application in food analysis is becoming more and more attractive [17,18]. Studies have shown that analysis based on hyperspectral images has achieved better results not only in tea internal quality, such as tea polyphenols, catechins, and tea amino acids [19,20,21] but also in tea classification, such as the classification of green tea [22,23,24], the classification of tieguanyin tea [25], oolong tea varieties [26]. However, most of the studies mentioned above were based on common features, such as texture features and spectral reflectance, which severely limited further research on tea classification.
Multi-resolution analysis based on wavelet transform has been extensively studied in various fields, such as image enhancement, image decomposition and reconstruction, signal-to-noise separation, and signal filtering based on wavelet transform have been applied [27]. In addition, wavelet transform has good analysis ability in both the time domain and frequency domain [28]. Wu et al. proposed entropies from the wavelet coefficient to successfully classify green, black, and oolong [29]. Bakhshipour et al. extracted wavelet features to classify black and green teas [30]. Borah et al. extracted wavelet textures to classify black teas of different levels [31]. Regardless of the form of the wavelet feature, the research mentioned above provides all the retrieved features of tea biochemistry or composition for tea classification. Obviously, they neither tried to extract more advanced wavelet semantic features to classify tea more effectively nor did they try to better understand the contribution of wavelet coefficient components to tea classification.
In fact, the essence of wavelet transform is to solve the signal energy at different decomposition scales to form feature vectors for identification. In particular, the wavelet coefficient components of the image obtained by the discrete wavelet transform method respectively represent the approximate features and detailed features in different directions. As we all know, some methods use wavelet coefficients to reconstruct images, and other methods use wavelet coefficients to achieve signal denoising. At present, there is no universally accepted consensus on which wavelet coefficient components perform well. Nevertheless, the research mentioned above was based on the manual wavelet feature extraction method, which lacked stability and robustness. Therefore, the research on tea classification still faces many technical issues.
With the wide application of deep learning in different fields, the research ideas of tea classification have been greatly expanded. To more fully extract the spectral-spatial joint features in hyperspectral images, the researchers applied deep learning techniques to the task of tea classification [32]. Deep neural networks are composed of many network layers and have powerful feature extraction capabilities from low-level to high-level, which could solve the problem of insufficient and unstable features extraction by traditional methods [33]. In particular, the combination of deep learning and wavelet transform has been widely concerned and applied. Some research focused on image stitching based on convolutional neural network (CNN) and wavelet transform methods [34]. For example, El-Latif et al. respectively carried out research on the strategies of high-frequency sub-band splicing and low-frequency sub-band splicing based on wavelet decomposition. In contrast, some studies applied deep learning methods to process wavelet components to achieve image reconstruction. For example, Qi et al. used CNN to restore image sub-bands corresponding to different wavelet coefficient components including low frequency (LL) and high frequency (LH, HL, and HH) [35]. Wang et al. used CNN to generate corresponding weight maps for low-frequency and high-frequency wavelet coefficient components [36]. Although the convolutional neural network and wavelet transform exhibited the analysis potential of different frequency sub-band for the wavelet components obtained by wavelet decomposition of the image, they have not been applied to the combination of wavelet sub-bands of different frequencies to achieve accurate classification. In addition, studies have shown that discrete wavelet transform decomposing time-frequency domain signals from images could improve classification accuracy [37]. However, it remains unclear how the optimal combination of multiple wavelet components affects the classification performance of different teas.
Therefore, a method of tea classification was proposed with the deep semantic features from wavelet component combination based on the lightweight CNN model, aiming to further extract features from hyperspectral images. The purpose of this research is to (1) decompose tea hyperspectral images through redundant wavelet transform to obtain different wavelet coefficients in different time and frequency domains, thereby improving the feature expression ability, (2) reconstruct the image with the optimal combination of wavelet components, and an improved lightweight convolutional neural network model was proposed, aiming to achieve tea recognition accuracy, and (3) compare and evaluate the classification results of different kinds of tea to verify the effectiveness of the method proposed in this study.

2. Materials and Methods

2.1. Sample Collection and Data Set Construction

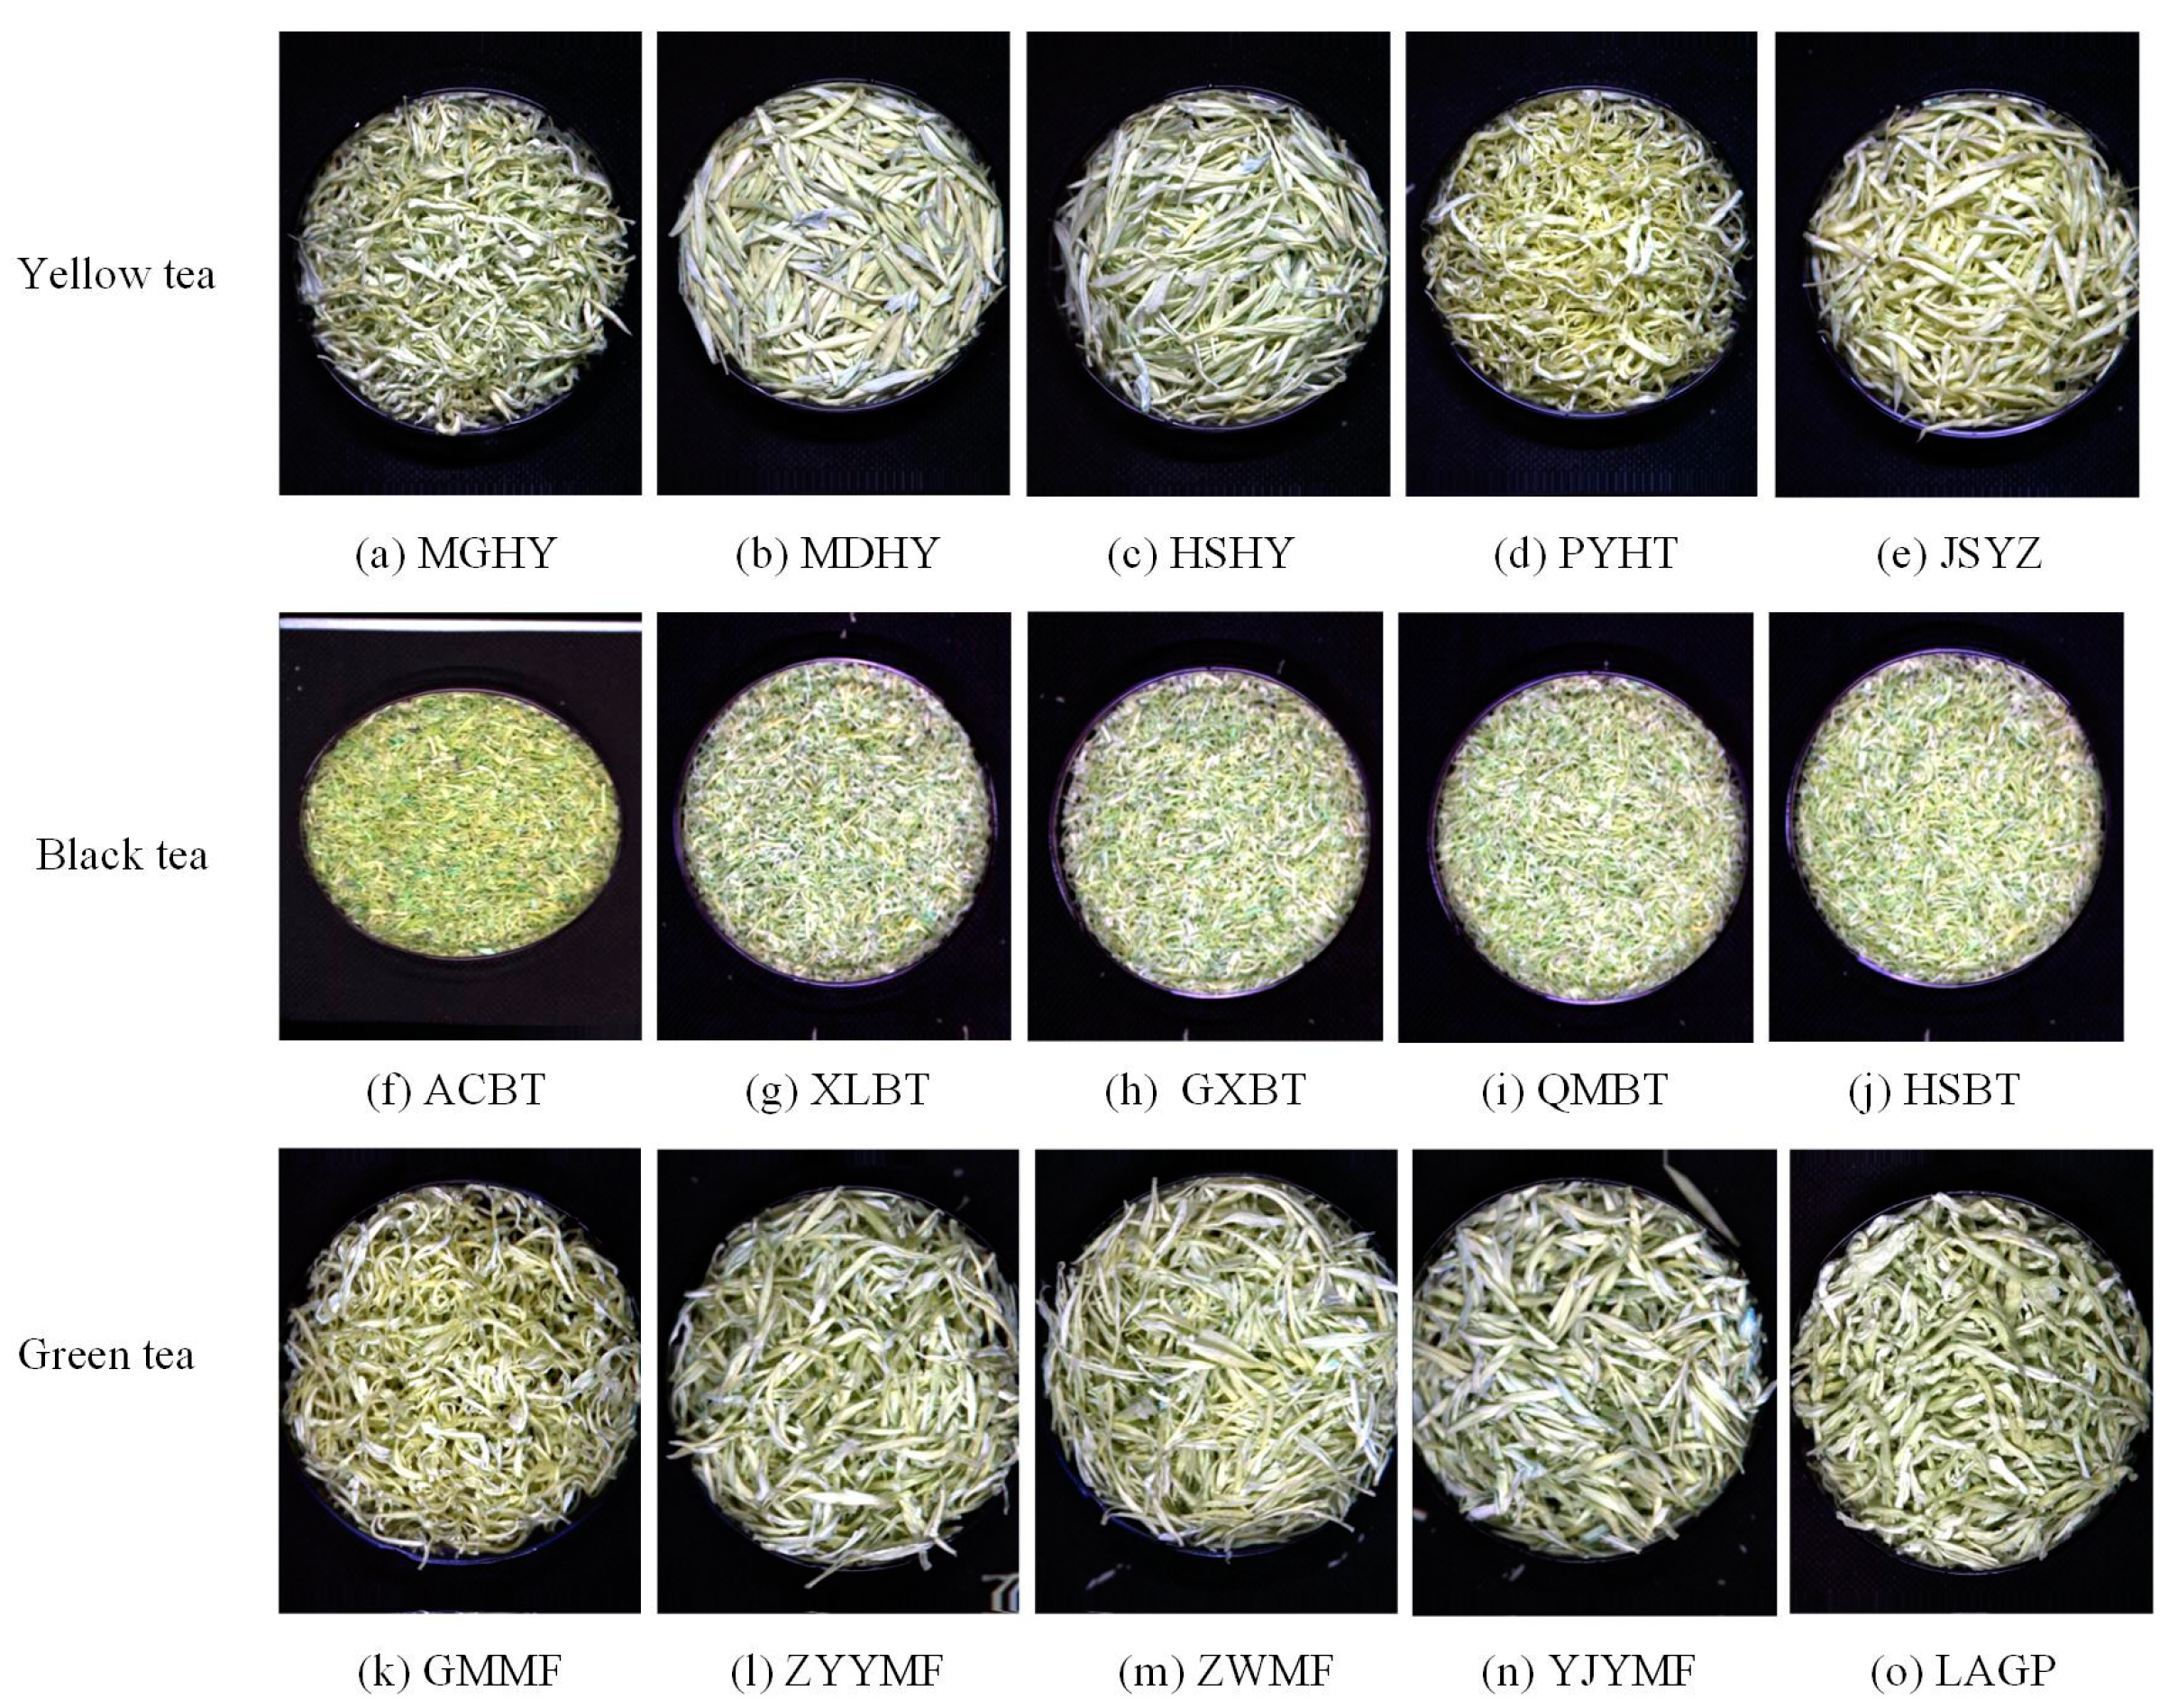
2.1.1. Collection of Tea Samples

The tea samples used in the experiment were three categories of tea purchased from large supermarkets and online, including yellow tea, green tea, and black tea. Among them, yellow tea includes Mogan Huangya (MGHY, produced in Huzhou, China), Mengding Huangya (MDHY, produced in Ya’an, China), Huoshan Huangya (HSHY, produced in Lu’an, China), Pingyang Huangtang (PYHT, produced in Wenzhou, China), Junshan Yinzhen (JSYZ, produced in Yueyang, China). Green tea includes Maofeng (MF, produced in Huangshan, China) and Liuan Guapian (LAGP, produced in Lu’an, China). In order to obtain more samples, it is necessary to collect the same category of tea from different manufacturers. For example, although the geographical indication origin of Qimen black tea is Qimen County, Huangshan City. We still collect black tea from different company, including Anchi Tea limited company, Chizhou, China (ACBT), Xiaolukou Tea limited company (XLBT), Gaoxiang Black Tea Factory, Huangshan, China (GXBT), Qihong Tea limited company, Huangshan, China (QMQH), and Qimen Tea limited company, Huangshan, China (HSBT). Moreover, Maofeng (green tea) was collected from different production companies, including Guangming Tea limited company, Huangshan, China (GMMF), Beijing Zhangyiyuan Jingtailong Tea limited company, Huangshan, China (ZYYMF), Ziwei Tea limited company, Huangshan, China (ZWMF), Yijiangyuan Tea limited company, Huangshan, China (YJYMF). In total, 15 kinds of tea samples collected were produced in four provinces (Anhui Province, Zhejiang Province, Hunan Province, Sichuan Province) in China (Table 1).

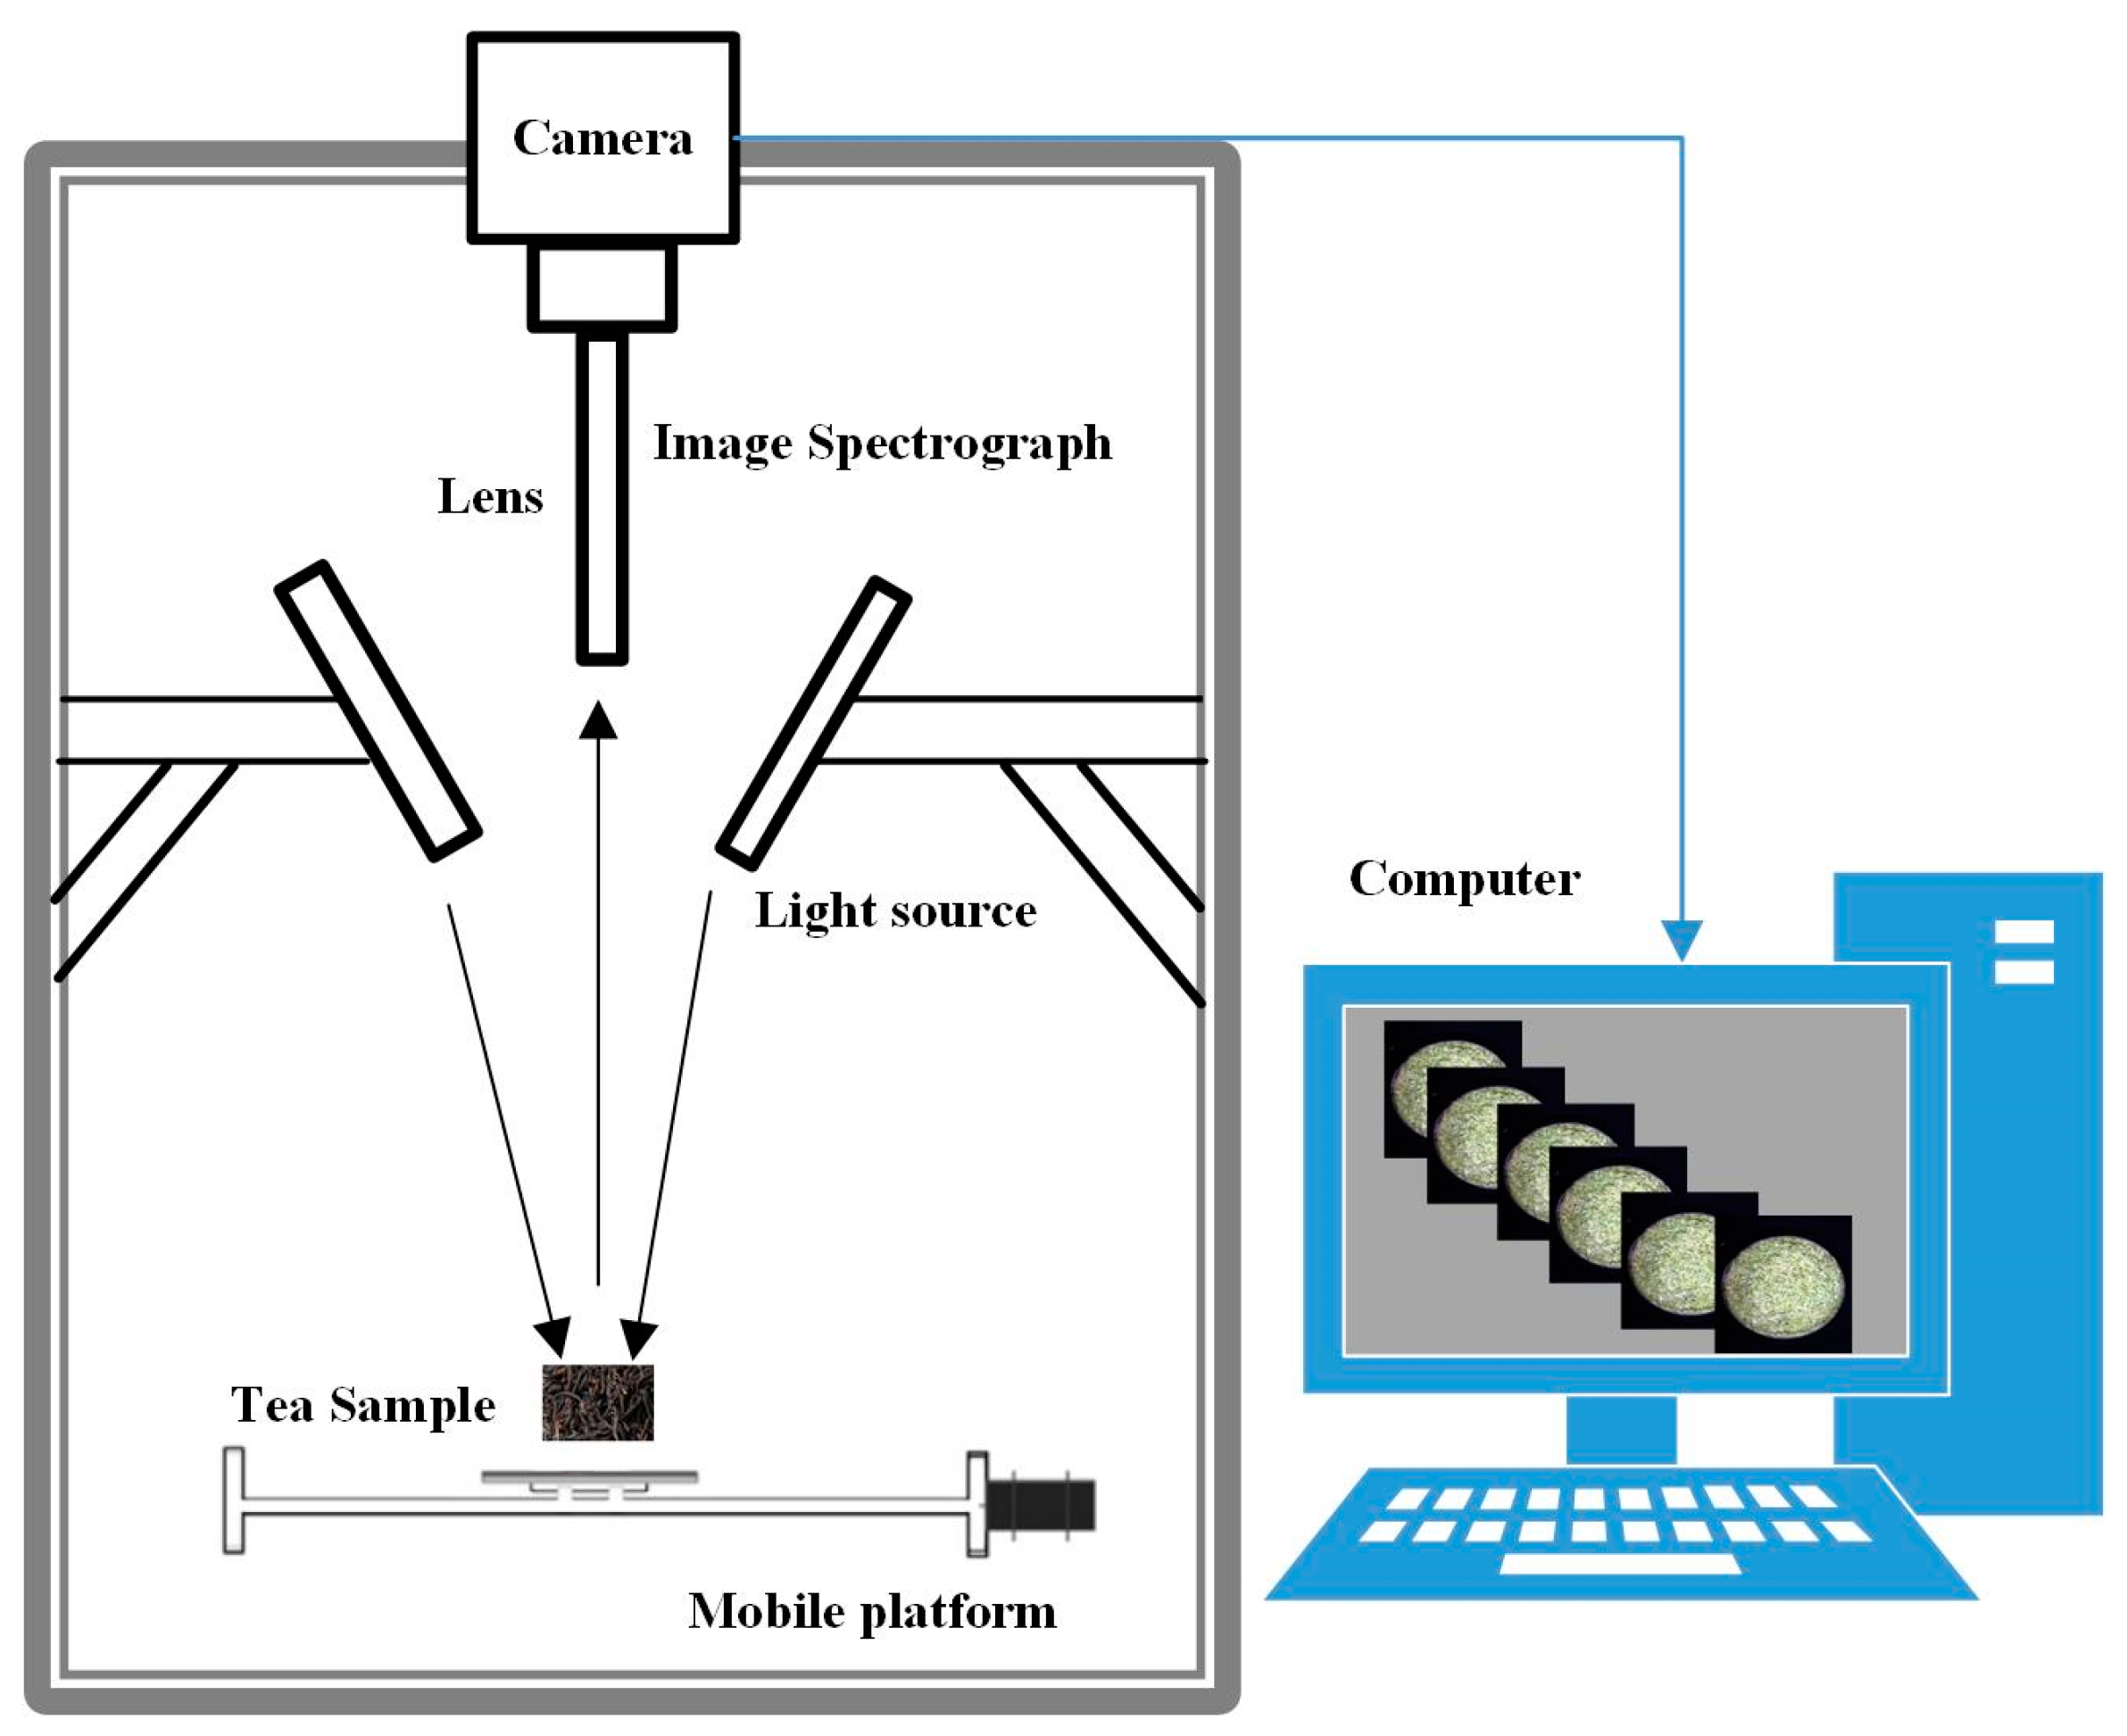
2.1.2. Acquisition of Hyperspectral Images of Tea
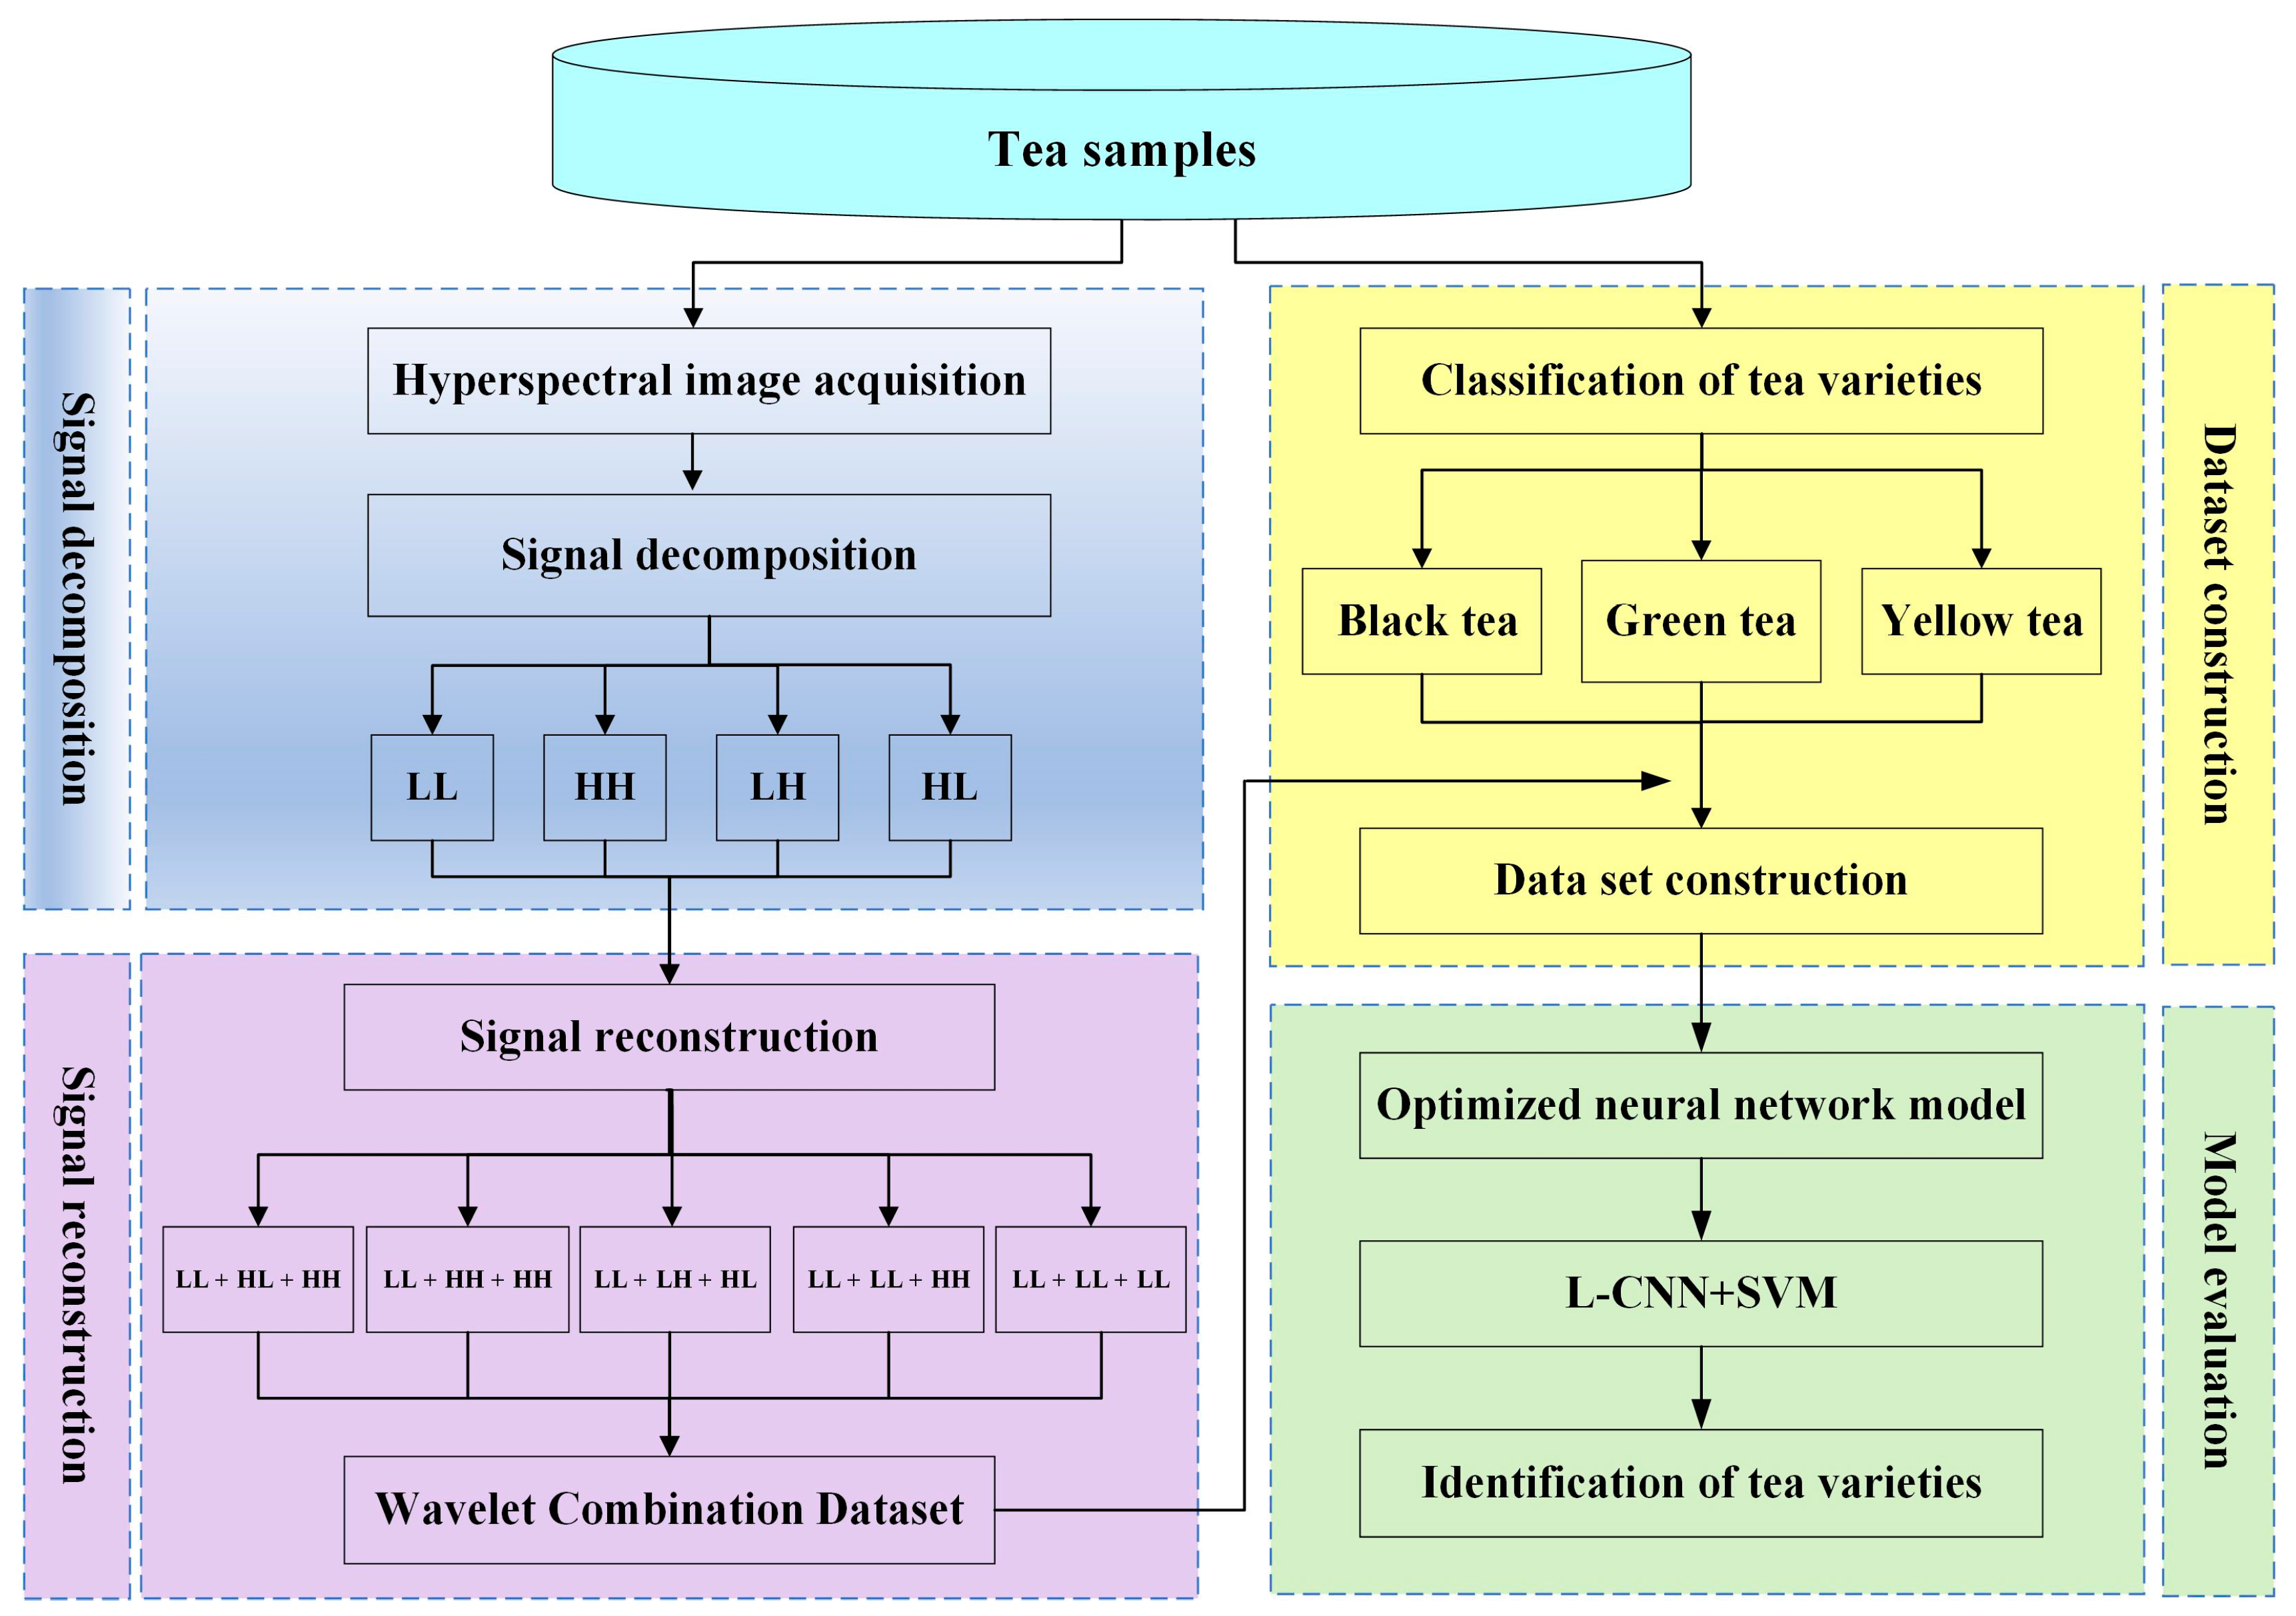
The near-infrared hyperspectral imaging (NIR-HSI) system was used to acquire hyperspectral images of tea samples. The system mainly consists of an image spectrograph (Imspector V17E, Spectral Imaging Ltd., Oulu, Finland), two 150W fiber optic halogen lamps (Model 3900, Illumination Technologies Inc., New York, NY, USA), a camera obscura, and mobile platform. The hyperspectral image obtained by this system has a total of 616 wavelength bands ranging from 908 to 1735 nm. The structure diagram of the hyperspectral imaging system is shown in Figure 1.
The preparations before collecting hyperspectral images are as follows: turn on the light source for preheating 30 min before the experiment, set the distance between the camera and the tea sample to 38.4 cm, set the sample moving speed on the conveyor belt to 1 cm/s, and set the exposure time to 20 ms. Set the frame rate to 13 Hz. The tea samples were evenly spread in a Petri dish with a diameter of 9 cm × 1 cm. The Petri dish was pre-built with black rubber with approximately zero reflectivity, so as not to affect the experimental data. Then, open the operation interface of the hyperspectral image acquisition software to collect hyperspectral images of the tea samples. Furthermore, the hyperspectral images were white-boarded and dark-current corrected. Finally, the Environment for Visualizing Images (ENVI 5.1, ITT visual information solutions, Boulder, CO, USA) was used to analyze the spectral features of tea.

2.2. Method

2.2.1. Decomposition and Reconstruction of Image Signal by Wavelet

Wavelet transform is a signal time-frequency analysis method, and a common method is wavelet multi-resolution analysis. When a two-dimensional grayscale image is processed, a one-dimensional discrete wavelet transform is used to operate the image, two directions are selected to pass through a filter bank, and the data is reduced by downsampling [38]. That is, the different characteristics of images on various scales are described from the perspective of space.
Redundant wavelet transform (RWT) is a kind of wavelet transform in which the decomposition results of signals or images on adjacent scales have redundancy. That is, the high- and low-frequency information of the signal or image is separated, and finally, it is decomposed into approximate signals and wavelet surfaces on different frequency channels. Moreover, the length of the approximation signal and the detail signal after the signal transformation are the same as the original signal length [39].
The redundant discrete wavelet transform is represented by a filter bank. The output coefficient obtained after each level of decomposition is twice the input coefficient. The decomposition formulas of redundant discrete wavelet transform are as Formulas (1) and (2), and the mathematical expressions for reconstruction are as Formula (3):
c j + 1 [ k ] = c j [ k ] h [ k ]
d j + 1 [ k ] = c j [ k ] g [ k ]
c j + 1 [ k ] = c j [ k ] h [ k ] + d j [ k ] g [ k ] 2
Among them, h [ k ] and g [ k ] represent low-pass and high-pass decomposition filters, respectively, c j and d j represent the coefficients of the low-band and high-band output of the j th level, means convolution, the low-pass and high-pass synthesis filters are h [ k ] and g [ k ] , respectively. A is the original signal, A τ is the reconstructed signal.
An image can be viewed as a two-dimensional signal. Applying wavelet theory to image processing is to use multi-resolution decomposition to decompose the image into sub-images of different spaces and frequencies, and then encode the coefficients of the sub-images. At the same time, wavelet transform can better solve the contradiction between time and frequency resolution, so wavelet transform is very beneficial to the decomposition and reconstruction of image signals.

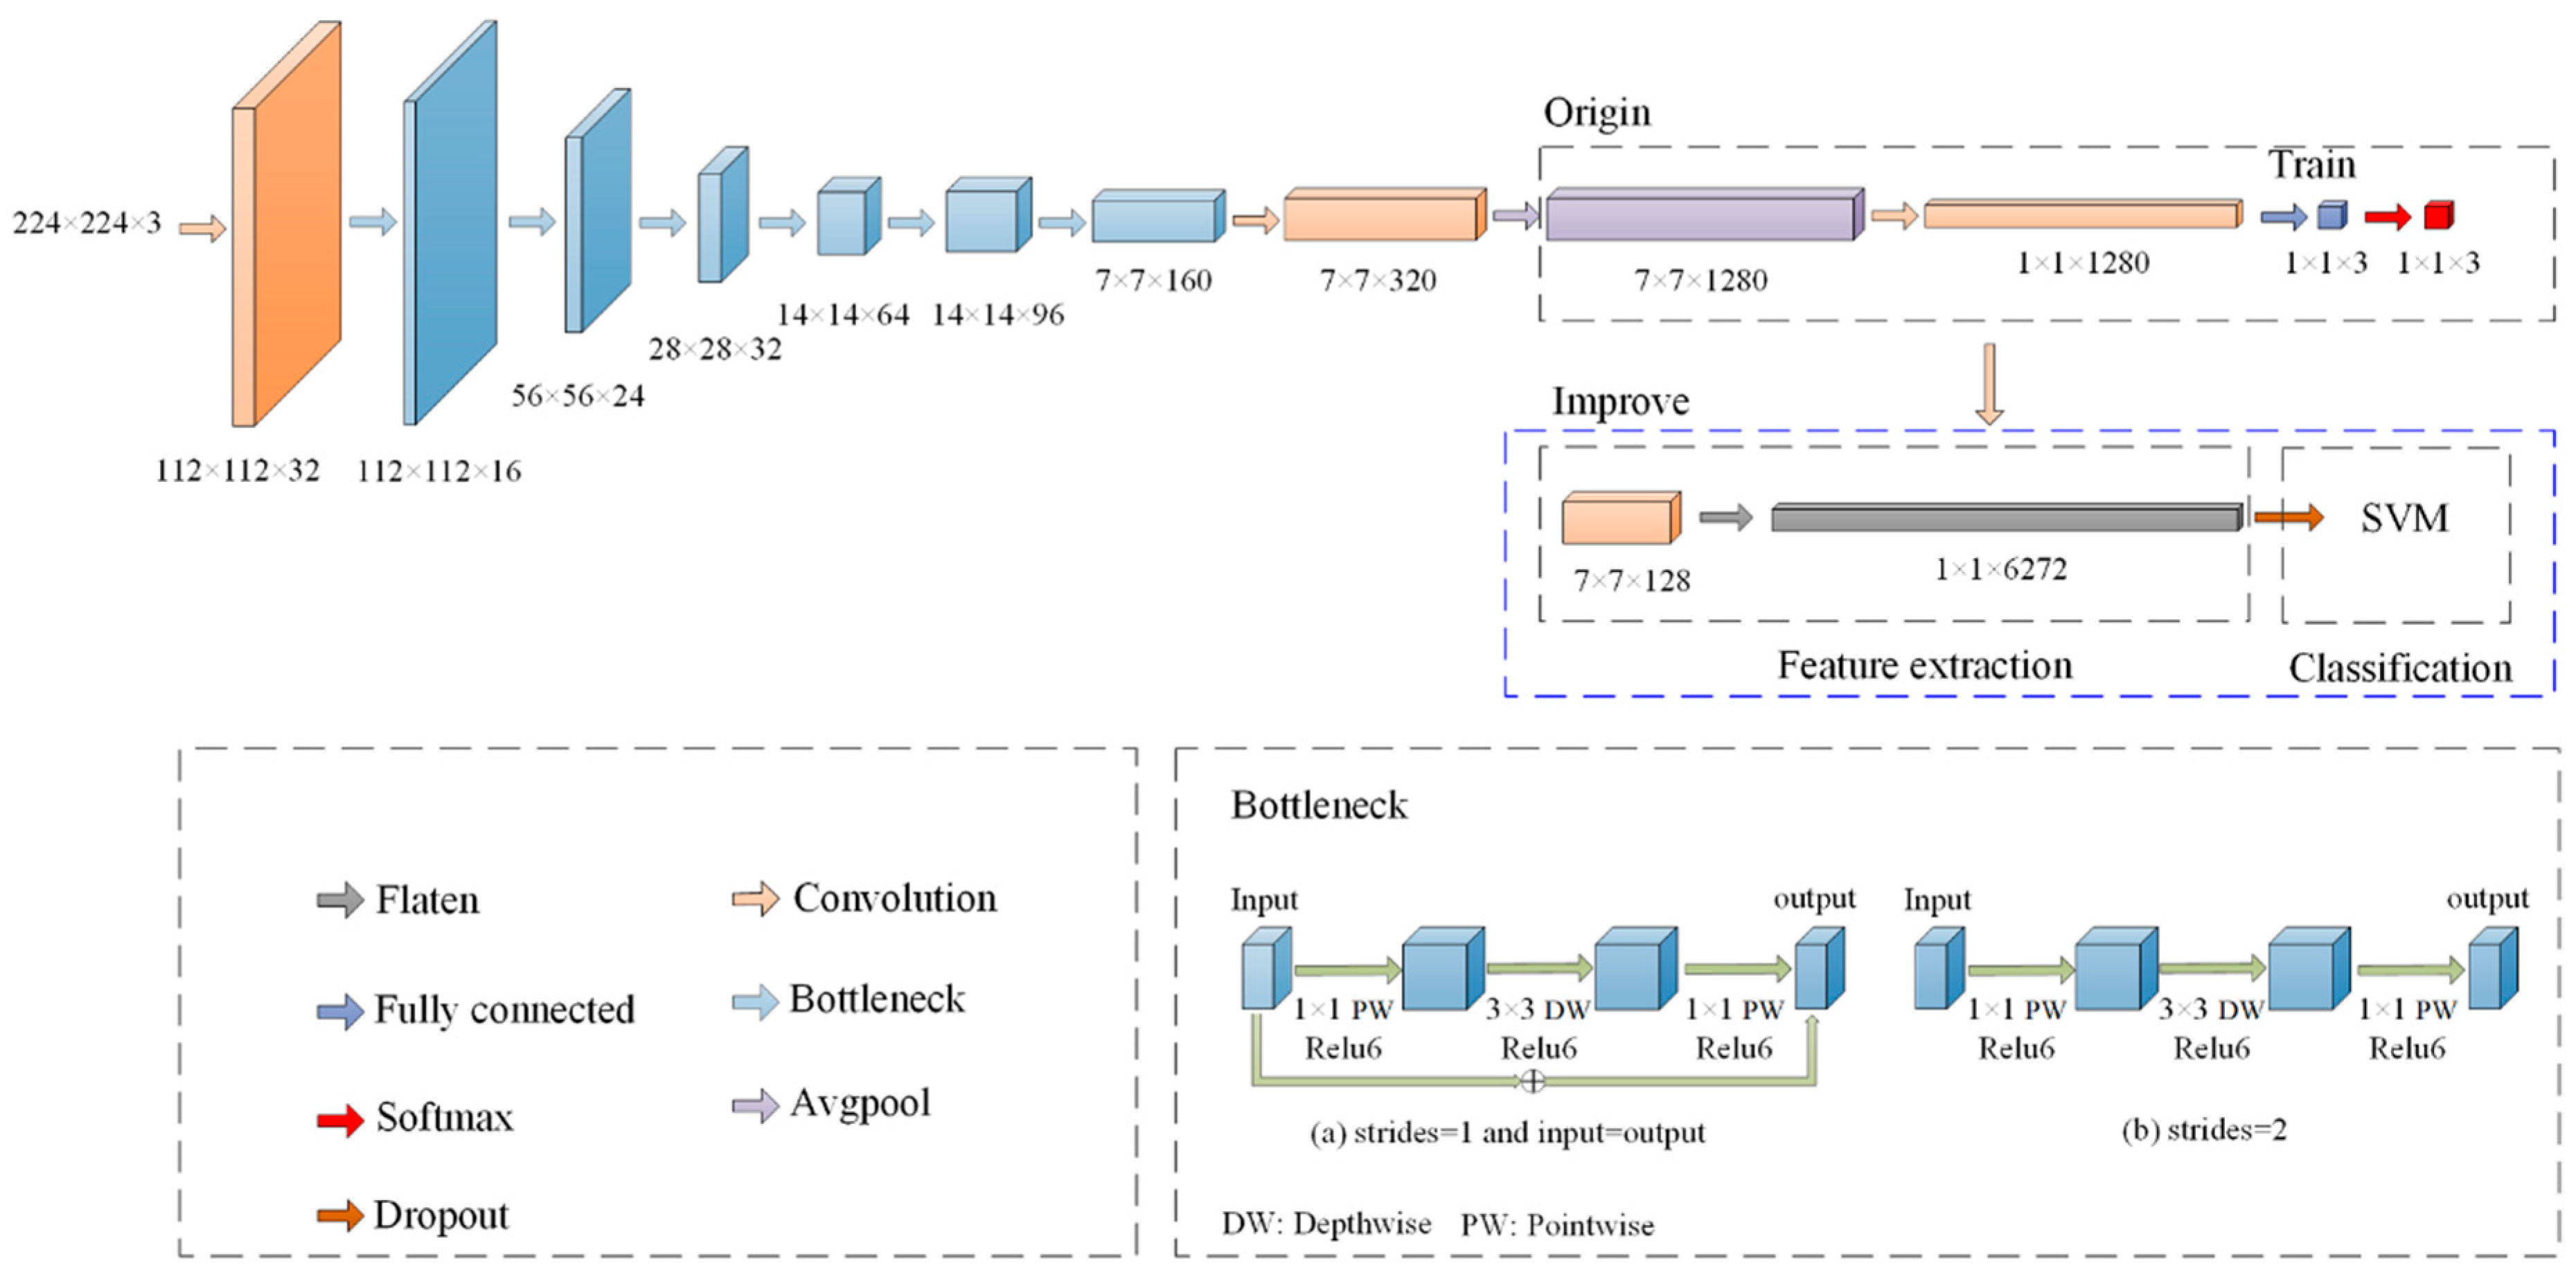
2.2.2. Classification Model Based on Improved Lightweight CNN

MobileNet is a lightweight deep neural network based on a depthwise separable convolution design, which has performed very well in the classification. Among them, MobileNetV2 introduces an inverted residual and linear bottleneck structure, which makes the number of network parameters and lower computing costs. The parameters of the network structure are shown in Table 2.
The MobileNetV2 network includes ordinary convolution (Conv), inverse residual structure deep separation convolution (Bottleneck), and average pooling (Avgpool). To enhance the applicability of the network in tea classification and improve the accuracy of target classification. Based on MobileNetV2 in this study, the following improvements have been made (as shown in Figure 2 and Table 3). To further reduce computing resources and save memory space when training the network. Remove the network layer after the 9th layer, and reduce the number of channels of the convolutional layer from 1280 to 128. The three-dimensional feature map was converted into one-dimensional through the Flatten layer. To better adapt to the problem of tea hyperspectral image classification, SoftMax was replaced with SVM classifier to improve the generalization ability of the model.

2.2.3. Tea Classification Model Based on Optimized L-CNN

The technical route of this research was shown in Figure 3. Firstly, the hyperspectral images of the tea samples were acquired, the wavelet components corresponding to the hyperspectral image were extracted by redundant wavelet transform, and the combination of different wavelet components was used as the input of the deep convolutional neural network. Secondly, the deep convolutional neural network model undergoes transfer learning, model training, and parameter optimization to generate an optimized classification model. Finally, the classification model was tested on the selected tea samples. The specific steps were as follows: The transfer learning process of this research was mainly realized by using the improved CNN model pre-trained on the large-scale ImageNet dataset as the source domain. The trained network parameters were used as the initial parameters for the training of the tea classification model based on hyperspectral images, and the self-built data sets (the combination of wavelet coefficients extracted from the tea hyperspectral images) were used to fine-tune the parameters of the L-CNN model to improve the automatic tea identification ability.
The experimental environment of this study is shown in Table 4. The parameters of the L-CNN were set as follows: the learning rate is 0.0001, the epoch is 50, and the batch size is 10.

2.2.4. Evaluation Indicator of Classification Model

To accurately evaluate the tea classification model, precision, recall, and accuracy are used as indicators for model performance evaluation. Precision measures the classification accuracy of positive samples, recall represents the proportion of correctly classified positive samples to the total positive samples, and accuracy measures the proportion of all samples that are accurately classified.
precision = TP TP + FP
recall = TP TP + FN
accuracy = TP + TN TP + TN + FP + FN
In the classification task, when it is determined that the category of a certain type of tea is positive, the other categories are negative.
TP means that the predicted category is a positive category and the model judges it as a positive category; that is, the positive category is judged correctly;
FP means that the predicted category is a positive category and the model judges it to be a negative category; that is, the judgment of the positive category is wrong;
FN means that when the predicted category is a negative category and the model judges it as a negative category; that is, the negative category is judged correctly;
TN means that when the predicted category is a negative category and the model judges it as a positive category, the negative category is judged wrong.
In addition, the ROC (receiver operating characteristic) curve is used to compare different classification results. The horizontal axis of the ROC curve represents the false-positive ratio (FPR), and the vertical axis represents the true-positive rate (TPR). The closer the ROC curve is to the upper left corner, the higher the accuracy of the prediction. TPR and FPR are defined as shown in Equations (7) and (8).
TPR = TP TP + FN
FPR = FP TN + FP
In addition, the ROC curve is divided into two parts according to the position of the curve. The area under the curve and the horizontal axis part is called AUC (area under the roc curve), and the value is between [0, 1]. The closer the AUC is to 1, the better the classification effect of the model.
To more fully demonstrate the classification effect, a confusion matrix is used to indicate the classification visualization, which describes the relationship between the true category attributes of the sample data and the classification results in the form of a matrix. Suppose that for the classification task of type m pattern, V is the test sample set, the number of samples is n the number of categories is m , and C = { C 1 , C 2 , C L } is the classifier set. L classifiers are used to test in set V , respectively, to obtain the confusion of each classifier matrix (confusion matrix) CM k ( k = 1 , 2 , L ) , the confusion matrix of the k classifier C k is expressed as follows:
CM k = [ n 1 , 1 k n 1 , 2 k n 1 , m k n 2 , 1 k n 2 , 2 k n 2 , m k n m , 1 k n m , 2 k n m , m k ]
Among them, the element in the i-th row and the j-th column represents the number of the i-th class recognized as the j-th class by the classifier C k in the sample. If i = j , it means that the classifier could correctly identify the number of samples, so diagonal elements represent the number of correctly classified by classifier C k , and off-diagonal elements represent the number of errors classified by classifier C k . In the confusion matrix, each column represents the predicted category, and each row represents the true attribution category (sample label) of the tea. The total number of columns is equal to the total number of rows, which is the total number of label categories of the data sample. The larger the diagonal value of the confusion matrix, the greater the probability that the model is correctly classified, and the better the model effect.

3. Results

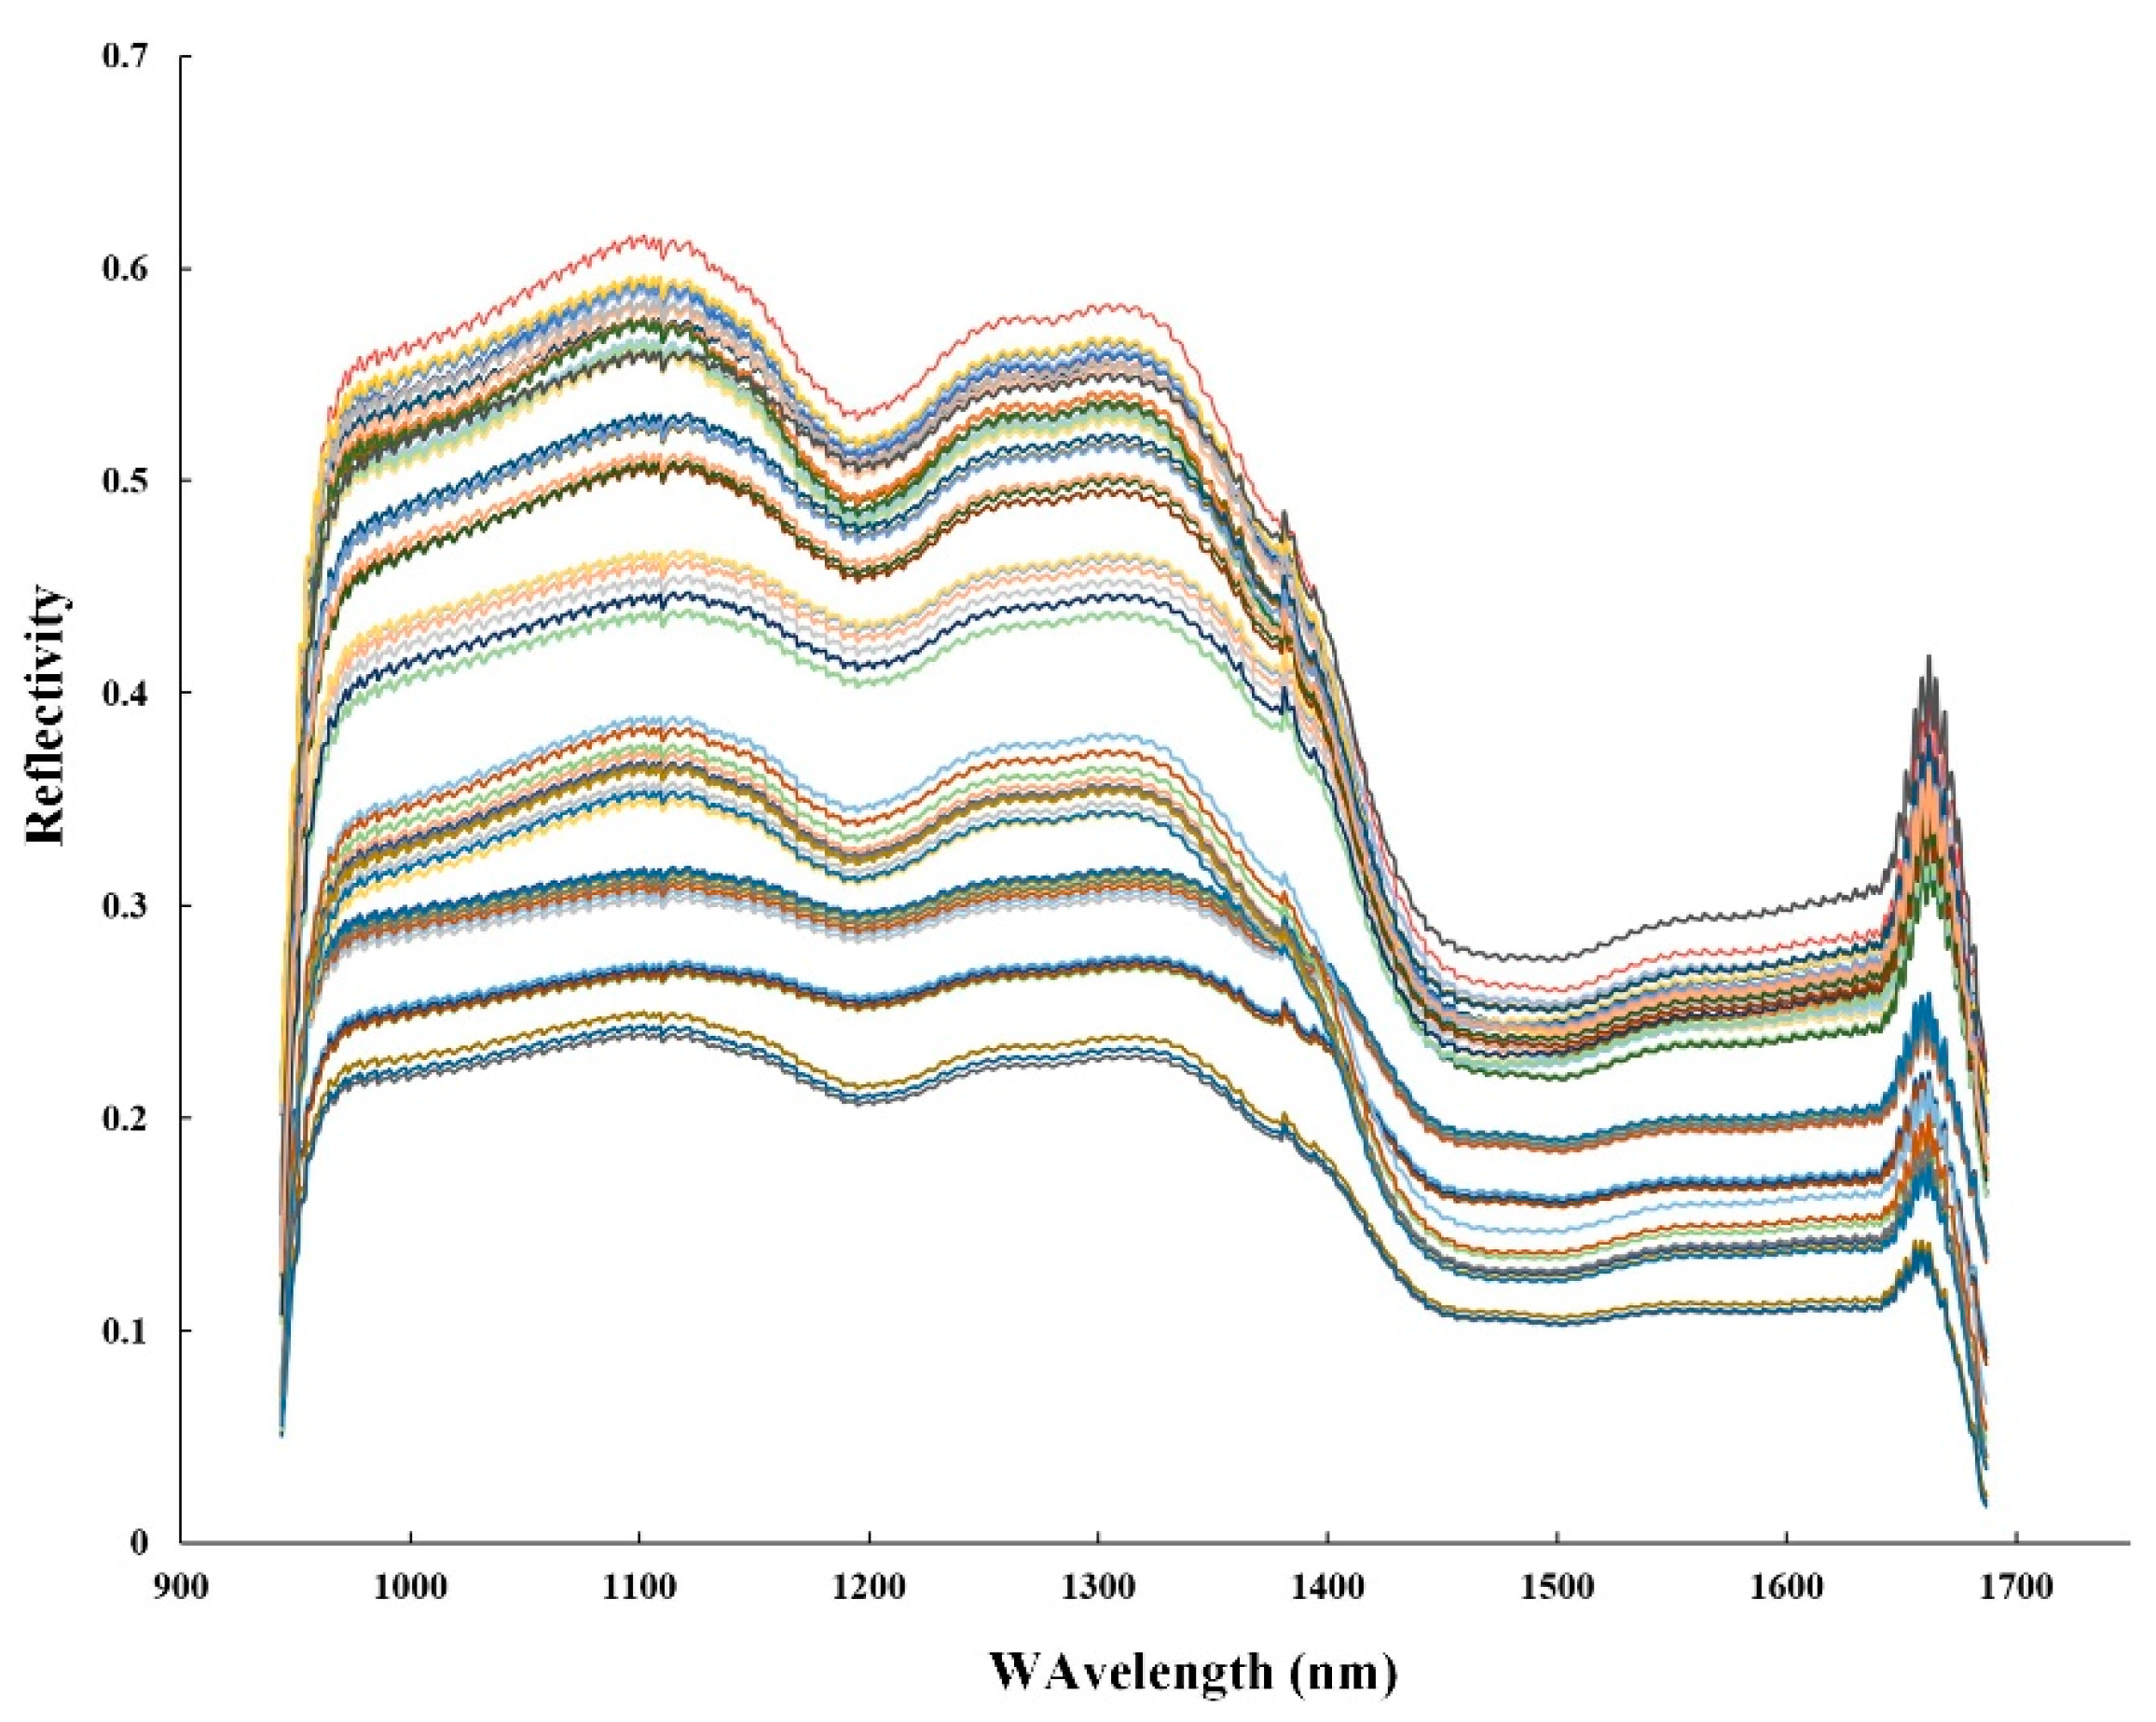
3.1. Hyperspectral Images and Spectral Reflectance of Different Types of Tea

One hundred and fifty grams of each sample was sealed, stored, and sent to the hyperspectral laboratory for hyperspectral imaging collection in time. The hyperspectral images of all samples were acquired using a hyperspectral instrument, which accessories were reported in the previous research of our team [28]. The self-built data set using the collected hyperspectral images from 15 teas (as shown in Figure 4) contained 450 hyperspectral images of three categories of tea, including 150 images of black tea, 150 images of green tea, and 150 images of yellow tea. The data sets were divided into training set, validation set, and test set according to the ratio of 7:3:5.
Different parts of the tea samples, such as stems, leaves, and buds, contain significant differences in the content of substances, so the spectral data between each pixel point is quite different. To address this issue, 50 regions of interest (ROI) of 20 × 20 pixels were randomly selected in the sample area. A pixel contains a piece of spectral information, and the average spectrum of all pixels in the ROI was calculated as the spectral reflectance of a sample. The original spectrum collection of tea samples is shown in Figure 5.
In Figure 6, the wavelength range is 944–1688 nm, all tea samples had similar trends in the whole spectral region, most of the reflectance is from 0.4–0.7, but the size of absorbance is different. In particular, in the three absorption bands located at 1200, 1380, and 1450 nm, the absorption peak at 1200 nm is attributed to the C-H second overtone; the peak bands near 1400 nm are attributed to the O-H vibration. It can be seen that black tea, green tea, and yellow tea have similar spectral features. It is difficult to distinguish different types of tea based on spectral information alone. To effectively identify different kinds of tea, further analysis was carried out according to the different spatial information of tea.

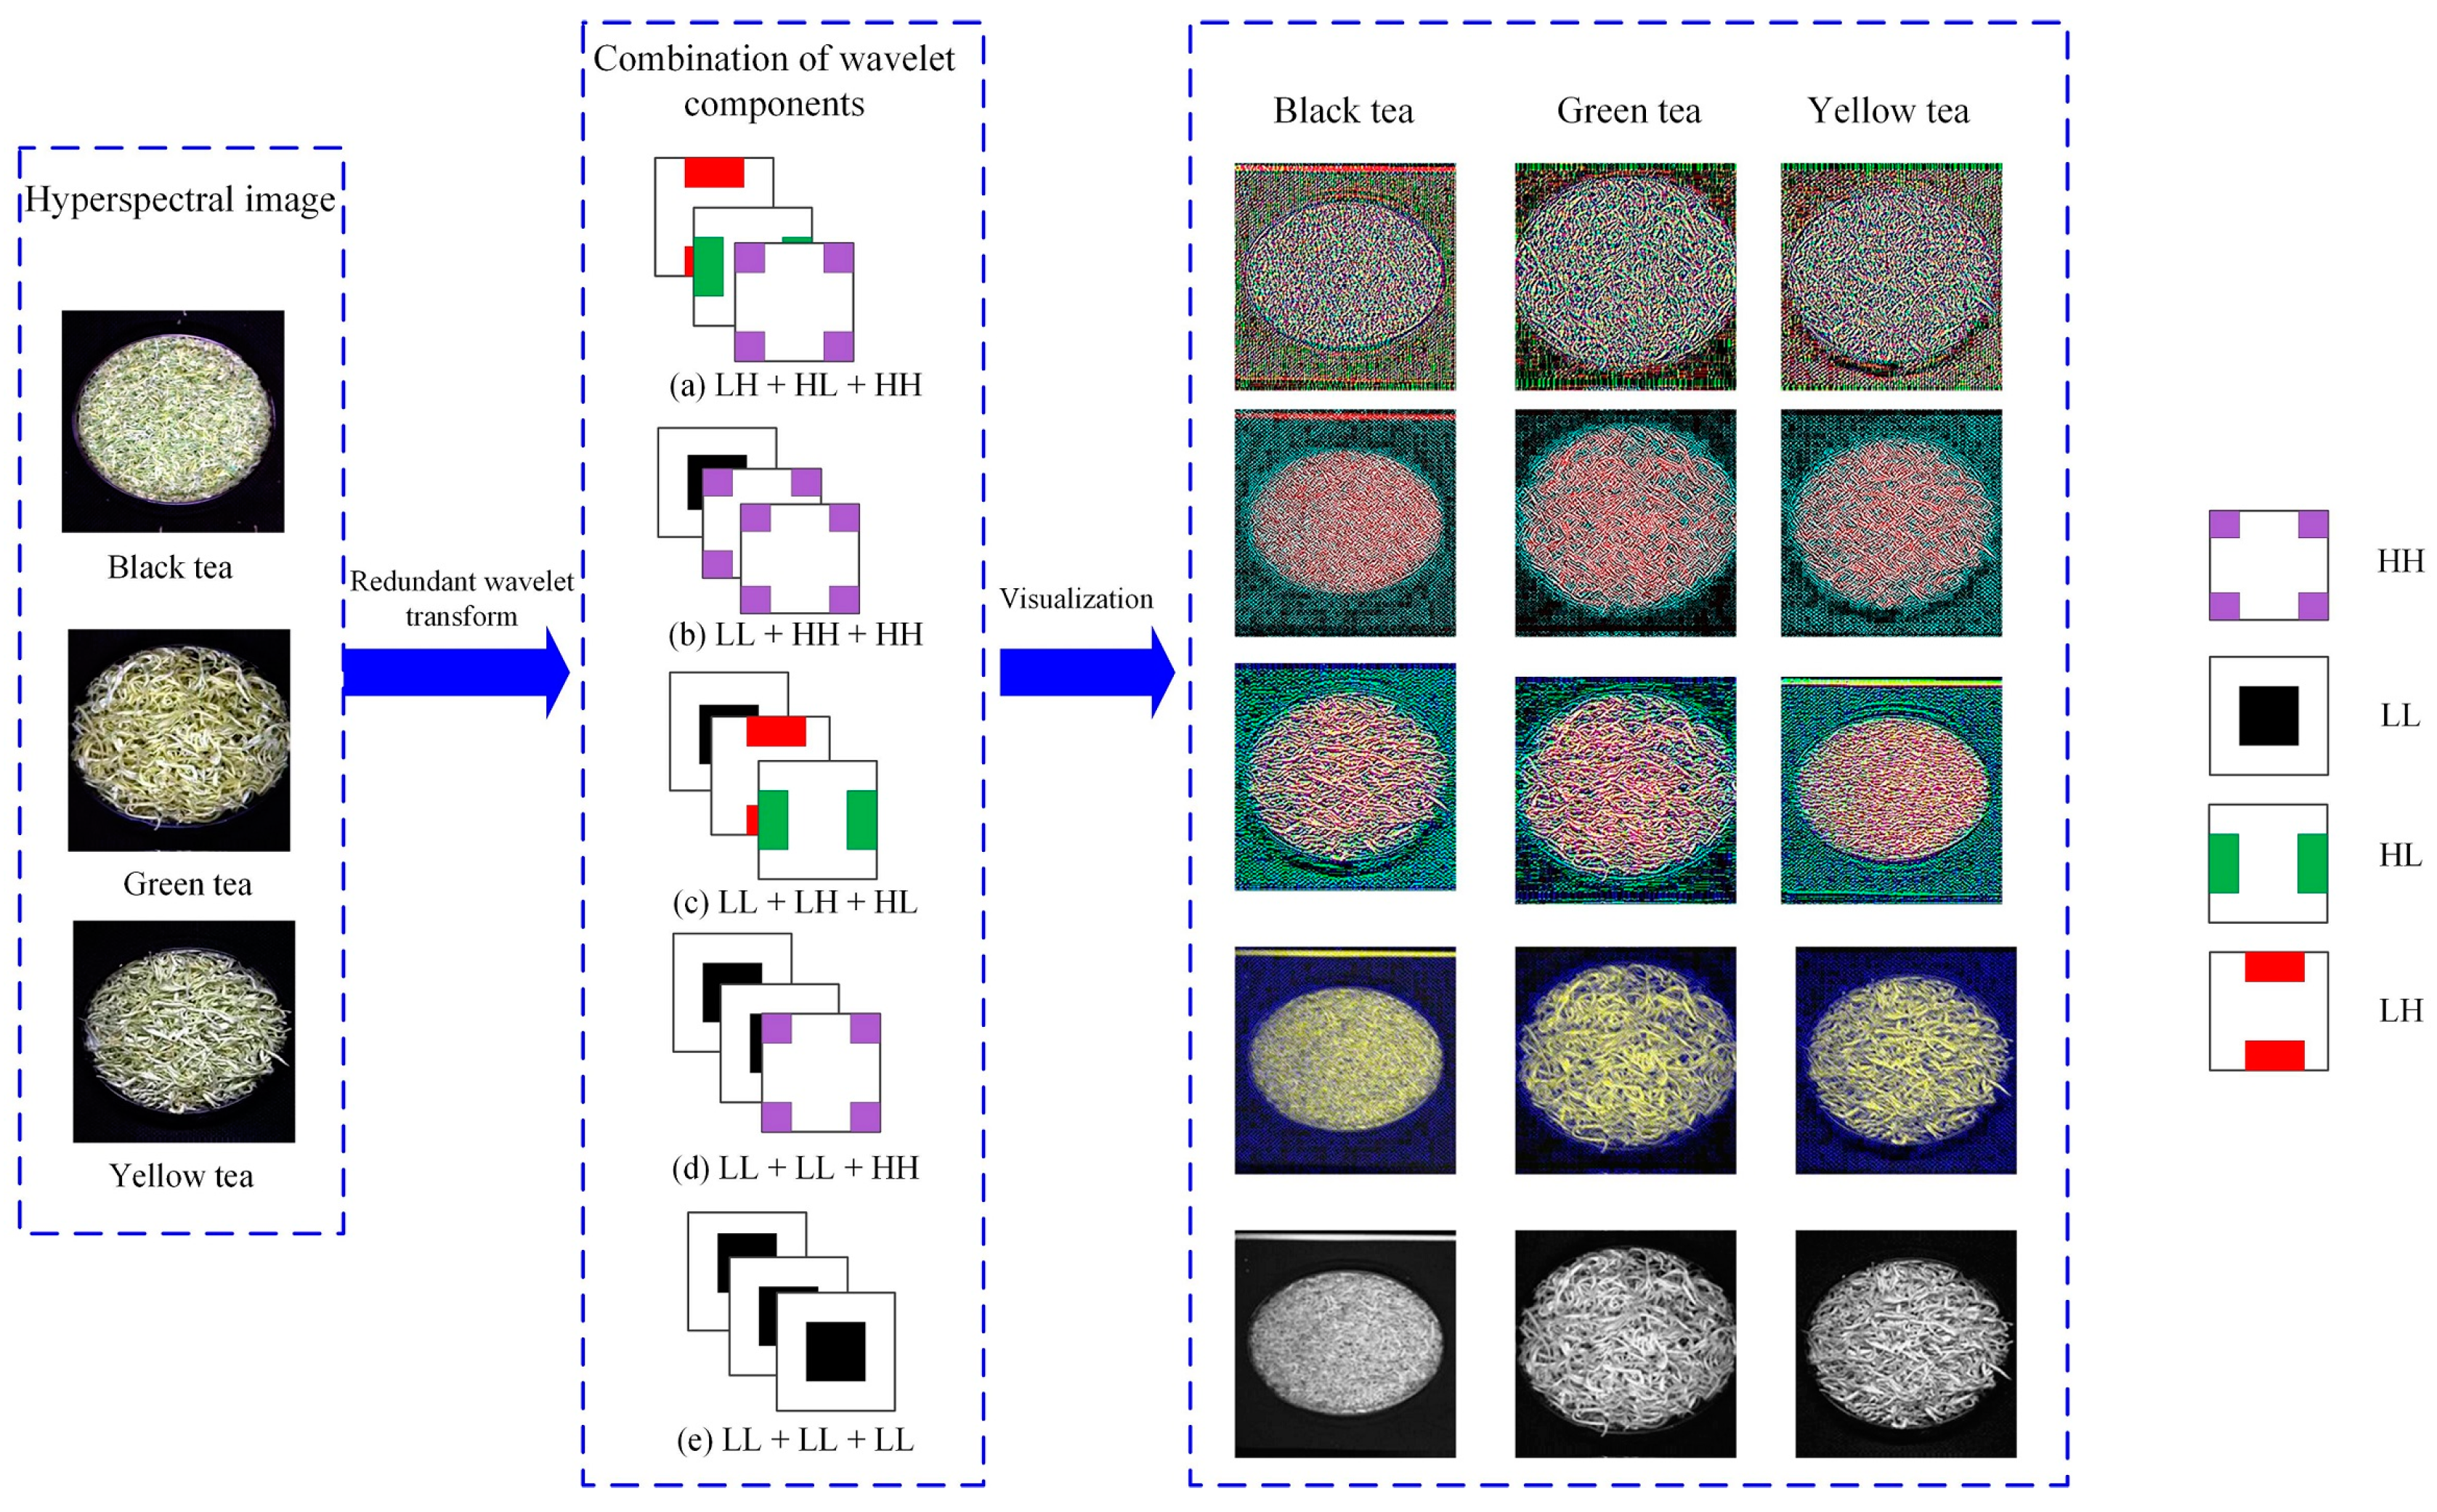
3.2. Multi-Component Combination of Wavelet Decomposition of Hyperspectral Image of Tea

To extract the wavelet coefficient combination information of the hyperspectral image of tea. First, from the full-band hyperspectral image, the wavelet function db2 was used to perform the redundant discrete wavelet transform (RDWT) in the horizontal direction to obtain the high-frequency component and the low-frequency component, then the two components in the vertical direction were respectively performed RDWT. The above process realized the two-dimensional discrete wavelet transform of the hyperspectral image. Therefore, the approximate component LL, the horizontal component HL, the vertical component LH, and the diagonal component HH are obtained from the hyperspectral image of the tea based on the wavelet transform. Three of the four components are selected to form a three-channel data as the input of the L-CNN. According to the results of multiple tests, the five combinations performed well, as shown in Figure 6. Figure 6a shows the combination of the three high-frequency components LH, HL, and HH. Figure 6b shows the combination of the low-frequency component LL and the high-frequency components HH and HH. Figure 6c shows a combination of low-frequency component LL, high-frequency component LH, and HL. Figure 6d shows the combination of two low-frequency components LL and one high-frequency component HH. Figure 6e shows the combination of three low-frequency components LL. From the visualization map corresponding to the five wavelet combinations of the tea hyperspectral image in Figure 6, it could be seen that the features displayed by the different combinations were still significantly different.

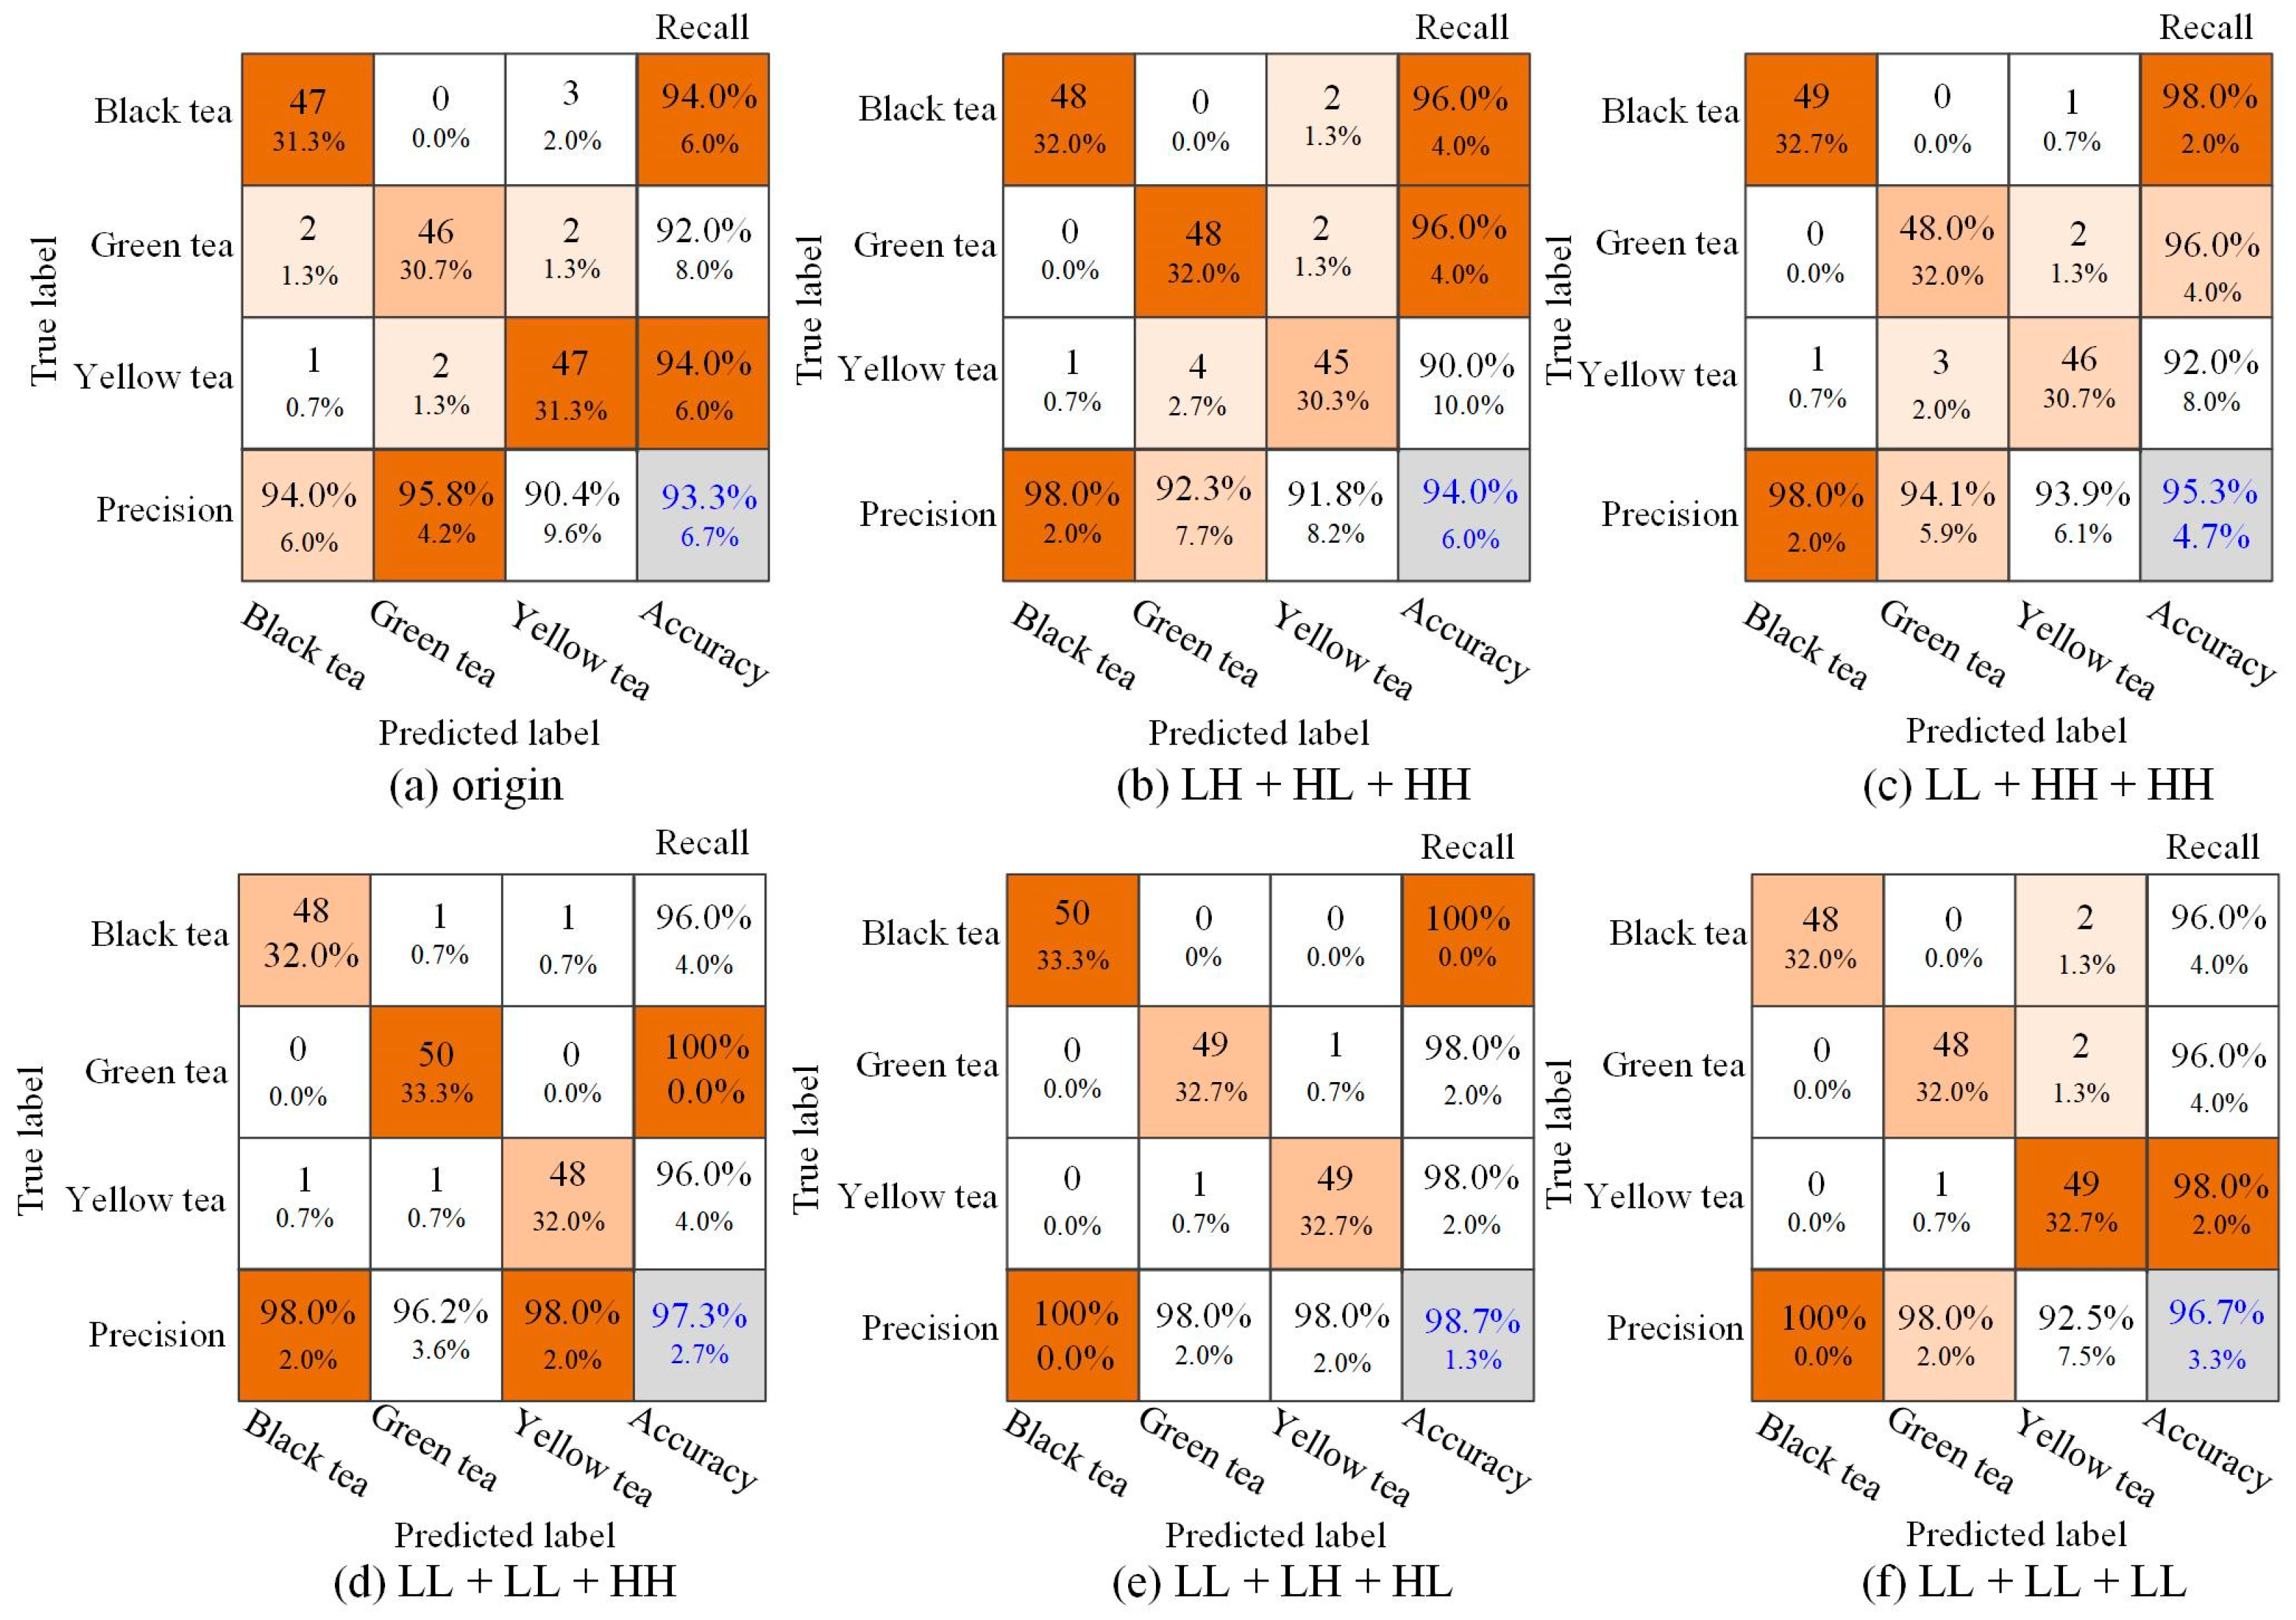
3.3. Tea Classification Results Based on the L-CNN-SVM Model

Different combinations based on wavelet components were used as the input of the three channels of the CNN model, and the classification accuracy is shown in Table 5. It could be seen from Table 5 that the classification accuracy was 0.940–1.000 for black tea, 0.923–0.980 for green tea, and 0.918–0.980 for yellow tea. The classification effect based on the wavelet component was better than that of the original hyperspectral image. Among the five combinations, the classification result based on LL + HL + LH was the best, with an accuracy of 0.987, and only 0.013% of tea samples were misidentified. The possible reason was that the three wavelet components represent wavelet information from different angles, which expanded the expressive ability of tea features. In addition, the contribution of the HH component to tea classification was relatively low.
In addition, the kappa coefficients [40] were obtained by using reconstructed figures based on different wavelet components. It could be seen from Table 5 that the Kappa coefficient based on the LL + HL + LH component was the highest, reaching 0.98, which was 8.2% higher than that of the original hyperspectral image, 7.1% than that of LH + HL + HH, 5.1% than that of LL + HH + HH, 2% than that of LL + LL + HH, and 3.1% than that of LL + LL + LL.
To better display the results of tea classification, the confusion matrix was used to analyze the classification results. In the confusion matrix, the y-axis represented the real tea category, and the x-axis represented the result of the model classification. A total of 150 images were used as tests, including 50 each for black tea, green tea, and yellow tea. As shown in Figure 7, the number of misclassifications of black tea, green tea, and yellow tea using wavelet components did not exceed 5. Black tea, green tea, and yellow tea were misclassified as 3, 4, and 3 for the original hyperspectral image, 2, 3, and 5 for LH + HL + HH, 1, 2, and 4 for LL + HH + HH, 2, 0, and 0 for LL + LL + HH, 0, 1, and 1 for LL + LH + HL, 2, 2, and 1 for LL + LL + LL. It was easy to see that the tea classification results of the CNN model based on the combined information of the wavelet components performed well. Although there were some errors in the identification of individual figures, most of the tea samples were correctly identified.

4. Discussion

4.1. Compare Tea Classification Based on Different Wavelet Component Combinations

Wavelet transform has obvious advantages in local time-frequency analysis. It could decompose the hyperspectral image of tea leaves with non-stationary signals into high-frequency components and low-frequency components. Although Fourier transform or contourlet transform is also a common method in resolution analysis [41], However, Fourier transform lacks time domain processing and has a very bad effect on non-stationary information. In addition, the contour of the image is transformed with more redundancy, which makes it difficult to achieve perfect image reconstruction.
Two-dimensional wavelet transform could be used to characterize the target object in the image [42]. Li et al. used the texture features obtained by wavelet transform to classify the famous green tea in China [43]. Bakhshipour et al. extracted wavelet features to successfully classify black tea [44]. Nevertheless, the above research is limited to shallow features and lacks wavelet semantic features. Wulandari et al. combined wavelet transform and a deep learning model to improve classification accuracy [45], which demonstrated the effectiveness of advanced wavelet semantic features. Therefore, the classification accuracy of this study using the combination of LL + LH + HL is 98.7%, which was 5.4% higher than that of the original hyperspectral image, and was higher than that of LH + HL + HH, LL + HH + HH, LL + LL + HH, and LL + LL + LL with 4.7%, 3.4%, 1.4%, and 2.0%, respectively. It was because LL + LH + HL included comprehensive wavelet information. On the one hand, the interference information was removed after wavelet transform, which could realize the extraction of multi-angle features. On the other hand, multi-angle wavelet features were used to extract high-level semantic features through deep learning models, which was more conducive to tea identification.

4.2. Compare Classification Results Based on Different Deep Learning Models

To evaluate the performance of the tea classification model proposed in this study, our method was compared with the typical classification models AlexNet and MobileNet v2 [46,47]. It could be seen from Table 6 that the classification accuracy based on our proposed method was 5.47% and 1.42% higher than that of AlexNet and MobileNet v2, respectively. In addition, SVM was used to improve the classification addition method. Compared with the classification methods of random forest (RF), K-nearest neighbor (KNN), and adaptive boosting (AdaBoost), the experimental results showed that the classification accuracy of our proposed method was improved by 0.71%, 2.03%, and 2.74% overall. In short, the experiment showed that the combination of SVM and lightweight model improved not only the classification accuracy of the model but also the generalization ability of the model. Therefore, the proposed model had a better classification effect on tea classification.

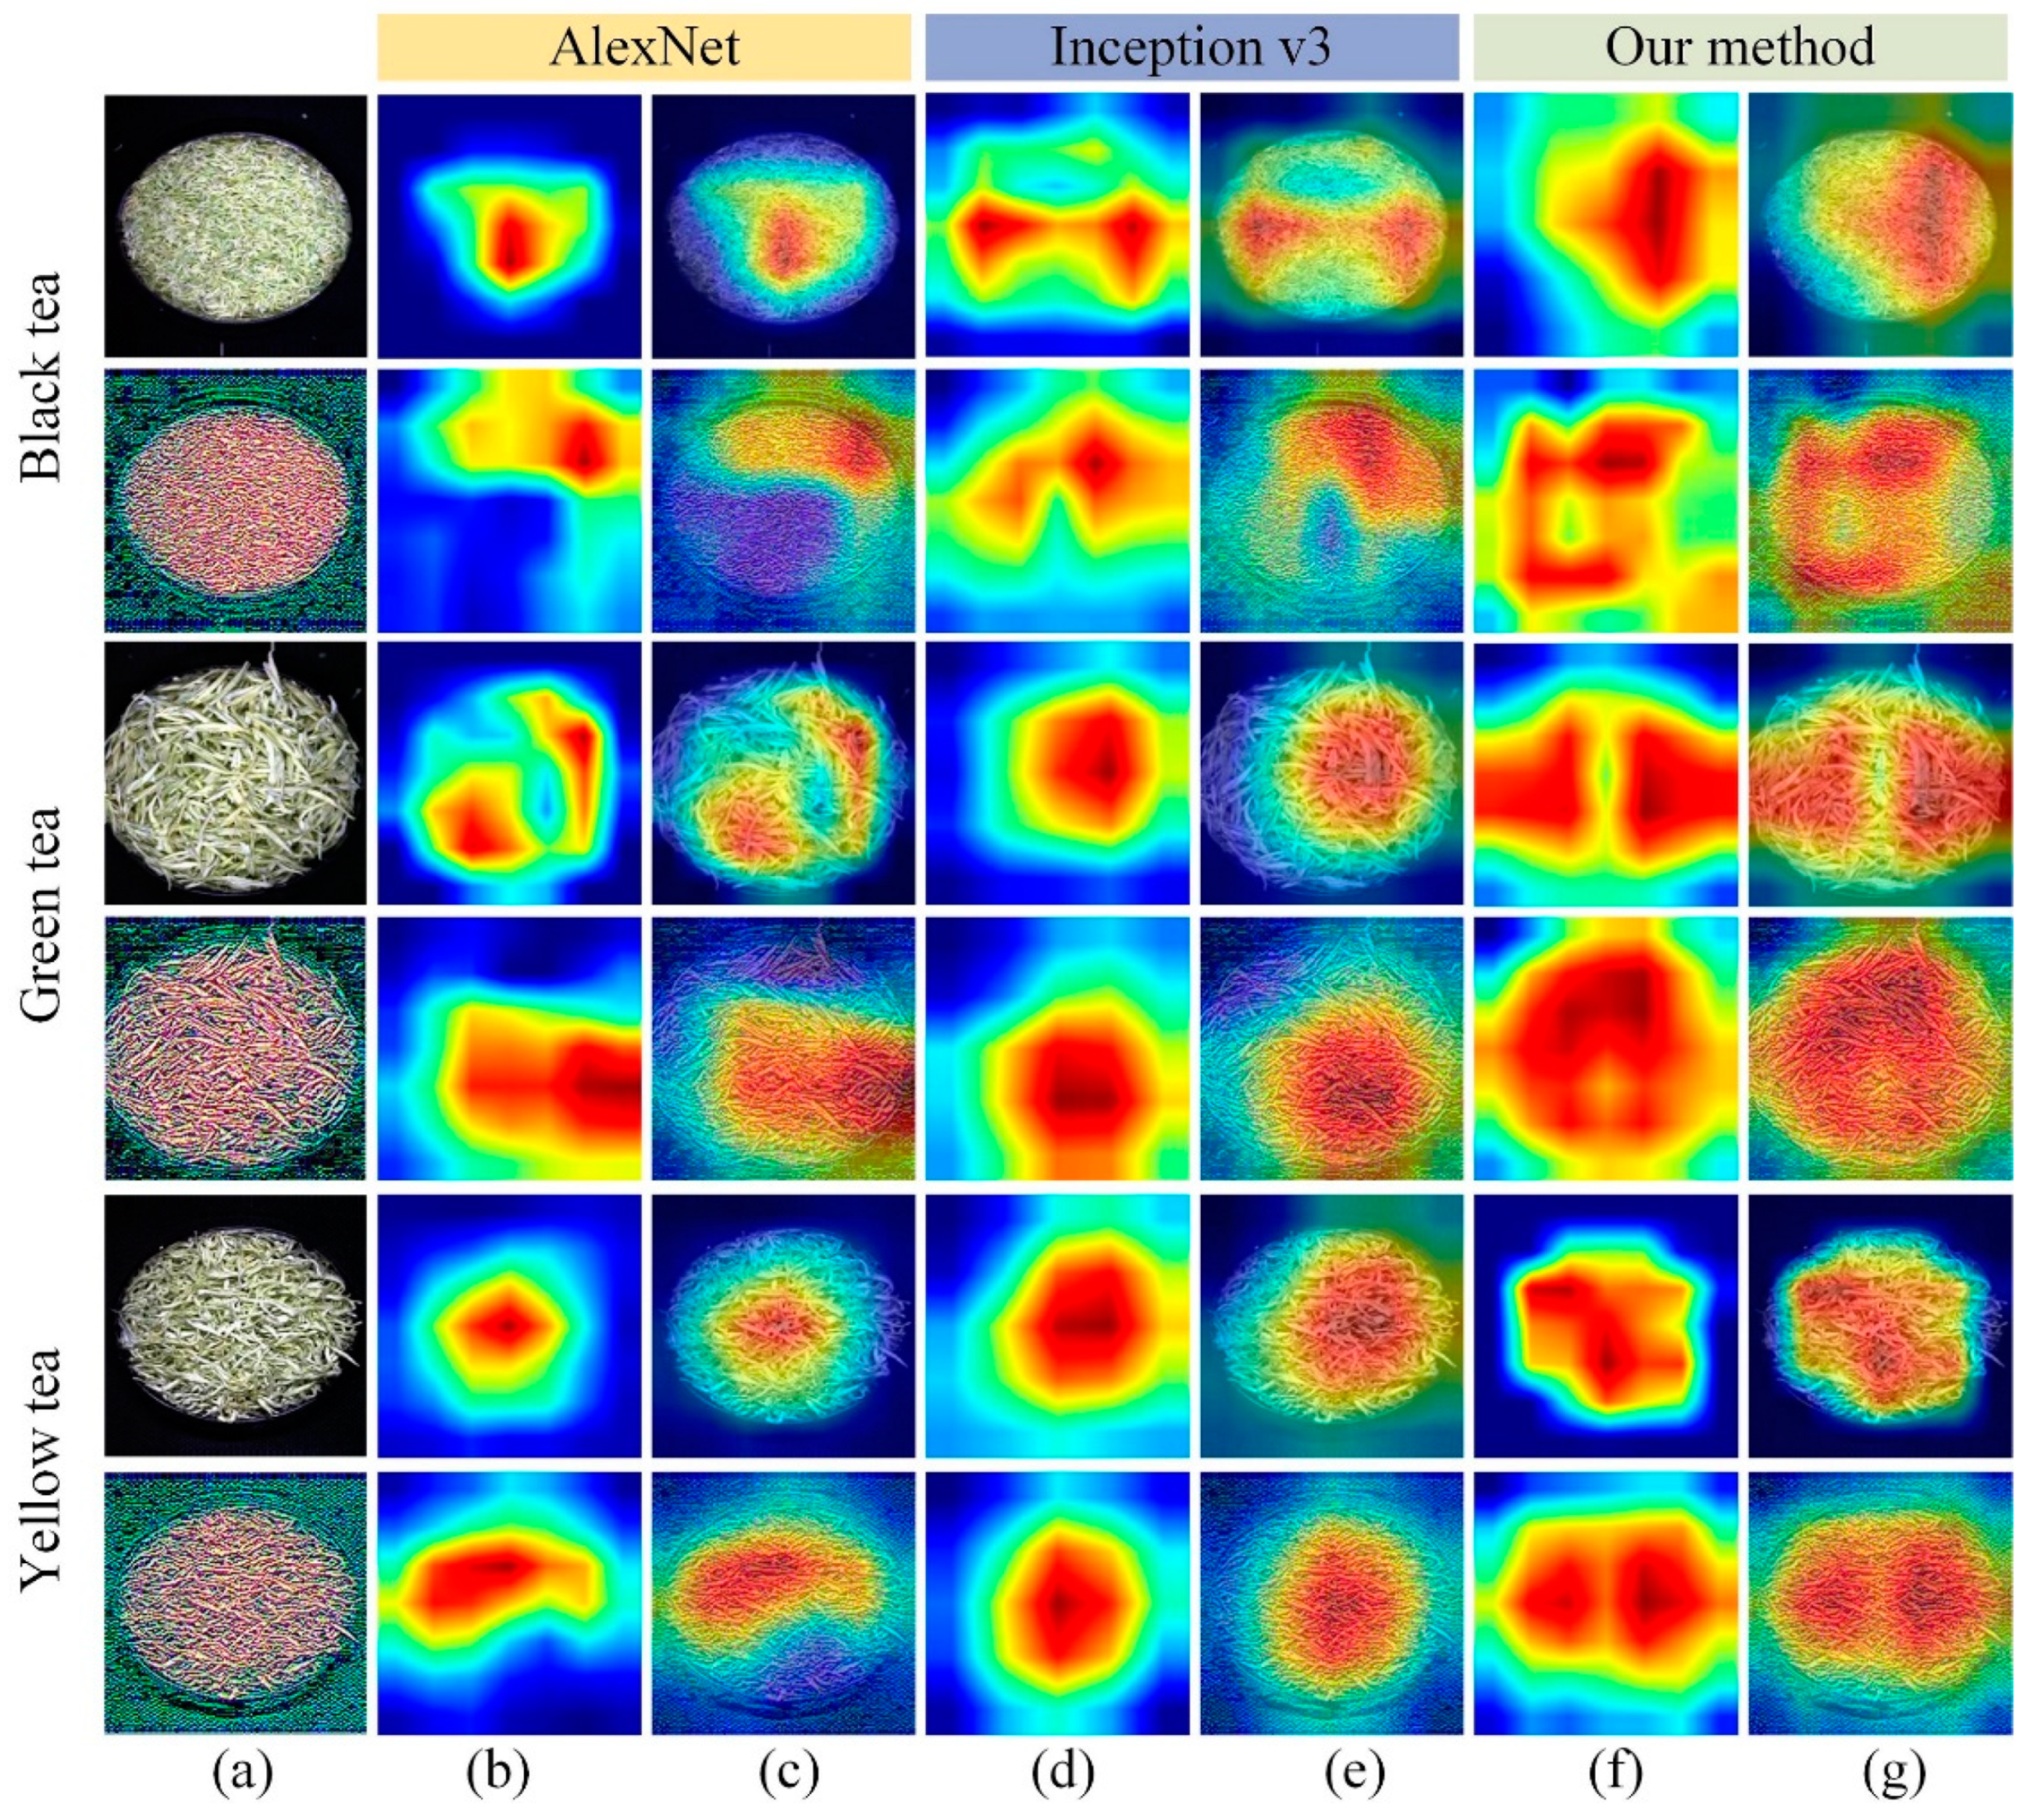
4.3. Different Network Visualization Based on Grad-CAM

To visually show the potential recognition capabilities of different models, a color visualization method was applied: gradient weighted class activation mapping (Grad-CAM) technology, which embedded the Grad-CAM layer into the convolutional neural network, thereby making the proposed method more easily observed and explained. Grad-CAM was used to generate activation heat maps for the classification of different tea samples, as shown in Figure 8. The first, third, and fifth rows of Figure 8a represented the original hyperspectral images of black tea, green tea, and yellow tea, and rows 2, 4, and 6 of Figure 8a represented the combination of wavelet components LL + LH + HL extracted from the hyperspectral images of black tea, green tea, and yellow tea. It could be seen from Figure 8 that the activated regions that are important for the classification result in different input images are different. Among them, the darker the color indicates that the pixel feature of the corresponding position in the original image had a greater impact on the classification result.
From the second, fourth, and sixth rows of Figure 8, it was found that the stronger regions in the activated heatmap of LL+LH+HL for tea identification were wider than those of the original hyperspectral image. In addition, it was found from Figure 8b,d,f that our proposed method for feature positioning in tea identification could stably find the relevant target area. Compared with the activated heatmaps of AlexNet and Inception v3, our method could locate key areas significantly.

5. Conclusions

To improve the accuracy of traditional classification methods for tea based on hyperspectral images, the combined information of different components decomposed by redundant discrete wavelet transform was used to classify based on the lightweight CNN model. The experimental results showed that the combination of wavelet components LL+LH+HL based on the hyperspectral image of tea had the best classification effect, with an accuracy of 98.7%. In conclusion, the method of time-frequency signal decomposition and reconstruction based on hyperspectral images proposed in this study provided a new idea for tea identification, which will provide technical reference for identifying the grade and quality of tea.

Author Contributions

Methodology, B.Y. and B.L.; software, Q.C. and B.L.; data curation, Y.L.; writing, Q.C. and B.Y.; writing—review and editing, B.Y. and J.N. All authors have read and agreed to the published version of the manuscript.

Funding

This work was supported by the Major Science and Technology Projects in Anhui Province (202203a06020007), the Opening Project of Key Laboratory of Power Electronics and Motion Control of Anhui Higher Education Institutions (PEMC2001), the Open Fund of State Key Laboratory of Tea Plant Biology and Utilization (SKLTOF20200116).

Institutional Review Board Statement

Not applicable.

Informed Consent Statement

Not applicable.

Data Availability Statement

The raw data supporting the conclusions of this article will be made available by the authors, without undue reservation.

Conflicts of Interest

All the authors declare no conflict of interest.

References

  1. Sereshti, H.; Samadi, S.; Jalali-Heravi, M. Determination of volatile components of green, black, oolong and white tea by optimized ultrasound-assisted extraction-dispersive liquid–liquid microextraction coupled with gas chromatography. J. Chromatogr. A 2013, 1280, 1–8. [Google Scholar] [CrossRef] [PubMed]
  2. Yohei, S.; Masahito, S. Possible mechanisms of green tea and its constituents against cancer. Molecules 2018, 23, 2284. [Google Scholar]
  3. Kujawska, M.; Ewertowska, M.; Adamska, T.; Jodynis-Liebert, J.; Ignatowicz, E.; Gramza-Michalowska, A. Protective effect of yellow tea extract on N-nitrosodiethylamine-induced liver carcinogenesis. Pharm. Biol. 2016, 54, 1891–1900. [Google Scholar] [CrossRef] [PubMed] [Green Version]
  4. Kujawska, M.; Ewertowska, M.; Ignatowicz, E.; Adamska, T.; Szaefer, H.; Gramza-Michalowska, A.; Jodynis-Liebert, J. Evaluation of safety and antioxidant activity of yellow tea (Camellia sinensis) Extract for Application in Food. J. Med. Food 2016, 19, 330–336. [Google Scholar] [CrossRef]
  5. Adhikary, B.; Yadav, S.K.; Roy, K.; Bandyopadhyay, S.K.; Chattopadhyay, S. Black tea and theaflavins assist healing of indomethacin-induced gastric ulceration in mice by antioxidative action. Evid. Based Complement. Altern. Med. 2011, 8, 546560. [Google Scholar] [CrossRef]
  6. Qin, Z.H.; Pang, X.L.; Dong, C.; Cheng, H.; Hu, X.S.; Wu, J.H. Evaluation of Chinese tea by the electronic nose and gas chromatography–mass spectrometry: Correlation with sensory properties and classification according to grade level. Food Res. Int. 2013, 53, 864–874. [Google Scholar] [CrossRef]
  7. Li, X.L.; Zhang, Y.Y.; He, Y. Study on Detection of Talcum Powder in Green Tea Based on Fourier Transform Infrared (FTIR) Transmission Spectroscopy. Spectrosc. Spectr. Anal. 2017, 37, 1081–1085. [Google Scholar]
  8. Hong, Z.L.; Ze, J.L.; Hua, J.L.; Shu, J.S.; Feng, N.C.; Kai, H.W.; Da, Z.M. Robust Classification of Tea Based on Multi-Channel LED-Induced Fluorescence and a Convolutional Neural Network. Sensors 2019, 19, 4687. [Google Scholar]
  9. Bhattacharya, N.A.; Tudu, B.B.; Jana, A.A.; Ghosh, D.A.; Bandhopadhyaya, R.B.; Bhuyan, M.C. Preemptive identification of optimum fermentation time for black tea using electronic nose. Sens. Actuators B Chem. 2008, 131, 110–116. [Google Scholar] [CrossRef]
  10. Chen, Q.S.; Zhao, J.W.; Chen, Z.; Lin, H.; Zhao, D.A. Discrimination of green tea quality using the electronic nose technique and the human panel test, comparison of linear and nonlinear classification tools. Sens. Actuators B Chem. 2011, 159, 294–300. [Google Scholar] [CrossRef]
  11. Yu, H.C.; Wang, Y.W.; Wang, J. Identification of Tea Storage Times by Linear Discrimination Analysis and Back-Propagation Neural Network Techniques Based on the Eigenvalues of Principal Components Analysis of E-Nose Sensor Signals. Sensors 2009, 9, 8073–8082. [Google Scholar] [CrossRef] [PubMed] [Green Version]
  12. Sinija, V.R.; Mishra, H.N. Fuzzy Analysis of Sensory Data for Quality Evaluation and Ranking of Instant Green Tea Powder and Granules. Food Bioprocess Technol. 2011, 4, 408–416. [Google Scholar] [CrossRef]
  13. Bhattacharyya, N.; Bandyopadhyay, R.; Bhuyan, M.; Tudu, B.; Ghosh, D.; Jana, A. Electronic Nose for Black Tea Classification and Correlation of Measurements with “Tea Taster” Marks. IEEE Trans. Instrum. Meas. 2008, 57, 1313–1321. [Google Scholar] [CrossRef]
  14. Yu, H.C.; Wang, J.; Yao, C.; Zhang, H.M.; Yu, Y. Quality grade identification of green tea using E-nose by CA and ANN. LWT—Food Sci. Technol. 2008, 41, 1268–1273. [Google Scholar] [CrossRef]
  15. Laddi, A.; Prakash, N.R.; Sharma, S.; Kumar, A. Discrimination analysis of Indian tea varieties based upon color under optimum illumination. J. Food Meas. Charact. 2013, 7, 60–65. [Google Scholar] [CrossRef]
  16. Chen, Q.; Zhao, J.; Cai, J. Identification of tea varieties using computer vision. Trans. ASABE 2008, 51, 623–628. [Google Scholar] [CrossRef]
  17. Kelman, T.; Ren, J.C.; Marshall, S. Effective classification of Chinese tea samples in hyperspectral imaging. J. Artif. Intell. Res. 2013, 2, 87. [Google Scholar] [CrossRef] [Green Version]
  18. Zhao, J.W.; Chen, Q.S.; Cai, J.R.; Ouyang, Q. Automated tea quality classification by hyperspectral imaging. Appl. Opt. 2009, 48, 3557–3564. [Google Scholar] [CrossRef]
  19. Tu, Y.X.; Bian, M.; Wan, Y.K.; Fei, T. Tea cultivar classification and biochemical parameter estimation from hyperspectral imagery obtained by UAV. PeerJ 2018, 6, e4858. [Google Scholar] [CrossRef] [Green Version]
  20. Sohara, Y.; Ryu, C.; Suguri, M.; Park, S.B.; Kishino, S. Estimation of catechins concentration of green tea using hyperspectral remote sensing. IFAC Proc. Vol. 2010, 43, 172–177. [Google Scholar] [CrossRef]
  21. Yang, B.H.; Gao, Y.; Li, H.M.; Ye, S.B.; He, H.X.; Xie, S.R. Rapid prediction of yellow tea free amino acids with hyperspectral images. PLoS ONE 2019, 14, e0210084. [Google Scholar] [CrossRef] [PubMed] [Green Version]
  22. Ahmad, H.; Sun, J.; Nirere, A.; Shaheen, N.; Zhou, X.; Yao, K.S. Classification of tea varieties based on fluorescence hyperspectral image technology and ABC-SVM algorithm. J. Food Process. Preserv. 2021, 45, e15241. [Google Scholar] [CrossRef]
  23. Ning, J.M.; Sun, J.J.; Li, S.H.; Sheng, M.G.; Zhang, Z.Z. Classification of five Chinese tea categories with different fermentation degrees using visible and near infrared hyperspectral imaging. Int. J. Food Prop. 2017, 20, 1515–1522. [Google Scholar] [CrossRef] [Green Version]
  24. Sun, J.; Tang, K.; Wu, X.H.; Dai, C.X.; Chen, Y.; Shen, J.F. Nondestructive identification of green tea varieties based on hyperspectral imaging technology. J. Food Process Eng. 2018, 41, e12800. [Google Scholar] [CrossRef]
  25. Yu, Y.J.; Wang, Q.Q.; Wang, B.Y.; Chen, J.; Sun, W.J. Identification of tieguanyin tea grades based on hyperspectral technology. Food Sci. 2014, 35, 159–163. [Google Scholar]
  26. Ge, X.; Sun, J.; Lu, B.; Chen, Q.S.; Xun, W.; Jin, Y.T. Classification of oolong tea varieties based on hyperspectral imaging technology and BOSS-LightGBM model. J. Food Process Eng. 2019, 42, e13289. [Google Scholar] [CrossRef]
  27. Matsuyama, E.; Tsai, D.Y.; Lee, Y.; Tsurumaki, M.; Takahashi, N.; Watanabe, H.; Chen, H.M. A modified undecimated discrete wavelet transform based approach to mammographic image denoising. J. Digit. Imaging 2013, 26, 748–758. [Google Scholar] [CrossRef] [Green Version]
  28. Yang, B.H.; Qi, L.; Wang, M.X.; Hussain, S.; Wang, H.B.; Wang, B.; Ning, J.M. Cross-category tea polyphenols evaluation model based on feature fusion of electronic nose and hyperspectral imagery. Sensors 2020, 20, 50. [Google Scholar] [CrossRef] [Green Version]
  29. Wu, X.; Yang, J.; Wang, S. Tea category identification based on optimal wavelet entropy and weighted k-nearest neighbors algorithm. J. Multimed. Tools Appl. 2018, 77, 3745–3759. [Google Scholar] [CrossRef]
  30. Bakhshipour, A.; Zareiforoush, H.; Bagheri, I. Application of decision trees and fuzzy inference system for quality classification and modeling of black and green tea based on visual features. J. Food Meas. Charact. 2020, 14, 1402–1416. [Google Scholar] [CrossRef]
  31. Borah, S.; Hines, E.; Bhuyan, M. Wavelet transform based image texture analysis for size estimation applied to the sorting of tea granules. J. Food Eng. 2007, 79, 629–639. [Google Scholar] [CrossRef]
  32. Zhang, Y.D.; Muhammad, K.; Tang, C. Twelve-layer deep convolutional neural network with stochastic pooling for tea category classification on GPU platform. J. Multimed. Tools Appl. 2018, 77, 22821–22839. [Google Scholar] [CrossRef]
  33. Hasan, M.M.; Chopin, J.P.; Laga, H.; Miklavcic, S.J. Detection and analysis of wheat spikes using convolutional neural networks. J. Plant Methods 2018, 14, 100. [Google Scholar] [CrossRef] [PubMed] [Green Version]
  34. El-Latif, E.; Taha, A.; Zayed, H.H. A passive approach for detecting image splicing based on deep learning and wavelet transform. J. Arab. J. Sci. Eng. 2020, 45, 3379–3386. [Google Scholar] [CrossRef]
  35. Qi, Z.; Jung, C.; Xie, B. Subband Adaptive Image Deblocking Using Wavelet Based Convolutional Neural Networks. IEEE Access 2021, 9, 62593–62601. [Google Scholar] [CrossRef]
  36. Wang, Z.; Li, X.; Duan, H.; Zhang, X.; Wang, H. Multifocus image fusion using convolutional neural networks in the discrete wavelet transform domain. Multimed. Tools Appl. 2019, 78, 34483–34512. [Google Scholar] [CrossRef]
  37. Masquelin, A.H.; Cheney, N.; Kinsey, C.M.; Bates, J.H.T. Wavelet decomposition facilitates training on small datasets for medical image classification by deep learning. J. Histochem. Cell Biol. 2021, 155, 309–317. [Google Scholar] [CrossRef]
  38. Coffey, M.A.; Etter, D.M. Image coding with the wavelet transform. In Proceedings of the ISCAS’95-International Symposium on Circuits and Systems, Seattle, WA, USA, 30 April–3 May 1995; pp. 1110–1113. [Google Scholar]
  39. Arrais, E.; de Medeiros Valentim, R.A.; Brandão, G.B. Real-time premature ventricular contractions detection based on Redundant Discrete Wavelet Transform. Res. Biomed. Eng. 2018, 34, 187–197. [Google Scholar] [CrossRef]
  40. Borana, S.; Yadav, S. Comparison of model validation techniques for land cover dynamics in Jodhpur City. Int. J. Emerg. Trends Technol. Comput. Sci. 2017, 6, 215–219. [Google Scholar]
  41. Zhao, J.; Jiang, H.; Di, J. Recording and reconstruction of a color holographic image by using digital lensless fourier transform holography. Opt. Express 2008, 16, 2514–2519. [Google Scholar] [CrossRef]
  42. Lee, M.C.; Pun, C.M. Texture Classification Using Dominant Wavelet Packet Energy Features. In Proceedings of the 4th IEEE Southwest Symposium on Image Analysis and Interpretation, Austin, TX, USA, 2–4 April 2000; pp. 301–304. [Google Scholar]
  43. Li, X.L.; Nie, P.C.; Qiu, Z.J.; He, Y. Using wavelet transform and multi-class least square support vector machine in multi-spectral imaging classification of Chinese famous tea. Expert Syst. Appl. 2011, 38, 11149–11159. [Google Scholar] [CrossRef]
  44. Bakhshipour, A.; Sanaeifar, A.; Payman, S.H.; Guardia, M. Evaluation of data mining strategies for classification of black tea based on image-based features. Food Anal. Methods 2018, 11, 1041–1050. [Google Scholar] [CrossRef]
  45. Wulandari, M.; Basari; Gunawan, D. Evaluation of wavelet transform preprocessing with deep learning aimed at palm vein recognition application. AIP Conf. Proc. 2019, 2139, 050005. [Google Scholar]
  46. Krizhevsky, A.; Sutskever, I.; Hinton, G.E. ImageNet classification with deep convolutional neural networks. Adv. Neural Inf. Process. Syst. 2012, 25, 1097–1105. [Google Scholar] [CrossRef]
  47. Kim, H.; Chung, Y. Improved Handwritten Hangeul Recognition using Deep Learning based on GoogLenet. J. Korea Contents Assoc. 2018, 18, 495–502. [Google Scholar]
Figure 1. The structure diagram of hyperspectral imaging system.
Agriculture 12 01085 g001
Figure 2. The optimized lightweight CNN.
Agriculture 12 01085 g002
Figure 3. The technology roadmap for this study.
Agriculture 12 01085 g003
Figure 4. Hyperspectral images of three tea categories including black tea, green tea, and yellow tea.
Agriculture 12 01085 g004
Figure 5. Hyperspectral images of three tea categories including black tea, green tea, and yellow tea.
Agriculture 12 01085 g005
Figure 6. Combinations of different wavelet components.
Agriculture 12 01085 g006
Figure 7. Confusion matrix of tea classification based on different components.
Agriculture 12 01085 g007
Figure 8. Samples visualization based on Grad-CAM. (a) represents the original hyperspectral image and wavelet component LL+LH+HL; (b,d,f) represent the activation heatmaps of tea sample recognition based on the AlexNet model, Inception v3 and our proposed method; (c,e,g) represent the activated heatmaps superimposed on the original image of tea sample recognition based on the AlexNet model, Inception v3 and our proposed method.
Agriculture 12 01085 g008
Table 1. Geographical sources of tea.
Tea CategoryTea VarietyAbbreviations NumberGeographical Origins
Black teaQMBT from ACBTACBT30Anhui
QMBT from XLBTXLBT30Anhui
QMBT from GXBTGXBT30Anhui
QMBT from QMQHQMQH30Anhui
QMBT from HSBTHSBT30Anhui
Green tea Maofeng from ZYYMFZYYMF30Anhui
Maofeng from ZWMFZWMF30Anhui
Maofeng from YJYMFYJYMF30Anhui
Maofeng from GMMFGMMF30Anhui
Liuan GuapianLAGP30Anhui
Yellow teaJunshan YinzhenJSYZ30Hunan
Huoshan HuangyaHSHY30Anhui
Mengding HuangyaMDHY30Sichuan
Mogan HuangyaMGHY30Zhejiang
Pingyang HuangtangPYHT30Zhejiang
Table 2. Detailed parameters of each layer of CNN (Origin).
InputOperatorChannelNStrideOut
224 × 224 × 3conv2d3212112 × 112 × 32
112 × 112 × 32bottleneck1611112 × 112 × 16
112 × 112 × 16bottleneck242256 × 56 × 24
56 × 56 × 24bottleneck323228 × 28 × 32
28 × 28 × 32bottleneck644214 × 14 × 64
14 × 14 × 64bottleneck963114 × 14 × 96
14 × 14 × 96bottleneck160327 × 7 × 160
7 × 7 × 160bottleneck320117 × 7 × 320
7 × 7 × 320conv2d1280117 × 7 × 1280
7 × 7 × 1280avgpool-1-1 × 1 × 1280
1 × 1 × 1280conv2d3111 × 1 × 3
1 × 1 × 3softmax31-3
N: represents the number of repetitions of the Operator.
Table 3. Detailed parameters of improved lightweight CNN.
InputOperatorChannelNStrideOut
224 × 224 × 3conv2d3212112 × 112 × 32
112 × 112 × 32bottleneck1611112 × 112 × 16
112 × 112 × 16bottleneck242256 × 56 × 24
56 × 56 × 24bottleneck323228 × 28 × 32
28 × 28 × 32bottleneck644214 × 14 × 64
14 × 14 × 64bottleneck963114 × 14 × 96
14 × 14 × 96bottleneck160327 × 7 × 160
7 × 7 × 160bottleneck320117 × 7 × 320
7 × 7 × 320conv2d128117 × 7 × 128
7 × 7 × 128flatten62721-1 × 1 × 6272
1 × 1 × 6272SVM31-3
N: represents the number of repetitions of the Operator.
Table 4. Parameters of the experimental environment.
Settings Parameters
CPUIntel (R) Core (TM) i7-8700 CPU @ 3.20G Hz
GPUNVIDIA GeForce GTX 1070 Ti
RAM16.0 GB
Operating systemWin 10_64 bit
MATLAB versionMATLAB R2019a
Lab environmentDeep Learning Toolbox
Table 5. The accuracy of tea classification based on the combination of different wavelet components.
Input DataKappa CoefficientOverallBlack TeaGreen TeaYellow Tea
Original 0.900.9330.9400.9580.904
LH + HL + HH0.910.9400.9800.9230.918
LL + HH + HH0.930.9530.9800.9410.939
LL + LL + HH0.960.9730.9800.9620.980
LL + HL + LH0.980.9871.0000.9800.980
LL + LL + LL0.950.9671.0000.9800.925
Table 6. Comparison of classification accuracy of different methods.
Method OverallBlack TeaGreen TeaYellow Tea
Our method0.9871.0000.9800.980
MobileNet v2 + RF0.9800.9800.9800.980
MobileNet v2 + KNN0.9670.9600.9800.960
MobileNet v2 + AdaBoost0.9600.9600.9400.980
MobileNet v20.9731.0000.9600.960
AlexNet0.9330.9601.0000.860
Publisher’s Note: MDPI stays neutral with regard to jurisdictional claims in published maps and institutional affiliations.

