
A Feeding Quantity Monitoring System for a Combine Harvester: Design and Experiment
by
 ,
,
Tao Jiang
1,2, 
Zhuohuai Guan
1,2,3,*,
Haitong Li
1,2,
Senlin Mu
1,2,
Chongyou Wu
1,2,
Min Zhang
1,2,
Gang Wang
1,2 and
Xu Chen
1,2 1
Nanjing Institute of Agriculture Mechanization, Ministry of Agriculture and Rural Affairs, Nanjing 210014, China
2
Key Laboratory of Modern Agricultural Equipment, Ministry of Agriculture and Rural Affairs, Nanjing 210014, China
3
World Precise Machinery (China) Co., Ltd., World Industrial Park, Danyang, Zhenjiang 212311, China
*
Author to whom correspondence should be addressed.
Agriculture 2022, 12(2), 153; https://doi.org/10.3390/agriculture12020153
Submission received: 20 December 2021
/
Revised: 15 January 2022
/
Accepted: 18 January 2022
/
Published: 22 January 2022
(This article belongs to the Special Issue Innovations and Practices of Agricultural Green Mechanized Production Technology)
Abstract
:Due to the commitment to the target of green mechanized production and precision agriculture, the operating parameters of the main functional components of a combine harvester need to be adjusted according to the feeding quantity. Therefore, feeding quantity monitoring is one of the key technologies of intelligent control for a combine harvester. In order to obtain the accurate information of feeding quantity in the harvesting operation process in real time, a monitoring system was set up to obtain the accurate information of feeding quantity in real time. The torque signal corresponding to different feeding quantity was obtained through bench calibration experiments. The signal was decomposed, noise reduced, and reconstructed through the analysis of the frequency range of the noise based on the wavelet transform. A fitting relationship between the torque and the feeding quantity was obtained. Field validation experiment results showed good consistency of the measured data and the actual quantity. This paper provides a theoretical basis and technical reference for subsequent research on intelligent control of combine harvesters.
1. Introduction
The combine harvester is an important piece of agricultural equipment for green mechanized production and efficient harvesting of crops. The feeding quantity is one of the core indicators of the operating capacity of a combine harvester and is an important basis for designing, optimizing, and controlling the operating parameters of the main functional components of the harvester [1,2,3]. To achieve efficient and high-quality harvesting, the operating parameters of the combine harvester must be in line with the feed quantity. However, due to variations in crop density, moisture content, maturity, header height, and forward speed of the harvester, the feed quantity of the harvester always fluctuates [4], and the parameters of the main functional components must be adjusted according to the instantaneous feeding quantity [5,6,7,8]. Nevertheless, due to the late start of intelligent monitoring technology for domestic agricultural machinery in China, research for feeding quantity monitoring is still in the exploratory stage. Thus, it is not yet possible to accurately control the operating parameters of main components of the harvester by monitoring the feeding quantity. The parameters of the header and the threshing and cleaning system cannot be adjusted or optimized appropriately; this reduces the operating efficiency and increases harvesting loss. This has become a key bottleneck for intelligent and high-efficiency harvesting. Therefore, it is necessary and significant to establish a feeding-quantity-monitoring system and realize automatic feeding-quantity control for a combine harvester [9,10,11,12].
Scholars in China have focused on determining the feeding quantity of a combine harvester. Through a bench test, Chen et al. [13] obtained a regression equation between the feeding quantity and the corresponding torque by measuring the torque of the threshing drum feeding the active shaft. Tang et al. [14] analyzed the threshing power consumption of the longitudinal flow threshing and separating device by recording the threshing power consumption of the cutting flow drum, feeding wheel, and longitudinal flow drum, and deduced the relationship between the feeding quantity and the net threshing power consumption of the longitudinal flow drum. Liang et al. [15] determined the relationship between the feeding quantity and grain flow rate, longitudinal flow drum torque, and rotational speed through monitoring and analysis. Lu et al. [16] obtained the relationship between the feeding quantity and the oil pressure of the hydraulic drive system of the threshing drum through a bench test. You et al. [17] used an oil pressure sensor to detect the feeding quantity and established a feed quantity model based on the relationship between the drum torque and travel speed. Zhao et al. [18] used a thin-film sensor to measure the change in the force on the side of the drum top cover due to feed-quantity variations, by conducting a bench test; a relationship was also established.
In all the aforementioned studies, the threshing drum of the combine harvester was considered as the research object. The feeding-quantity variations were monitored based on the changes in the drum torque during threshing. However, the grain requires a certain time to enter the threshing device after passing through the auger and conveyor trough after the cutting process. Hence, a considerable time lag exists in the monitoring of the torque variation of the threshing device for regulating the feeding amount. Thus, intelligent regulation of the combine harvester cannot be achieved. Some studies adopted special torque sensors that require broken shafts, which are inconvenient to install during actual machine measurement. In addition, significant measurement errors result from the high noise interference during signal acquisition in actual production operations, and from the limitations of the fitting model for the data under the selected function category.
This study was conducted to construct a feeding quantity monitoring system based on the force variation of the power-input shaft of the screw conveyor. The purpose was to obtain the feeding quantity in real time through information technology and guide the driver to complete the operation more effectively. This enables the combine harvester to achieve the best working performance and the best harvesting condition, and also lays the foundation for the subsequent improvement of the intelligent control of combine harvesters.
2. Materials and Methods
2.1. Feeding Quantity Measurement Principle
During the operation of the combine harvester, the material entering the header moves backward to the conveyor and the threshing and cleaning components under the squeezing and pushing from the screw conveyor. The force on the screw conveyor is predominantly due to the frictional resistance of the material to the conveying blades; this frictional resistance is proportional to the positive squeezing pressure between the material and the blades. Referring to the research of other scholars [19], the squeezing pressure is expressed as
where Fr is the squeezing pressure, K and n are the constant coefficients, B is the natural spreading thickness of a certain volume of crop, s is the gap between the conveyor blade and the worm shell bottom plate, q is the feeding volume, ρ is the crop density, v is the material moving speed, L is the width of the header.
The integrated friction coefficient between the material and the conveyor blade is denoted as f. Combining Equations (1) and (2), the moment of the frictional resistance to the conveyor from the material is
where Tr is the resistance moment, R is the radius of rotation of the spiral blade, f is the integrated friction coefficient.
During harvesting, when the crop and screw conveyor are in constant motion, the power transmitted from the engine to the screw conveyor is mainly consumed by the frictional resistance moment from the crop.
2.2. Signal Acquisition Method
According to the mechanics of materials, when the shaft is twisted, the shaft surface is in a state of pure shear stress, and the maximum shear stress τ is
where γ is the shear strain; τ is the shear stress; G is the measured axis transverse elasticity coefficient.
The surface shear strain of the shaft is proportional to the torque of the shaft load, and the shear stress is balanced by the torque being carried; it is calculated as
where ωt is the torsional section factor
The section modulus of the solid shaft under torsion is
where d is the diameter of the measured axis.
The maximum tensile and compressive stresses σ are equal along the two directions inclined at 45° to the shaft. The maximum value is equal to the maximum shear stress on the surface of the shaft, and the relationship between the strain ε and σ in this direction is
where ε is the measured strain; E is the longitudinal elasticity coefficient of the measured axis; ν is the Poisson’s ratio.
After substitution,
A bonded strain gauge was used to measure the strain along the line inclined 45° to the torsion shaft. A special torsion strain gauge was attached to the power-input shaft to create a strain bridge. A regulated power supply was provided to the strain bridge as the excitation source. When the shaft was twisted, the resistance of the strain bridge changed, resulting in a change in the voltage at the experiment end. Then, the data-acquisition circuit transmitted the changes in the electrical signal to the processing circuit, where the signal-processing section extracted and amplified the analog signal of the sensor and performed analog-digital conversion.
Because the bridge power input and the detected strain signal output of the strain bridge on the rotating body must be transferred between the rotating shaft and the stationary frame, the usual practice is to use conductive slip rings. Nevertheless, these rings provide friction contact, unavoidably leading to wear and heat generation. Hence, the rotational speed of the rotating shaft and the service life of the conductive slip ring are limited. Moreover, unreliable contact can easily cause signal fluctuations, resulting in large measurement errors or even unsuccessful measurements.
We used wireless telemetry to transmit the collected signals to a computer. The reception and processing of the signal were completed through this process. Figure 1 shows the signal-acquisition process.
2.3. Overall Structure of the Monitoring System
As demonstrated in Figure 2, the system consists mainly of a sensor unit, a wireless-transmission unit, a data-processing unit, and a display terminal.
The sensor unit includes a strain-gauge-type sensor and a Hall-effect rotation speed sensor. To eliminate the effect of the bending moment on the shaft, a Wheatstone full-bridge circuit was adopted to convert the variation in the strain-gauge resistance to a voltage change for measurement, as shown in Figure 3.
A special 45° single half-bridge strain gauge, 350-3HA (11), with a strain resistance of 350 Ω was employed. It is usually used in pairs to form a strain gauge group, as shown in Figure 4. Thus, a Wheatstone full-bridge circuit can be built with two strain gauge group, with one set fixed on the measured shaft and the other fixed on the symmetric side of the shaft (radial 180°), as shown in Figure 5.
The data processing unit includes a data-acquisition circuit, an amplifier circuit, and an A/D conversion circuit.
The wireless-transmission unit consisted of a wireless transmitter module and remote terminal hardware, as shown in Figure 6. Based on the IEEE 802.15.4 protocol, the collected signals were sent to the data-test system of the computer and were output to the display terminal.
In this system, the strain bridge was powered by a 6F22 battery. The battery, along with the data-acquisition and wireless-transmitter modules, was fixed to the shaft under test and rotated with it. The final arrangement of the system is shown in Figure 7.
2.4. Bench Calibration Experiment
To establish the relationship between the torque measured by the system and the actual feeding quantity, the telemetry system was calibrated by manually spreading the material and feeding it into the header through a conveyor belt. The experiment was conducted on 7 November 2021, at Hongqi Farm, Taizhou city (Jiangsu province, China). The experiment material was japonica rice “Nangeng 9108”, with an average plant height of 85 cm, average seed yield of 1.88 kg/m−2, and moisture content of 18%.
The total length of the conveyor belt was 6 m, and the conveying line speed was set as 1 m·s−1. The material was weighed in groups according to the trial scheme. A length of 1 m was left free near the end of the header when the material was laid manually to accelerate the conveyor belt to the set line speed; the remaining 5 m was evenly laid with the material. Each group of feeding experiments was repeated three times, and the experiment data are shown in Table 1.
3. Results of Signal Analysis
3.1. System Characterization
To experimentally examine the stability of the signal-acquisition process, the signal acquisition was conducted in the stationary state of the harvester. The sampling frequency was set to 500 Hz, and the torque variation was recorded, as shown in Figure 8. No obvious zero-point drift was observed in the signal acquired by the system, and the standard deviation (σ) for different groups of torque signal data was calculated to be 0.058; this indicates that the system performed effective static acquisition.
3.2. Noise Analysis of No-Load Signal
Considerable vibration is generated during the operation of the combine harvester. Hence, the signals collected through the system usually contain noise, the main sources of which include torsional vibrations and bending moments of the driveshaft and vibrations of the engine and other components [18]. The signals collected during the operation of the combine harvester must be analyzed to determine the distribution of the main noise.
After starting the harvester and increasing the throttle to the normal operating level, signal acquisition was performed once the operation became stable. Subsequently, a fast Fourier transform was conducted on the acquired signal to obtain the frequency-domain information, as shown in Figure 9.
When the combine harvester was running under no load, the torque signal had the highest amplitude frequency in the frequency domain, i.e., the noise frequency was around 16 Hz.
3.3. Analysis of Load Signal
The signal acquisition under load was performed after the frequency distribution of the noise had been determined.
The experiment was started after the speed of each operating component of the combine harvester had been raised to the level for normal harvesting operation. The conveyor belt started to feed the material while the signal was collected, and the power-input shaft speed was recorded for two of the experiments, as shown in Figure 10.
Figure 10 illustrates that before the material was fed, the measured shaft speed reached 487 r/min−1 in both sets of trials, indicating stable operation of the harvester. After material feeding, the measured shaft speed became lower than that under no-load operation. The reductions were different under different feeding quantity, and the variations remained consistent.
The frequency domain information shown in Figure 11 was obtained via fast Fourier transform of the torque signals from these two sets of trials.
As seen in Figure 11, the signal frequency with the highest amplitude in both sets of trials was around 16 Hz, but fluctuations were observed in the signal amplitudes below and above this frequency. Thus, because a fast Fourier transform would completely discard information about the signal information in the time domain, it was impossible to determine the signal frequency variation in the time domain, i.e., it was not possible to determine the change in signal frequency when the material was fed. This led to inaccurate determination of the desired signal distribution range and an inability to filter the signal for noise reduction.
3.4. Time-Frequency Analysis, Filtering, and Denoising of Signal
To address the aforementioned problems, WT was used to analyze the signal to ensure that the variation in the signal frequency could be analyzed in the time domain.
As shown in Figure 12, from the beginning to the end of data acquisition, a set of steady signals with frequency around 16 Hz was observed. The experiment began after 12 s of data acquisition, and the material was fed into the auger of the header. Initially, a set of lower-frequency signals appeared, and they disappeared at the end of material feeding.
According to the foregoing analysis, the noise signal frequency was mainly distributed around 16 Hz, and the signal frequency resulting from the changes in the feeding quantity was significantly lower than the aforementioned value. Hence, the value of 16 Hz can be considered as the cutoff frequency for the signal-filtering process.
Noise reduction is necessary because the original signal contains excessive noise. A db-4 wavelet basis was employed to decompose the original signal at six levels. Figure 13 shows the original signal and the decomposed signal at each level.
The decomposed signal was denoised and reconstructed using fixed-threshold estimation and a hard thresholding function. The comparison of the signals before and after noise reduction is shown in Figure 14.
The torque value after noise reduction was averaged to 24.46 N·m, which was used as the final measurement for this group of trials. The same treatment was applied to the remaining groups of trials to establish the basis for the fitting of the relationship between the feeding quantity and torque.
3.5. Fitting of Feed Quantity–Torque Relationship
Based on the results of data processing for each group of trials mentioned in Section 3.4, the results of fitting the feeding quantity–strain relationship using PLSR and SVM were compared to identify the optimal method for determining the feeding quantity based on the measured torque.
In the SVM fitting method, the data sample set was assumed to be , where is the n-dimensional input vector, is the objective value, and N denotes the number of samples. Then, the objective function is as follows:
The constraints are
where , w is the weight vector of the classification hyperplane, and are nonnegative relaxation variables, Φ(xi) is a nonlinear function that maps the input vector to the higher space, b is the penalty factor; and ε is the insensitive loss function parameter.
Both C and ε are user-determined parameters that have a significant impact on the generalization ability of SVM. The final decision function is obtained based on duality theory:
where and are bound by the penalty factor C, and their corresponding points are called support vectors. Usually, the number of support vectors is smaller than the number of training samples. denotes the symmetric kernel function that satisfies the Mercer condition. We used the Gaussian kernel function in this study:
where σ is the kernel function parameter.
The generalization ability of SVM is influenced by two parameters—the penalty factor C and the kernel function parameter σ. The larger the value of C, the less tolerant the model is to errors. In addition, the model is more prone to overfitting with a larger C. Conversely, the smaller the value of C, the easier it is to underfitting the model. A larger σ corresponds to a smaller number of support vectors and vice versa. Therefore, a comprehensive optimization search is necessary for these two influencing factors.
In this study, we adopted the grid division method and used the minimum mean square error of cross-validation (MSECV) as the evaluation index to find the optimal combination of C and σ. The results of the grid-partitioning search are shown in Figure 15. The optimal C, σ2, and MSECV were 1024, 0.03125, and 0.082732, respectively.
The fitting result of the torque-feeding quantity relationship based on PLSR is demonstrated in Figure 16a. The fitting result based on SVM and the parameter optimization is shown in Figure 16b.
The determination coefficient (R2), average deviation, and root-mean-square deviation were used as the evaluation indicators to compare the fitting results of the two methods.
Table 2 indicates that SVM is more suitable for fitting the feeding quantity–torque relationship.
When the feeding quantity was lower than 3.5 kg·s−1, small changes were observed in the torque measured by the system with an increase in the feeding quantity. The underlying reason is that the feeding quantity for the harvester used in this study was set to 6 kg·s−1. Under a low feeding quantity, the material was less squeezed by the screw conveyor and the volute bottom plate during transportation. Therefore, the resistance moment of the power input shaft was small and exhibited minimal variation. The input shaft torque displayed essentially a linear growth trend with an increase in the feeding quantity. At the designed feeding quantity, the material feeding in the screw conveyor reached saturation. Hence, a further increase in feeding quantity caused accumulation of material. Moreover, the reaction force on the screw conveyor increased, leading to a significant increase in the power-input-shaft torque.
4. Field Experiment
To verify the correctness and adaptability of the established feeding quantity–torque fitting relationship for actual harvesting, a field validation experiment was conducted. The crop species and each characteristic parameter was kept consistent with those in the bench experiment.
The combine harvester feeding quantity is mainly influenced by the forward speed, cut width, grain-to-grass ratio, and seed yield. It is calculated as
where m is crop biomass per unit area, kg·m−2; l is the cutting width; vc is the combine harvester forward speed.
q = mlvc
The conditions and some parameters in the field trial are as follows: The crop biomass per unit area remained the same for each group of trial, and the harvester travelled 15 m for each group. All crops were harvested at full width, with the stubble height being 0.4 m. The total fed biomass in each group was 54 kg based on actual manual measurements.
To ensure uniformity of feeding during each trial, the harvester was kept moving at a uniform speed during each experiment. Furthermore, to assess the stability of the system, the forward speed for each group of trial was not limited, and the completion time for each group of trials was recorded. The actual feeding quantity per second was calculated based on the total amount and time of feeding. The field experiment site is shown in Figure 17.
The input-shaft torque signals collected during each experiment were filtered and denoised using the method described previously. The feeding quantity was predicted using SVM, and the deviations from the actual feeding quantity were calculated, as shown in Table 3. Each group of experiments was repeated three times, and the average value was recorded.
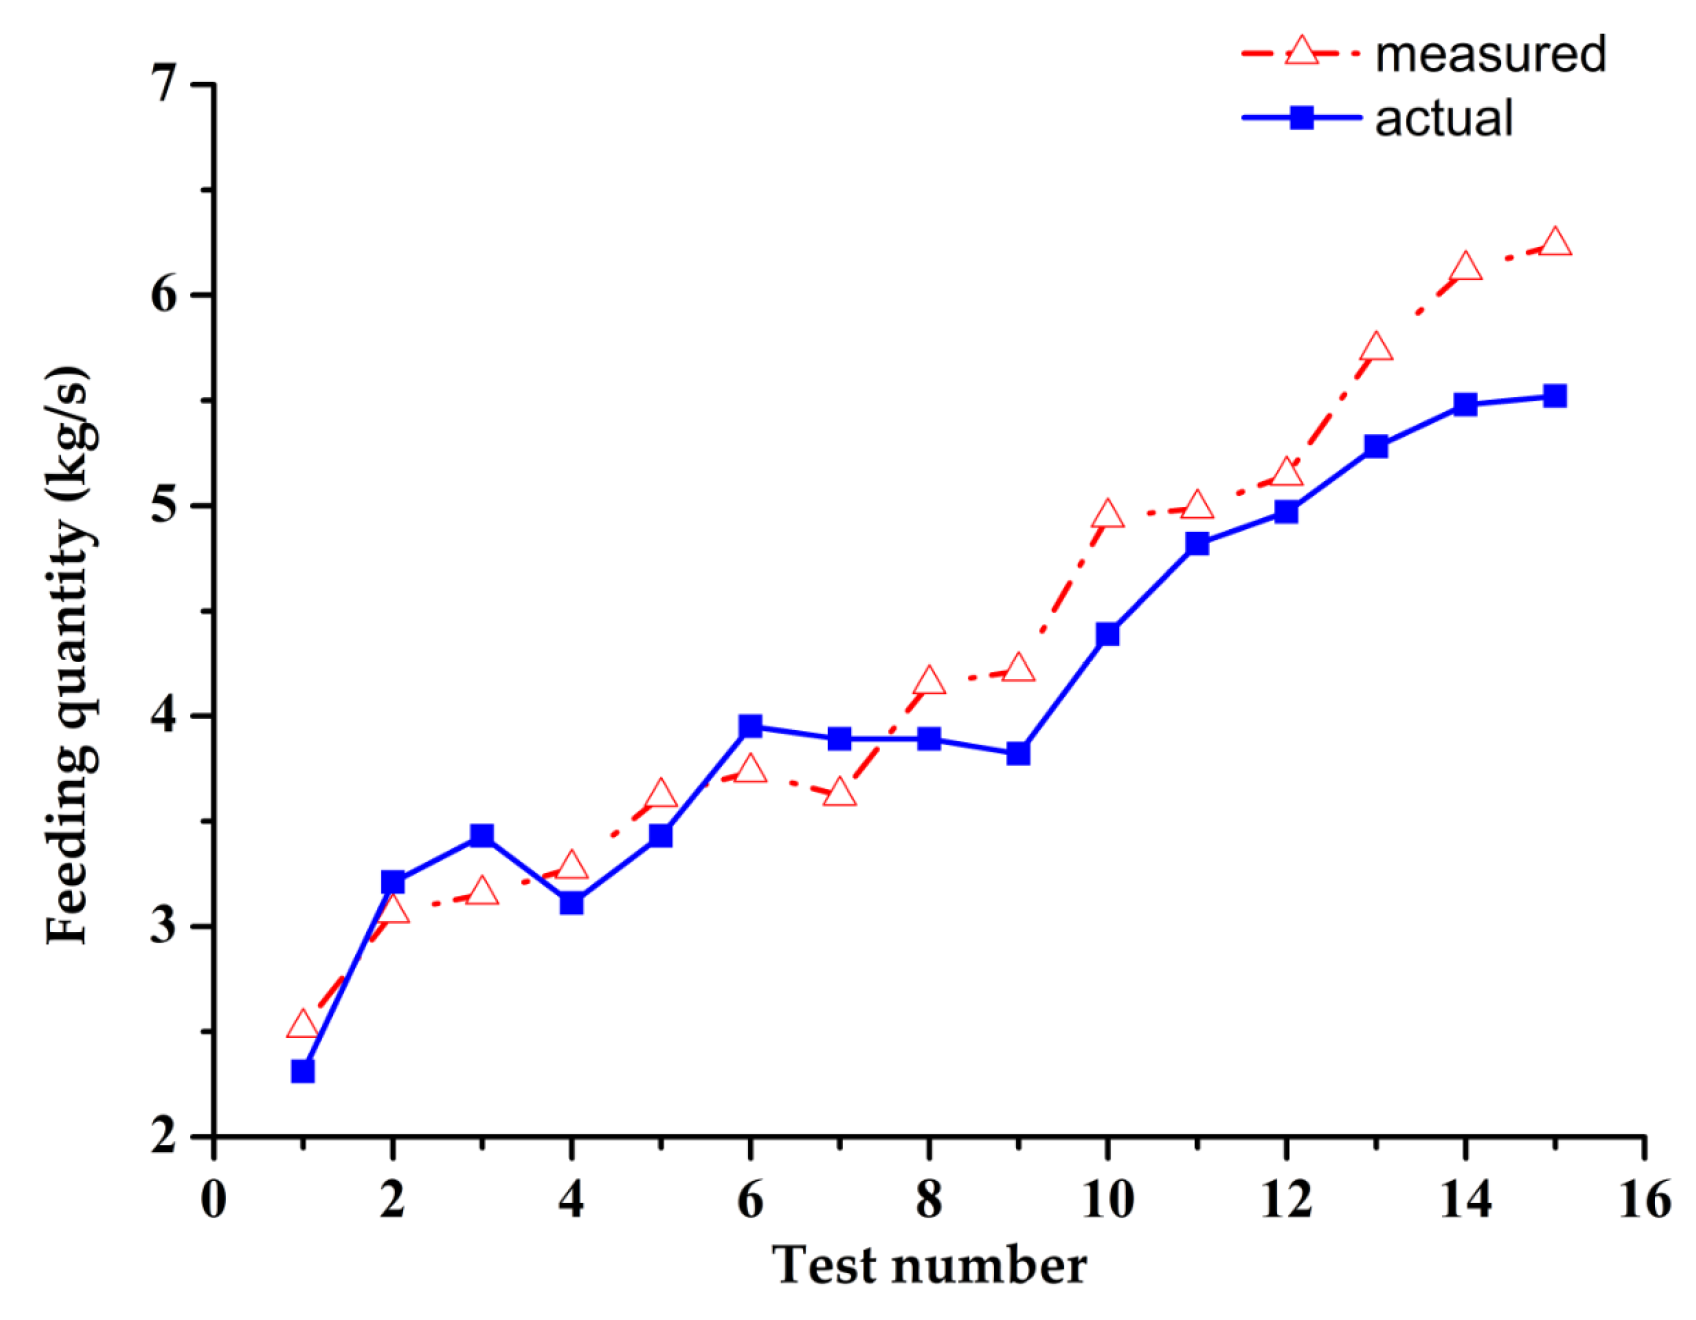
The comparison of the measured and the actual feeding quantities is shown in Figure 18.
5. Discussion
From the results of the field trials, the variation in the feeding quantity measured by the system was consistent with that in the feeding-quantity data collected from the bench experiments and the actual conditions. Additionally, the deviation in the feeding quantity measured by the system was lower than that reported in previous studies (30%) [22], which indicates that the system and data processing method used in this study for monitoring feeding-quantity variations is relatively accurate and stable.
The reasons for the discrepancy between the results of the feeding quantity measured by the system and the actual feeding quantity in the field experiment are that the design of the filtering method in the data processing was determined through bench experiment trials. When the harvester was running under no load, the signals collected during the bench experiments were different from those collected during the field operation. The actual operating conditions were more complex, and thus, the data measured by the system also has more complicated noise signals; this affected the final filtered torque data. In addition, the uniformity of crop growth and differences in the consistency of the harvester operator in each group of trials may also have impacted the data. The results also reflected that some improvement needed to be made in the system design and data processing; this will be the most important part of work in the future research.
6. Conclusions
This paper addresses the practical problem of feeding-quantity monitoring needs of a combine harvester, and an online monitoring system for measuring the feeding quantity based on the force variation of the power input shaft was constructed. Wavelet transform and support vector machine methods were used to improve the accuracy of signal processing and reduce the error of the relationship between the torque and the feeding quantity. The field validation experiment results showed that the established model can calculate the feeding quantity accurately and the system has the ability to quickly adapt to changes in feeding quantity. This indicates that there is certain applicability and stability of the system for feeding quantity monitoring in the actual operation and it can meet the needs of crop combine harvesting.
As an important operating indicator of the combine harvester, the feeding quantity affects the operating performance. A reliable monitoring system to obtain accurate information of the feeding quantity provides the driver with an intuitive understanding of the harvest performance during operation. It improves the efficiency of the combine harvester and effectively reduces the header and drum blockage caused by excessive feeding quantity. It also provides the basis for adjusting the operating parameters of other major working components, and is a key factor in promoting the overall intelligent closed-loop control of the combine harvester.
Author Contributions
Conceptualization, T.J. and Z.G.; methodology, T.J.; software, T.J.; validation, H.L., S.M., G.W. and X.C.; writing—original draft preparation, T.J.; supervision, M.Z. and C.W. All authors have read and agreed to the published version of the manuscript.
Funding
This research was funded by Key Research Program & Technology Innovation Program of Chinese Academy of Agricultural Sciences (grant No. CAAS-ZDRW202105) and China Agriculture Research System of MOF and MARA (grant No. CARS-12).
Institutional Review Board Statement
Not applicable.
Informed Consent Statement
Not applicable.
Data Availability Statement
The data presented in this study are available on request from the authors.
Acknowledgments
The authors thank the editor and anonymous reviewers for providing helpful suggestions for improving the quality of this manuscript.
Conflicts of Interest
The authors declare no conflict of interest.
References
- Chen, D.; Wang, S.M.; Kang, F.; Zhu, Q.Y.; Li, X.H. Mathematical model of feeding rate and processing loss for combine harvester. Trans. Chin. Soc. Agric. Eng. 2011, 27, 18–21. [Google Scholar]
- Jie, Z.; Chen, J.X.; Liu, H.J. Research on fuzzy control of random feed quantity of GPS combine. Trans. Chin. Soc. Agric. Mach. 2006, 37, 55–58. [Google Scholar]
- Wang, S.Y.; Hu, Z.C.; Yao, L.J.; Peng, B.L.; Wang, B.; Wang, Y.W. Simulation and parameter optimization of pickup device for full-feed peanut combine harvester. Comput. Electron. Agric. 2022, 192, 106602. [Google Scholar] [CrossRef]
- Zhang, Y.W.; Chen, D.; Yin, Y.X.; Wang, X.; Wang, S.M. Experimental Study of Feed Rate Related Factors of Combine Harvester Based on Grey Correlation. In Proceedings of the 6th IFAC Conference on Bio-Robotics, Beijing, China, 13–15 July 2018; Volume 51, pp. 402–407. [Google Scholar]
- Miu, P.I. Modeling and simulation of grain threshing and separation in axial threshing units, part II, application to tangential feeding. Comput. Electron. Agric. 2008, 60, 105–109. [Google Scholar] [CrossRef]
- Chai, X.Y.; Zhou, Y.; Xu, L.Z.; Li, Y.; Li, Y.M.; Lv, L.Y. Effect of guide strips on the distribution of threshed outputs and cleaning losses for a tangential-longitudinal flow rice combine harvester. Biosyst. Eng. 2020, 198, 223–234. [Google Scholar] [CrossRef]
- Jie, Z.; Luo, S.B.; Zhou, X.J. LabVIEW-based telemetering experiments of rice feed quantity for combined harvester. Trans. Chin. Soc. Agric. Eng. 2009, 25, 87–91. [Google Scholar]
- Wang, W.W.; Li, J.C.; Chen, L.Q.; Liang, X.T. Effects of key parameters of straw chopping device on qualified rate, non-uniformity and power consumption. Int. J. Agric. Biol. Eng. 2018, 11, 122–128. [Google Scholar] [CrossRef]
- Li, Y.M.; Wang, J.P.; Xu, L.Z.; Tang, Z.; Xu, Z.H.; Wang, K.J. Design and experiment on adjusting mechanism of concave clearance of combine harvester cylinder. Trans. Chin. Soc. Agric. Mach. 2018, 49, 68–75. [Google Scholar]
- Chen, J.; Ning, X.B.; Li, Y.M.; Yang, G.J.; Wu, P. Fuzzy adaptive control system of forward speed for combine harvester based on model reference. Trans. Chin. Soc. Agric. Mach. 2014, 45, 87–91. [Google Scholar]
- Ning, X.B.; Chen, J.; Li, Y.M.; Wang, K.; Wang, Y.F. Kinetic model of combine harvester threshing system and simulation and experiment of speed control. Trans. Chin. Soc. Agric. Eng. 2015, 31, 25–34. [Google Scholar]
- Wei, X.H.; Li, Y.M.; Chen, J.; Song, S.P.; Gu, J.; Zuo, Z.Y.; Ni, J. System integration of working process intelligent monitoring and controlling devices for combine harvester. Trans. Chin. Soc. Agric. Eng. 2009, 25, 56–60. [Google Scholar]
- Chen, J.; Li, Y.M.; Ji, B.B. Study on measurement method of combine feed quantity. Trans. Chin. Soc. Agric. Mach. 2006, 12, 76–78. [Google Scholar]
- Tang, Z.; Li, Y.M.; Xu, L.Z.; Pang, J.; Li, H.C. Experimental study on wheat feed rate of tangential-axial combine harvester. Trans. Chin. Soc. Agric. Eng. 2012, 28, 26–31. [Google Scholar]
- Liang, X.X.; Chen, Z.; Zhang, X.C.; Wei, L.G.; Li, W. Design and experiment of on-line monitoring system for feed quantity of combine harvester. Trans. Chin. Soc. Agric. Mach. 2013, 44, 1–6. [Google Scholar]
- Lu, W.T.; Deng, Z.G.; Zhang, D.X.; Gao, H.T.; You, H.Y. Combine feed rate modeling research. J. Agric. Mech. Res. 2013, 35, 129–132. [Google Scholar]
- You, H.Y.; Lu, W.T. Fuzzy control system for feed quantity of combine harvester. J. Northwest AF Univ. (Nat. Sci. Ed.) 2015, 43, 229–234. [Google Scholar]
- Zhao, S.H.; Zhang, G.Z.; Zhang, S.J.; Fu, J.W.; Mohamed, A. Designing a real-time feed measurement system for horizontal axial flow threshing drum based on thin film sensor. J. Huazhong Agric. Univ. 2020, 39, 160–169. [Google Scholar]
- Huynh, V.M.; Powell, T.; Siddall, J.N. Threshing and separating process-a mathematical model. Trans. Am. Soc. Agric. Biol. Eng. 1982, 20, 65–73. [Google Scholar] [CrossRef]
- Wang, S.Y.; Hu, Z.C.; Wu, F.; Yu, Z.Y.; Cao, M.Z.; Gao, X.M. Modeling and experiment of feeding rate for full-feed peanut pickup harvester. Trans. Chin. Soc. Agric. Eng. 2019, 35, 29–36. [Google Scholar]
- Liu, Y.Y.; Liu, H.; Yin, Y.X.; An, X.F. Feeding assessment method for combine harvester based on power measurement. J. China Agric. Univ. 2017, 22, 157–163. [Google Scholar]
- Zhang, Z.Q.; Sun, Y.F.; Liu, R.J.; Zhang, M.; Li, H.; Li, M.Z. Design and test of feed rate monitoring system for combine harvester. Trans. Chin. Soc. Agric. Mach. 2019, 50, 85–92. [Google Scholar]
Figure 1.
Signal acquisition process.

Figure 2.
Overall system structure.
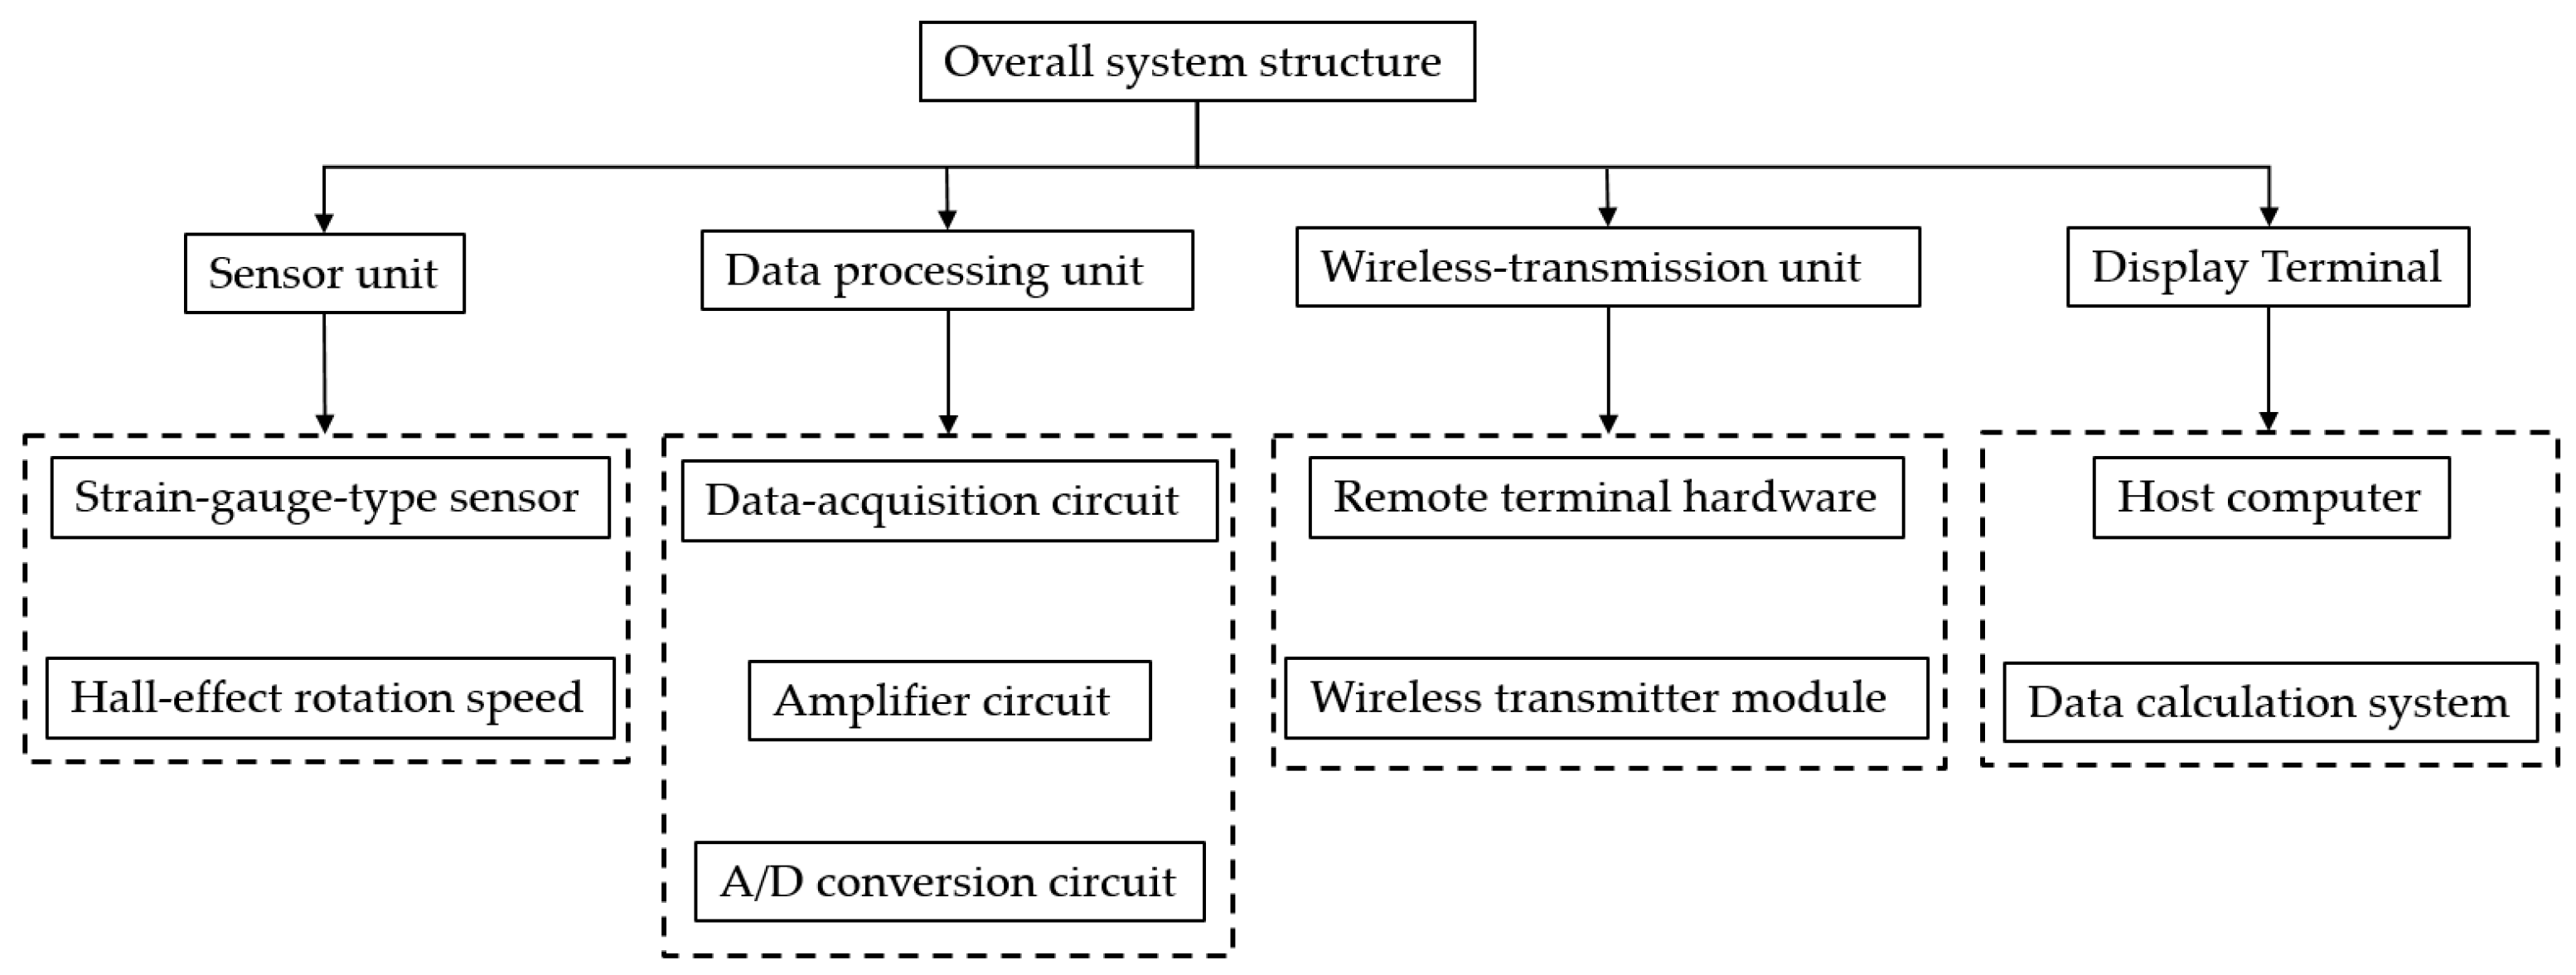
Figure 3.
Wheatstone bridge circuit.
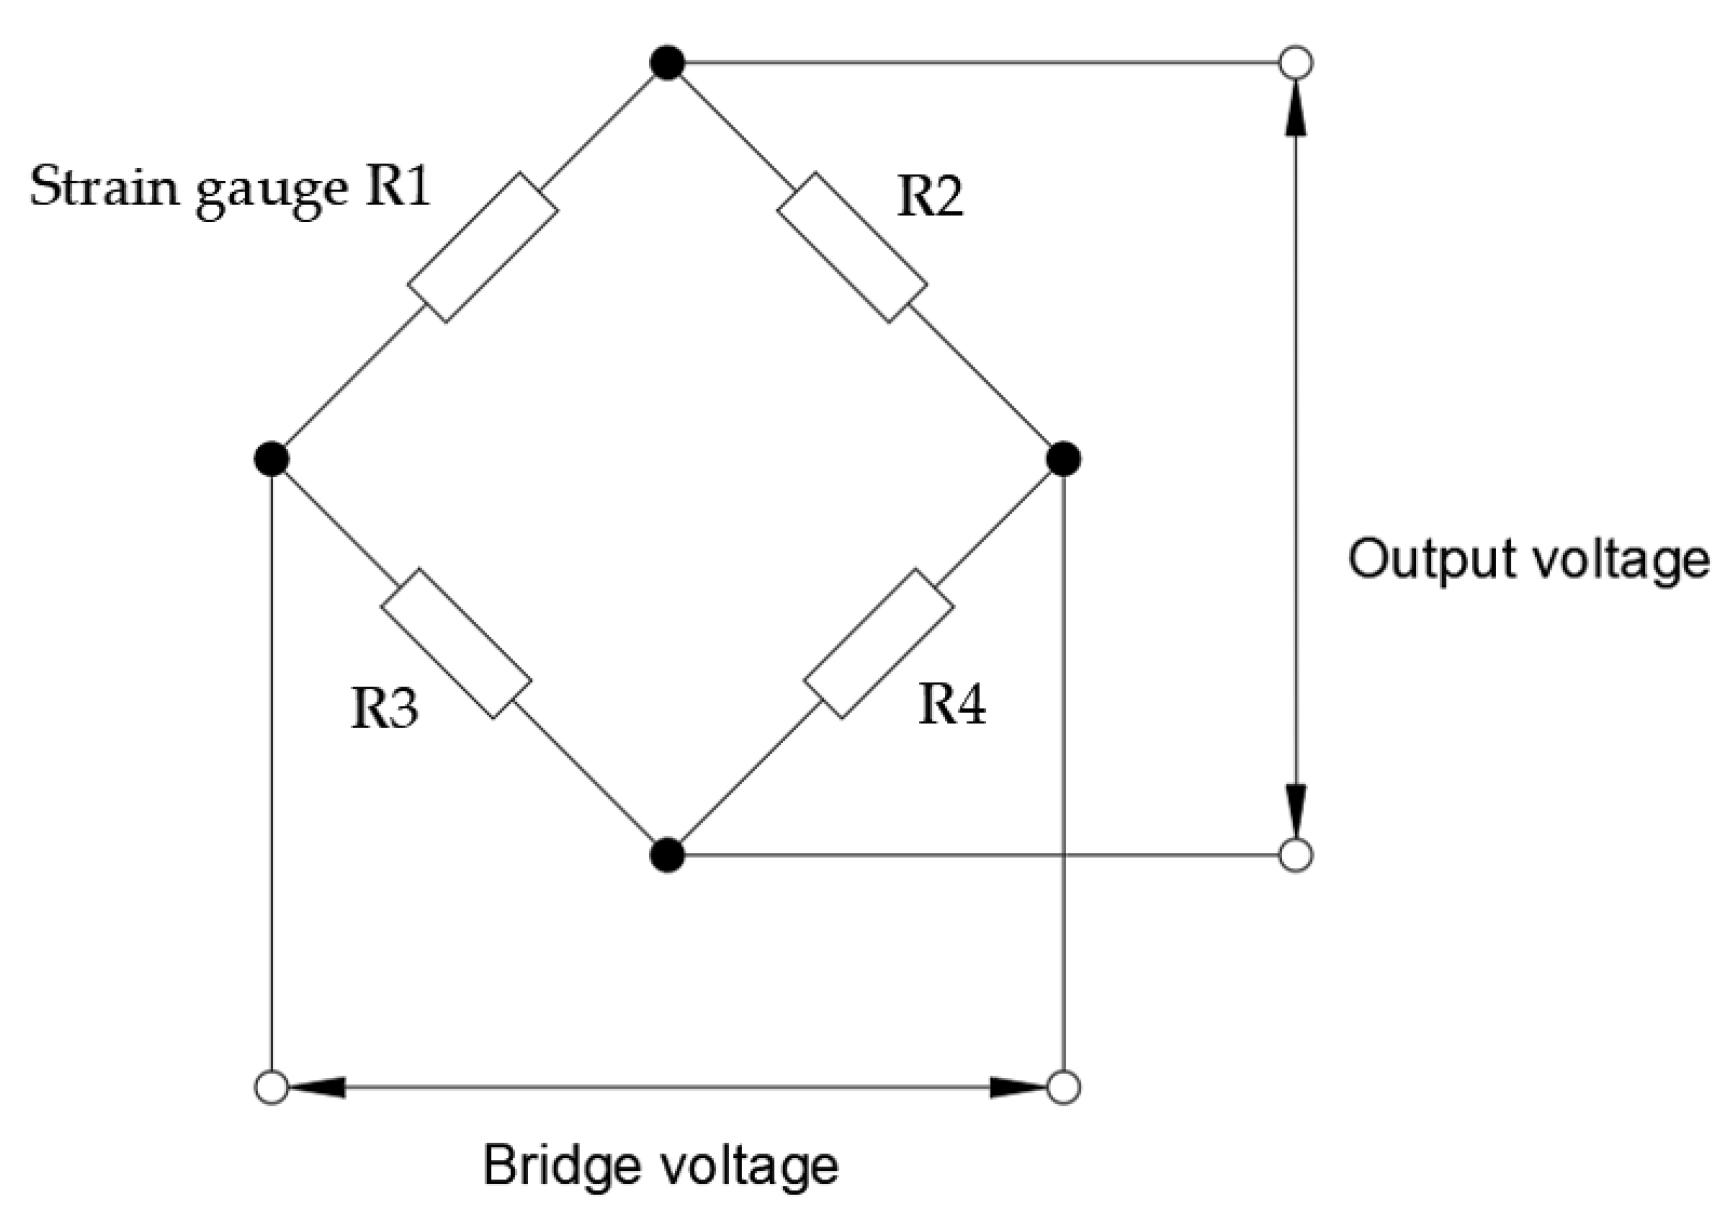
Figure 4.
Strain gauge group.
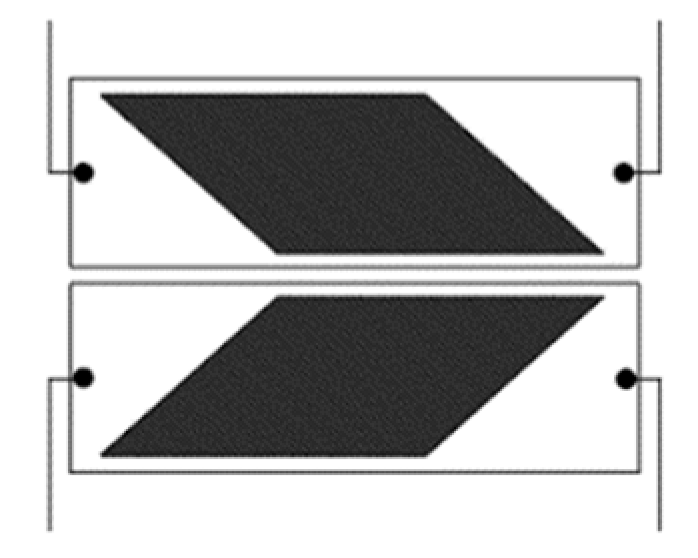
Figure 5.
Layout of strain gauge group. 1. Measured shaft 2. Strain gauge group.
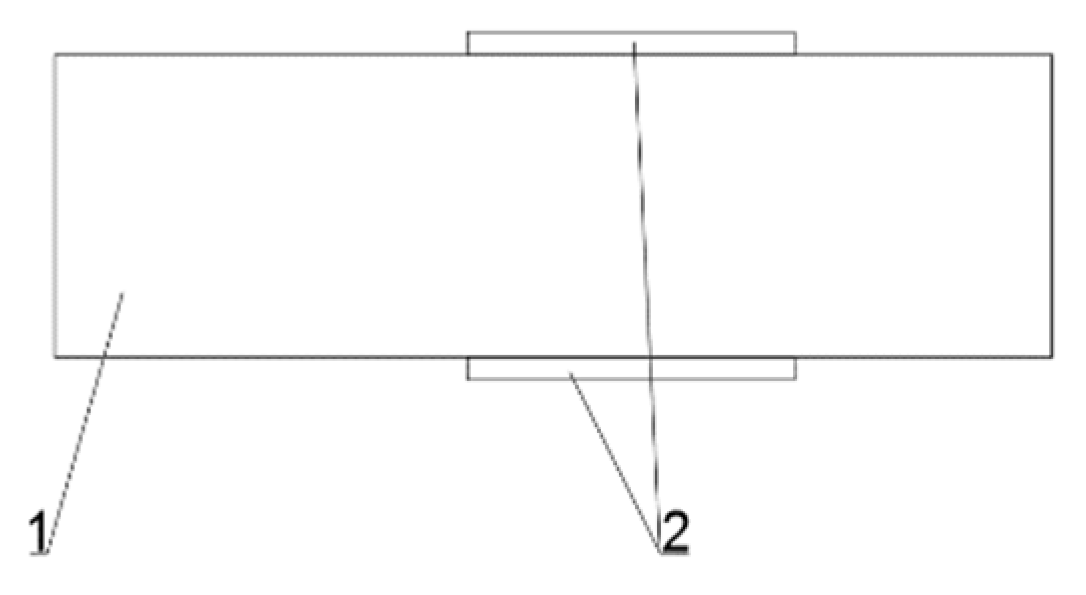
Figure 6.
Remote terminal unit.
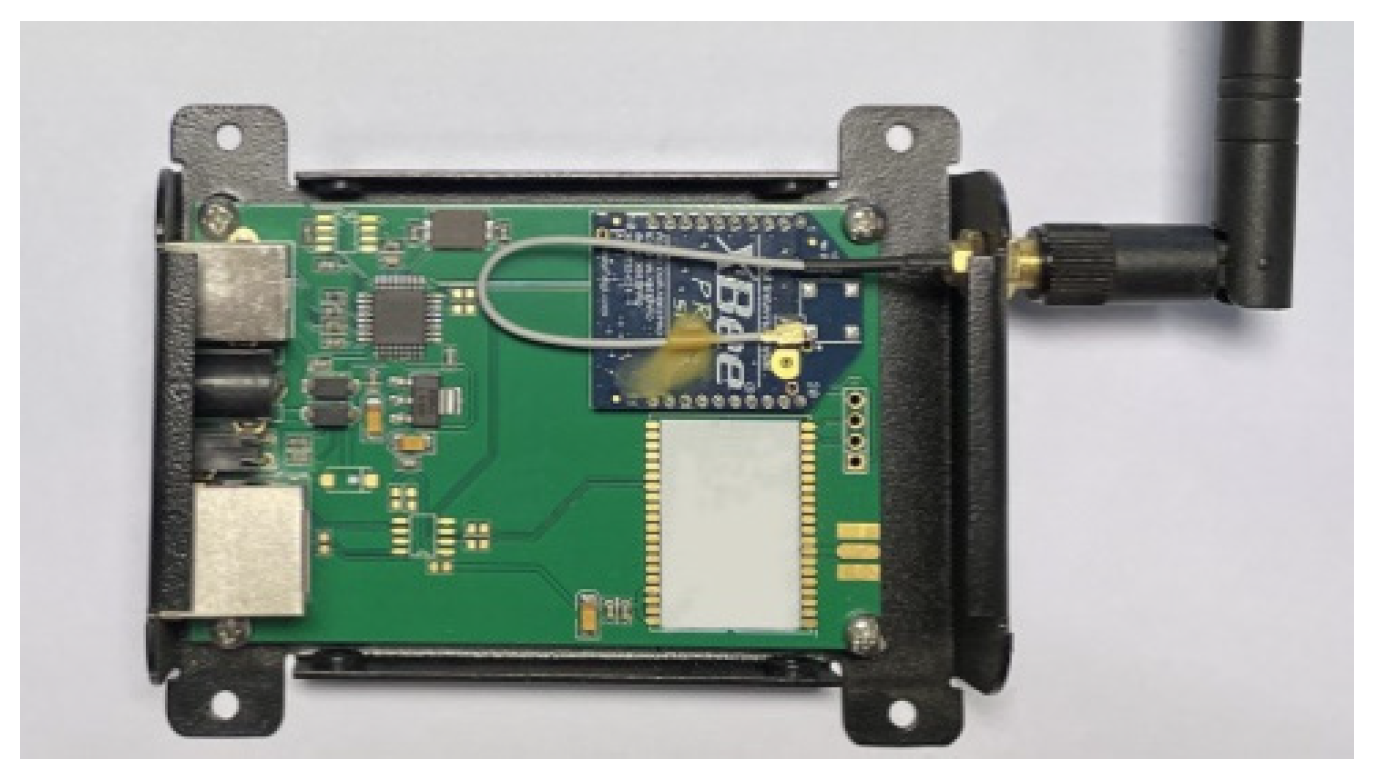
Figure 7.
Arrangement of the signal acquisition system.

Figure 8.
Time domain of torque signal with static state.

Figure 9.
Frequency domain of the no-load signal.
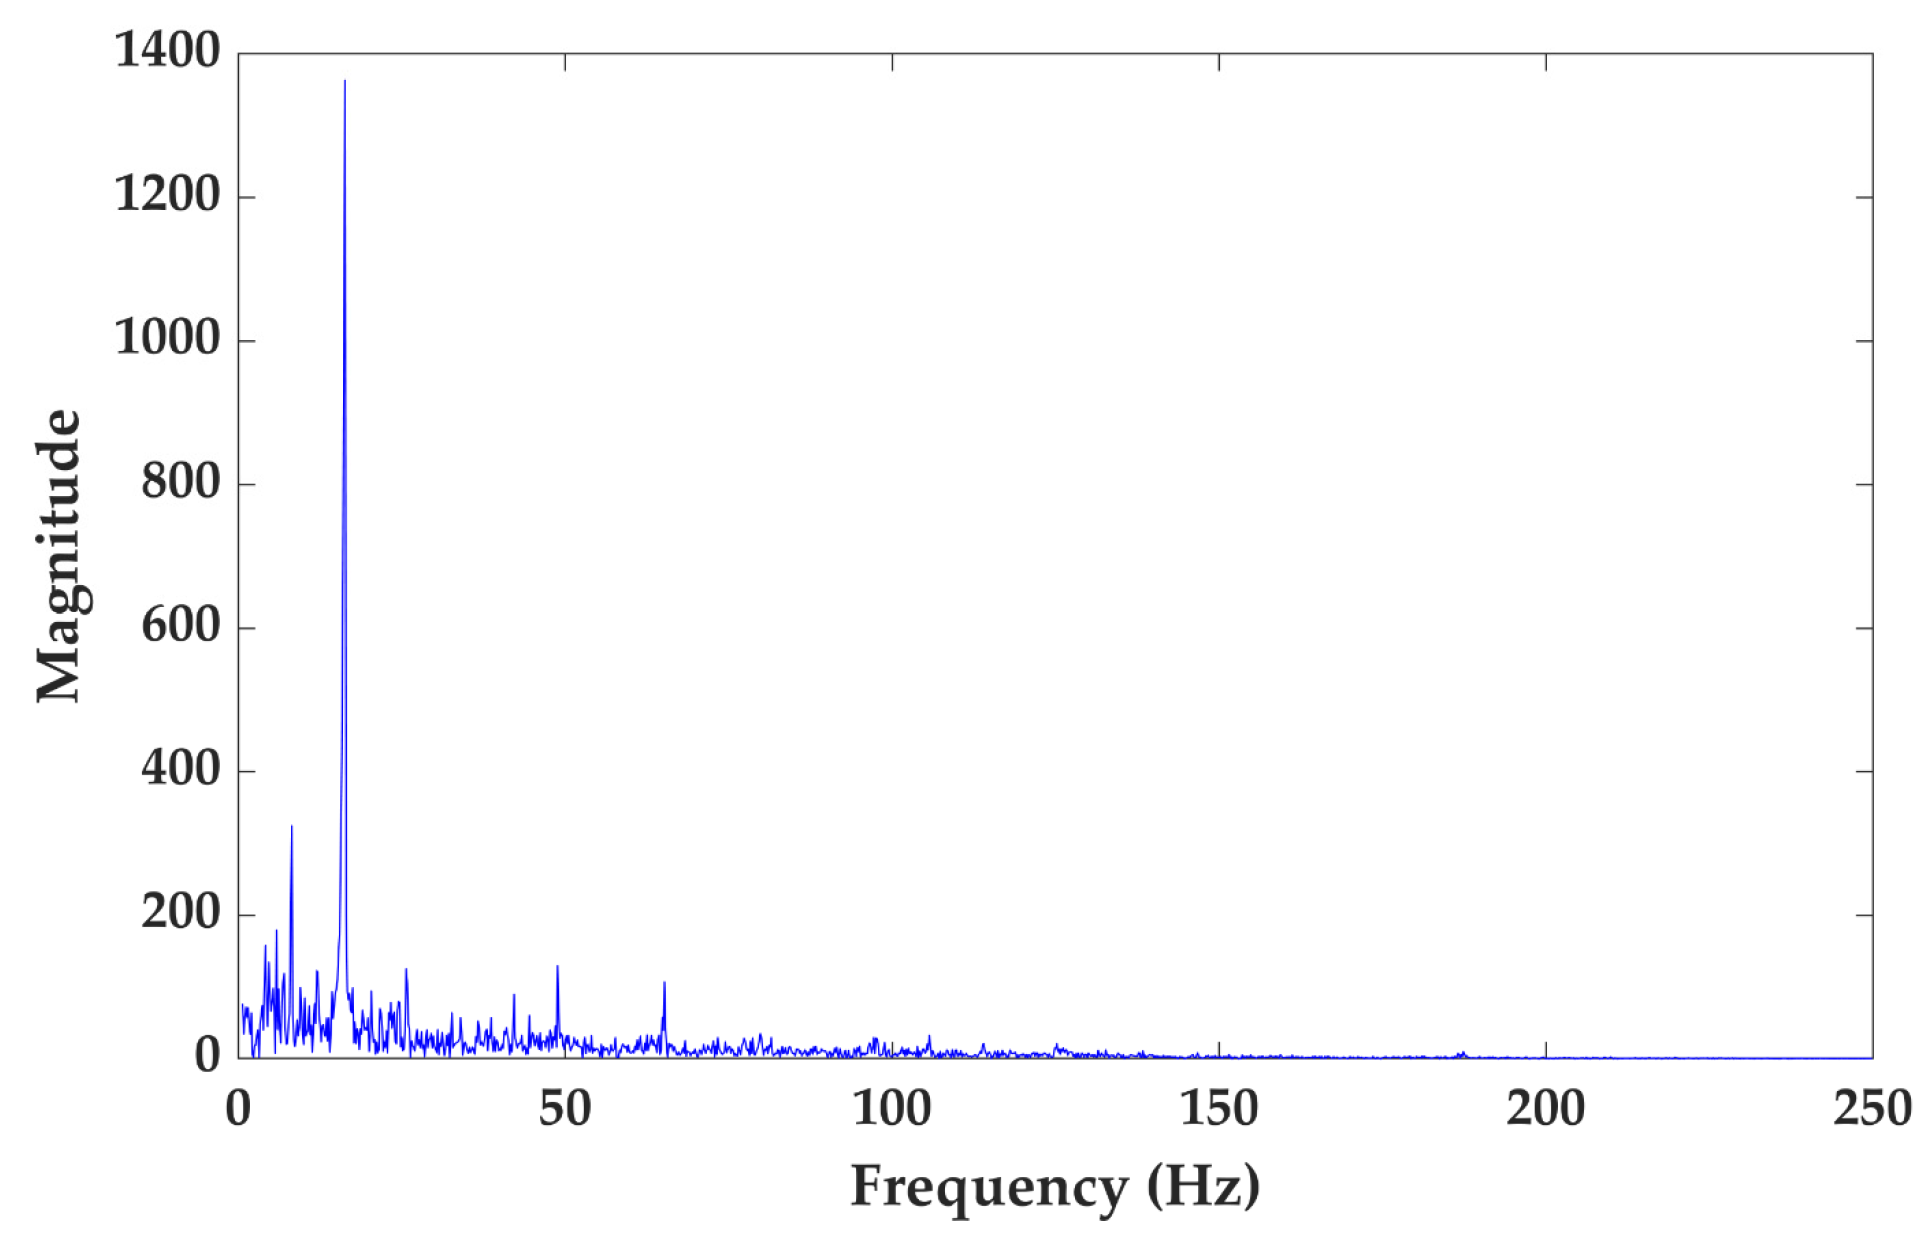
Figure 10.
Revolving speed signal with loaded state.
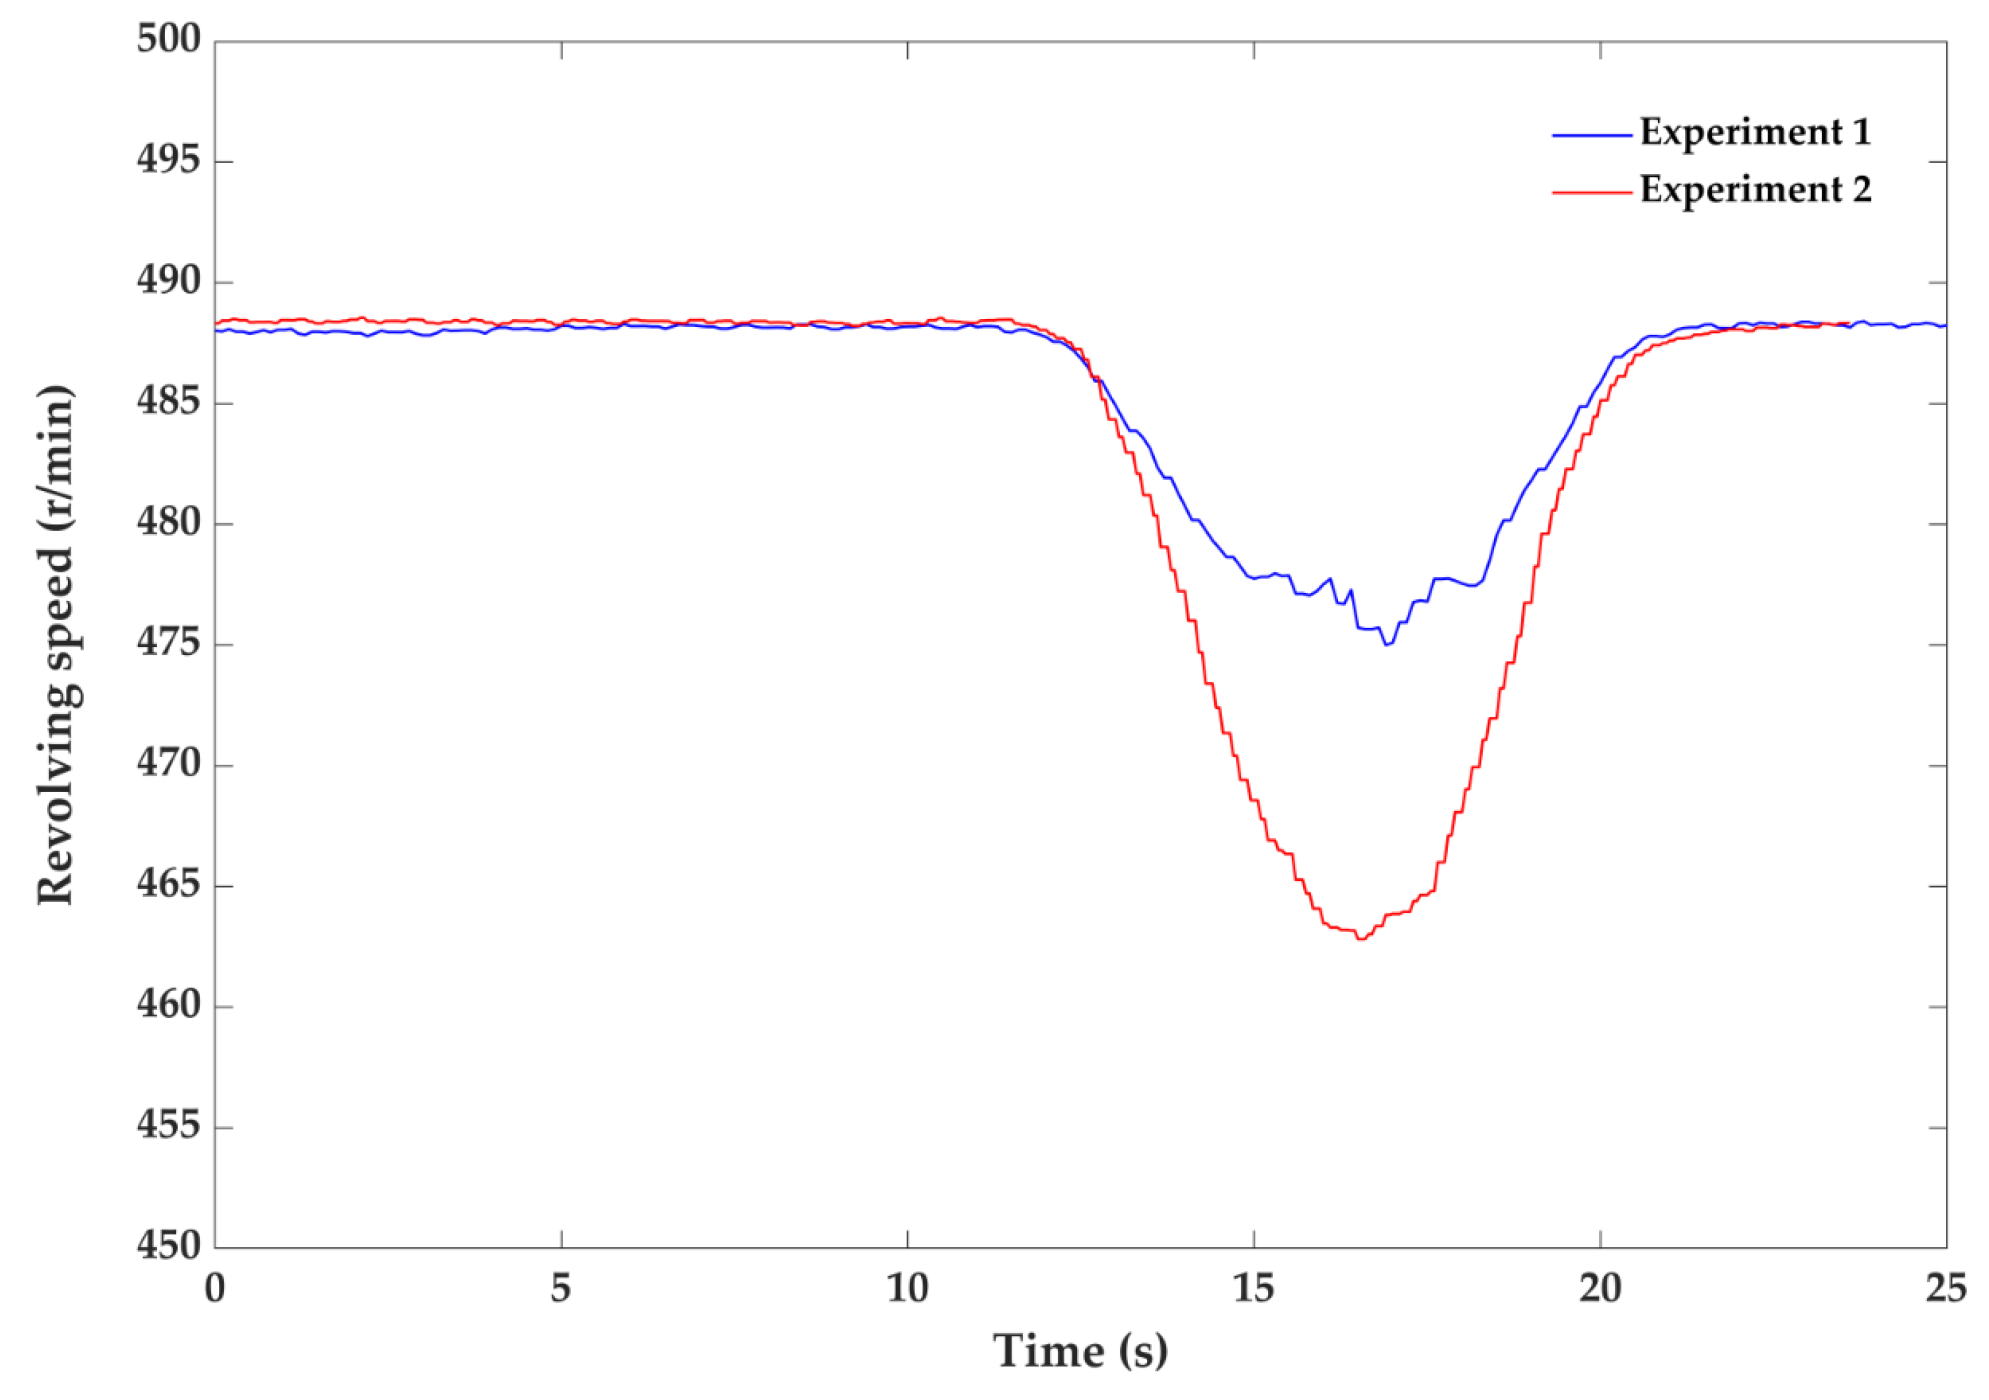
Figure 11.
Frequency domain of the load signal: (a) frequency domain of the load signal in Experiment 1; (b) frequency domain diagram of the load signal in Experiment 2.
Figure 11.
Frequency domain of the load signal: (a) frequency domain of the load signal in Experiment 1; (b) frequency domain diagram of the load signal in Experiment 2.
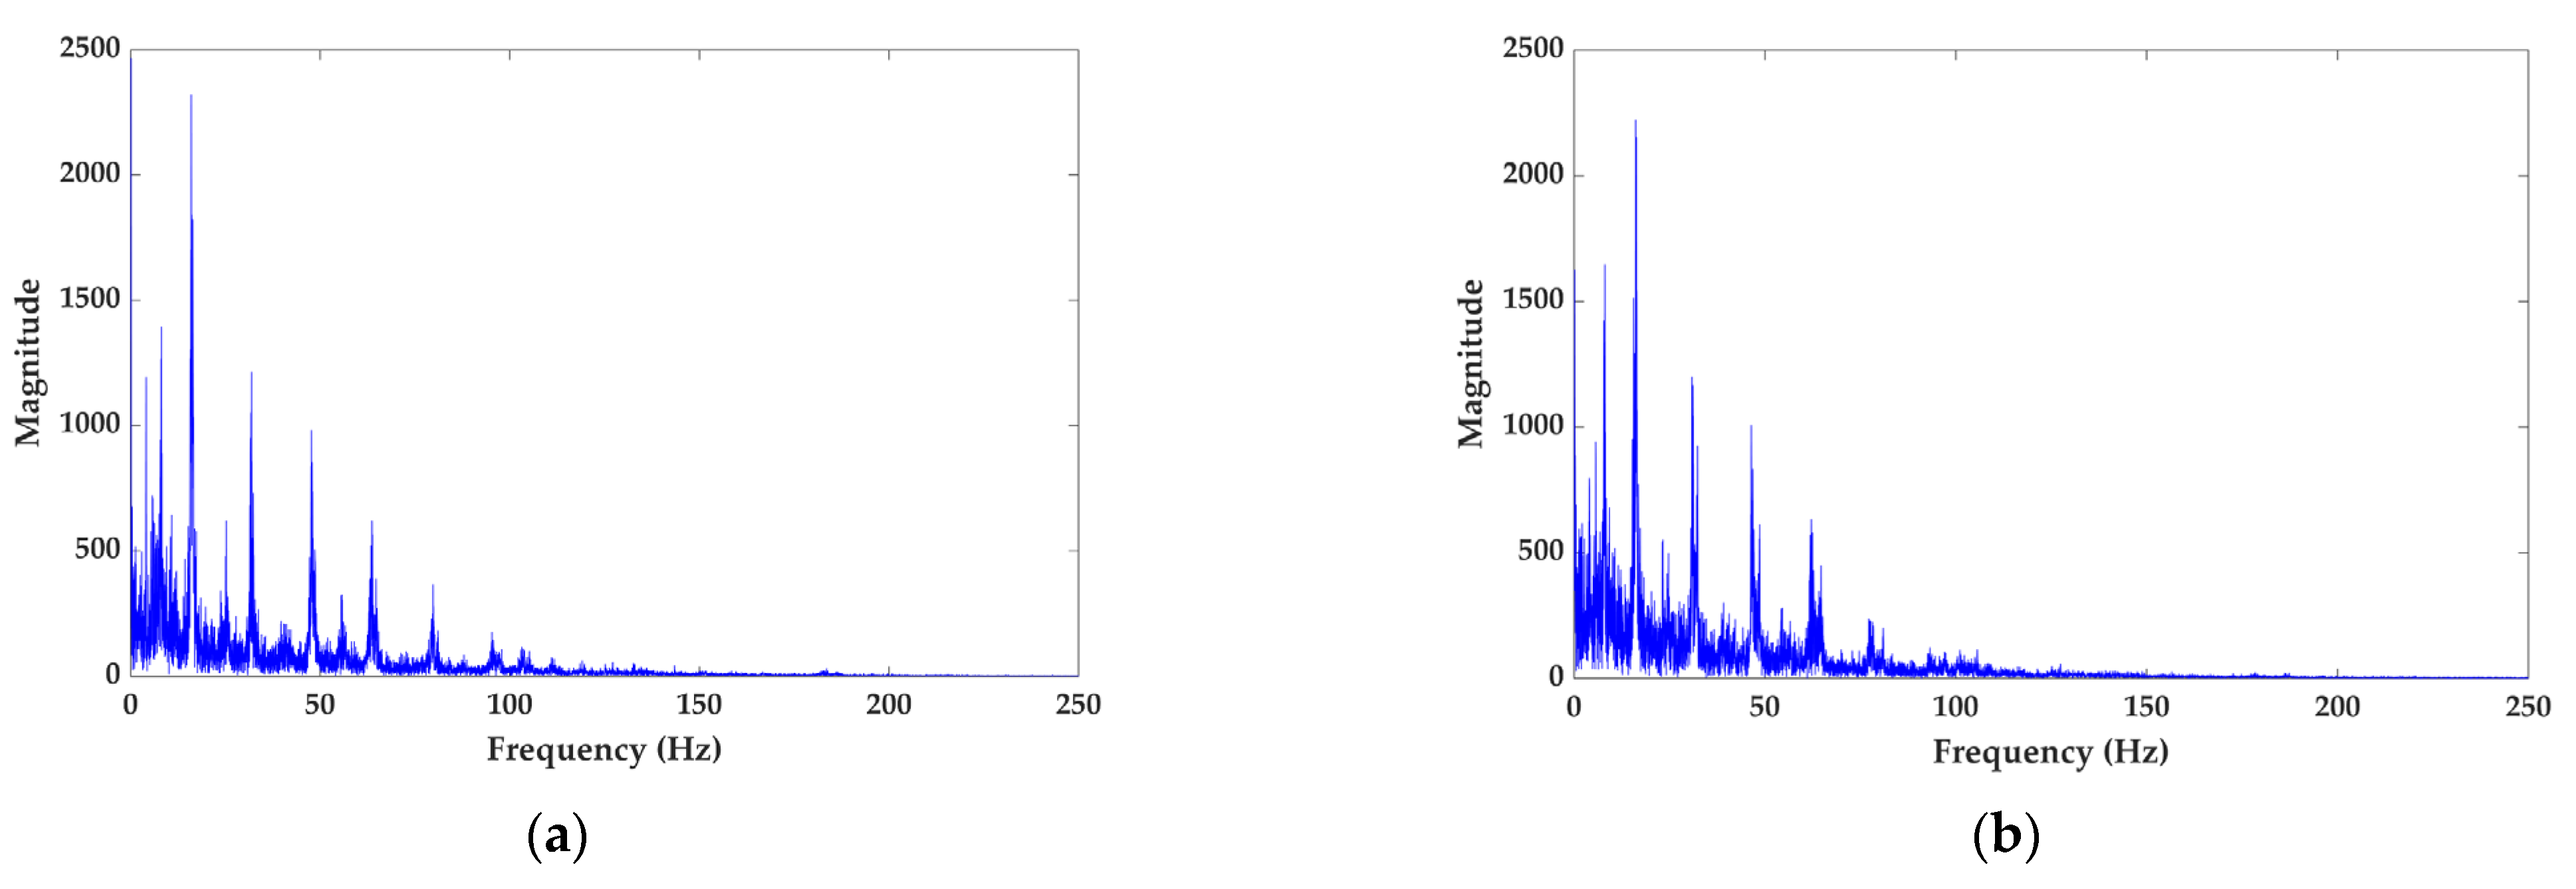
Figure 12.
Time-frequency diagram of signal: (a) time-frequency diagram of the no-load signal; (b) time-frequency diagram of the load signal in Experiment 1; (c) time-frequency diagram of the load signal in Experiment 2.
Figure 12.
Time-frequency diagram of signal: (a) time-frequency diagram of the no-load signal; (b) time-frequency diagram of the load signal in Experiment 1; (c) time-frequency diagram of the load signal in Experiment 2.
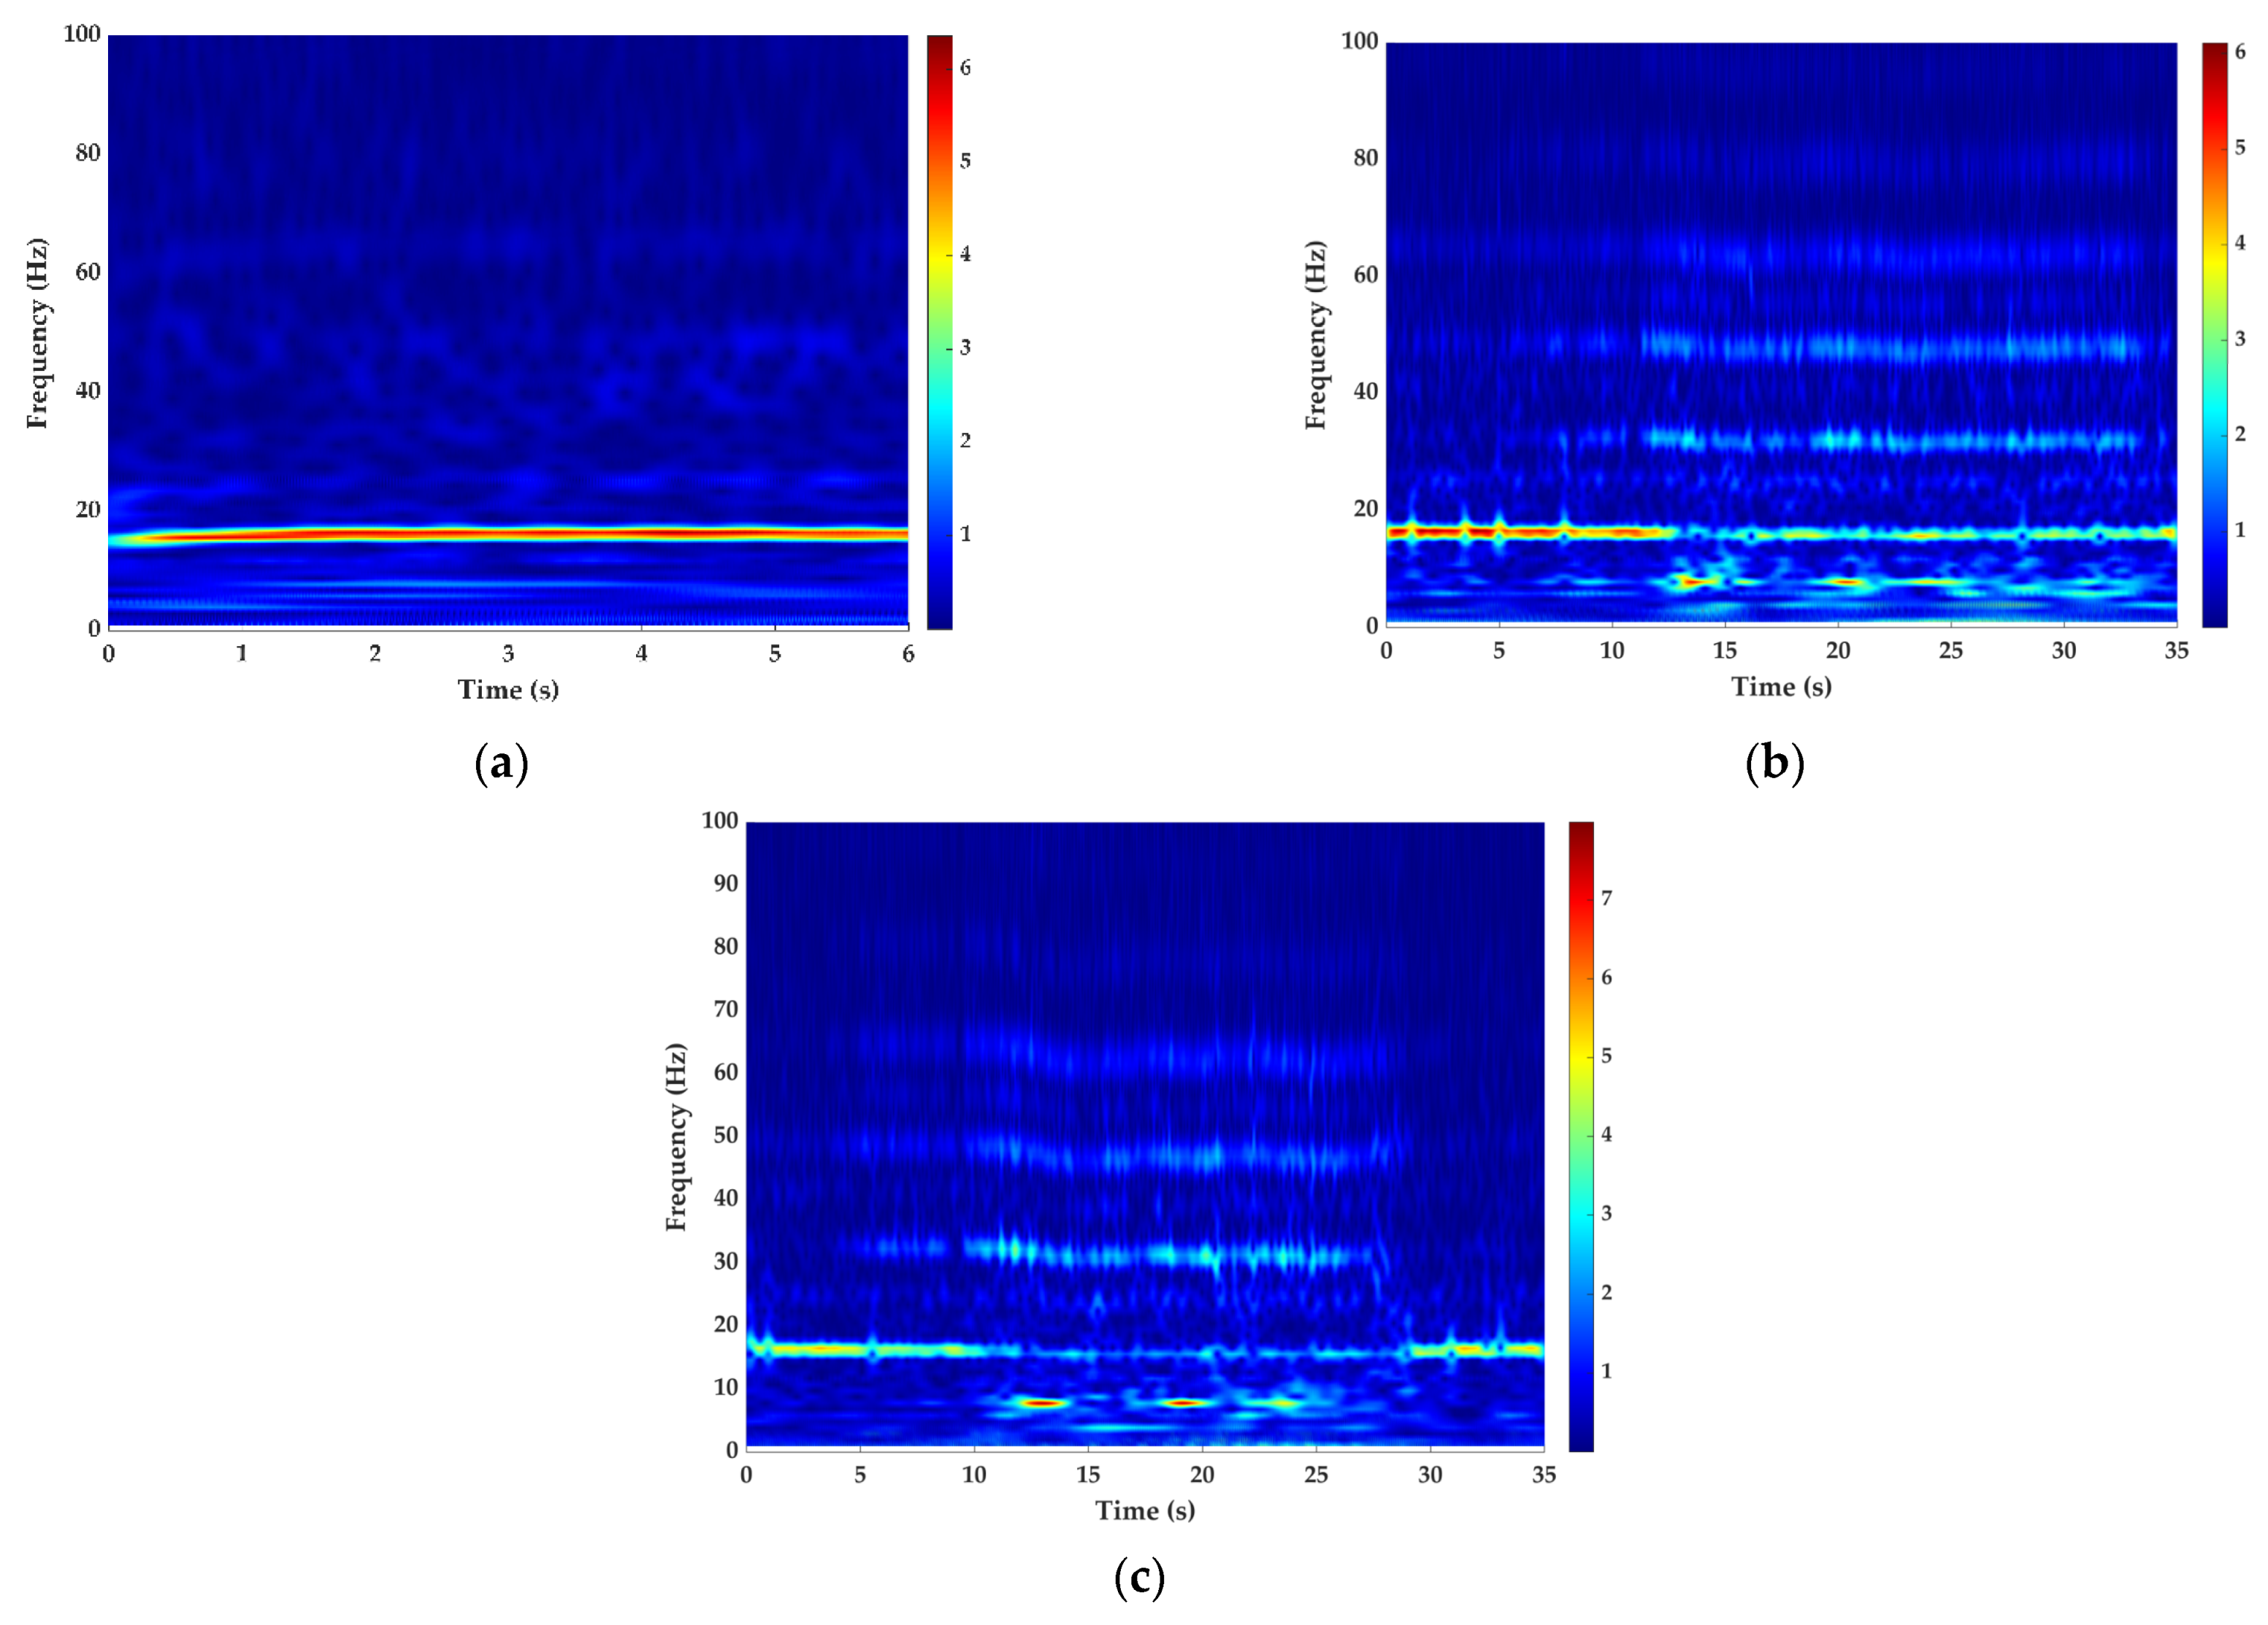
Figure 13.
Decomposition levels of signal.

Figure 14.
Comparison of the signals before and after noise reduction.
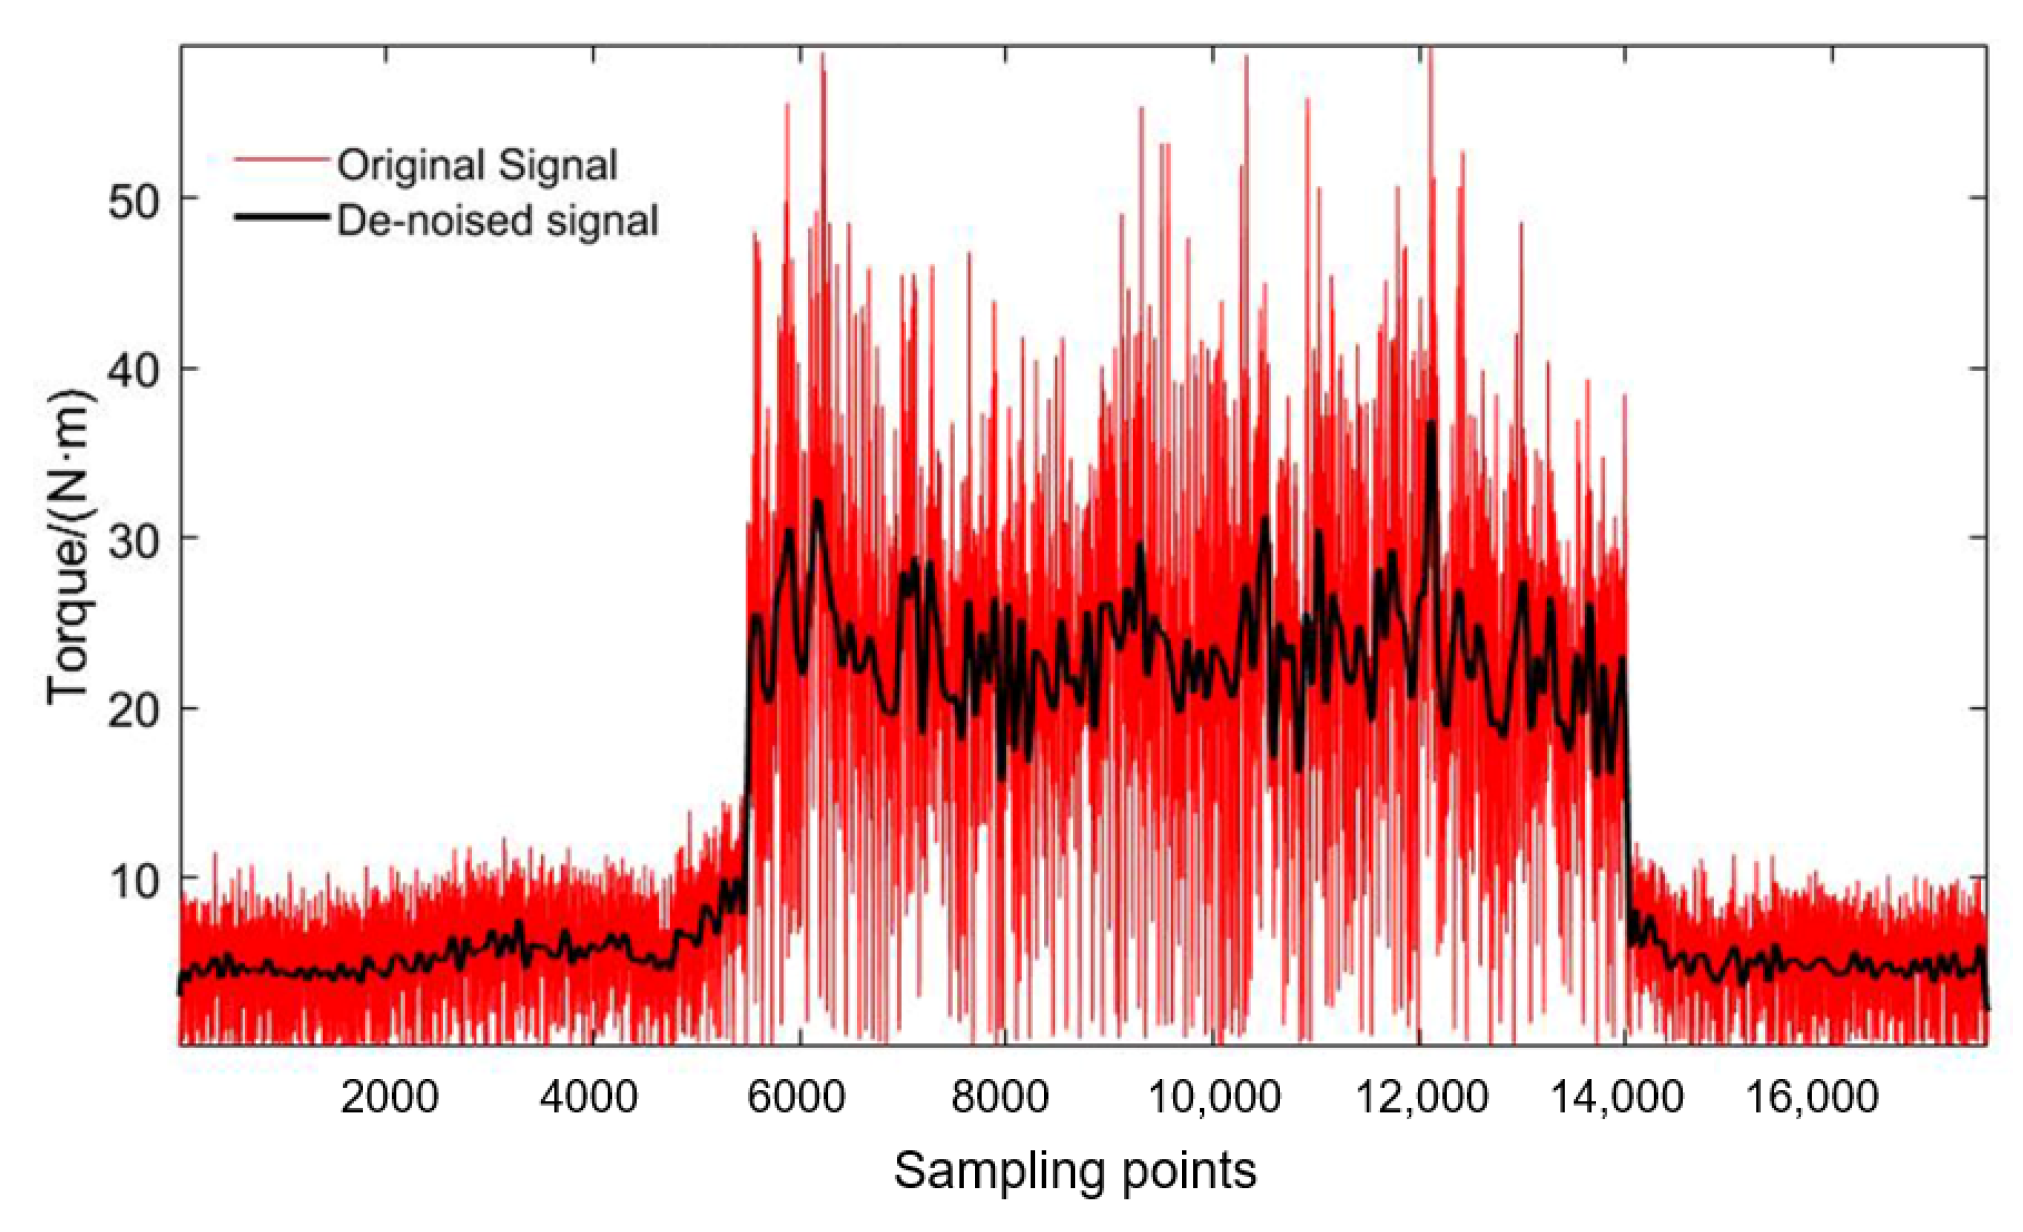
Figure 15.
Grid division optimization results.
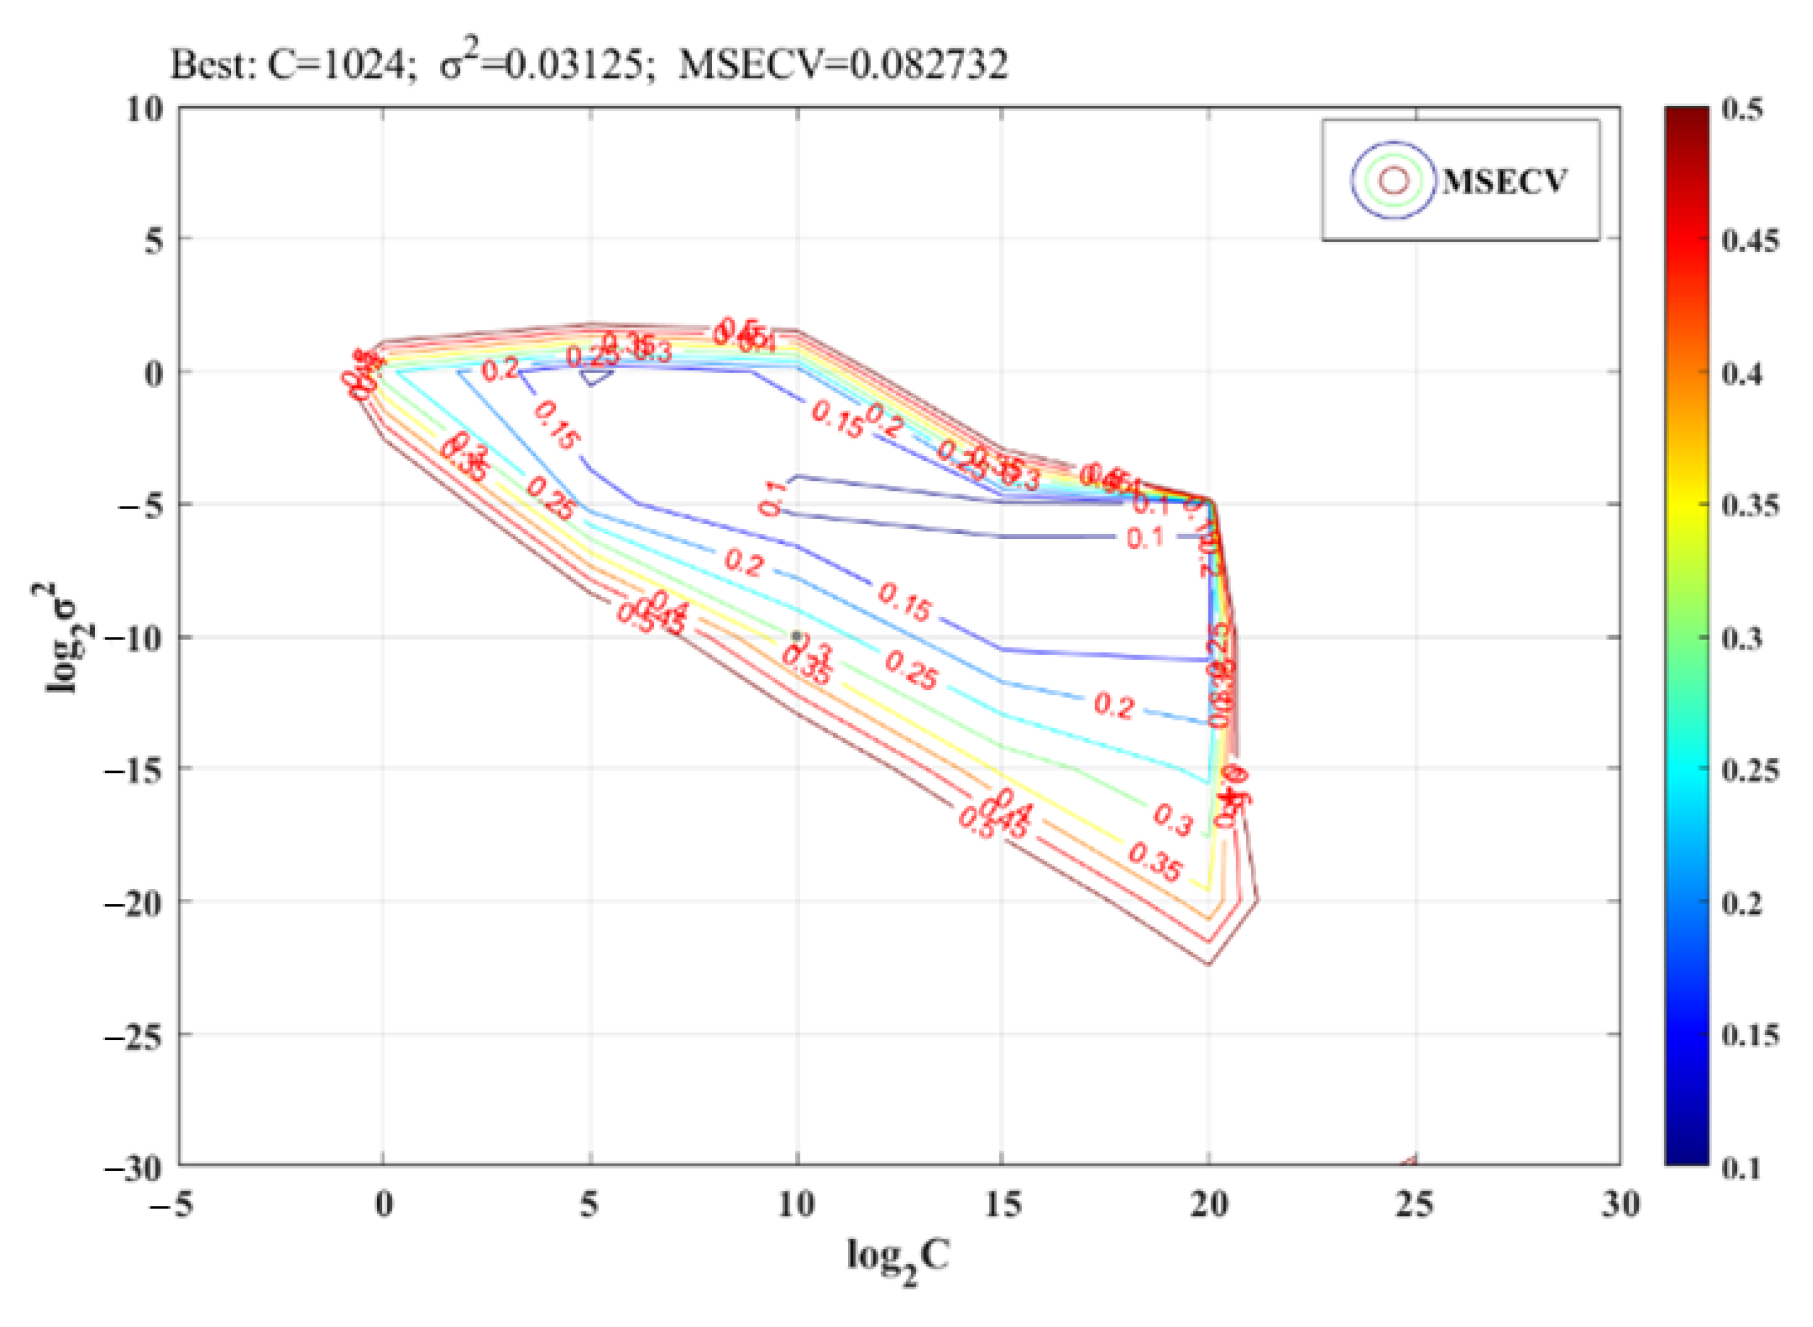
Figure 16.
Fitting results: (a) the fitting result of PLSR method; (b) the fitting result of SVM method.
Figure 16.
Fitting results: (a) the fitting result of PLSR method; (b) the fitting result of SVM method.
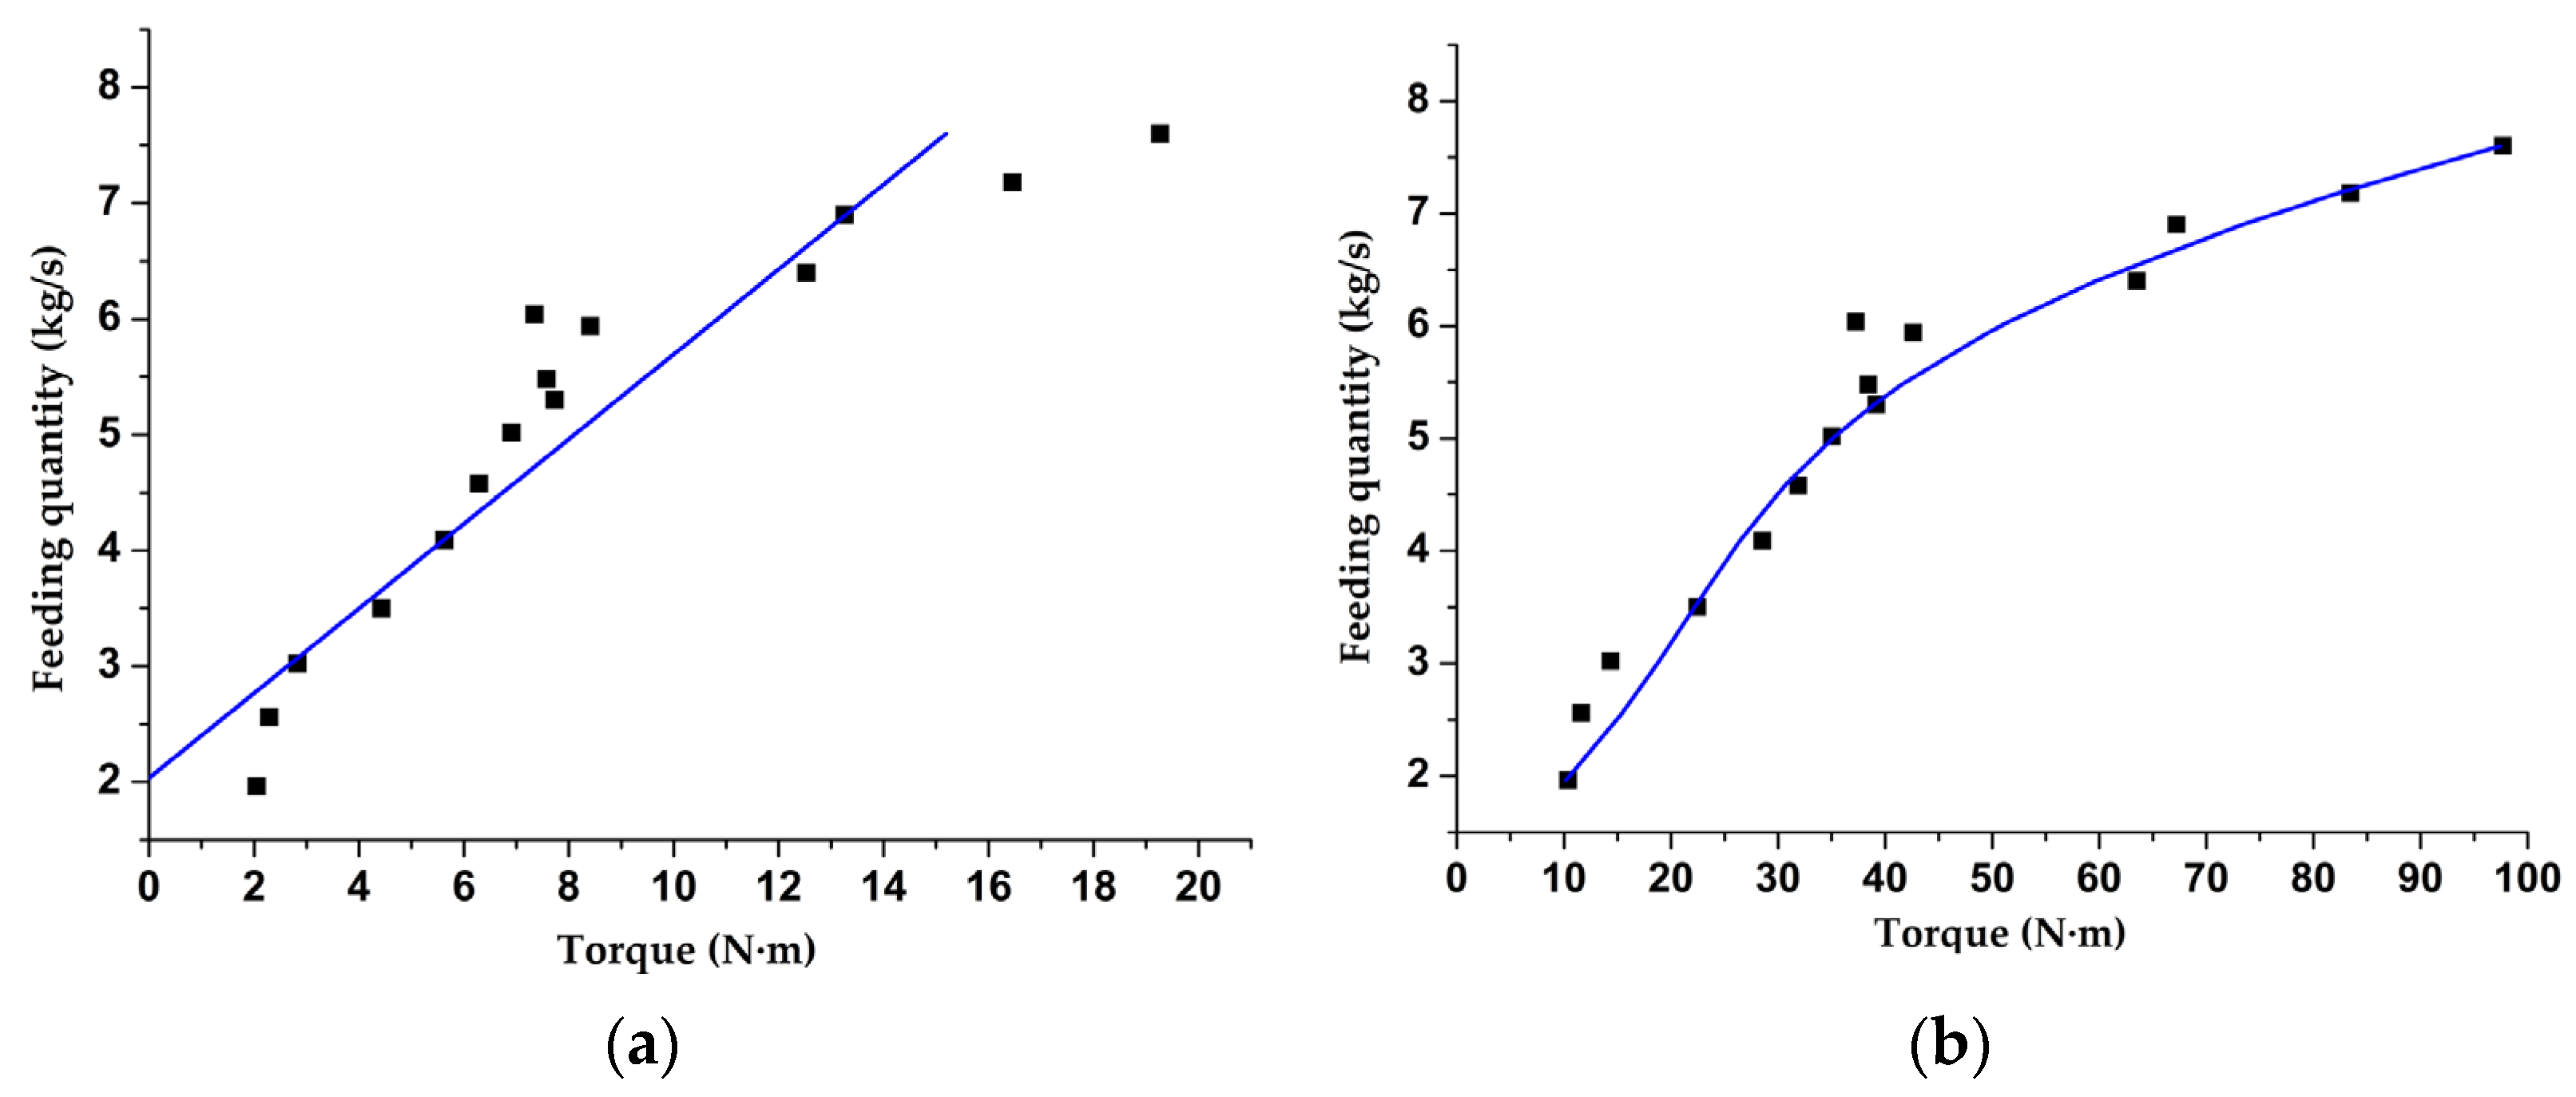
Figure 17.
Field experiment.
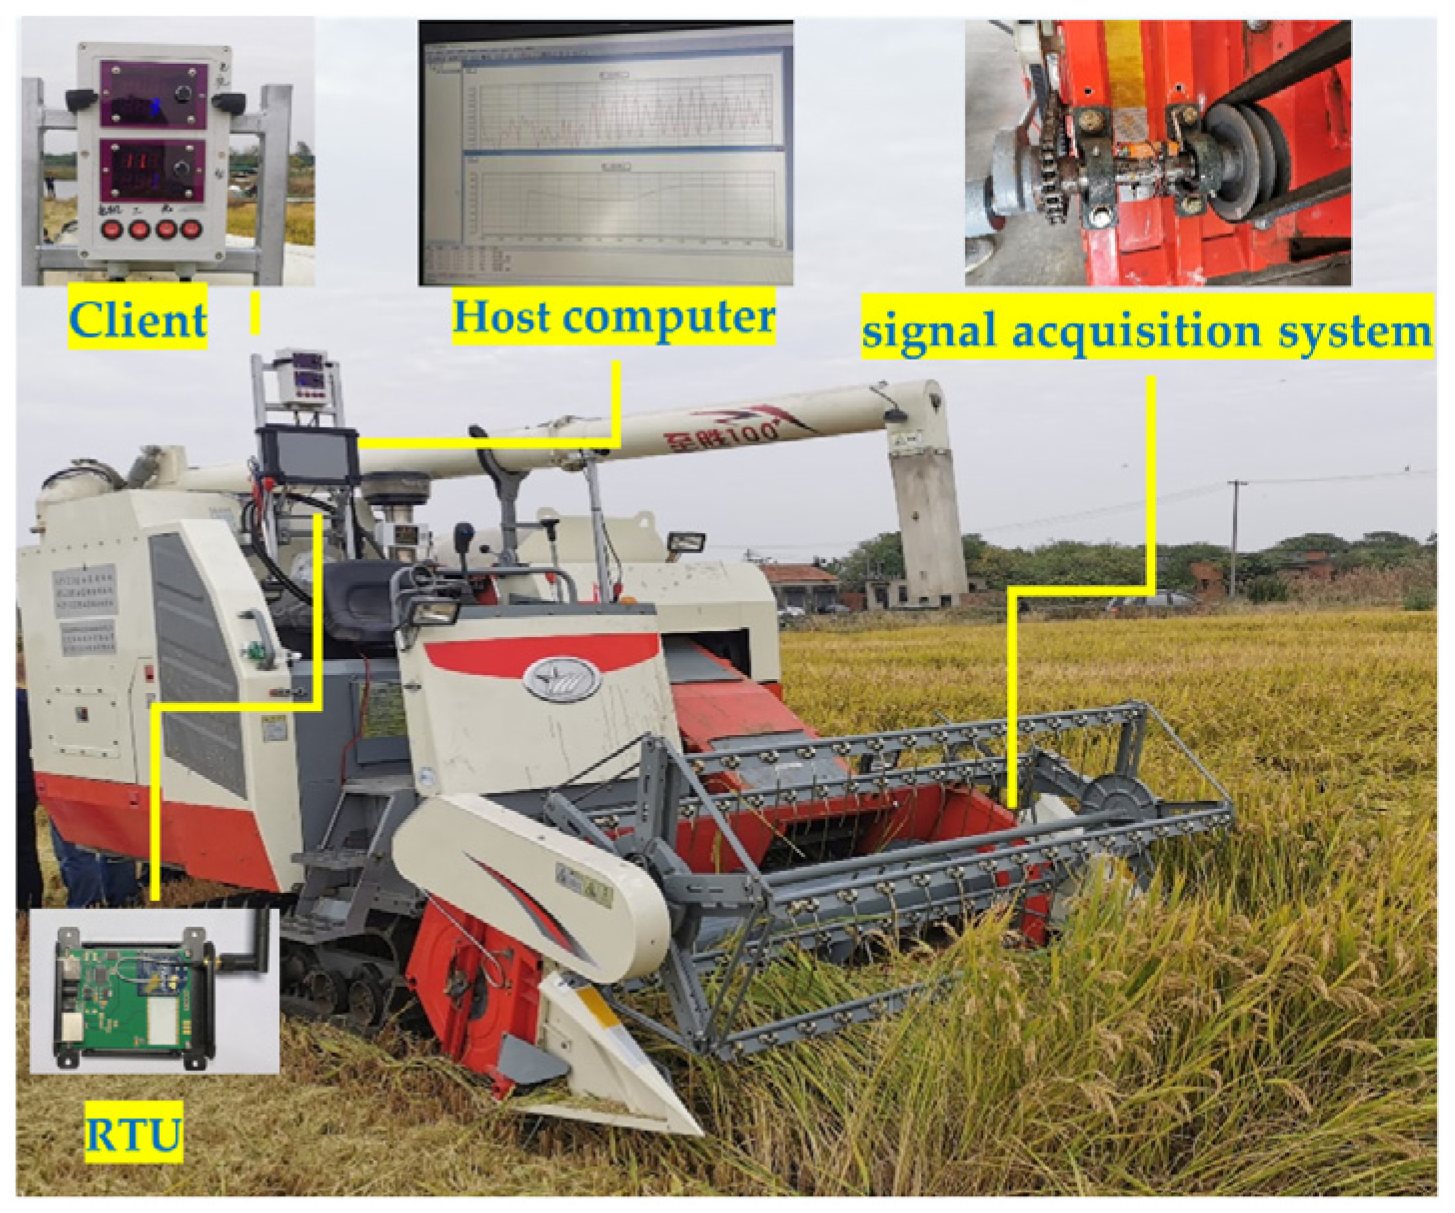
Figure 18.
Comparison of predicted and actual feeding quantity.

Table 1.
Bench calibration experiment data.
| No. | Total Material Mass (kg) | Feeding Quantity (kg·s−1) |
|---|---|---|
| 1 | 9.8 | 1.96 |
| 2 | 12.8 | 2.56 |
| 3 | 15.1 | 3.02 |
| 4 | 17.5 | 3.5 |
| 5 | 20.45 | 4.09 |
| 6 | 22.9 | 4.58 |
| 7 | 25.1 | 5.02 |
| 8 | 26.5 | 5.3 |
| 9 | 27.4 | 5.48 |
| 10 | 29.7 | 5.94 |
| 11 | 30.2 | 6.04 |
| 12 | 32 | 6.4 |
| 13 | 34.5 | 6.9 |
| 14 | 35.9 | 7.18 |
| 15 | 38 | 7.6 |
Table 2.
Comparison of fitting results.
| Decision Factor | Average Error | Root Mean Square Error | |
|---|---|---|---|
| PLSR | 0.853 | 16.2% | 1.877 |
| SVM | 0.967 | 5.21% | 0.573 |
Table 3.
Comparison of fitting results.
| No. | Measured Feeding Quantity (kg·s−1) | Actual Feeding Quantity (kg·s−1) | Deviation |
|---|---|---|---|
| 1 | 2.52 | 2.31 | 9.1% |
| 2 | 3.06 | 3.21 | 4.5% |
| 3 | 3.15 | 3.43 | 8.1% |
| 4 | 3.28 | 3.11 | 5.3% |
| 5 | 3.62 | 3.43 | 5.5% |
| 6 | 3.73 | 3.95 | 5.5% |
| 7 | 3.62 | 3.89 | 6.9% |
| 8 | 4.15 | 3.89 | 6.8% |
| 9 | 4.22 | 3.82 | 10.4% |
| 10 | 4.94 | 4.39 | 12.6% |
| 11 | 4.99 | 4.82 | 3.5% |
| 12 | 5.14 | 4.97 | 3.5% |
| 13 | 5.74 | 5.28 | 8.7% |
| 14 | 6.12 | 5.48 | 11.7% |
| 15 | 6.24 | 5.52 | 13.0% |
Publisher’s Note: MDPI stays neutral with regard to jurisdictional claims in published maps and institutional affiliations. |
© 2022 by the authors. Licensee MDPI, Basel, Switzerland. This article is an open access article distributed under the terms and conditions of the Creative Commons Attribution (CC BY) license (https://creativecommons.org/licenses/by/4.0/).
Share and Cite
MDPI and ACS Style
Jiang, T.; Guan, Z.; Li, H.; Mu, S.; Wu, C.; Zhang, M.; Wang, G.; Chen, X. A Feeding Quantity Monitoring System for a Combine Harvester: Design and Experiment. Agriculture 2022, 12, 153. https://doi.org/10.3390/agriculture12020153
AMA Style
Jiang T, Guan Z, Li H, Mu S, Wu C, Zhang M, Wang G, Chen X. A Feeding Quantity Monitoring System for a Combine Harvester: Design and Experiment. Agriculture. 2022; 12(2):153. https://doi.org/10.3390/agriculture12020153
Chicago/Turabian StyleJiang, Tao, Zhuohuai Guan, Haitong Li, Senlin Mu, Chongyou Wu, Min Zhang, Gang Wang, and Xu Chen. 2022. "A Feeding Quantity Monitoring System for a Combine Harvester: Design and Experiment" Agriculture 12, no. 2: 153. https://doi.org/10.3390/agriculture12020153
Note that from the first issue of 2016, this journal uses article numbers instead of page numbers. See further details here.