Article

Use of Recovered Struvite and Ammonium Nitrate in Fertigation in Tomato (Lycopersicum esculentum) Production for boosting Circular and Sustainable Horticulture

1
Sustainable Plant Protection Program, Institute of Agrifood Research and Technology (IRTA), E-08348 Cabrils, Spain
2
Sustainability in Biosystems Program, Institute of Agrifood Research and Technology (IRTA), E-08140 Caldes de Montbui, Spain
*
Author to whom correspondence should be addressed.
Agriculture 2021, 11(11), 1063; https://doi.org/10.3390/agriculture11111063
Submission received: 29 September 2021 / Revised: 24 October 2021 / Accepted: 25 October 2021 / Published: 28 October 2021
(This article belongs to the Special Issue System Efficiency and Resource Recovery in Circular Horticulture)

Abstract

:
Struvite and ammonium nitrate are products obtained from widely studied processes to remove phosphorus (P) and nitrogen (N) from waste streams. To boost circularity in horticulture, these recovered products should be applied to edible crops. Particularly, struvite has not been implemented in fertigation as the unique source of P fertilizer. Therefore, a soilless system greenhouse experiment was conducted for tomato crops during two growing seasons. This study aims to compare the agronomic and environmental effectiveness of recovered products used in a nutrient solution for fertigation (NS) to synthetic fertilizer treatment. Moreover, two different N concentrations of the NS were tested to evaluate the impact on the N-leaching. Additionally, struvite dissolution tests were performed to ensure its solubility. Satisfactory results of struvite solubilization were obtained. Results show that both nutrient-recovered products can be used as fertilizers in NS, due to their non-statistical significance in total yield production and fruit quality. However, ammonium nitrate treatment, depending on the crop variety, showed a lower marketable yield. Moreover, the variation on N concentration input exhibited leachate concentration differences, with N leached percentage values from 36 to 13%. These results give deeper insights into the future potential utilization of nutrient-recovered products and technical data to optimize fertigation strategies.

Graphical Abstract

1. Introduction

Phosphorous (P) and nitrogen (N) are major constraints on the yield and quality of food production. However, about 90% of commercially available P is sourced from phosphate rock, a non-renewable and geographically restricted resource, with no meaningful reserves in the European Union (EU) [1]. Moreover, the production of nitrogen fertilizers through the Haber–Bosch process is associated with a negative environmental impact due to its high energy demand. On the other hand, wastewater streams contain large amounts of nutrients, especially P and N, that are polluting the water bodies [2]. The production of renewable and high-quality fertilizers from waste streams should be promoted, and the products should be tested in field conditions in order to boost circularity in horticulture systems. Among the most important recovering processes, the precipitation of P as struvite (MgNH4PO4·6H2O) should be highlighted [3,4]; in the last years, the production of ammonium nitrate (AN) (or ammonium sulphate) from WWTPs through liquid–liquid membrane contactors (LLMC), where N is captured into an acid, has also been investigated [5].
In terms of application, several studies on struvite agronomic efficiency have been focused on its potential as slow-release fertilizer applied to the soil, finding similar crop responses to mined or synthetic fertilizers [6]. Even so, some authors have reported highly variable struvite dissolution rates in soils with alkaline pH [7]. Besides, some authors [8] assessed the struvite performance as slow-release fertilizer in hydroponics. Nevertheless, the use of struvite in fertigation as a raw material (fertilizer) for nutrient solution (NS) manufacture has not been studied so far. Nowadays, this topic acquires relevance in the context of the promotion of a circular economy of P by EU initiatives and the recent publication of the new European fertilizer regulation that is setting EU-wide quality standards for struvite and hereby facilitating its EU-wide trade [9]. In addition to the regulation, it has been stated that physical parameters and the solubilization rate of struvite are critical for further commercial use of struvite [10].
To date, many researchers have focused on technological aspects for N recovery, and little has been reported on the resulting products such as recovered AN and their potential to be used as N fertilizers [11]. Moreover, nothing has been described on its use as raw material for a NS. Nowadays, recovered AN is a high-priority product for its potential of replacing synthetic N fertilizers being highly dependent on science-based knowledge on characterization and fertilizer performance of recovered end-products [12]. The effective N is the amount of N from an applied bio-based material that is expected to be available for crop uptake in the season of application. For AN, 100% of N-effective is accepted [13]. This is similar to what is expected from the application of synthetic N fertilizer. The agronomic efficiency of recovered products with different chemical characteristics must be known to optimize their use as fertilizers.
The agrosystem vegetable crops grown with fertigation in combination with drip irrigation is continually increasing and an important research effort has been developed in fertilization management techniques to reduce leachate losses (i.e., NS management strategies, planting material, models, greenhouse structures, technology (sensors, soil, and plant monitoring)) [14,15]. Even this combination provides the technical capacity to precise N and irrigation management especially in soilless growing [16], commonly, the N and irrigation supplied to vegetable crops are excessive to crop requirements [17]. While this practice prevents growth from being limited by nutrient supply, it exacerbates the release of nutrients into the environment with impacts on drinking water and the eutrophication of fresh water and marine ecosystems [18], and the increment of plant disease [19]. There are various standard NS that are general guidelines, yet they are not adapted to specific growing conditions, which mainly concern the climatic conditions, irrigation patterns, and the development stages of the crop. With the climatic conditions, the light intensity and the transpiration rate are detected as being important. With irrigation, the fraction drain to waste and the reuse rate of drain water are the main factors. With the development stages, the change from the vegetative to the reproductive phase is important [20]. To further hone the fertilizer recipes, periodic sampling is a must, helping to determine the nutritional status of the plants [21]. Many field studies have analyzed the optimum best nutrient management practices (BNMP) for the Mediterranean region, including fertilizer rate for a variety of crops [16,22,23,24]. However, choices to achieve optimal irrigation and nutrient management require complex decision-making. Numerous factors regarding climate, substrate characteristics, field infrastructures, and crop characteristics need to be considered [22].
Tomato cultivation is one of the major horticultural crops in Spain, in terms of area and production [25]. The composition of NS used for intensive production of this culture is high in nutrients; therefore, growers have increasing pressure to minimize water and nutrient management. The horticulture sector should cope with the challenge of protecting water bodies from nitrate and P pollution and find alternative renewable sources of fertilizers. Although there is a need to increase crop yields to feed the growing global population, this needs to be done in an environmentally sustainable way.
The general objective of the study is to contribute to increase the circularity and sustainability of horticultural crops, particularly in a tomato soilless crop cultivated with fertigation in greenhouse conditions. The specific objectives are (a) to assess the effects of using solubilized recovered struvite and ammonium nitrate through fertigation upon the tomato plants and (b) to assess the feasibility of reducing the N concentration in nutrient solution and the possible mitigation of N leaching.
The variables measured (yield, fruit quality, biomass, P and N uptake) in the treatments with nutrient-recovered fertilizers were compared to the correspondent control treatment (synthetic fertilizers). Moreover, two different N concentrations (10 mM and a dynamic 5-8-5 mM) of the NS were tested to evaluate the environmental impact on the N-leaching of a tomato soilless crop. Particularly, to our knowledge, the use of struvite and ammonium nitrate as a raw material for nutrient solution manufacture has not been studied so far.

2. Materials and Methods

2.1. Greenhouse Experimental Set-Up and Climate Data Measurement

Experiments were carried out, during two growing seasons, in a passively ventilated multi-span single-layer polyethylene greenhouse, 200 m2 surface area, located at the IRTA research facilities in Cabrils, Barcelona, Spain. Tomato (Lycopersicum esculentum) seedlings were transplanted into new perlite bags (brand PERLINDUSTRIA®) of 30 L and 0.75∗0.25 m in length, and five bags, each providing substrate for three plants, were placed in lines (Figure 1a). The plant density was 3.33 plants·m−2, achieved by using a 25 cm plant-spacing and 120 cm row-spacing. Each treatment was replicated three times, with 15 plants per replication (Figure S1). Tomato plants were cultivated during the spring–summer season, March–August 2019 and April–August 2020. Since the used cultivar in 2019, Bond®, produced a high number of non-commercial fruits, Egara® cultivar was selected for the 2020 campaign. An open hydroponic system was used for irrigation, providing the nutrient solution (NS) through one dripper of 2 L·h−1 of nominal flow per plant. Irrigation decisions (timing and volume) were primarily based on estimation of crop evapotranspiration (ETc), but the overriding factor was a target drainage volume of about 20%, as a surplus of 20–30% leaching fraction is commonly used to avoid salt accumulation in the root zone [16]. The irrigation strategy was to apply the daily doses in 7–8 irrigations, to reduce the risk of water and nutrient losses [17]. Climate data inside the greenhouse was recorded every hour using a Hortimax sensor. Table 1 summarizes the monthly mean and standard deviation (SD) indoor global radiation, temperature, maximum temperature, and relative humidity during both crop periods.

2.2. Characterization of Recovered Products, Struvite and Ammonium Nitrate, Based on the Current Legal Framework

A new European fertilizer regulation is setting EU-wide quality standards for struvite [9], which defines 17 physicochemical and 5 microbiological parameters to be utilized as a fertilizer or component material in fertilizers. P-recovered products used in this study were recovered by Århusvand A/S company (Denmark) and Murcia Este WWTP (Spain) in 2019 and 2020, respectively, through P-elutriation at full-scale followed by a crystallization unit from the sludge line. These samples were identified as highly pure struvite and accomplish the new legislative requirements for precipitated phosphate salts in the revised fertilizer directive [4] (Table S1). Moreover, N, P, and Mg2+ content of struvite are close to the theoretical values (Table 2), within the range detected in a systemic comparison of commercially produced struvite [26], and accomplish for the prescription of the current legislation being the P content higher than 7% of the dry matter (DM). Furthermore, the total organic carbon (TOC) content is below 0.25%, being 3% DW the legal limit, and the heavy metal and the biological contaminants are well below the threshold legal limit. Organic pollutants concentrations are also shown (Table S1).
According to the current Fertilizer regulation EU2003/2003, AN is considered a nitrogen fertilizer solution if the N-concentration is at least 15% (w/v) [27]. The current draft of the new European fertilizer regulation for “inorganic liquid compound macronutrient fertilizer” proposes lower N-concentration criteria (1.5 or 3%; [28]), which could meet the quality criteria of the products used in this study. Similar to synthetic mineral N fertilizers produced via the Haber–Bosch process, recovered AN contains total N entirely in mineral form, which can be found in the form of N-NH4+ and N-NO3. AN liquid batches used in this study are an end-product of an ion-exchange with zeolites and further treated in a pilot plant in Universitat Politècnica de Catalunya (Spain) of liquid–liquid membrane contactors where N from wastewater is captured into nitric acid [5]. All AN batches were collected in sampling bottles (1 L), stored (−20 °C), and characterized to determine the required fertilizer dosage. These samples showed lower N content (Table 2) than ranges reported in other studies (13.2–19.8%), with similar N-NH4+/N-NO3- ratios [12]. Nevertheless, high N variability was found depending on the recovering technology used. The use of ammonium nitrate instead of ammonium sulfate was adopted in this experiment because of its higher N concentration. Moreover, as AN is obtained from NH3 rich air, it should not contain contaminants associated with carbon [12].

2.3. Struvite Dissolution Assays

Struvite has low solubility in water, with published pKsp values from 9.41 to 13.36 at 25 °C and pH 7 [29], and its dissolution is increased with decreasing pH [30]. In order to carry out a fertigation trial, a dissolution struvite experiment was performed to evaluate the impact of pH solution on P release rates from the three different struvite batches. The test was done under different pH conditions, kind of acid (citric/nitric acid), and struvite size (granular/ground). Seven grams of struvite were suspended in 250 mL irrigation water (Table S2) and pH was adjusted to achieve the target pH values (pH 6, 4, and 1), being continuously stirred. The suspension concentration and pH values were chosen due to agronomic interests. pH, electrical conductivity (CE), P, and NH4+ content were determined after 24 h to ensure that the equilibrium was reached. The conclusions of these tests were used to make up a concentrated NS (cNS) that would have all nutrients concentrated before being diluted (1:100) and adjusted to the final NS. From the practical point of view, the use of struvite in fertigation can be performed when preparing the fertilizers in an intermediate tank with a concentrated nutrient solution and the irrigation water composition must be considered.

2.4. Struvite and Ammonium Nitrate Fertigation Treatments

Three different compositions of NS were tested, differing on the P and N sources: (i) struvite (STR), with 100% and 17 ± 2% of P and N-recovered source, respectively; (ii) struvite and ammonium nitrate (SAN), with 100% and 34 ± 6% of P and N-recovered source, respectively; (iii) the conventional fertilization (CON) using solely synthetic fertilizers. The recovered sources were the P and N from ground struvite (batches DK 2018, DK 2019 and MU 2020) and the N-NH4+ from liquid AN. The reference P fertilizer used in the CON nutrient solution was KH2PO4. Other commercial fertilizers were used to complete the NS and to lower the pH, such as nitric acid, potassium nitrate, potassium sulfate, calcium nitrate, and micronutrients.
The fertigation system was established by 2 tanks per treatment, containing concentrated nutrient solution ×100 (cNS) to be released into passing irrigation water (pH 7.7 and CE 1.3 µS·cm−1) through venturi system with automatic control of irrigation (Figure 1b). The concentration of the different compounds that made up the cNS for each treatment is shown in Table 3.
Regarding the dripper nutrient solution (NS), the concentration of nutrients provided to the crops over the two growing seasons was guided by the agronomic expertise of the authors, following similar criteria explained in previous studies. Phosphorous was tried to adjust to 1 meq·L−1. Since the nitrogen concentration of 10 meq·L−1 used in 2019 involved a high N runoff, in 2020 a dynamic and lower N concentration of the NS was used, starting the first month with 5 meq·L−1, with 8 meq·L−1 during the next two months, and ending the crop cycle with 5 meq·L−1 again, 5-8-5, as is recommended by some authors to lower the concentration and provide dynamic responses to temporal N requirements, generally fixed for individual phenological phases [24,31]. The maximum N concentration used in this study of 10 meq·L−1 is similar or slightly lower than the commonly adopted for the cultivation of soilless tomato [16]. Since K+ concentrations in the drainage during 2019 were high, in 2020, the concentration in the NS was reduced from 6 to a dynamic 3-5-3 meq·L−1. As struvite is formed by Mg2+, it was considered as an extra input, so it was not matched in the reference treatment, being 3 and 5 meq·L−1 the concentrations for CON and STR/SAN treatments, respectively. All other micro and macro-elements (except sulfur) were prepared for being identical for all treatments. Effects of nitrate (NO3-) and ammonium (NH4+) ratio nutrition have been compared for many years with many horticultural plant species, having effects on plant growth, development, chemical composition, and metabolism [32]. Therefore, that aims to highlight the different fraction of mineral N applied as N-NO3- with the NS development among treatments, being 99 ± 1, 83 ± 6, and 65 ± 3% as mean values for CON, STR, and SAN, respectively, with the rest applied as N-NH4+.

2.5. Sampling and Chemical Characterization

The principal chemical properties of the recovered products were determined by the supplying company. The volume of the NS supplied and the drainage from one replicate per treatment collected separately was measured with water-meters (Figure 1c). Samples of dripper and drainage solution were collected weekly and analyzed in the laboratory for chemical parameters (pH, EC, P, NO3-, and NH4+). The concentration of nitrites was negligible (<2 mg·L−1). The total amount of nutrients leached was determined by multiplying the monthly drainage volume by the mean monthly nutrient concentration. The pH and EC were determined using a selective ion analyzer (Thermo Scientific Orion model Dual Star selective ion) and Crison conductivity meter (model GLP31), respectively. The P, NO3-, and NH4+ content were analyzed by APHA Standard Method 4500-P C. Vanadate-molybdate method, Spectroquant®Nitrate and Spectroquant®Ammonium Reagent Test, respectively, using a SPECTROQUANT nova 60 Spectrophotometer.

2.6. Fruit Yield, Quality, Biomass, and Agronomic Efficiency

Red tomato fruits were harvested at a maximum 7-day interval, with a total of 14 harvests from June to August in both years, and fresh production was weighed to obtain the total yield. Fruits that were deformed or showed symptoms of blossom-end rot were weighed separately as “non-marketable yield”. Marketable fruit yield consisted of tomato fruit that showed no signs of disease or deformation, and three samples (with 10 representative tomatoes each) per treatment, from different harvest periods, were graded according to their caliber, total suspended solids (TSS), individual weight, and color. At the end of the crop, the biomass (leaves, stem, and root) from five plants per repetition and treatment was dried at 60 °C after the fresh weight was determined. Three fruit and leaves samples per treatment were assessed for the concentration of nutrients and heavy metals by ICP-OES and Kjeldahl method. These last samples were analyzed just in one replicate per treatment.
The parameters used to evaluate the agronomic efficiency of the two recovered treatments compared with reference fertilizers were total and marketable yield, aboveground biomass, fruit quality, fruit and leaves nutrients concentration, and P and N uptake, which are shared among several studies. Crop N and P uptake were estimated by considering two components: (i) the harvested fruit and (ii) the “standing” biomass. During the crop, some pruning (removal of stems and leaves that are not part of the main stem) was not accounted for. For each component, the N and P uptake was determined from the total weight of yield/dry matter in kg·m−2 and the nutrient concentration in the fruit/leaves.

2.7. Statistical Analysis

The analyzed data were tested for normality and homogeneity of variance using Shapiro–Wilk test p > 0.05 and Levene’s test p > 0.05. Once these parameters were validated, a parametric statistical analysis was performed (one-way ANOVA and post hoc Tukey’s test with a significance level of 5%). Alternatively, non-parametric data were analyzed for significance using Kruskal–Wallis and Wilcoxon test (SAS version 9.4 and R-studio software) (Table S3).

3. Results and Discussion

3.1. Struvite Dissolution Assays

Struvite dissolution assays were found to be consistent among the different struvite batches, even the different technologies implemented to recover it and influent type may affect struvite quality [26].
To evaluate the struvite dissolved, the concentration of phosphate (P-PO4−3) was used. The percentage of soluble P obtained from struvite under different sizes, pH, and kind of acid conditions is shown in Table 4. Citric acid does not allow to achieve pH 1. Struvite was nearly fully solubilized at pH 4 and 1 with both acids and struvite sizes, with a mean percentage of P-obtained (percentage of P-solubilized from the total struvites’ P) of 85 ± 4%, meaning 3.1 ± 0.1 g-P·L−1 and 24 ± 1 g-struvite·L−1. They had a significantly higher percentage than pH 6, while no differences were obtained between struvite batches and the acid used. However, the use of citric acid allows certain microbial activity at pH 4 and nitrite formation that should be minimized to prevent plant toxicity.

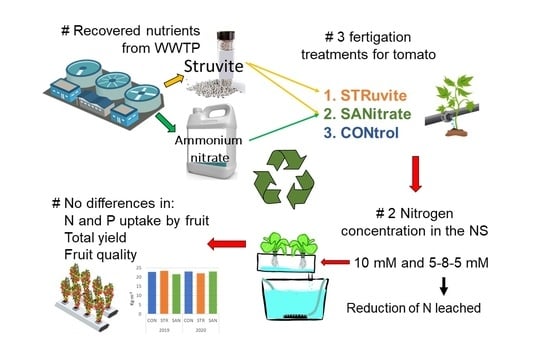
3.2. Struvite and Ammonium Nitrate Fertigation Treatments

Struvite solubilization results lead to prepare a concentrated nutrient solution (cNS) using nitric acid as acidifying agent [33], boosted by the low pH of the ammonium nitrate in SAN treatment [34], at pH range 1–2 to obtain an appropriate pH in the final dripper NS, considering the irrigation water properties. The cNS were kept constant during the assays, with pH values 1.2 ± 0.4 and 1.6 ± 0.5 for STR and SAN treatments, respectively.
Regarding the dripper NS, nutrients from recovered products (P, N, and Mg2+) were detected and supplied to the plants, manifesting a good performance of struvite dissolution under field conditions. However, as the dissolution of struvite is not total and the percentage of P-struvite can vary, is important to be aware of the P-obtained from the dripper. The N-NO3-/N-NH4+ concentrations in the NS were kept constant (Table S4), which exhibits a non-transformation of the ammonium while it is stored in the cNS. Table 5 shows the mean measured nutrient concentration provided to the crop for each treatment and year. In the 2019 campaign, CON treatment had some problems with the dosing dispenser over the experiment, suppling a 9–12% less total N and P than the other treatments, showing significant differences. Mg2+ supplied was significant for both years, due to the struvite composition. In order to keep the same K+ concentration among the different NS of the treatments, the use of potassium sulphate was needed; this is the reason why the different concentration of sulphate was obtained. Results from the 2020 campaign show a better adjustment for the NS composition among the three applied treatments; only three out of 10 parameters differ significantly.

3.3. Leachates: Volume, Composition, and Nutrient Losses (N and P)

Considering that the fertigation management (irrigation time, water applied (834 ± 79 and 816 ± 77 L·m−2, in 2019 and 2020, respectively) and climatic conditions) were similar for all treatments within a year, the leaching of water, P, and N concentrations were compared. Moreover, considering the two different N concentrations (10 mM and a dynamic 5-8-5 mM) supplied with the NS and the non-statistically significant total yield for both crop seasons, even being different tomato varieties, the N and P dynamics were compared between years. However, all the comparison results for the years of the study can be the result of the genetic characteristics of the tomato varieties and other studies should be performed to confirm the issue.
Firstly, the leached volume was 186 ± 41 and 168 ± 24 L·m−2 for 2019 and 2020, respectively, with mean leached volumes percentage in the range of 19–31% of the water supplied for all treatments and years. Regarding the P concentration leached within a year, no significant differences were found, except for April 2019, with higher values in STR treatment than SAN and CON (11 ± 4, 8 ± 3 and 4 ± 1 mg-P·L−1, respectively) and April 2020, with higher values in SAN treatment than CON and STR (12 ± 2, 9 ± 2 and 6 ± 2 mg-P·L−1, respectively). However, when considering the total amount leached, SAN and STR had higher values than CON in both years (3.9, 1.9, and 1.2 g-P·m−2 in 2019 and 0.8, 0.9, and 0.5 g-P·m−2, in 2020, representing 13.4, 6.7, 4.6, 3.4, 3.7, and 2.2% of the total P-supplied, respectively). Data reveals that the percentage of P-leached is lower when P concentration input is closer to 1 meq·L−1 and that most of the P has been either taken up by the plants or remains in the substrate. Figure 2a shows the monthly mean P-percentage leached per treatment and year, appreciating no differences among treatments.
Regarding the N concentration leached within the same year, no significant differences were found between treatments, except for April 2019 with higher N concentration in STR than SAN and CON, with 93 ± 36, 76 ± 35, and 54 ± 28 mg·L−1, respectively. However, when considering the total amount of N leached in 2019, STR had the lower value with 38 g-N·m−2, followed by CON and SAN with 43 and 60 g-N·m−2, respectively, representing 28, 36, and 45 % of the N-leached. The dispersion among months is quite high, yet all the treatments showed a higher concentration of N leached in July and June (Figure 2b; Table S5), on fruit development stage. Nevertheless, considering the N-leached percentage, the initial development stage (March and April) had also high values (19–37%) due to the small size of the plant. Thus, in the 2020 campaign, the N supplied was lower and dynamic, 5-8-5 meq·L−1. In the 2020 assay, the total amount of N leached was much lower, with values of 13, 11, and 8 g-N·m−2 for CON, STR, and SAN, respectively, representing 16, 14, and 9% of the total N-applied. Both years followed a similar dynamic, July and April of 2020 having higher N-leached percentages. Nevertheless, in the 2020 campaign, the periods of high N-leached were reduced in nutrient concentration and time. Figure 2a illustrates the mean N-percentage leached per treatment and year and Figure 2b the N concentration leached evolution along both campaigns. Vegetable crops are particularly susceptible to having low N uptake efficiencies caused by several characteristics of vegetable cropping (i.e., excess N input, shallow rooting, wide row spacing, short growing cycle, climate conditions) [17,35], being associated with N losses to the environment and subsequent negative environmental impacts. However, this study highlights the fact that N leached may be reduced by lowering the standard N concentration in NS to approximately 8 mM for a greenhouse soilless tomato crop under Mediterranean climatic conditions [17,24,36] and using a dynamic nutrient solution, due to its reduction in nutrient runoff, as other authors demonstrated [24,37]. Besides, some authors observed that a nutrient depletion at the end of the crop drives a fruit loading at the cost of N leaves reserves, suggesting an alternative strategy to limit N-waste [38].
However, when recommending a N concentration, it is important to consider the irrigation amount supplied, since it seems pointless to determine a critical N concentration in solution since high or low rates of nutrient combined with low or high N concentrations in solution may lead to similar plant growth rates and environmental pollution. Thus, in our study, the mean amount of N leached was 47 ± 11 and 11 ± 3 g-N·m−2 in 2019 and 2020, respectively. Even the N leached by 10 mM-N treatment is lower than that estimated by the regional N balance for the main greenhouse growing area in SE Spain, which suggested that N supplied annually by all sources, in soil and soilless trials, exceeds crop N uptake by 517–1058 kg-N·ha−1 [39,40]. In soil crops, is it suggested the use of technology to schedule irrigation to reduce drainage amount, which substantially restricts the N losses. However, in a soilless trial, is it important to maintain a certain percentage of drainage to avoid salt accumulation in the “wet bulb”.
In the 2020 campaign, the N-NH4+ was analyzed. Regarding the effects of the different N-NO3-/N-NH4+ ratio applied by the different treatments in the leachates, even no significant differences were detected except for August-20, the mean percentage of N-NH4+ from the total N leached in 2020 was higher in SAN, followed by STR and CON, with 15, 8, and 3.5%, respectively. These results suggest that there was a partial nitrification process of the ammonium in the soilless cropping system, probably due to the low retention of the perlite. However, the growing season effect is remarkable, thus, N-NH4+ does not usually have an adverse effect in summer weather due to rapid transformation and vigorous plant growth [41].

3.4. Fruit Yield, Quality, and Biomass

In both years’ assays, there were no significant differences in total yield between treatments. That means that the recovered products rich in N and P can substitute the conventional fertilizers without bad effects in tomato production. However, the marketable yield varies, being SAN treatment lower than CON in 2019, and STR treatment lower than SAN (but without differences with CON) in 2020 (Table 6). Even so, no significant differences were observed in fruit quality (g·fruit−1, caliber, and total soluble solids (SST)). The percentage of non-marketable fruits in 2019 was remarkable, but it was not influenced by treatment (results not showed). The tomato variety and high mean temperatures could explain that, mostly due to blossom-end rot [24]. Moreover, a high NH4+/NO3- ratio could produce a reduction in marketable fruit for SAN treatment, in agreement with other authors [42], being important to consider the ammonium tolerance of the plant species. As struvite use as raw material for a nutrient solution has not been investigated to our knowledge, no comparison to other studies can be done. Still, some authors [12] found no significant differences in respect to fertilizer performance of AN as compared to the conventional use of synthetic N fertilizers in lettuce and maize crop, indicating that recovered AN are valuable N sources and therefore might be used as N fertilizers in crop cultivation.
Regarding total biomass (Table 6), STR treatment shows more weight per unit of surface than the rest in 2019, being the treatment that received higher N input. Moreover, in 2020, when the N input was reduced, the total biomass did too. According to these results, several authors correlate positively the N availability with dry matter accumulation [43] and the tendency to allocate biomass to vegetative tissue while there is no increase or decrease in fruit production, the well-known phenomena of excess N favoring vegetative growth [44].
All the fruits’ nutrients concentrations obtained are in concordance with published data [45,46] without detecting any type of deficiency or stress, being the magnesium the only nutrient that showed significant differences within the same year, in the 2020 trial, with a higher amount in recovered treatments (STR and SAN) due to struvite composition (Table 4). However, nutrient leaves’ content exhibited more dispersion in 2019, with a higher content of P and N in STR and SAN treatments (Table 4), probably due to the higher amount supplied as other authors reported [8]. These results confirm a good performance of the recovered products in the NS. Moreover, the analysis of heavy metals on fruit showed lower values than the ICP-AES detection threshold for Cd, Cr, Hg, Ni, and Pb. For Cu and Zn, CON had similar values than the other treatments (Table S6), evidencing the security for health and environmental risk.

3.5. P and N Crop Uptake

P uptake by tomato plants increased significantly in STR and SAN, compared with CON in 2019, due to a higher P concentration in the NS (Figure 3, Table S7). However, what particularly increased was the P content in crop aerial biomass, but not in fruits, with no effects on total yield, as reported by other authors [47]. Thus, in the 2020 campaign, when the P concentration between treatments was similar, no differences in the amount of P uptake were detected. Besides, the mean percentage for all treatments of P uptake from the total P supplied in 2020 was 54 ± 9% (30 ± 6% for biomass and 24 ± 7% for fruit), similar to other studies in hydroponics [33].
N uptake showed significant differences only in N-aerial biomass, mainly in STR and SAN in 2019, indicating a similar tendency as P when the concentration in the NS is higher. However, when comparing the percentage of N uptake by the biomass from the total N applied, no differences are found within a year, meaning that the more nitrogen is applied, the more is absorbed by the biomass. These results agree with the conclusions obtained when comparing amongst both crop seasons, where the percentage of N uptake by the biomass is similar, being 24 ± 4% for both years, as other authors reported for tomato crops [33]. However, there are significant differences among the fruits and the total N uptake, this last with values of 42 ± 3 and 59 ± 5% for 2019 and 2020, respectively (Figure 4), considering a better N uptake efficiency with the 5-8-5 meq-N·L−1 NS. Even so, some studies associate environmental pollution to the limited crop uptake of applied nutrients, often 30–40% of applied N, by fast-growing vegetable species [48].

4. Conclusions

This study showed that struvite and ammonium nitrate products used as fertilizers in fertigation systems for tomato crops were equally effective in total yield and quality product compared to conventional fertilizers. For the first time, struvite has been used in fertigation in edible crops and this use has been fully successful. However, there were some differences in marketable yield for SAN treatment.
Furthermore, our results show that for soilless tomato cultivation under Mediterranean climatic conditions, the concentration of N in the nutrient solution can be reduced to a dynamic 5-8-5 meq·L−1 without reducing yield or physical quality, which may cause the reduction of nitrogen leaching.
These results give insight into the urgent need for more sustainable crop management reducing the fertilizer demand. Further studies should investigate the agronomic and environmental fertilizer performance of struvite and ammonium nitrate under varying plant species, substrates, climatic and geographical conditions, and keep focusing on sustainable crop management.

Supplementary Materials

The following are available online at www.mdpi.com/2077-0472/11/11/1063/s1, Figure S1: Experimental scheme of the study; Table S1: Characterization of recovered struvite product based on the current legal framework in the revised fertilizer directive and in the temporary STRUBIAS document; Table S2: Chemical analysis of irrigation water; Table S3: Non-parametric variables (analyzed for significance using Kruskal–Wallis p < 0.05 and Wilcoxon test); Table S4: N-NH4+, N-NO3-, and N-total concentration of the nutrient solutions (NS) along the experiment (mean ± SD); Table S5: Nitrogen leached concentration measured along the experiments (mean ± SD); Table S6: Analysis of heavy metals on fruit and leaves (n = 1); Table S7. P and N uptake in aerial biomass (stems and leaves), fruit and both (total) for all treatments and years (mean ± SD).

Author Contributions

Conceptualization, methodology: all authors; data curation, writing—original draft preparation: M.C.-S.; supervision and writing—reviewing and editing: R.C., M.V. and C.B. All authors have read and agreed to the published version of the manuscript.

Funding

This paper was written in the framework of the research project LIFE ENRICH (Enhanced nitrogen and phosphorous recovery from wastewater and integration in the value chain) [LIFE16 ENV/ES/000375]. IRTA received the support of the CERCA Program–Generalitat de Catalunya. Researchers from Sustainability in Biosystems program belong to the Consolidate Research Group TERRA (2017 SGR 1290, Generalitat de Catalunya-Catalan Government).

Data Availability Statement

Not applicable.

Acknowledgments

This work has been written within the framework of the doctoral program of the Institute of Environmental Science and Technology of the Universitat Autònoma de Barcelona (ICTA-UAB). The authors would also like to acknowledge the technical support contribution of some people, especially Carmen Bellido and Anna Puerta, and the constructive comments posed by the anonymous reviewers during the peer-review process, which helped to improve the final version of the paper.

Conflicts of Interest

The authors declare no conflict of interest.

References

  1. Chowdhury, R.B.; Moore, G.A.; Weatherley, A.J.; Arora, M. Key sustainability challenges for the global phosphorus resource, their implications for global food security, and options for mitigation. J. Clean. Prod. 2017, 140, 945–963. [Google Scholar] [CrossRef]
  2. Preisner, M.; Neverova-Dziopak, E.; Kowalewski, Z. Mitigation of eutrophication caused by wastewater discharge: A simulation-based approach. Ambio 2021, 50, 413–424. [Google Scholar] [CrossRef] [PubMed]
  3. Li, B.; Boiarkina, I.; Yu, W.; Minh Huang, H.; Munir, T.; Wang, G. Young, B. Phosphorous recovery through struvite crystallization: Challenges for future design. Sci. Total. Environ. 2019, 648, 1244–1256. [Google Scholar] [CrossRef] [PubMed]
  4. Magrí, A.; Carreras-Sempere, M.; Biel, C.; Colprim, J. Recovery of phosphorus from waste water profiting from biological nitrogen treatment: Upstream, concomitant or downstream precipitation alternatives. Agronomy 2020, 10, 1039. [Google Scholar] [CrossRef]
  5. Vecino, X.; Reig, M.; Gibert, O.; Valderrama, C.; Cortina, J.L. Integration of liquid-liquid membrane contactors and electrodialysis for ammonium recovery and concentration as a liquid fertilizer. Chemosphere 2020, 245, 125606. [Google Scholar] [CrossRef]
  6. Huygens, D.; Saveyn, H.G.M. Agronomic efficiency of selected phosphorus fertilisers derived from secondary raw materials for European agriculture. A meta-analysis. Agronomy for sustainable development. Agron. Sustain. Dev. 2018, 38, 52. [Google Scholar] [CrossRef] [Green Version]
  7. Degryse, F.; Baird, R.; da Silva, R.C.; McLaughlin, M.J. Dissolution rate and agronomic effectiveness of struvite fertilizers—Effect of soil pH, granulation and base excess. Plant Soil 2017, 410, 139–152. [Google Scholar] [CrossRef]
  8. Arcas-Pilz, V.; Rufí-Salís, M.; Parada, F.; Petit-Boix, A.; Gabarrell, X.; Villalba, G. Recovered phosphorus for a more resilient urban agriculture: Assessment of the fertilizer potential of struvite in hydroponics. Sci. Total. Environ. 2021, 799, 149424. [Google Scholar] [CrossRef]
  9. EC. Regulation (EU) 2019/1009 of the European Parliament and of the Council of 5 June 2019 Laying down Rules on the Making Available on the Market of EU Fertilizing Products and Amending Regulations (EC) no 1069/2009 and (EC) no 1107/2009 and Repealing Regulation (EC) no 2003/2003 (Text with EEA Relevance). European Parliament. 2019. Available online: https://eur-lex.europa.eu/legal-content/EN/TXT/?uri=CELEX%3A32019R1009 (accessed on 24 October 2021).
  10. Huygens, D.; Saveyn, H.; Tonini, D.; Eder, P.; Sancho, L.D. DRAFT STRUBIAS Technical Proposals—DRAFT Nutrient Recovery Rules for Recovered Phosphate Salts, Ash-Basedmaterials and Pyrolysis Materials in View of Their Possible Inclusion as Component Material Categories in the Revised Fertiliser Regulation. Comission J-E. 2017. Available online: https://phosphorusplatform.eu/images/download/STRUBIAS-draft-report-24-5-17-I.pdf (accessed on 24 October 2021).
  11. Van der Hoek, J.P.; Duijff, R.; Reinstra, O. Nitrogen recovery from wastewater: Possibilities, competition with other resources, and adaptation pathways. Sustain. Switz. 2018, 10, 4605. [Google Scholar] [CrossRef] [Green Version]
  12. Sigurnjak, I.; Brienza, C.; Snauwaert, E.; De Dobbelaere, A.; De Mey, J.; Vaneeckhaute, C.; Michels, E.; Schoumans, O.; Adani, F.; Meers, E. Production and performance of bio-based mineral fertilizers from agricultural waste using ammonia (stripping-)scrubbing technology. Waste Manag. 2019, 89, 265–274. [Google Scholar] [CrossRef]
  13. VLM. Normen en Richtwaarden. Flemish Land Agency, Brussels, Belgium. 2016. Available online: https://www.vlm.be/nl/SiteCollectionDocuments/Publicaties/mestbank/bemestingsnormen_2016.pdf (accessed on 24 October 2021).
  14. Narváez, L.; Cáceres, R.; Marfà, O. Effects of climate and fertilization strategy on nitrogen balance in an outdoor potted crop of Viburnum tinus L. Span. J. Agric. Res. 2012, 10, 471. [Google Scholar] [CrossRef] [Green Version]
  15. Narváez, L.; Cáceres, R.; Marfà, O. Effect of different fertilization strategies on nitrogen balance in an outdoor potted crop of Osteospermum ecklonis (DC.) Norl. “Purple Red” under Mediterranean climate conditions. Span. J. Agric. Res. 2013, 11, 833. [Google Scholar] [CrossRef] [Green Version]
  16. Massa, D.; Magán, J.J.; Montesano, F.F.; Tzortzakis, N. Minimizing water and nutrient losses from soilless cropping in southern Europe. Agric. Water Manag. 2020, 241, 106395. [Google Scholar] [CrossRef]
  17. Thompson, R.B.; Incrocci, L.; Voogt, W.; Pardossi, A.; Magán, J.J. Sustainable irrigation and nitrogen management of fertigated vegetable crops. Acta Hortic. 2017, 1150, 363–378. [Google Scholar] [CrossRef]
  18. Good, A.G.; Beatty, P.H. Fertilizing nature: A tragedy of excess in the commons. PLoS Biol. 2011, 9, e1001124. [Google Scholar] [CrossRef]
  19. Veresoglou, S.D.; Barto, E.K.; Menexes, G.; Rillig, M.C. Fertilization affects severity of disease caused by fungal plant pathogens. Plant Pathol. 2012, 62, 961–969. [Google Scholar] [CrossRef]
  20. Sonneveld, C.; Voogt, W. Nutrient Solutions for Soilless Cultures. In Plant Nutrition of Greenhouse Crops; Springer: Dordrecht, The Netherlands, 2009; pp. 1–431. [Google Scholar] [CrossRef]
  21. Cáceres, R.; Marfà, O. Diagnosis of the fertility of compost-based growing media: Method comparison and monitoring in pot plant cultivation. Sci. Hortic. 2013, 164, 213–220. [Google Scholar] [CrossRef]
  22. Gallardo, M.; Elia, A.; Thompson, R.B. Decision support systems and models for aiding irrigation and nutrient management of vegetable crops. Agric. Water Manag. 2020, 240, 106209. [Google Scholar] [CrossRef]
  23. Martínez-Gaitán, C.; Granados, M.R.; Fernández, M.D.; Gallardo, M.; Thompson, R.B. Recovery of 15N labeled nitrogen fertilizer by fertigated and drip irrigated greenhouse vegetable crops. Agronomy 2020, 10, 741. [Google Scholar] [CrossRef]
  24. Muñoz, P.; Antón, A.; Paranjpe, A.; Ariño, J.I.; Montero, I. High decrease in nitrate leaching by lower N input without reducing greenhouse tomato yield. Agron. Sustain. Dev. 2008, 28, 489–495. [Google Scholar] [CrossRef] [Green Version]
  25. MAPA. Superficies y Producciones Anuales de Cultivo de Acuerdo con el Reglamento (CE) 543/2009 2020. Available online: https://www.mapa.gob.es/es/estadistica/temas/estadisticas-agrarias/agricultura/superficies-producciones-anuales-cultivos/ (accessed on 9 August 2021).
  26. Muys, M.; Phukan, R.; Brader, G.; Samad, A.; Moretti, M.; Haiden, B.; Pluchon, S.; Roest, K.; Vlaeminck, S.E.; Spiller, M. A systematic comparison of commercially produced struvite: Quantities, qualities and soil-maize phosphorus availability. Sci. Total. Environ. 2021, 756, 143726. [Google Scholar] [CrossRef]
  27. EC. Regulation (European Comission) No 2003/2003 of the European Parliament and of the Council of 13 October 2003 relating to fertilisers. Off. J. Eur. Commun. 2003, L304, 1–194. [Google Scholar]
  28. EC. Circular economy packages. Annexes to the Proposal for a regulation of the European Parliament and of the Council laying down rules on the making available on the market of CE marked fertilising products and amending Regulations (EC) No 1069/2009 and (EC) No 1107/2009. 2016. Available online: https://www.europarl.europa.eu/doceo/document/A-8-2017-0270_EN.html (accessed on 24 October 2021).
  29. Bhuiyan, M.I.H.; Mavinic, D.S.; Beckie, R.D. A solubility and thermodynamic study of struvite. Environ. Technol. 2007, 28, 1015–1026. [Google Scholar] [CrossRef]
  30. Rahaman, M.S.; Mavinic, D.S.; Bhuiyan, M.I.H.; Koch, F.A. Exploring the determination of struvite solubility product from analytical results. Environ. Technol. 2006, 27, 951–961. [Google Scholar] [CrossRef]
  31. Sanjuan-Delmás, D.; Josa, A.; Muñoz, P.; Gassó, S.; Rieradevall, J.; Gabarrell, X. Applying nutrient dynamics to adjust the nutrient-water balance in hydroponic crops. A case study with open hydroponic tomato crops from Barcelona. Sci. Hortic. 2020, 261, 108908. [Google Scholar] [CrossRef]
  32. Britto, D.T.; Kronzucker, H.J. Ecological significance and complexity of N-source preference in plants. Ann. Bot. 2013, 112, 957–963. [Google Scholar] [CrossRef] [Green Version]
  33. Thompson, R.B.; Martínez-Gaitan, C.; Gallardo, M.; Giménez, C.; Fernández, M.D. Identification of irrigation and N management practices that contribute to nitrate leaching loss from an intensive vegetable production system by use of a comprehensive survey. Agric. Water Manag. 2007, 89, 261–274. [Google Scholar] [CrossRef]
  34. Vaneeckhaute, C.; Meers, E.; Michels, E.; Ghekiere, G.; Accoe, F.; Tack, F.M.G. Closing the nutrient cycle by using bio-digestion waste derivatives as synthetic fertilizer substitutes: A field experiment. Biomass Bioenergy 2013, 55, 175–189. [Google Scholar] [CrossRef] [Green Version]
  35. Soto, F.; Gallardo, M.; Thompson, R.B.; Peña-Fleitas, M.T.; Padilla, F.M. Consideration of total available N supply reduces N fertilizer requirement and potential for nitrate leaching loss in tomato production. Agric. Ecosyst. Environ. 2015, 200, 62–70. [Google Scholar] [CrossRef]
  36. Massa, D.; Bonetti, A.; Cacini, S.; Faraloni, C.; Prisa, D.; Tuccio, L.; Petruccelli, R. Correction to: Soilless tomato grown under nutritional stress increases green biomass but not yield or quality in presence of biochar as growing medium. Hortic. Environ. Biotechnol. 2019, 60, 871–881. [Google Scholar] [CrossRef]
  37. Vázquez, N.; Pardo, A.; Suso, M.L.; Quemada, M. Drainage and nitrate leaching under processing tomato growth with drip irrigation and plastic mulching. Agric. Ecosyst. Environ. 2006, 112, 313–323. [Google Scholar] [CrossRef]
  38. Siddiqi, M.Y.; Kronzucker, H.J.; Britto, D.T.; Glass, A.D.M. Growth of a tomato crop at reduced nutrient concentrations as a strategy to limit eutrophication. J. Plant Nutr. 1998, 21, 1879–1895. [Google Scholar] [CrossRef]
  39. Bot, J.L.; Jeannequin, B.; Fabre, R. Growth and nitrogen status of soilless tomato plants following nitrate withdrawal from the nutrient solution. Ann. Bot. 2001, 88, 361–370. [Google Scholar] [CrossRef] [Green Version]
  40. Jadoski, S.; Thompson, R.B.; Peña-Fleitas, M.T.; Gallardo, M. Regional N balance for an intensive vegetable production system in South-Eastern Spain. In Book of Abstracts, International Workshop on Nitrogen, Environment and Vegetables. NEV 2013; Università degli Studi di Torino: Turin, Italy, 2013; pp. 50–51. [Google Scholar]
  41. Atherton, J.; Rudich, J. The Tomato Crop. A Scientific Basis for Improvement; Springer: Dordrecht, The Netherlands, 1986. [Google Scholar] [CrossRef]
  42. Halbert-Howard, A.; Häfner, F.; Karlowsky, S.; Schwarz, D.; Krause, A. Correction to: Evaluating recycling fertilizers for tomato cultivation in hydroponics, and their impact on greenhouse gas emissions. Environ. Sci. Pollut. Res. 2020. [Google Scholar] [CrossRef]
  43. Tei, F.; Benincasa, P.; Guiducci, M. Critical nitrogen concentration in lettuce. Acta Hortic. 2003, 627, 187–194. [Google Scholar] [CrossRef]
  44. Elia, A.; Conversa, G. Agronomic and physiological responses of a tomato crop to nitrogen input. Eur. J. Agron. 2012, 40, 64–74. [Google Scholar] [CrossRef]
  45. Colla, G.; Mitchell, J.P.; Poudel, D.D.; Temple, S.R. Changes of tomato yield and fruit elemental composition in conventional, low input, and organic systems. J. Sustain. Agric. 2002, 20, 53–67. [Google Scholar] [CrossRef]
  46. Soylemez, S.; Pakyurek, A.Y. Effect of Different Tomato Rootstocks and EC Levels on the Nutrient of Fresh Tomatoes. Int. J. Sci. Technol. Res 2018, 4, 9. [Google Scholar]
  47. Ylivainio, K.; Jauhiainen, L.; Uusitalo, R.; Turtola, E. Waterlogging severely retards P use efficiency of spring barley (Hordeum vulgare). J. Agron. Crop. Sci. 2018, 204, 74–85. [Google Scholar] [CrossRef]
  48. Colla, G.; Rouphael, Y. Biostimulants in horticulture. Sci. Hortic. 2015, 196, 1–2. [Google Scholar] [CrossRef]
Figure 1. Tomato trial design. (a) Plants are placed in lines with five bags per replication, each providing substrate for three plants; (b) fertigation system containing each concentrated nutrient solution ×100 (cNS) per treatment, to be released into passing irrigation water through venturi system with automatic control of irrigation; (c) drainage system from one replicate per treatment for volume measurement with water-meters and sample collection.
Agriculture 11 01063 g001
Figure 2. (a) P and N leached percentage per treatment and year (mean ± standard error (SE) of n = 5); (b) monthly average N concentration leached along the growing season per treatment and year (mean ± SE of n = 5 per treatment). The number next to the treatment name indicates the year campaign.
Agriculture 11 01063 g002
Figure 3. P (left) and N (right) allocation in fruits and aerial biomass (g·m−2) (mean ± SE of n = 3). Within each nutrient, letters indicate statistical differences according to Tukey test (p > 0.05).
Agriculture 11 01063 g003
Figure 4. Percentage of N uptake by biomass and fruits per year (mean ± SE of n = 9). Letters indicate statistical differences according to Tukey test (p > 0.05) between years.
Agriculture 11 01063 g004
Table 1. Average indoor global radiation (MJ·m−2·day−1), temperature (°C), maximum temperature (°C), and relative humidity (%) (mean ± SD).
Campaign 2019MarchAprilMayJuneJulyAugust
Indoor global radiation (MJ·m²·day−1)9.7 ± 29.2 ± 3.311.6 ± 4.413.7 ± 412.6 ± 2.613.7 ± 1.9
Temp. (°C)16.6 ± 5.117.6 ± 4.220.1 ± 4.725.4 ± 5.328 ± 428.9 ± 4
Maximum temp. (°C)24 ± 2.224 ± 1.726.4 ± 2.631.3 ± 3.733.3 ± 1.433.5 ± 3
Relative humidity (%)52 ± 18.958.9 ± 15.861.3 ± 15.556.1 ± 16.464.7 ± 1360.3 ± 14.7
Campaign 2020
Indoor global radiation (MJ·m²·day−1) 9.2 ± 411.2 ± 4.613.4 ± 2.413.1 ± 3.513 ± 1.6
Temp. (°C) 19.8 ± 423.2 ± 525.6 ± 4.529 ± 4.329.8 ± 4.3
Maximum temp. (°C) 25.7 ± 2.430.6 ± 3.931.2 ± 2.331.4 ± 10.635.6 ± 2.6
Relative humidity (%) 66.5 ± 16.658.9 ± 17.562.2 ± 14.458.1 ± 13.359.8 ± 14
Table 2. Average phosphorous (P-PO43−), nitrogen (N-NH4+), and magnesium (Mg2+) content of struvite batches (mass%) and N-NH4+, N-NO3, and N-total content of ammonium nitrate batches (mass% w/v) (mean ± standard deviation (SD)).
Struvite BatchPO43−NH4+Mg2+
DK 201812.9 ± 0.037.2 ± 0.310.3 ± 0.6
DK 201910.8 ± 0.47.3 ± 0.29.8 ± 0.3
MU 202013.15.68.2
Ammonium nitrate batchN-NO3N-NH4+N-total
AN 20196.1 ± 0.84 ± 0.710.1 ± 1.5
AN 20203.8 ± 1.13.3 ± 1.07.1 ± 2.1
Table 3. Concentrated nutrient solution (cNS) composition (g·L−1) for each treatment and campaign. CON: conventional fertilization treatment; STR: struvite fertilization treatment; SAN: struvite + ammonium nitrate fertilization treatment.
g·L−1 Concentrated Solution
Campaign 2019Campaign 2020
Initial/Final NSDevelopment NS
Conventional fertilizersCONSTRSANCONSTRSANCONSTRSAN
Nitric acidHNO327.228.420.75.126.119.226.826.820.7
Potassium nitrateKNO339.430.3 20.2 23.210.1
Potassium sulfateK2SO49.126.152.2 26.126.122.642.651.3
Monopotassium phosphateKH2PO413.6 13.6 13.6
Calcium nitrateCa(NO3)216.416.416.4 16.416.416.4
Magnesium nitrateMg(NO3)2 12.8
Recovered fertilizers
StruviteNH4MgPO4·6H2O 28.728.7 23.723.7 23.723.7
Ammonium nitrateNO3NH4 60 17.8 32
Table 4. Percentage of P-solubilized from struvite under different sizes, pH, and kind of acid conditions (mean ± SD of n = 3).
SamplepHP-Solubilized (%)
Citric AcidNitric Acid
Granular6 ± 0.322 ± 820 ± 3
Ground22 ± 519 ± 7
Granular3.7 ± 0.786 ± 479 ± 9
Ground87 ± 1381 ± 6
Granular1.2 ± 0.3-88 ± 6
Ground-87 ± 4
Table 5. Average measured nutrient concentration (meq L−1), pH, and EC (dS/m) in the nutrient solution for each treatment and year. For 2020, except for N, the values are from the development NS. Within each year letters indicate statistical differences (p < 0.05) followed by the p-value. N.S.: not significantly different.
TreatmentsNutrient Concentration (Meq·L−1)dS/m
NH2PO42-K+Ca2+Mg2+Na+SO42-Cl-ECpH
Campaign 2019
CON9.1 b0.9 b5.38.62.8 b3.85.9 c5.61.9 b6.4 c
STR10.7 a1.2 a6.68.95.2 a3.89.1 b5.62.2 a6.5 b
SAN10.3 ab1.1 a6.68.85.2 a3.813.6 a5.82.2 a7.0 a
p-value0.0058<0.0001N.SN.S0.0003N.S0.0001N.S0.0023<0.0001
Campaign 2020
CON4, 3–8, 2–515.58.83.1 b3.85.7 b4.62.16.4 c
STR4, 6–7, 8–5, 20.95.08.24.7 a3.57.9 a4.62.16.8 b
SAN5–8, 1–5, 30.93.38.64.5 a3.18.7 a4.62.26.9 a
p-valueN.SN.SN.SN.S<0.0001N.S<0.0001N.SN.S<0.0001
Table 6. Total and marketable fruit yield, quality of tomato (weight, caliber (mm), and Total Soluble Solids TSS (°Brix)) and total biomass cv.Bond and Egara for 2019 and 2020, respectively. Average macronutrient concentration in fruits and leaves. Within years, letters indicate statistical differences (p < 0.05) followed by the p-value. N.S.: not significantly different.
Total FruitMarketable FruitBiomassFruitLeaves
YieldYieldFruit QualityTotalNPMgKCaNPMgKCa
kg·m−2kg·m−2g/FruitCaliberTSS kg·m−2mg/100 g Wet Basis%, Dry Basis
Campaign 2019CON22.814.7 a278.881.55.31.16 b110257.41995.82.2 b0.6 b1.35.6 a4.4 b
STR23.313.3 ab253.979.85.41.38 a9622.76.518352.8 a1.2 a1.83.2 b7.8 a
SAN21.612.5 b240.978.05.51.20 ab10323.36.11784.83.0 a1.6 a1.54.2 ab5.5 b
p-valueN.S0.0455N.SN.SN.S0.031N.SN.SN.S.N.SN.S0.0080.003N.S.0.0130.004
Campaign 2020CON2320.1 ab248.581.44.51,0810622.76.9 b2137.22.40.911.78.8
STR2218.8 b223.678.94.60,9312625.47.7 ab2116.92.10.71.51.58.1
SAN2320.7 a230.679.74.60,913527.38.3 a2266.32.411.51.68.3
p-valueN.S.0.0082N.S.N.S.N.S.N.S.N.SN.S0.0386N.S.N.S.N.S.N.S.N.S.N.S.N.S.
Publisher’s Note: MDPI stays neutral with regard to jurisdictional claims in published maps and institutional affiliations.

