
Underutilised Indigenous Vegetables for Household Dietary Diversity in Southwest Nigeria
by
 , , and
Victoria Adeyemi Tanimonure
1,* ,
,
Diego Naziri
2,
Samuel Nii Ardey Codjoe
3 and
Adeolu Babatunde Ayanwale
1 1
Department of Agricultural Economics, Obafemi Awolowo University, Ile-Ife 220282, Nigeria
2
International Potato Center, Hanoi, Vietnam and Natural Resources Institute, University of Greenwich, Chatham ME4 4TB, UK
3
Regional Institute of Population Studies, Legon Campus, University of Ghana, Accra 0302, Ghana
*
Author to whom correspondence should be addressed.
Agriculture 2021, 11(11), 1064; https://doi.org/10.3390/agriculture11111064
Submission received: 24 May 2021
/
Revised: 27 August 2021
/
Accepted: 3 September 2021
/
Published: 28 October 2021
(This article belongs to the Special Issue Agricultural Food Security and Economic Analysis)
Abstract
:The diets of many households in developing countries are monotonous and starch-based. Integrating underutilised indigenous vegetables (UIVs) to cropping systems can contribute to both crop and dietary diversities, thereby improving rural households’ nutrition and boosting food security. Therefore, this study established a link between the UIVs’ diversity and the household dietary diversity (HDD) of the UIVs producers in the rural area of Southwest Nigeria. A multistage sampling technique was used to select 191 UIV-producing households in the region. Their HDD was measured based on the 12 unique food groups consumed by households over a 7-day reference period preceding the survey, and negative binomial Poisson regression analysis was used to determine the relationship between UIV diversities, other sociodemographic characteristics, and the HDD score of the UIV-producing households in the area. The results showed that only about four groups of food contributed greatly to the HDD score. The result of the negative binomial Poisson regression analysis showed UIVs diversity as a significant variable that increased the HDD score in the study area. Other factors that determined the HDD score of UIV-producing households were the marital status of the household head, farm distance from the home, UIVs land area, off-farm income, UIVs gross margin, per capita food expenditure, and Oyo location. The study concluded that the inclusion of diverse underutilised indigenous vegetables into cropping systems in rural areas and vegetable home gardening practices in the rural and urban areas of developing countries could alleviate the challenge of nutrition insecurity.
1. Introduction
There are links between the promotion of diversity in food crops, indigenous vegetables, and optimum nutritional status [1]. Households with high agricultural production diversity are likely to have a high household dietary diversity score (HDDS), and this is likely to impact positively on their nutrition security [2]. However, researchers still advocate for more research to be done to better understand the role that agro-biodiversity plays on nutrition and dietary outcomes [1].
Meanwhile, it is unfortunate that food production approaches to date have culminated in increasing dependence on a small number of crops. This has been linked to poorer nutrition, especially in developing countries [3,4,5], where the household food demand pattern is monotonous and mainly dependent on a handful of starch-based foods like yam, cassava, maize, and rice, which are believed to be cheaper compared with micronutrient-dense foods. Less demand is usually placed on micronutrient-based food sources like vegetables and protein [6,7]. This is probably because many people in rural areas are poor and, as such, cannot afford to pay for more nutritious food items.
Therefore, there is a need to harness agro-biodiversity in our food systems in order to enhance traditional food systems that make use of it. Sadly, only 30 crops provide 90 percent of the world’s food energy intake, and only four, rice, wheat, maize, and potatoes, supply 50 percent of the world’s food energy needs [8]; additionally, only 150 crops are commercialized on a significant global scale. This has led to a narrowed food base, which is a global phenomenon and a worst-case scenario in Africa [8]. This has also been pinpointed as an important factor affecting dietary diversity in developing countries [3].
Meanwhile, ethnobotanics surveys estimated 300,000 plant species worldwide, out of which only 3.3 percent have been used for human food since agriculture started approximately 7000 years ago [8]. These species are an enormous wealth of agrobiodiversity and have great potential for contributing to improved incomes, dietary diversity, and food security and nutrition and for combating the “hidden hunger” caused by micronutrient (vitamin and mineral) deficiencies. However, they are underutilised [4].
The term “underutilised” is applied to a wide range of different crop species that are recognized as being used to a relatively small degree of their potential. Underutilised indigenous vegetables (UIVs) are, therefore, vegetables that were once grown more widely or intensively but which are falling into disuse for a variety of agronomic, genetic, economic, and cultural reasons—they are species whose potentials have not been fully realized [5].
Until recently, the importance of UIVs has been largely unrecognized and unacknowledged by agricultural policy- and decision-makers, technology providers, researchers, extension agents, and donor organizations. This is because, generally, UIVs have very limited commercial appeal, and, as such, they are less competitive when compared with other species in the agricultural environment. They are associated with subsistence farming and are limited to household consumption and informal trading systems [9].
In the intervening time, a number of studies have drawn the attention of the larger society to the roles that UIVs play in more sustainable local livelihoods. There is a growing recognition of the role of underutilised crops in maintaining biodiversity, contributing to incomes in rural communities, and serving as an important safety net for resource-poor smallholder farmers as these crops need fewer inputs for their production. They are often naturally resistant to the pests and diseases of the local agro-ecology as they are uniquely adapted to the environment they grow in [9,10,11,12,13,14,15].
Another main attribute of these UIV plant species, about which many researchers are in consonance with, is their contribution towards more balanced diets. They provide micronutrients and vitamins in developing countries whose diets are predominantly based on starchy staples that include little or no animal product and few fruits and vegetables [16,17,18,19,20,21,22,23]. Numerous studies have shown that consuming a diverse diet (diverse vegetables) is related to a better-quality diet and proper nutrition around the world [18,24,25,26,27]. Therefore, the diversity of diet could be related to the diet quality, which could lead to good health and can be used as an instrument to measure food security [28,29].
A large number of studies exist on the association between DD and nutritional security. A significant number of them focused on the relationship between dietary diversity and associated factors such as child growth, child malnutrition, nutrient adequacy, and nutrient quality [30,31,32]. Most of these studies established a positive and significant relationship between the consumption of more diverse diets and the associated factors.
In recent times, studies have made attempts to establish causality between crop diversity and the HDD of farming households. For instance, ref. [33] measures the effects that crop diversification, identified by the number of crops produced by rural households has on the HDD and the amount of crop income from eight developing countries. They found that the link between the number of crops produced and dietary diversity indicators is positive and significant and therefore concluded that crop diversification has a double role: it has impact on HDD and also increases agricultural revenue.
Akerele [34] posed the question of whether food production diversity can influence farm households’ dietary diversity. Their findings suggested that the linkage between farm production diversity and dietary diversity is complex because of other variables such as food prices, which may come into play. This notwithstanding, more diverse production systems substantially stimulate consumption of varied diets.
Demeke [35] used household survey data to investigate associations between farm-level production diversity and household-level dietary diversity in seven counties of Kenya. The HDDS were calculated by first aggregating foods that the respondents reported consuming in the seven days prior to the interview into 12 equally weighted groups. The results showed that there was a significant association between production diversification and household dietary diversity.
Further, Rajendran [27] examined the causality between crop diversity and DD at the household level in Sub-Saharan Africa. The study was aimed at exploring whether an increase in the diversity of crops in farmers’ fields will lead to increased HDD. Simpson’s Index [36] was used to measure the crop diversity, and the study established a relationship that is positive and non-linear between crop diversity and HDD. The study suggested further research studies on the contribution of vegetables to nutrient adequacy (HDD) since vegetables are good sources of micronutrients in household diets.
Huluka [37] also considered the determinants of HDD in the Yayo biosphere reserve of Ethiopia. The study used three different regression models to establish consistency in their results and found that livelihood strategies such as farm production diversity and non-farm income and livelihood outcomes such as meal frequency and household wealth status had a positive influence on HDD in the study area.
Cordero-Ahiman et al. [38] analysed the factors that determine the household dietary diversity score (HDDS) in the rural area of the Paute River Basin, Azuay Province, Ecuador. The HDDS was measured through 12 food groups consumed over a recall period of 7 days, and a Poisson regression model was used to determine the relationship between the HDDS and sociodemographic variables. The results showed that the most consumed food groups were cereals, roots and tubers, fruits, and sugar/honey. The determinants that best explain the HDDS in the predictive model were housing size, household size, per capita food expenditure, area of cultivated land, level of education, and marital status of the head of the household.
This study, therefore, was integrated into the NICANVEG project. The study envisaged that the integration of UIVs production in the subsistence farming sector in Southwest Nigeria can contribute to household dietary diversity, thereby improving rural household nutrition and boosting nutrition security in the area. The main objective of this study was to investigate whether UIV diversity through cultivation in the field results in a high dietary diversity of the producers’ households or otherwise. Further, the question of whether dietary diversity is linked to the socioeconomic status of the household cultivating UIVs was also verified.
2. Material and Methods
2.1. Study Area
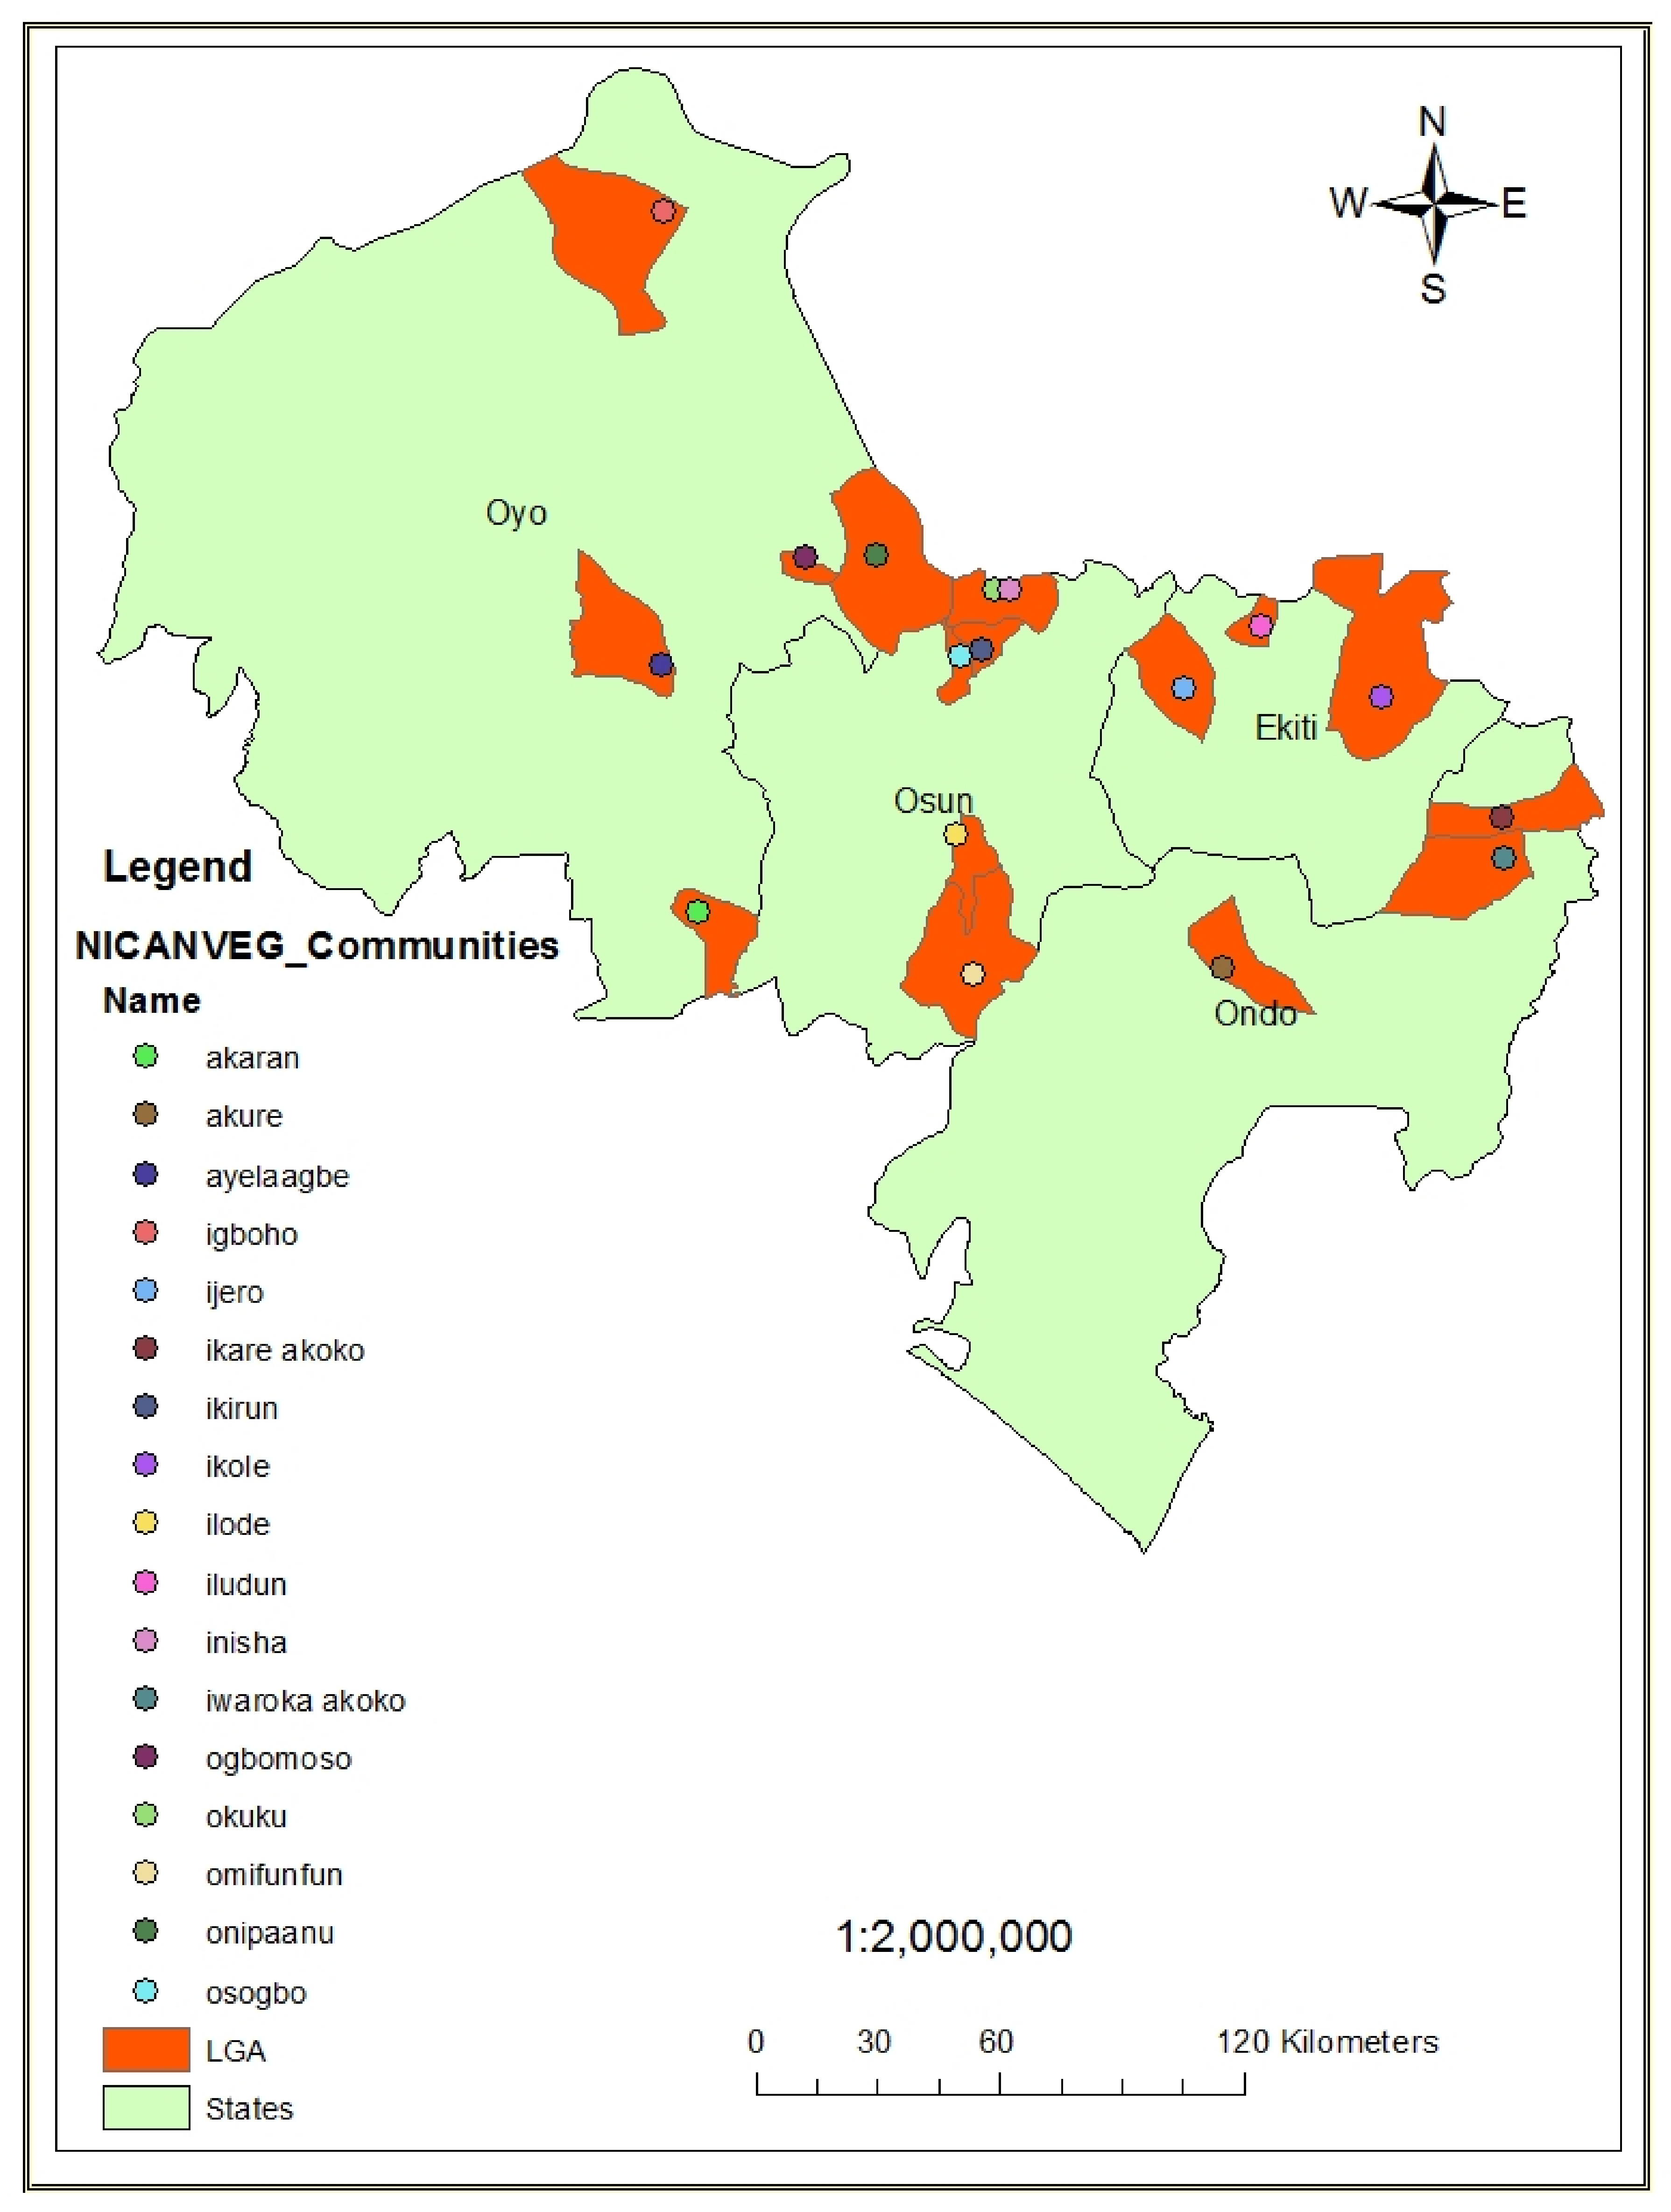
The study was carried out in southwestern Nigeria, where UIV cultivation was promoted under the NICANVEG project. Southwestern Nigeria is located approximately between coordinates 20,311 to 60,001 East longitude and 60,211 to 80,371 North latitude, with a total land area of 77,818 km2 and a population of 14,840,360 in 2016. The region is distinctly divided into three major agroecological zones (a rain forest zone, a swamp forest zone, and a derived savanna zone) with varying climatic conditions. The forest agroecological zone has an annual rainfall in the range of 1600 to 2400 mm, with cropping seasons between April and November and dry spells from December to March. On the other hand, the derived savannah ecosystem has a mean annual rainfall ranging from 800 to 1500 mm with cropping seasons between April and November. This research was purposefully carried out in two (rain forest and derived savanna) of the three agroecological zones where the NICANVEG project was implemented [39]. The project was carried out in the rain forest zone and the derived savannah zone where agriculture is widely practised without any threat of flood. These two agroecological zones comprised four states, namely, Ekiti, Ondo, Osun, and Oyo. The study area map is presented in Figure 1.
2.2. Study Design and Participants
This involved complete selection of all the 17 NICANVEG communities in sixteen local government areas (LGAs) of the four (Ekiti, Ondo, Osun, and Oyo) states. The selection was purposive and was based on the implementation of the NICANVEG project in the selected communities. The sampling procedure ensured representativeness and, due to a limited budget, a simplified formula (Equation (1)) developed by Kothari [40] was employed to calculate the sample size of the respondents at the community level. A 95% confidence level, a 5% estimated percentage, and p = 0.5 were assumed in the equations.
where n is the sample size, N is the population size, e is the estimated proportion, p is the sample proportion, q = 1 − p, and z is the value of the standard variate at a given confidence level to be worked out from the table showing the area under a normal curve.
Based on this formula, the respondent sample size was approximately 191 (about 50% of the direct beneficiaries of the NICANVEG project in the study area). At each NICANVEG site, 50% of the total farmers were randomly selected using NICANVEG farmers’ lists. This proportionate sampling procedure was necessary because the number of farmers in each community or site differs.
2.3. Data Collection
Face-to-face interviews using a structured questionnaire was conducted by trained postgraduate students of Obafemi Awolowo University. The interviewers were supervised by the first author during the data collection. Phones were used for the data collection; the questions were coded on the phone using the open data kit (ODK) in order to minimize errors that could emanate during data collection and entry. Information obtained from the respondents included socioeconomic data such as age, sex, level of education, income from UIVs enterprise, household size, among others. Data on UIVs production were adequately collected, including the number of UIVs cultivated by the household (this was used to calculate the UIVs diversity) and input and output data on UIVs production. Data on the dietary diversity of the household were obtained as well, and this included the frequency of food group consumption over a 7-day reference period preceding the survey. The reference period was chosen according to the Food and Agriculture Organization (FAO) guidelines for measuring household and individual dietary diversity [41].
2.4. Analytical Techniques
2.4.1. Measuring Dietary Diversity of the Household
This study employed a dietary diversity scoring system proposed by Hoddinoth [24] and also used in Mozambique by Rose [42]. This involved the use of a weighting system, that is, a weighted sum of the number of individual foods per group of food consumed over a reference period of 24 h [43]. Usually, the reference period varies depending on the focus of the study, but, generally, the previous day or week was used by [24,25,43]. This study adopted a 7-day reference period preceding the survey following [38,41]. Fourteen different standardized food groups were included in the questionnaire for scoring (Table 1). Following FAO [8], food groups 3 and 4 (legume, nut and seed) and 7 and 8 (meat) were aggregated to create dietary diversity scores (DDS) of the households, which ranged between 0 and 12, as summarised in Table 1. It should be noted that there is no international consensus on which food groups to include in the scores; rather, the selection of food groups should be driven by the specific purpose that the dietary diversity indicator is to be used for [8,18]. Each food group has a range of food items that are consumed in the study area for which the households have to indicate the frequency of eating in the last 7 days preceding the survey.
2.4.2. Empirical Model
The essence of this study was to analyse the role of UIVs diversity on the dietary diversity of the households. It was envisaged that cultivation of diverse UIVs will increase the vegetable intake of the household and also that the income generated from the UIVs could be used to purchase other food items not produced by the house to enhance nutrition. For instance, a UIV farming household can sell UIVs and, in turn, purchase food items to meet the food requirement of the members, thereby increasing the household dietary diversity. The dietary diversity of the household, therefore, is a function of UIVs diversity and other household characteristics [2].
In order to examine the effect of UIVs diversity on HDD in southwestern Nigeria, the nature of the dependent variable (HDD) was considered. In this study, the dependent variable was a count datum, and three forms of count data regression models could be carried out. These included normal Poisson regression, negative binomial regression, and zero-truncated Poisson. However, negative binomial regression was considered. Negative binomial regression models do not assume an equal mean and variance and particularly correct for over-dispersion in the data, which is when the variance is greater than the conditional mean [44,45,46]. It could be considered as a generalization of Poisson regression since it has the same mean structure as Poisson regression, and it has an extra parameter to model the over-dispersion. If the conditional distribution of the outcome variable is over-dispersed, the confidence intervals for the negative binomial regression are likely to be narrower as compared to those from a Poisson regression model.
In negative binomial regression, the mean of y is determined by the exposure time t and a set of k regressor variables (the xs). The expression relating these quantities is Equation (2):
Often, X1 ≡ 1, in which case β1 is called the intercept. The regression coefficients β1, β2, …, βk are unknown parameters that are estimated from a set of data. Their estimates are symbolized as b1, b2, …, bk. Using this notation, the fundamental negative binomial regression model for an observation i is Equation (3), written as:
The source of data was from a cross-sectional survey conducted among the underutilised indigenous vegetables producers, who participated in a Nigeria–Canada vegetable project in Southwest Nigeria. The dependent variable, household dietary diversity was the weighted sum of the number of individual foods per group of food consumed over a reference period of 7 days. Explanatory variables included demographic and socioeconomic characteristics of the UIVs farmers. The variables included were UIVs diversity (number of UIVs cultivated), age of the head of the household (years), years of formal education of the head of household, marital status of the head of household (the marital status of the head of household was registered according to the options: single, married), number of UIVs farm plots, farm distance from home (km), area of cultivated land to UIVs (ha), access to extension agent (yes or no), off-farm income in naira, gross margin generated from UIVs in naira (gross margin from immediate past UIVs cultivated before the survey), monthly food expenditure per capita, location (Oyo, Ondo, and Ekiti). Therefore, 12 explanatory variables were selected for the estimation of the model following [2,38]. The parameters and values chosen to rule that an association is or is not statistically significant were realized according the significance levels: * p < 0.10, ** p < 0.05, and *** p < 0.01. The model parameter vector was estimated through the maximum likelihood method (MLE).
3. Results
3.1. Description of Variables
Table 2 presents the summary statistics for variables used in the analysis. From the table, each household cultivated, on average, two types of UIVs. The main UIVs cultivated by the households include Amaranthus viridis, Solanecio biafrae, Solanum scarbum, Solanum nigum, Telfairia occidentalis, and Solanum macrocarpon. The mean gross margin from the immediate past UIVs production cycle was ₦ 119,211.03 (USD 600) (at the prevailing exchange rate of 198.53 per U.S. dollar when the data were collected). The average UIVs cultivated land area was 0.21 ha, and the average distance of the UIVs farm to homestead was 2.14 km. On average, the distance of the UIVs farm to the main road was 6.96 km, which was about a 10-min drive from the main road. Each household, on average, consumed about 11% of the UIVs cultivated in the immediate past production cycle. About 63% of the sample households were headed by a male, and their average age was 48.16 years with an average of 9 years of formal education. The average household size was 8 persons. About 63% belonged to a farmers’ association, and only about 23% had access to a loan during the immediate past production cycle before the data collection. On average, each household spent a sum of ₦ 31,067.47 (USD 156.49) on food items per month.
3.2. Frequency of Food Group Consumption Per Reference Period
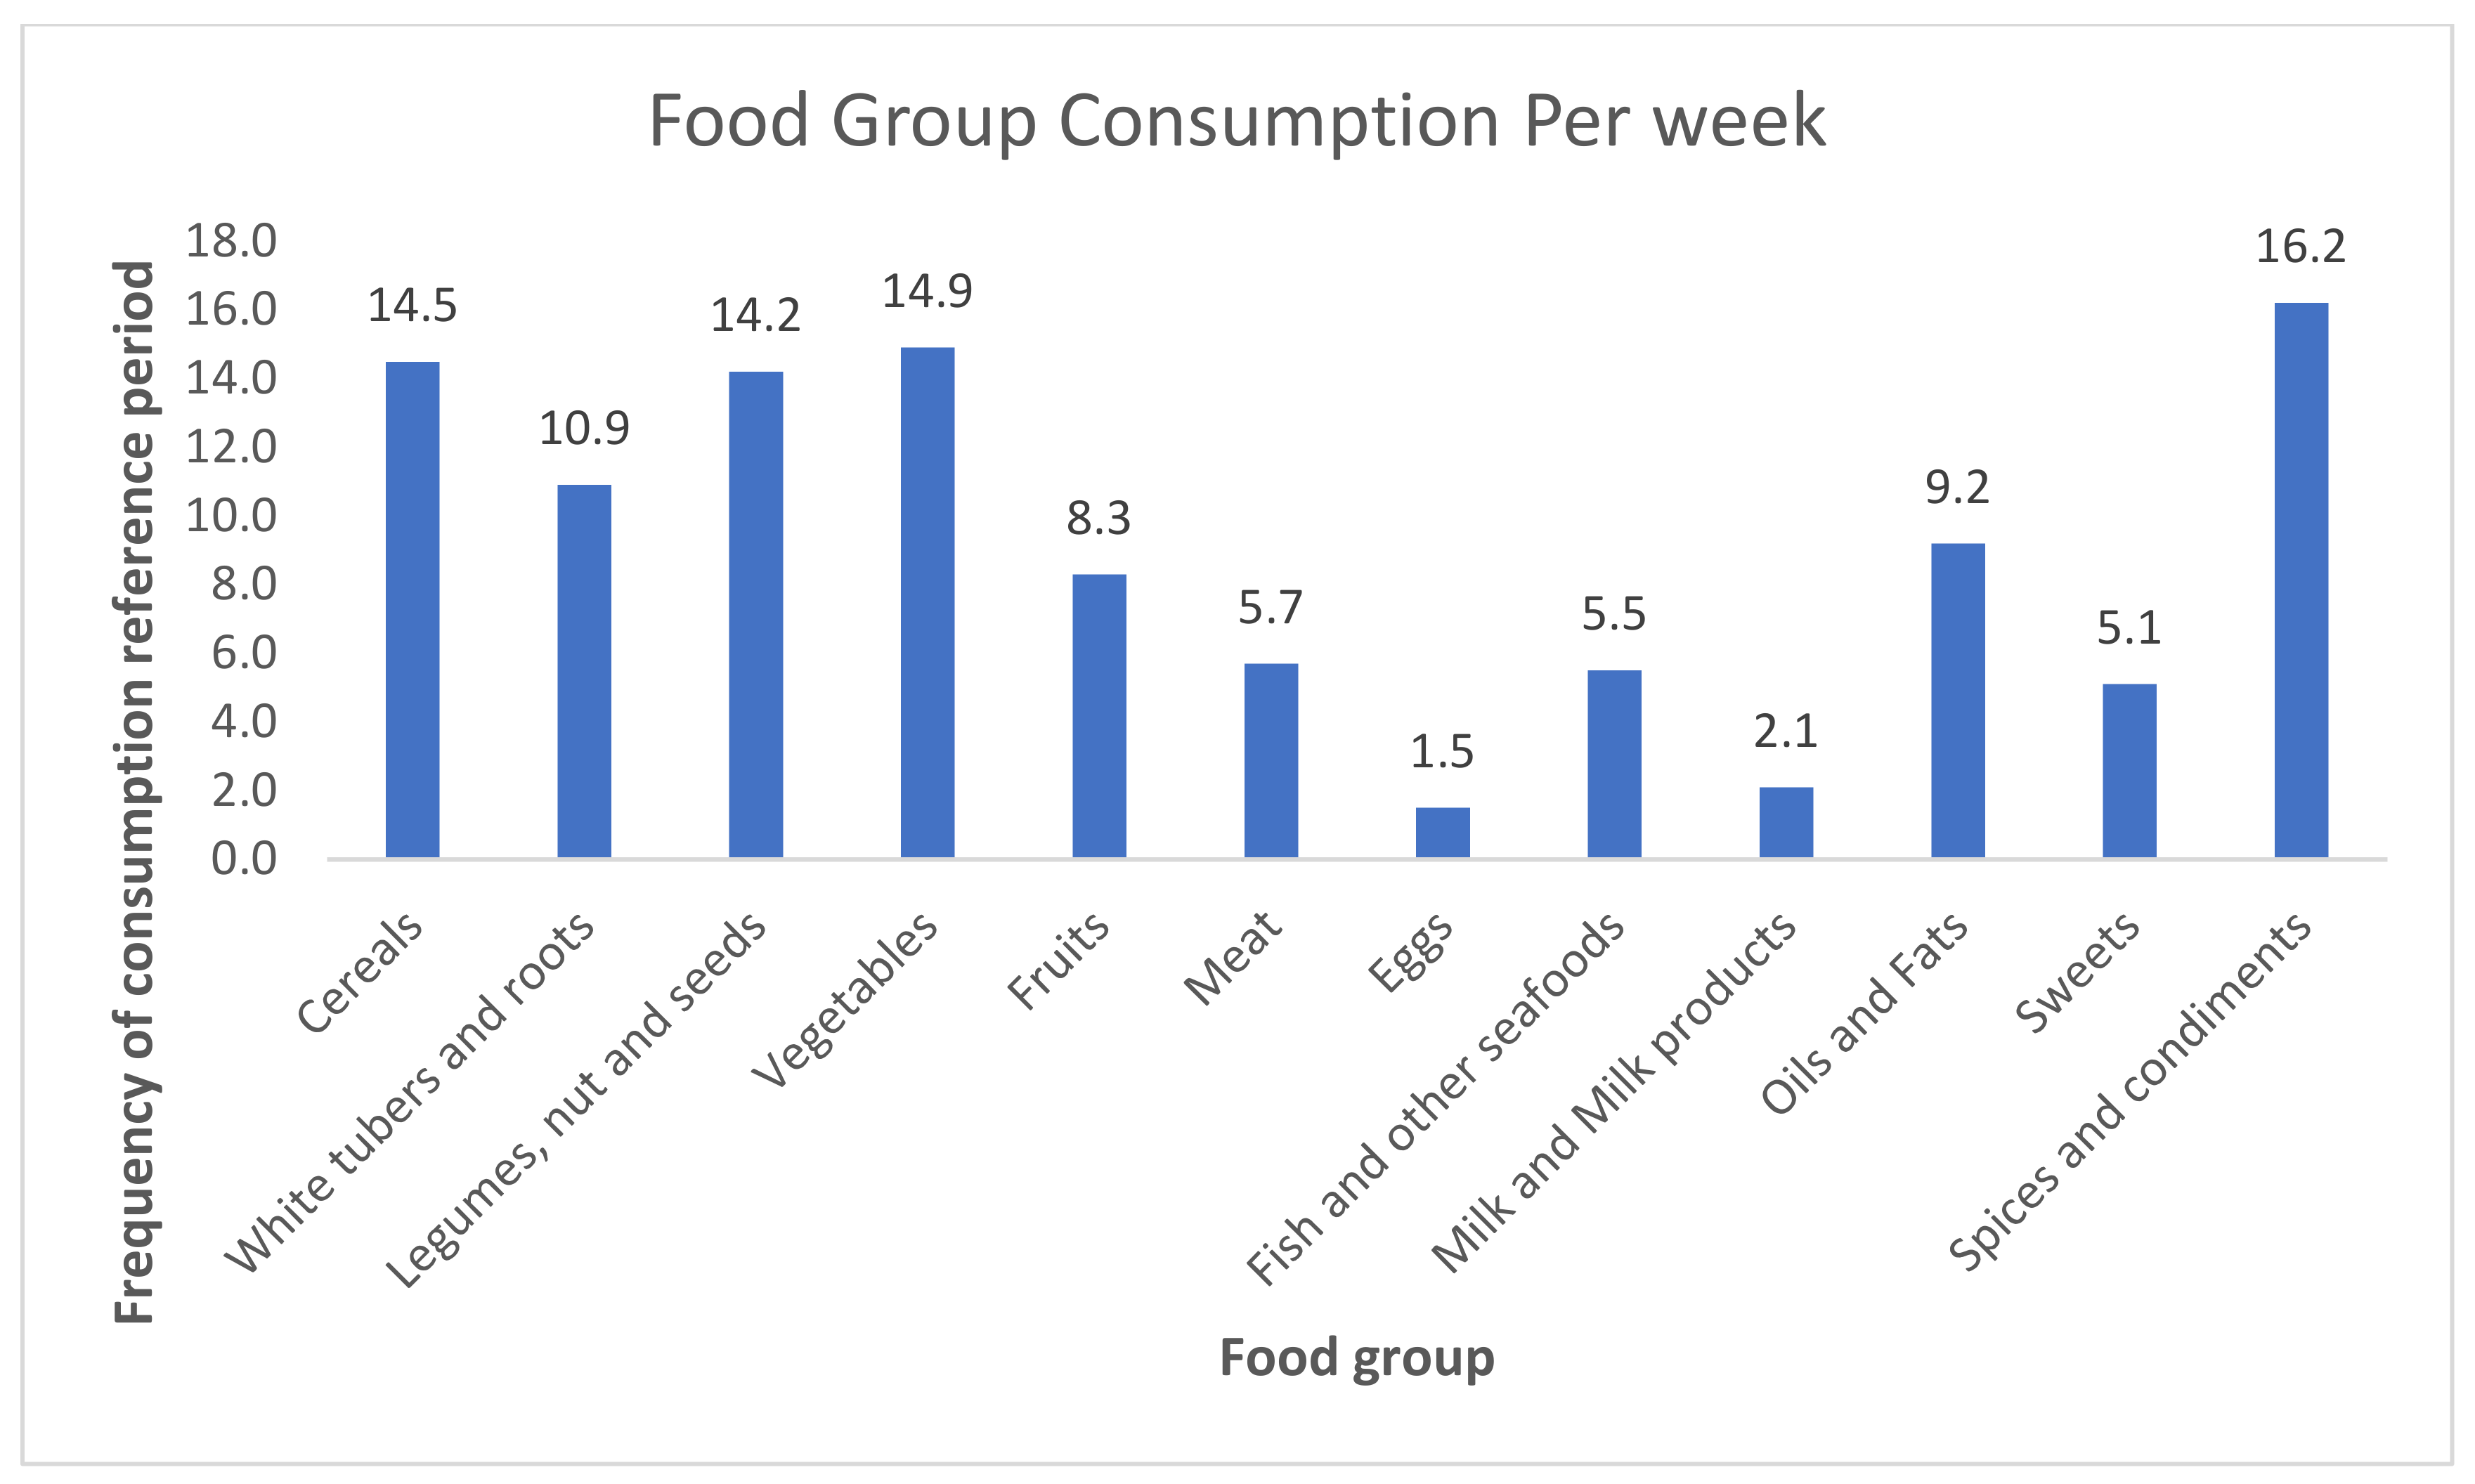
The frequency of food group consumption over a reference period of 7 days is presented in Figure 2. The results showed that the frequently consumed food groups were spices and condiments (16.2), vegetables (14.9), cereals (14.5) and legumes, and nuts and seeds (14.2) within the seven-day reference period. It was worth noting that the frequency of consumption of more nutritious food groups such as eggs (1.5), milk and dairy products (2.1), fish and other seafoods (5.5), and meats (5.7) compared relatively low to other food groups.
3.3. Household Dietary Diversity Score Distribution
The HDD score for the study is presented in Table 3; the result revealed that the HDD of the sample respondents was low. Most (70.16%) respondents had an HDD score between 2 and 3.99.
The mean HDD score was 3.52, which means that only about four groups of food contributed greatly to the HDD of the respondents.
3.4. Determinants of Dietary Diversity among UIVs Producers
The results of the econometric estimation are summarized in Table 4. The factors determining the HDDS were modelled using the negative binomial regression model. Negative binomial regression allowed for the modelling of count data, in this case, the dietary diversity score (which ranged from 0 to 12) and did not assume an equal mean and variance and was particularly correct for over-dispersion in the data when the variance was greater than the conditional mean. In addition, when modelling the count data, this model assumed that the results are Poisson-distributed.
Table 4 shows the coefficients of the different factors that determine the HDD at the household level, their marginal effects, and the p-values. The coefficients can be interpreted as elasticities or semi-elasticities, representing a percentage change in the HDD score when the explanatory variable changes by one unit. The positive or negative and significant marginal effects in column (5) suggest that the HDDS of households increases or decreases with a change in one of these explanatory variables (Table 4). The results of the marginal effects of the model show that the varieties of UIVs cultivated, marital status, farm distance from home, UIVs land area, off-farm income, UIVs gross margin, and food expenditure per capita were statistically significant variables and important factors determining the HDDS.
The varieties of UIVs cultivated had a positive and significant effect with respect to the HDDS (p < 0.5). The marital status of the household head variable also had a p-value below 0.05 and was therefore significantly associated with HDDS. The marital status variable had a positive coefficient, meaning that when the household is married, the household size would invariably be high; the diverse food consumed would increase and thereby increase the HDDS. The coefficient of the farm distance from the home variable was negative and significantly influenced HDDS (p < 0.1). Consequently, the further away the UIVs farm is to the homestead the lower is the HDDS. The coefficient of the cultivated land area variable was positive and was statistically associated with the HDDS (p < 0.01). In other words, having access to more land area increased the dietary diversity score and probably the ability to produce more varieties of crops.
Further, the off-farm income variable was negative and significantly (p < 0.01) reduced the HDDS; that is, when off-farm income increases, HDDS reduces significantly. Increased off-farm income is probably a result of reduction in farming activities, which can reduce the ability of farmers to produce more varieties of crops. The UIVs’ gross margin was also positive and significantly (p < 0.1) increased the HDDS. Increased UIV gross margin, which could habitually lead to increased household farm income, will no doubt increase their purchasing power. Similarly, the monthly food expenditure per capita variable impacted HDDS positively and significantly. Whenever food expenditure per capita increases, the HDDS increases as well. The Oyo state location was positive and had a significant effect on HDDS. An increase in the production of UIVs in the state of Oyo increased HDDS in the location.
4. Discussion
The purpose of this research was to establish the link between the household dietary diversity (HDD), UIVs diversity, and other socioeconomic characteristics of UIVs producers in the rural area of Southwest Nigeria. Based on the literature reviewed globally and specifically in Africa [27,33,34,35,37], positive relationships were established between crop diversification and HDDS. Although, there is a dearth of literature in Nigeria in this regard. This study therefore bridges this gap in knowledge.
The results of the study show that the diet of the sample UIVs producers in the study area is based on starch. This result is consonant with [38,43], who also reported a cereal-based diet for the sample respondent. It is noteworthy that the diets of the UIVs producers lacked protein-source products (such as eggs (1.5), milk and dairy products (2.1), fish and other seafoods (5.5), and meats (5.7)), which was an indicator that the households’ diets lacked the important nutrients requirement by the body. The low consumption of animal products could be due to higher prices attached to such commodities compared to vegetables and other food items. This result was similar to [38,43] who also found that consumption of food rich in micronutrients such as milk/dairy products and fish and seafoods is low in the study area. Meanwhile, the frequency of vegetables’ consumption in the study area is high. This is probably because the producers have better access to the vegetables they produce. This indeed has a way to complement their starch-based diet and supply the necessary micronutrients that the body requires. This was similar to the results of [43], where the result showed that the highest food group consumed was vegetables. It is therefore important to encourage farmers to cultivate UIVs alongside other crops to boost their dietary diversity and, hence, the quality of their diet. It was noteworthy the variables such as the number of UIVs cultivated and land area cultivated to UIVs were statistically significant and had a positive relationship with HDD. The implication of this is that there is strong relationship between the cultivation and consumption of agricultural produce, and to improve the nutrition security of the rural households, diversity in crop production should be encouraged. The cultivation of crops rich in micronutrients (like vegetables and protein), which will boost the nutrition quality, is advocated for, since food security is not only in the quantity of food consumed but the quality. This result was similar to Keding [25], who established a link between the production of vegetables and dietary diversity score. This result was also in line with Pellegrini [33], who also established a positive link between the number of crops produced and HDD. Chegere and Stage [2] also established a significant relationship between household agricultural production and HDD. Cordero-Ahiman et al. [38] specifically identified the area of land cultivated as an important factor that determines HDD because households with larger agricultural land enjoyed higher dietary diversity.
Further, farm distance from home had a significant and negative influence on the HDD. Food crops that involve walking a long distance to access, especially by women who prepare food in the house, will be less consumed but would instead be harvested in large quantities and sold. The promotion of homestead vegetable gardens may be a good method to improve HDD. Easy and close access to UIVs will increase consumption and also complement the starch-based diet of many households in developing countries [25].
Dietary diversity studies generally provide information on the household access to diverse food in order to measure the HDDS, which reflects a household’s economic ability to access a variety of foods. In order to assess the economic ability of the UIVs respondents, three welfare indicators (off-farm income, UIVs gross margin, and monthly food expenditure per capita) were included in the model, and all the three significantly influence the HDDS. The off-farm income reduced HDD significantly when rural households shifted their attention from farming and became involve in non-farming activities, and their access to varieties of food may be reduced and affect HDD negatively. Conversely, income generated from UIVs influences the HDDS positively, which is probably because the proceeds from the UIVs could be used to purchase other food items that are not produced by the households. This result is in agreement with [2]. The study also reported that there was a greater chance that increased revenue from agricultural produce will translate into a higher diverse diet. Moreover, the monthly food expenditure per capita influences HDDS positively. The result of monthly per capita food expenditure contributed to improving the HDDS in the study area. The purchasing of food is important to achieve a greater HDDS in order to meet the basic food needs of households.
The variable Oyo location increases the HDDS significantly, and further research is recommended to probe the significance of location on UIVs and HDDS. Although, ref. [15] identified agroecological zone as one of the significant factors that influence the production of UIVs in Southwest Nigeria.
It is worth mentioning a couple of limitations despite the findings of this research. Agricultural production in many developing countries is mainly rain-fed, and the seasonal effect of UIVs production for some households on HDD was not put into consideration. The study suggests the use of panel datasets instead of cross-sectional data used in this study. The panel data account for farmers’ experiences with both planting and harvesting periods as these periods determine what the households consume in term of quality and quantity. Additionally, the role that location plays on the HDDS of UIV-producing households needs to be investigated. These limitations should be seen as a research gap for further study.
5. Conclusions
The study findings conclude that although the HDD of the UIV-producing household was low, the frequency of UIVs consumption was high and thereby complemented their starch-based diets. Based on the empirical findings, the study concludes that the key determinants of UIVs producing HDD are UIVs diversity, marital status, farm distance from the home, UIVs farm area, off-farm income, UIVs gross margin, monthly per capita food expenditure, and Oyo location.
Overall, the outcome of this study highlighted critical roles of the incorporation of UIVs into the cropping systems of farmers in rural areas and also home gardening practices in both the rural and urban areas to increase HDD and ensure nutrition security. The strategic policy, targeting research and investment in the above area, can play a significant role towards improving both rural and urban HDD and household food and nutrition security.
Author Contributions
Conceptualization, V.A.T., D.N., S.N.A.C. and A.B.A.; Methodology, V.A.T.; Software, V.A.T.; Validation, D.N., S.N.A.C. and A.B.A.; Formal analysis, V.A.T.; Investigation, V.A.T.; Data curation, V.A.T.; Writing—original draft preparation, V.A.T.; Writing—review and editing, V.A.T. and D.N.; Visualization, D.N.; Supervision, D.N., S.N.A.C. and A.B.A.; Project administration, V.A.T.; Funding acquisition, V.A.T. All authors have read and agreed to the published version of the manuscript.
Funding
This research was funded by the Department for International Development (DfID).
Informed Consent Statement
Ethical review and approval were waived for this study, due to studies not involving humans or animals.
Data Availability Statement
Data are available on request.
Acknowledgments
The authors are grateful to all the enumerators involved in the data collection and also appreciate the cooperation of the sampled respondents. The effort of NICANVEG desk officer is also appreciated.
Conflicts of Interest
The authors declare no conflict of interest.
Abbreviations
UIVs: underutilised indigenous vegetables; HDD: household dietary diversity; NICANVEG: Nigeria–Canada Vegetable project; HDDS: household dietary diversity score; IDRC: International Development Research Centre; DFATD: Department of Foreign Affairs, Trade, and Development Canada; ODK: open data kit; DfID: Department for International Development; CIRCLE: Climate Impact Research Capacity and Leadership Enhancement.
References
- Fanzo, J.; Hunter, D.; Borelli, T.; Mattei, F. Agricultural Biodiversity to improve Nutrition and Health, 1st ed.; Routledge: London, UK, 2013. [Google Scholar]
- Chegere, M.J.; Stage, J. Agricultural production diversity, dietary diversity and nutritional status: Panel data evidence from Tanzania. World Dev. 2020, 129, 104856. [Google Scholar] [CrossRef]
- Tontisirin, K. Promotion of underutilised indigenous food resources for food security and nutrition in Asia and the Pacific. In Promotion of Underutilised Indigenous Food Resources for Food Security and Nutrition in Asia and the Pacific; Durst, P., Bayasgalanbat, N., Eds.; Food and Agriculture Organization of the United Nations (FAO): Rome, Italy, 2014; pp. 36–45. Available online: http//www.fao.org/3/a-i3685e.pdf (accessed on 13 February 2017).
- Keatinge, J.D.H.; Holmer, R.J.; Ebert, A.W.; Hughes, J.D.A. Less visible but yet vital for human health: Nutrient-dense indigenous vegetables and their need for urgent promotion in balanced diets. In Promotion of Underutilised Indigenous Food Resources for Food Security and Nutrition in Asia Pacific, Food and Organization of United Nations Regional Office for Asia and Pacific; Food and Agriculture Organization of the United Nations (FAO): Rome, Italy, 2014; pp. 36–45. Available online: http//www.fao.org/3/a-i3685e.pdf (accessed on 13 February 2017).
- IPGRI. Neglected and Underutilized Plant Species: Strategic Action Plan of the International Plant Genetic Resources Institute; International Plant Genetic Resources Institute (IPGRI): Rome, Italy, 2002; Available online: www.fao.org/docrep/014/i1951e/i1951e.pdf (accessed on 13 February 2017).
- Ekesa, B.N.; Blomme, G.; Garming, H. Dietary diversity and nutritional status of pre-school children from Musa-dependent households in Gitega (Burundi) and Butembo (Democratic Republic of Congo). Afr. J. Food Agric. Nutr. Dev. 2011, 11. [Google Scholar] [CrossRef] [Green Version]
- Ogechi, U.P.; Chilezie, O.V. Assessment of Dietary Diversity Score, Nutritional Status and Socio-demographic Characteristics of Under-5 Children in Some Rural Areas of Imo State, Nigeria. Malays. J. Nutr. 2017, 23, 425–435. [Google Scholar]
- FAO. Expert Consultation on Nutrition Indicators for Biodiversity; Food and Agriculture Organisation of United Nations (FAO): Rome, Italy, 2010. [Google Scholar]
- Mabhaudhi, T.; O’Reilly, P.; Walker SMwale, S. Opportunities of Underutilised crops in Southern Africa’s Post-2015 Development Agenda. Sustainability 2016, 8, 302. [Google Scholar] [CrossRef] [Green Version]
- Raghuvanshi, R.S.; Singh, R. Nutritional composition of uncommon foods and their role in meeting micronutrient needs. Int. J. Food Sci. Nutr. 2001, 32, 331–335. [Google Scholar]
- Nnamani, C.; Osebele, H.; Agbatutu, A. Assessment of nutritional value of three underutilized indigenous leafy vegetables of Ebonyi State, Nigeria. Afr. J. Biotechnol. 2009, 8, 2321–2324. [Google Scholar]
- Shava, S.; O’Donoghue, R.; Krasny, M.E.; Zasu, C. Traditional food crops as a source of community resilience in Zimbabwe. Int. J. Afr. Renaiss. Stud. 2009, 4, 31–48. [Google Scholar] [CrossRef]
- Maroyi, A. Potential role of traditional vegetables in household food security: A case study from Zimbabwe. Afr. J. Agric. Res. 2011, 6, 5720–5728. [Google Scholar] [CrossRef] [Green Version]
- Ebert, A.W. Potential of Underutilized traditional vegetables and legume crops contribute to food and nutritional security, income and more sustainable production system. Sustainability 2014, 6, 319–335. [Google Scholar] [CrossRef] [Green Version]
- Tanimonure, V.A. Underutilized Indigenous Vegetables’ (UIVs) Business in Southwestern Nigeria: Climate Adaptation Strategies. In African Handbook of Climate Change Adaptation; Leal Filho, W., Oguge, N., Ayal, D., Adeleke, L., da Silva, I., Eds.; Springer: Cham, Switzerland, 2021. [Google Scholar] [CrossRef]
- Steyn, N.P.; Olivier, J.; Winter, P.; Burger, S.; Nesamvuni, C. A survey of wild, green leafy vegetables and their potential in combating micronutrient deficiencies in rural populations. S. Afr. J. Sci. 2001, 97, 276–278. [Google Scholar]
- Nesamvuni, C.; Steyn, N.P.; Potgieter, M.J. Nutritional value of wild leafy vegetables consumed by the Vha Vhenda. S. Afr. J. Sci. 2001, 97, 51–54. [Google Scholar]
- Ruel, M. Is dietary diversity an indicator of food security or dietary quality. In A Review of Measurement Issues and Research Needs, Food Consumption and Nutrition Discussion Paper No. 140; International Food Policy Research Institute: Washington, DC, USA, 2002. [Google Scholar]
- Odhav, B.; Beekrum, S.; Akula, U.; Baijnath, H. Preliminary assessment of nutritional value of traditional leafy vegetables in KwaZulu-Natal, South Africa. J. Food Compost. Anal. 2001, 20, 430–435. [Google Scholar] [CrossRef]
- Mavengahama, S.; McLachlan, M.; de Clercq, W. The role of wild vegetable species in household food security in maize based subsistence cropping system. Food Secur. 2013, 5, 227–233. [Google Scholar] [CrossRef] [Green Version]
- Ruel MMinot, N.; Smith, L. Pattern and determinants of fruit and vegetable demand in developing countries: A multi-country comparison. In Proceedings of the Paper Prepared for the Joint WHO/FAO Workshop on Fruit and Vegetable for Health, Kobe, Japan, 1–3 September 2004. [Google Scholar]
- Arimond, M.; Wiesmann, D.; Becquev, E. Simple food group diversity indicator predict micronutrient adequacy of women’s diets in diverse 5, resource-poor settings. J. Nutr. 2010, 140, 2059S–2069S. [Google Scholar] [CrossRef] [PubMed] [Green Version]
- Modi, M.; Modi, A.; Hendriks, S. Potential role for wild vegetables in household food security: A preliminary case study in Kwazulu-Natal, South Africa. Afr. J. Food Agric. Nutr. Dev. 2006, 6, 1–13. [Google Scholar] [CrossRef]
- Hoddinott, J.; Yohannes, Y. Dietary Diversity as a Food Security Indicator; FCND Brief 136; International Food Policy Research Institute (IFPRI): Washington, DC, USA, 2002. [Google Scholar]
- Keding, G.B.; Msuya, J.M.; Maass, B.L.; Krawinkel, M.B. Relating dietary diversity and food variety scores to vegetable production and socioeconomic status of women in rural Tanzania. Food Secur. 2012, 4, 129–140. [Google Scholar] [CrossRef]
- Shah, S.K. Dietary contribution of underutilized minor crops and indigenous plants collected from uncultivated lands and forests in Nepal. In Promotion of Underutilised Indigenous Food Resources for Food Security and Nutrition in Asia and the Pacific; Durst, P., Bayasgalanbat, N., Eds.; Food and Agriculture Organization of the United Nations (FAO): Rome, Italy, 2014; pp. 36–45. Available online: http//www.fao.org/3/a-i3685e.pdf (accessed on 13 February 2017).
- Rajendran, S.; Afari-Sefa, V.; Shee, A.; Bocher, T.; Bekunda, M.; Dominick, I.; Lukumay, P.J. Does crop diversity contribute to dietary diversity? Evidence from integration of vegetables into maize-based farming systems. Agric. Food Secur. 2017, 6, 50. [Google Scholar] [CrossRef] [Green Version]
- Mirmiran, P.; Azadbakht, L.; Azizi, F. Dietary diversity within food groups: An indicator of specific nutrient adequacy in Tehranian women. J. Am. Coll. Nutr. 2006, 25, 354–361. [Google Scholar] [CrossRef]
- Azadbakht, L.; Esmaillzabeh, A. Dietary energy density is favourably associated with dietary diversity score among female University students in Isfahanm. Nutrition 2012, 28, 991–995. [Google Scholar] [CrossRef] [PubMed]
- Frempong, R.B.; Annim, S. Dietary diversity and child malnutrition in Ghana. Heliyon 2017, 3, e00298. [Google Scholar] [CrossRef] [Green Version]
- Taruvinga, A.; Muchenje VMushunje, A. Determinants of rural household dietary diversity: The case of Amatole and Nyandeni districts, South Africa. Int. J. Dev. Sustain. 2013, 2, 15. [Google Scholar]
- Busert, L.K.; Neuman, M.; Rehfuess, E.A.; Dulal, S.; Harthan, J.; Chaube, S.S.; Bhandari, B.; Costello, H.; Costello, A.; Manandhar, D.S.; et al. Dietary Diversity is positively associated with deviation from expected height in rural Nepal. J. Nutr. 2016, 146, 1387–1393. [Google Scholar] [CrossRef]
- Pellegrini, L.; Tasciotti, L. Crop diversification, dietary diversity and agricultural income: Empirical evidence from eight developing countries. Can. J. Dev. Stud. 2014, 35, 211–227. [Google Scholar] [CrossRef]
- Akerele, D.; Sanusi, R.A.; Fadare, O.A.; Ashaolu, O.F. Factors Influencing Nutritional Adequacy among Rural Households in Nigeria: How Does Dietary Diversity Stand among Influencers? Ecol. Food Nutr. 2017, 56, 187–203. [Google Scholar] [CrossRef]
- Demeke, M.; Meerman, J.; Scognamillo, A.; Romeo, A.; Asfaw, S. Linking Farm Diversification to Household Diet Diversification: Evidence from a Sample of Kenyan Ultrapoor Farmers; ESA Working Paper No. 17-01; FAO: Rome, Italy, 2017; Available online: www.fao.org/3/a-i6852e.pdf (accessed on 2 January 2016).
- Simpson, E.H. Measurement of diversity. Nature 1949, 163, 688. [Google Scholar] [CrossRef]
- Huluka, A.T.; Wondimagegnhu, B.A. Determinants of household dietary diversity in the Yayo biosphere reserve of Ethiopia: An empirical analysis using sustainable livelihood framework. Cogent Food Agric. 2019, 5, 1690829. [Google Scholar] [CrossRef]
- Cordero-Ahiman, O.V.; Vanegas, J.L.; Franco-Crespo, C.; Beltrán-Romero, P.; Quinde-Lituma, M.E. Factors That Determine the Dietary Diversity Score in Rural Households: The Case of the Paute River Basin of Azuay Province, Ecuador. Int. J. Environ. Res. Public Health 2021, 18, 2059. [Google Scholar] [CrossRef]
- NICANVEG Project Sites. Available online: https://www.nicanveg.org/content/project-site (accessed on 11 December 2014).
- Kothari, C.R. Research Methodology; New Age International (P) Publishers: New Delhi, India, 2004. [Google Scholar]
- Food and Agriculture Organization of the United Nations (FAO). Guidelines for Measuring Household and Individual Dietary Diversity; Kennedy, G., Ballard, T., Dop, M., Eds.; FAO: Rome, Italy, 2011; p. 53. [Google Scholar]
- Rose, D.; Meershoek, S.; Ismael, C.; McEwan, M. Evaluation of a rapid field tool for assessing household diet quality in Mozambique. Food Nutr. Bull. 2002, 23, 181–189. [Google Scholar] [CrossRef] [PubMed]
- Codjoe, S.N.; Okutu, D.; Abu, M. Urban Household characteristics and dietary diversity: An analysis of food security in Accra, Ghana. Food Nutr. Bull. 2016, 37, 202–218. [Google Scholar] [CrossRef] [PubMed] [Green Version]
- Paternoster, R.; Brame, R. Multiple routes to delinquency? A test of developmental and general theories of crime. Criminology 1997, 35, 49–84. [Google Scholar] [CrossRef]
- Osgood, D.W. Poisson-based regression analysis of aggregate crime rates. J. Quant. Criminol. 2000, 16, 21–43. [Google Scholar] [CrossRef]
- Hossain, Z.; Akter, R.; Sultana, N.; Kabir, E. Modelling zero-truncated overdispersed antenatal health care count data of women in Bangladesh. PLoS ONE 2020, 15, e0227824. [Google Scholar] [CrossRef] [PubMed] [Green Version]
Figure 1.
Map of the study area.

Figure 2.
Food group consumption per week.


Table 1.
Food groups included in the study.
| No | Food Group | Foods within the Group |
|---|---|---|
| Plant Origin | ||
| 1 | Cereals and grain products | Maize, millet, rice, sorghum, wheat (incl. eko, akamu/ogi, semo, etc.) |
| 2 | Starchy roots, tubers, and fruit | Cassava, plantain, potato, sweet potato, cocoyam, yam (incl. eba, amala from yam and plantain, iyan, etc.) |
| 3 | Grain legumes and legume products | Bean, chickpea, cowpea, pigeon pea, soybean (incl. akara, moinmoin, etc.) |
| 4 | Nuts and seeds | Cashew nut, groundnut, coconut (and products, e.g., milk), groundnut, melon seeds, pumpkin seeds, etc. |
| 5 | Vegetables and vegetable products | Bulbs (onion, leek, garlic), exotic vegetables (cabbages, cucumber, lettuce) indigenous vegetables (woorowo, teteabalaye, ugu, odu, igbagba, ogunmo, etc.) conventional leafy vegetables (green, corchorus, etc.), mushrooms, root vegetables (carrot), okra, pumpkin fruit, tomato, pepper, etc. |
| 6 | Fruits | Banana, mango, orange, lemon, pawpaw, pear, pineapple, tangerine, watermelon, wild fruits |
| Animal origin | ||
| 7 | Meat | Beef, goat, mutton, pork, bush meat, etc. |
| 8 | Poultry | Chicken, duck, bush fowl |
| 9 | Eggs | Eggs (from chicken) |
| 10 | Fish and fish products | Fish (frozen or dry fish), freshwater fish, etc. |
| 11 | Milk and milk products | Milk (cow, goat), soy milk |
| Others | ||
| 12 | Oils and fats | Palm oil, vegetable oil, groundnut oil, animal fat, margarine, etc. |
| 13 | Spices, condiment and beverages | Carbonated soft drinks, non-alcoholic hot drinks (tea, coffee) |
| 14 | Sweets | Sugar, honey, sweetened soda, or sweetened juice drinks |
Source: adapted from [41].
Table 2.
Descriptive statistics and variable definitions.
| Variable | Description | Number | Mean | SD |
|---|---|---|---|---|
| UIVs diversity | Number of UIVs cultivated by household | 191 | 2.2408 | 1.1492 |
| Gross margin | Gross margin from the immediate last production cycle prior to data collection in naira | 191 | 119,211.03 | 225,829.77 |
| UIVs land area | Area of land cultivated to UIVs in ha | 191 | 0.2058 | 0.4543 |
| Distance to farm from home | The distance to the farm from home in km | 191 | 2.1376 | 3.2080 |
| Distance of farm to main road | Distance to a main motorable road in km | 191 | 6.9590 | 3.7431 |
| UIVs consumed | Percentage of UIVs consumed in the immediate past production cycle | 191 | 10.8764 | 8.8202 |
| Gender of household head | Dummy variable = 1 if the respondent is a male and 0 otherwise | 191 | 0.9424 | 0.2335 |
| Age of household head | Age of household head in years | 191 | 48.1571 | 14.3386 |
| Formal education | Number of years of formal education | 191 | 9.2094 | 4.6857 |
| Household size | Number of members eating in the same pot | 191 | 7.7120 | 4.5498 |
| Group membership | Dummy variable = 1 if the respondent is a member of group and 0 otherwise | 191 | 0.6283 | 0.4853 |
| Access to loan | Access to a loan during the immediate past production cycle. Dummy variable = 1 if has access to loan and 0 otherwise | 191 | 0.2251 | 0.4187 |
| Total food expenditure | Total expenses spent on food in the previous month prior to data collection in naira | 191 | 31,067.47 | 26,277.49 |
Table 3.
Household dietary diversity score distribution.
| Range | HDD Score |
|---|---|
| <2.00 | 4 (2.09) |
| 2.00–3.99 | 134 (70.16) |
| 4.00–5.99 | 50 (26.18) |
| >5.99 | 3 (1.57) |
| Mean | 3.52 |
| SD | 0.91 |
| Minimum | 0.8 |
| Maximum | 6.43 |
Values in parentheses are percentages.
Table 4.
Effect of UIVs cultivation on household food security: negative binomial regression.
| HDD | Coef. | St. Err. | p-Value | dy/dx | Std. Err. | p-Value |
|---|---|---|---|---|---|---|
| Varieties of UIVs cultivated | 0.137 | 0.062 | 0.028 ** | 1.482 | 0.686 | 0.031 ** |
| Age of household head | 0.006 | 0.008 | 0.039 | 0.070 | 0.082 | 0.392 |
| Gender of household head | 0.002 | 0.134 | 0.990 | 0.017 | 1.449 | 0.990 |
| Years of formal education of household head | −0.004 | 0.013 | 0.770 | −0.042 | 0.143 | 0.770 |
| Marital status of the household head | 0.178 | 0.091 | 0.052 ** | 1.922 | 1.000 | 0.055 ** |
| Number of plots of UIVs farm | 0.009 | 0.007 | 0.195 | −0.097 | 0.075 | 0.198 |
| Farm distance from home | −0.037 | 0.021 | 0.083 * | −0.403 | 0.236 | 0.088 * |
| UIV land area | 0.388 | 0.134 | 0.004 *** | 4.201 | 1.495 | 0.005 *** |
| Access to extension agents | 0.003 | 0.115 | 0.977 | 0.036 | 1.249 | 0.977 |
| Off-farm income | −0.084 | 0.009 | 0.000 *** | −0.907 | 0.122 | 0.000 *** |
| UIVs gross margin | 0.083 | 0.013 | 0.000 *** | 0.895 | 0.160 | 0.0000 *** |
| Per capita food expenditure | 0.034 | 0.017 | 0.043 ** | 0.372 | 0.187 | 0.000 ** |
| Oyo | 0.385 | 0.128 | 0.003 *** | 4.166 | 1.435 | 0.004 *** |
| Ekiti | 0.077 | 0.157 | 0.624 | 0.835 | 1.705 | 0.624 |
| Constant | 1.583 | 0.442 | 0.000 *** | |||
| Mean dependent variable | 3.531 | |||||
| Pseudo r-squared | 0.1006 | |||||
| Chi-square | 127.36 | |||||
| SD dependent var | 0.892 | |||||
| Number of obs | 190.000 | |||||
| Prob > chi2 | 0.000 |
*** p < 0.01, ** p < 0.05, * p < 0.1.
Publisher’s Note: MDPI stays neutral with regard to jurisdictional claims in published maps and institutional affiliations. |
© 2021 by the authors. Licensee MDPI, Basel, Switzerland. This article is an open access article distributed under the terms and conditions of the Creative Commons Attribution (CC BY) license (https://creativecommons.org/licenses/by/4.0/).
Share and Cite
MDPI and ACS Style
Tanimonure, V.A.; Naziri, D.; Codjoe, S.N.A.; Ayanwale, A.B. Underutilised Indigenous Vegetables for Household Dietary Diversity in Southwest Nigeria. Agriculture 2021, 11, 1064. https://doi.org/10.3390/agriculture11111064
AMA Style
Tanimonure VA, Naziri D, Codjoe SNA, Ayanwale AB. Underutilised Indigenous Vegetables for Household Dietary Diversity in Southwest Nigeria. Agriculture. 2021; 11(11):1064. https://doi.org/10.3390/agriculture11111064
Chicago/Turabian StyleTanimonure, Victoria Adeyemi, Diego Naziri, Samuel Nii Ardey Codjoe, and Adeolu Babatunde Ayanwale. 2021. "Underutilised Indigenous Vegetables for Household Dietary Diversity in Southwest Nigeria" Agriculture 11, no. 11: 1064. https://doi.org/10.3390/agriculture11111064
Note that from the first issue of 2016, this journal uses article numbers instead of page numbers. See further details here.