3.1. Ultrafiltration
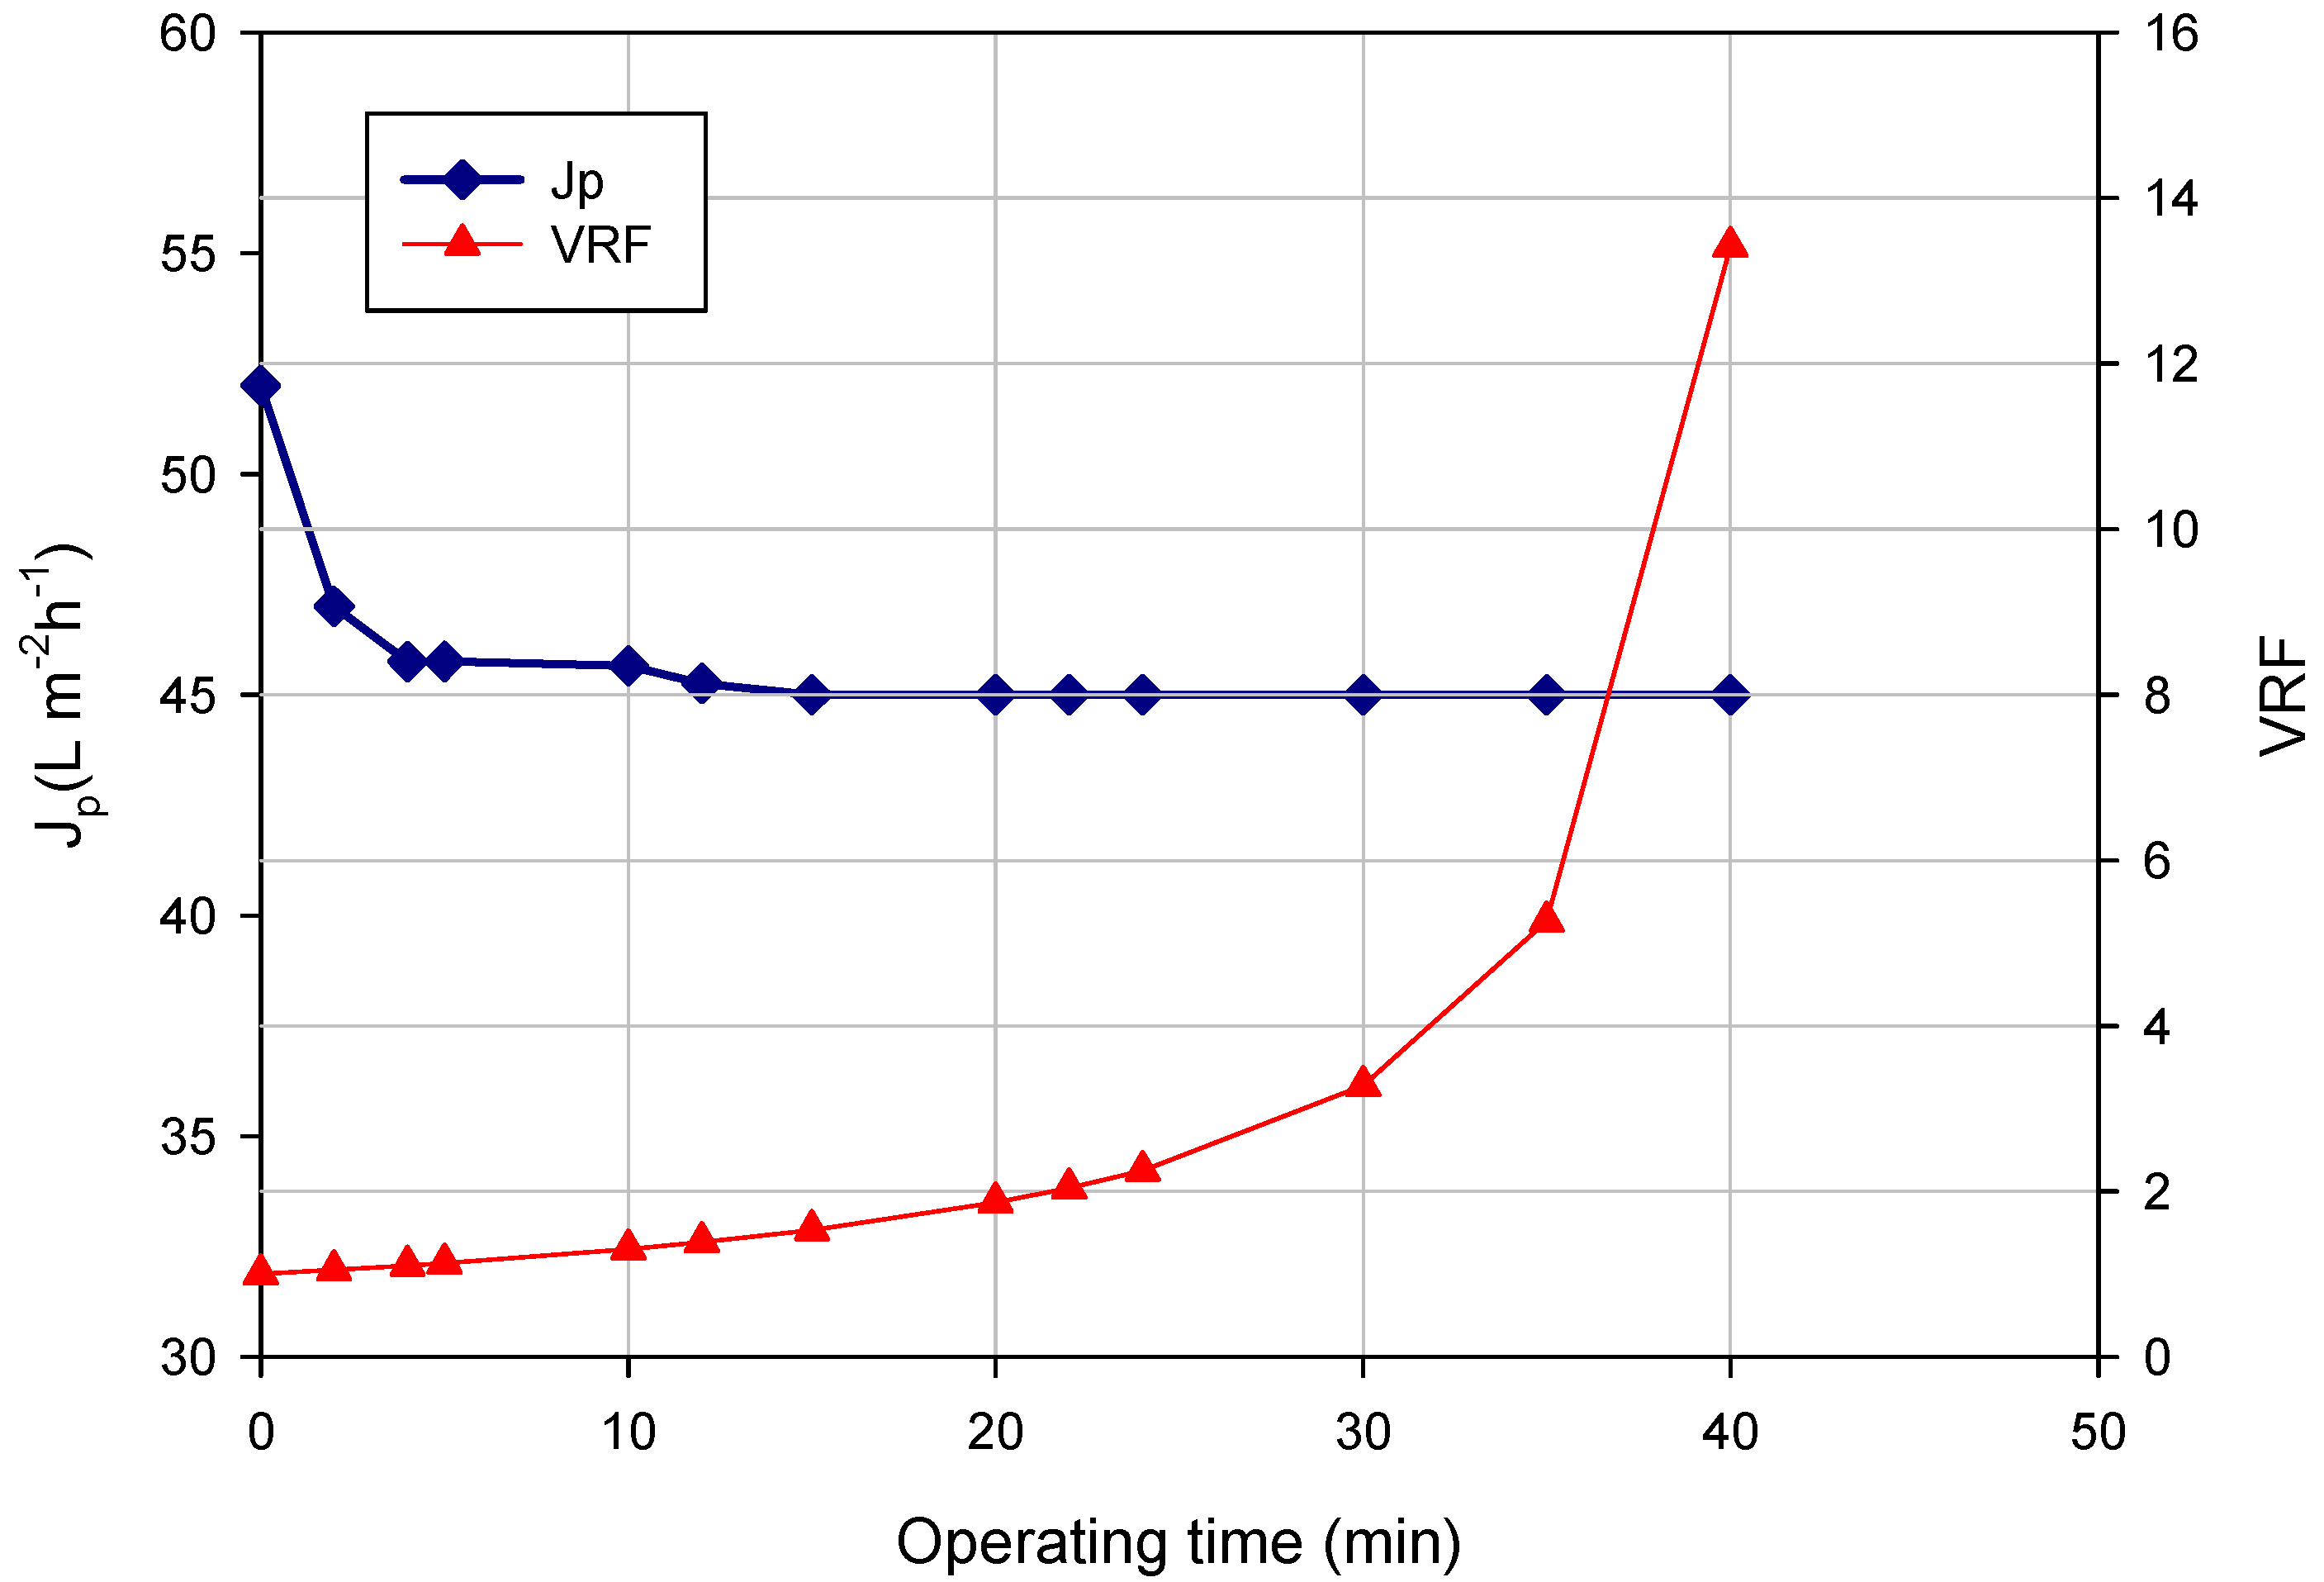
Figure 1 shows the time course of the permeate flux and VRF for the clarification of the orange press liquor in the selected operating conditions. Experimental data refer to the treatment of 39 L of raw press liquor and the production of about 36 L of clarified liquor (final VRF, 13.4).
Figure 1.
UF of orange press liquor. Time course of permeate flux (Jp) and VRF (operating conditions: transmembrane pressure (TMP), 0.54 bar; Qf, 500 L·h−1; temperature, 25 °C).
Figure 1.
UF of orange press liquor. Time course of permeate flux (Jp) and VRF (operating conditions: transmembrane pressure (TMP), 0.54 bar; Qf, 500 L·h−1; temperature, 25 °C).
The flux decline can be attributed to the accumulation of liquor components in the pores and on the membrane surface, which are responsible for membrane internal pore fouling and gel formation phenomena, respectively.
The initial permeate flux of about 52 L·m
−2·h
−1·bar
−1 reached a steady-state value of about 45 L·m
−2·h
−1·bar
−1 when the VRF was 1.4. Lower steady-state fluxes (2.7 kg·m
−2·h
−1) were observed when the same UF membrane was used to clarify the depectinized blood orange juice at higher TMP values (0.8 bar) [
26].
3.2. Nanofiltration
The clarified liquor was pre-concentrated by NF in selected operating conditions (TMP, 8 bar; temperature, 20 °C).
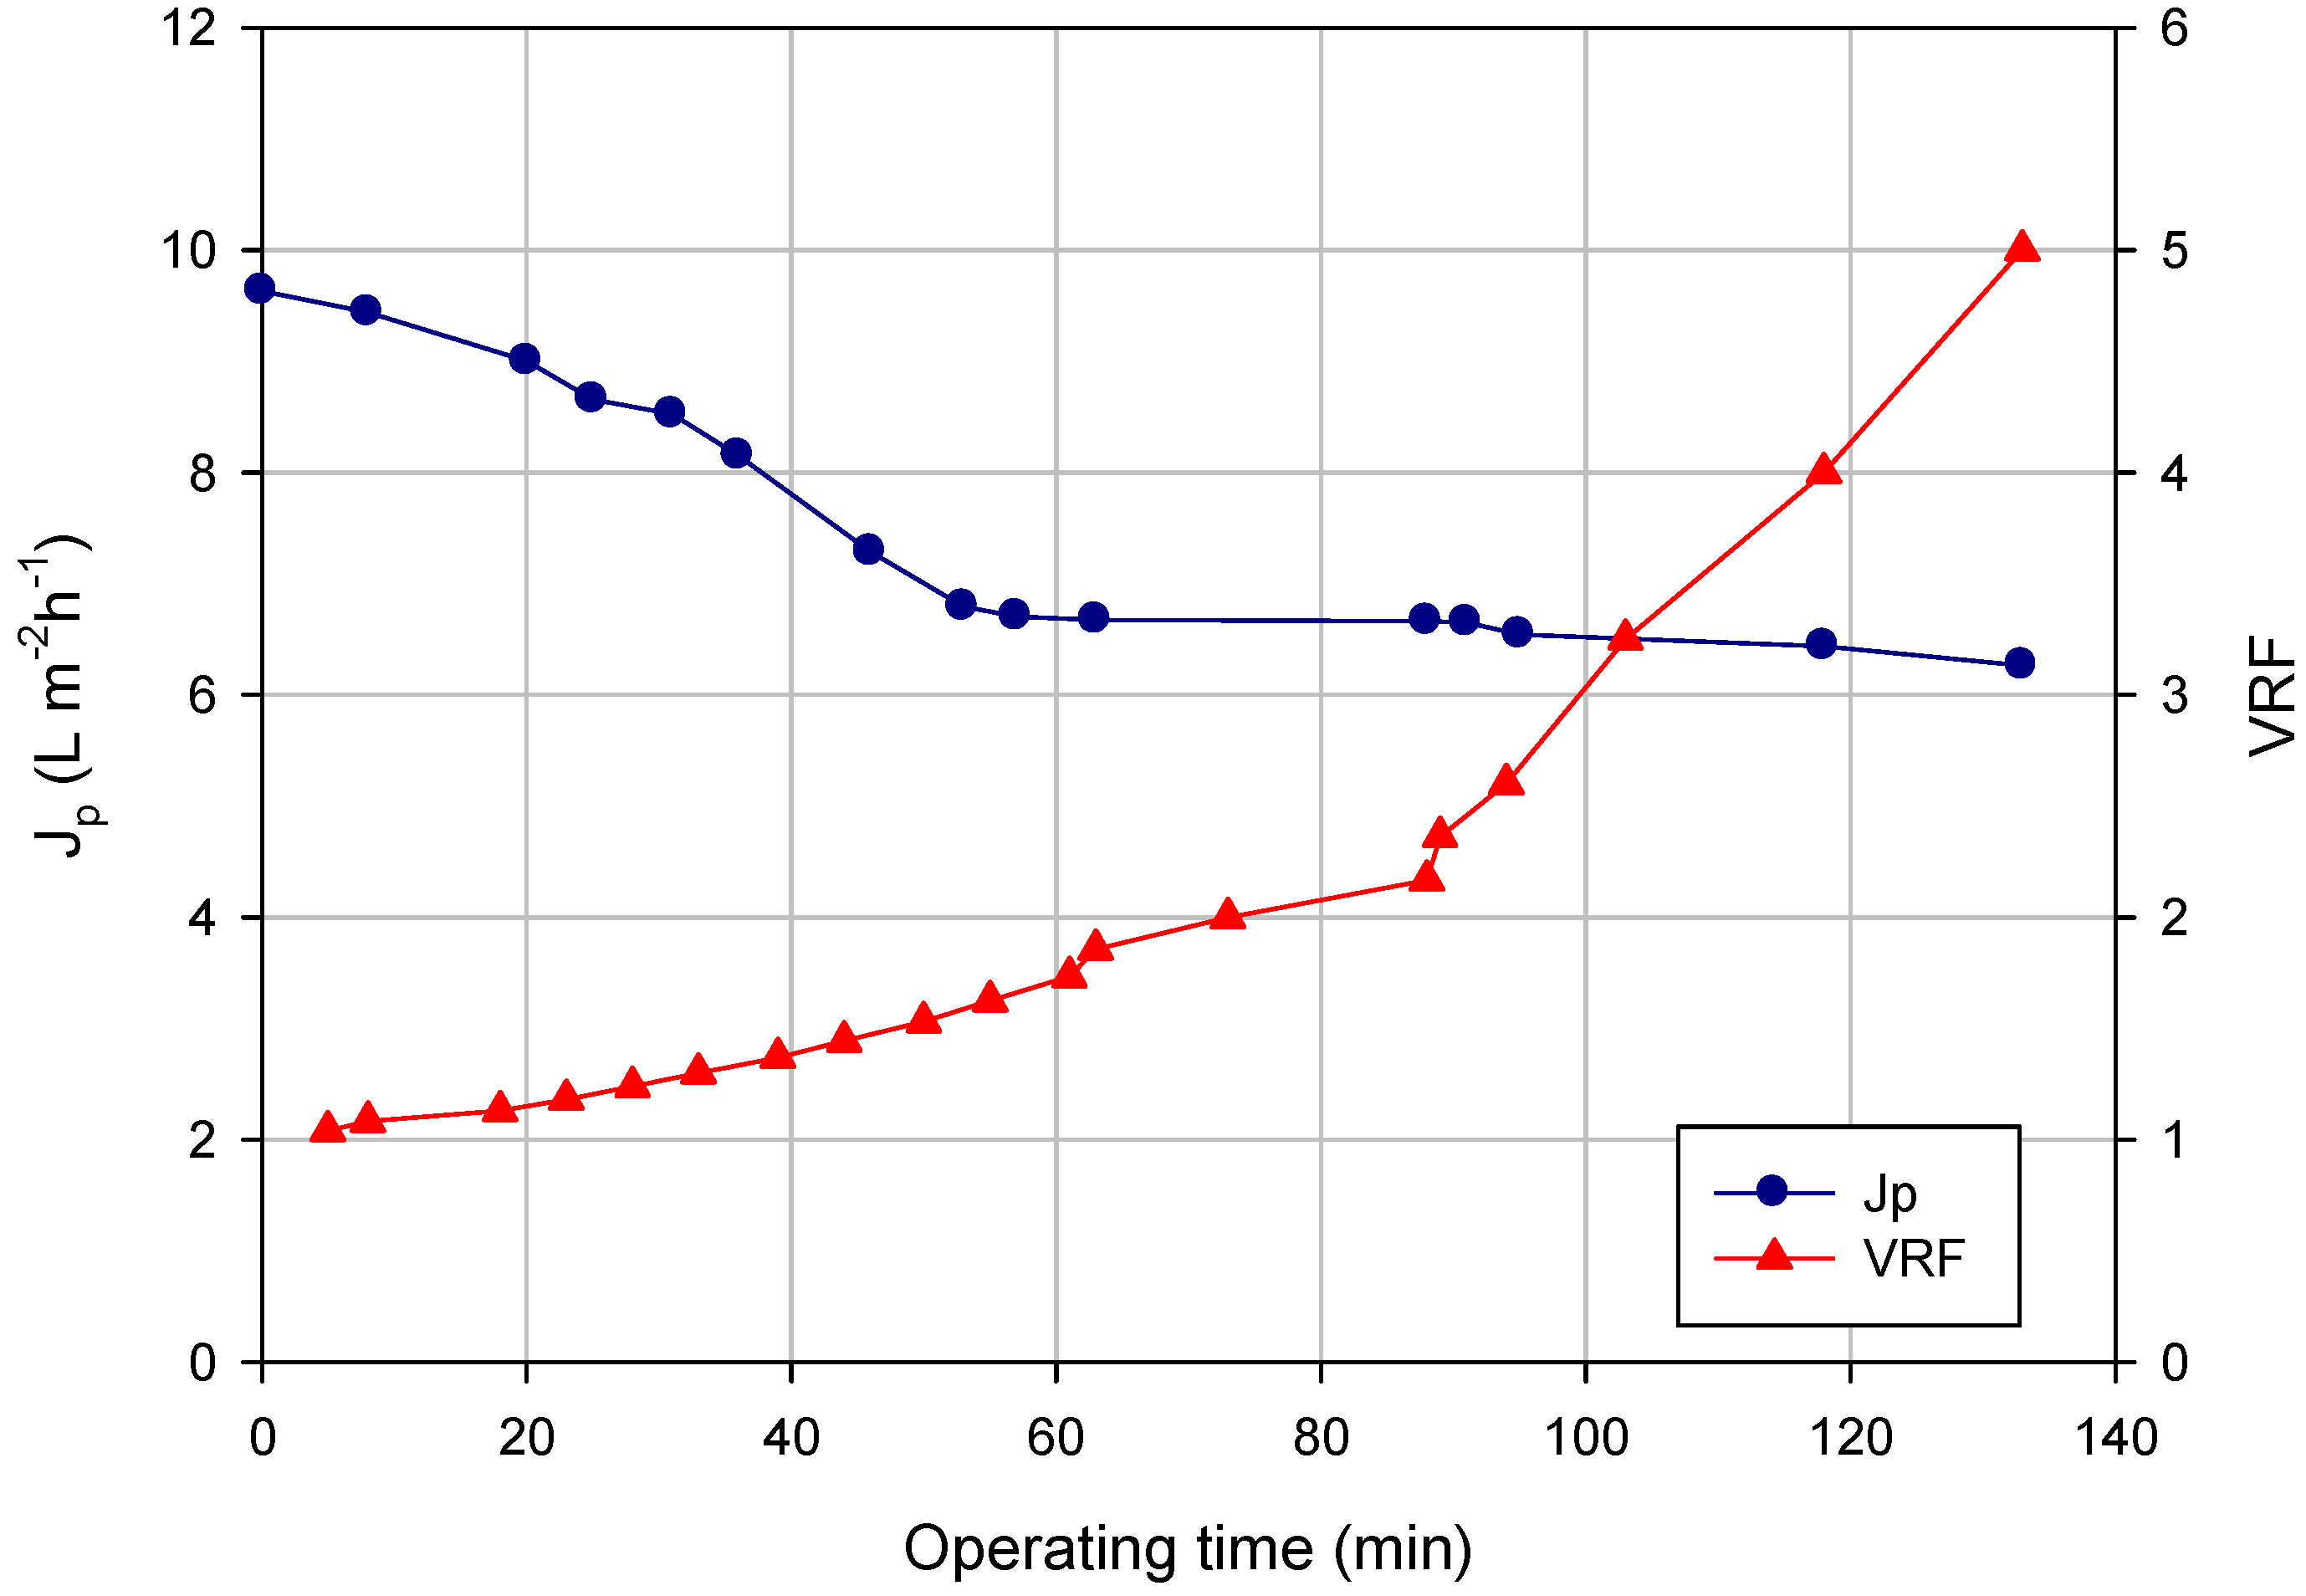
Figure 2 shows the time evolution of the permeate flux and of the VRF referring to an NF test carried out according to the batch concentration mode in which, starting from 26 L of clarified liquor, 20.8 L of permeate were produced (final VRF, five). The initial permeate flux of 9.6 L·m
−2·h
−1 decreased gradually in the first 60 min; then the permeate flux reached a steady-state permeate value of about 6 L·m
−2·h
−1 until to the final VRF. The flux decay can be attributed to the adsorption of specific compounds on the membrane surface or within membrane pores. In particular, the adsorptive fouling of phenolic compounds on PES membranes is influenced by the pore size, polar interactions (van der Waals, electron donor-acceptor interaction) and multiple hydrogen bonds towards the additive polyvinylpyrrolidone (PVP) used in the manufacture of PES membranes [
27]. An increase of both the adsorbed amount and affinity for polyphenol binding to PES membranes with increasing PVP content was also reported by [
28]. In addition, mixtures of polyphenols with other components, such as polysaccharides, could form aggregates having a strong contribution to adsorptive fouling of PES membranes [
29].
Figure 2.
The NF of orange press liquor. The time course of permeate flux and VRF (operating conditions: TMP, 8 bar; Qf, 400 L·h−1; temperature, 20 °C).
Figure 2.
The NF of orange press liquor. The time course of permeate flux and VRF (operating conditions: TMP, 8 bar; Qf, 400 L·h−1; temperature, 20 °C).
In a previous work performed on the unclarified press liquor [
30], the NF-PES 10 membrane exhibited an initial permeate flux of 10.4 L·m
−2·h
−1 and a steady-state permeate flux of 3.4 L·m
−2·h
−1 when the system was operated at a TMP of 6 bar and a temperature of 20 °C up to a final VRF of three. According to our data, the UF step allowed the application of high flow-rates and the maximization of yields during the NF treatment. Similar results were also obtained in the clarification and concentration of grape juice by an integrated UF-OD process [
31].
3.3. Osmotic Distillationmol
The NF retentate was finally concentrated by OD.
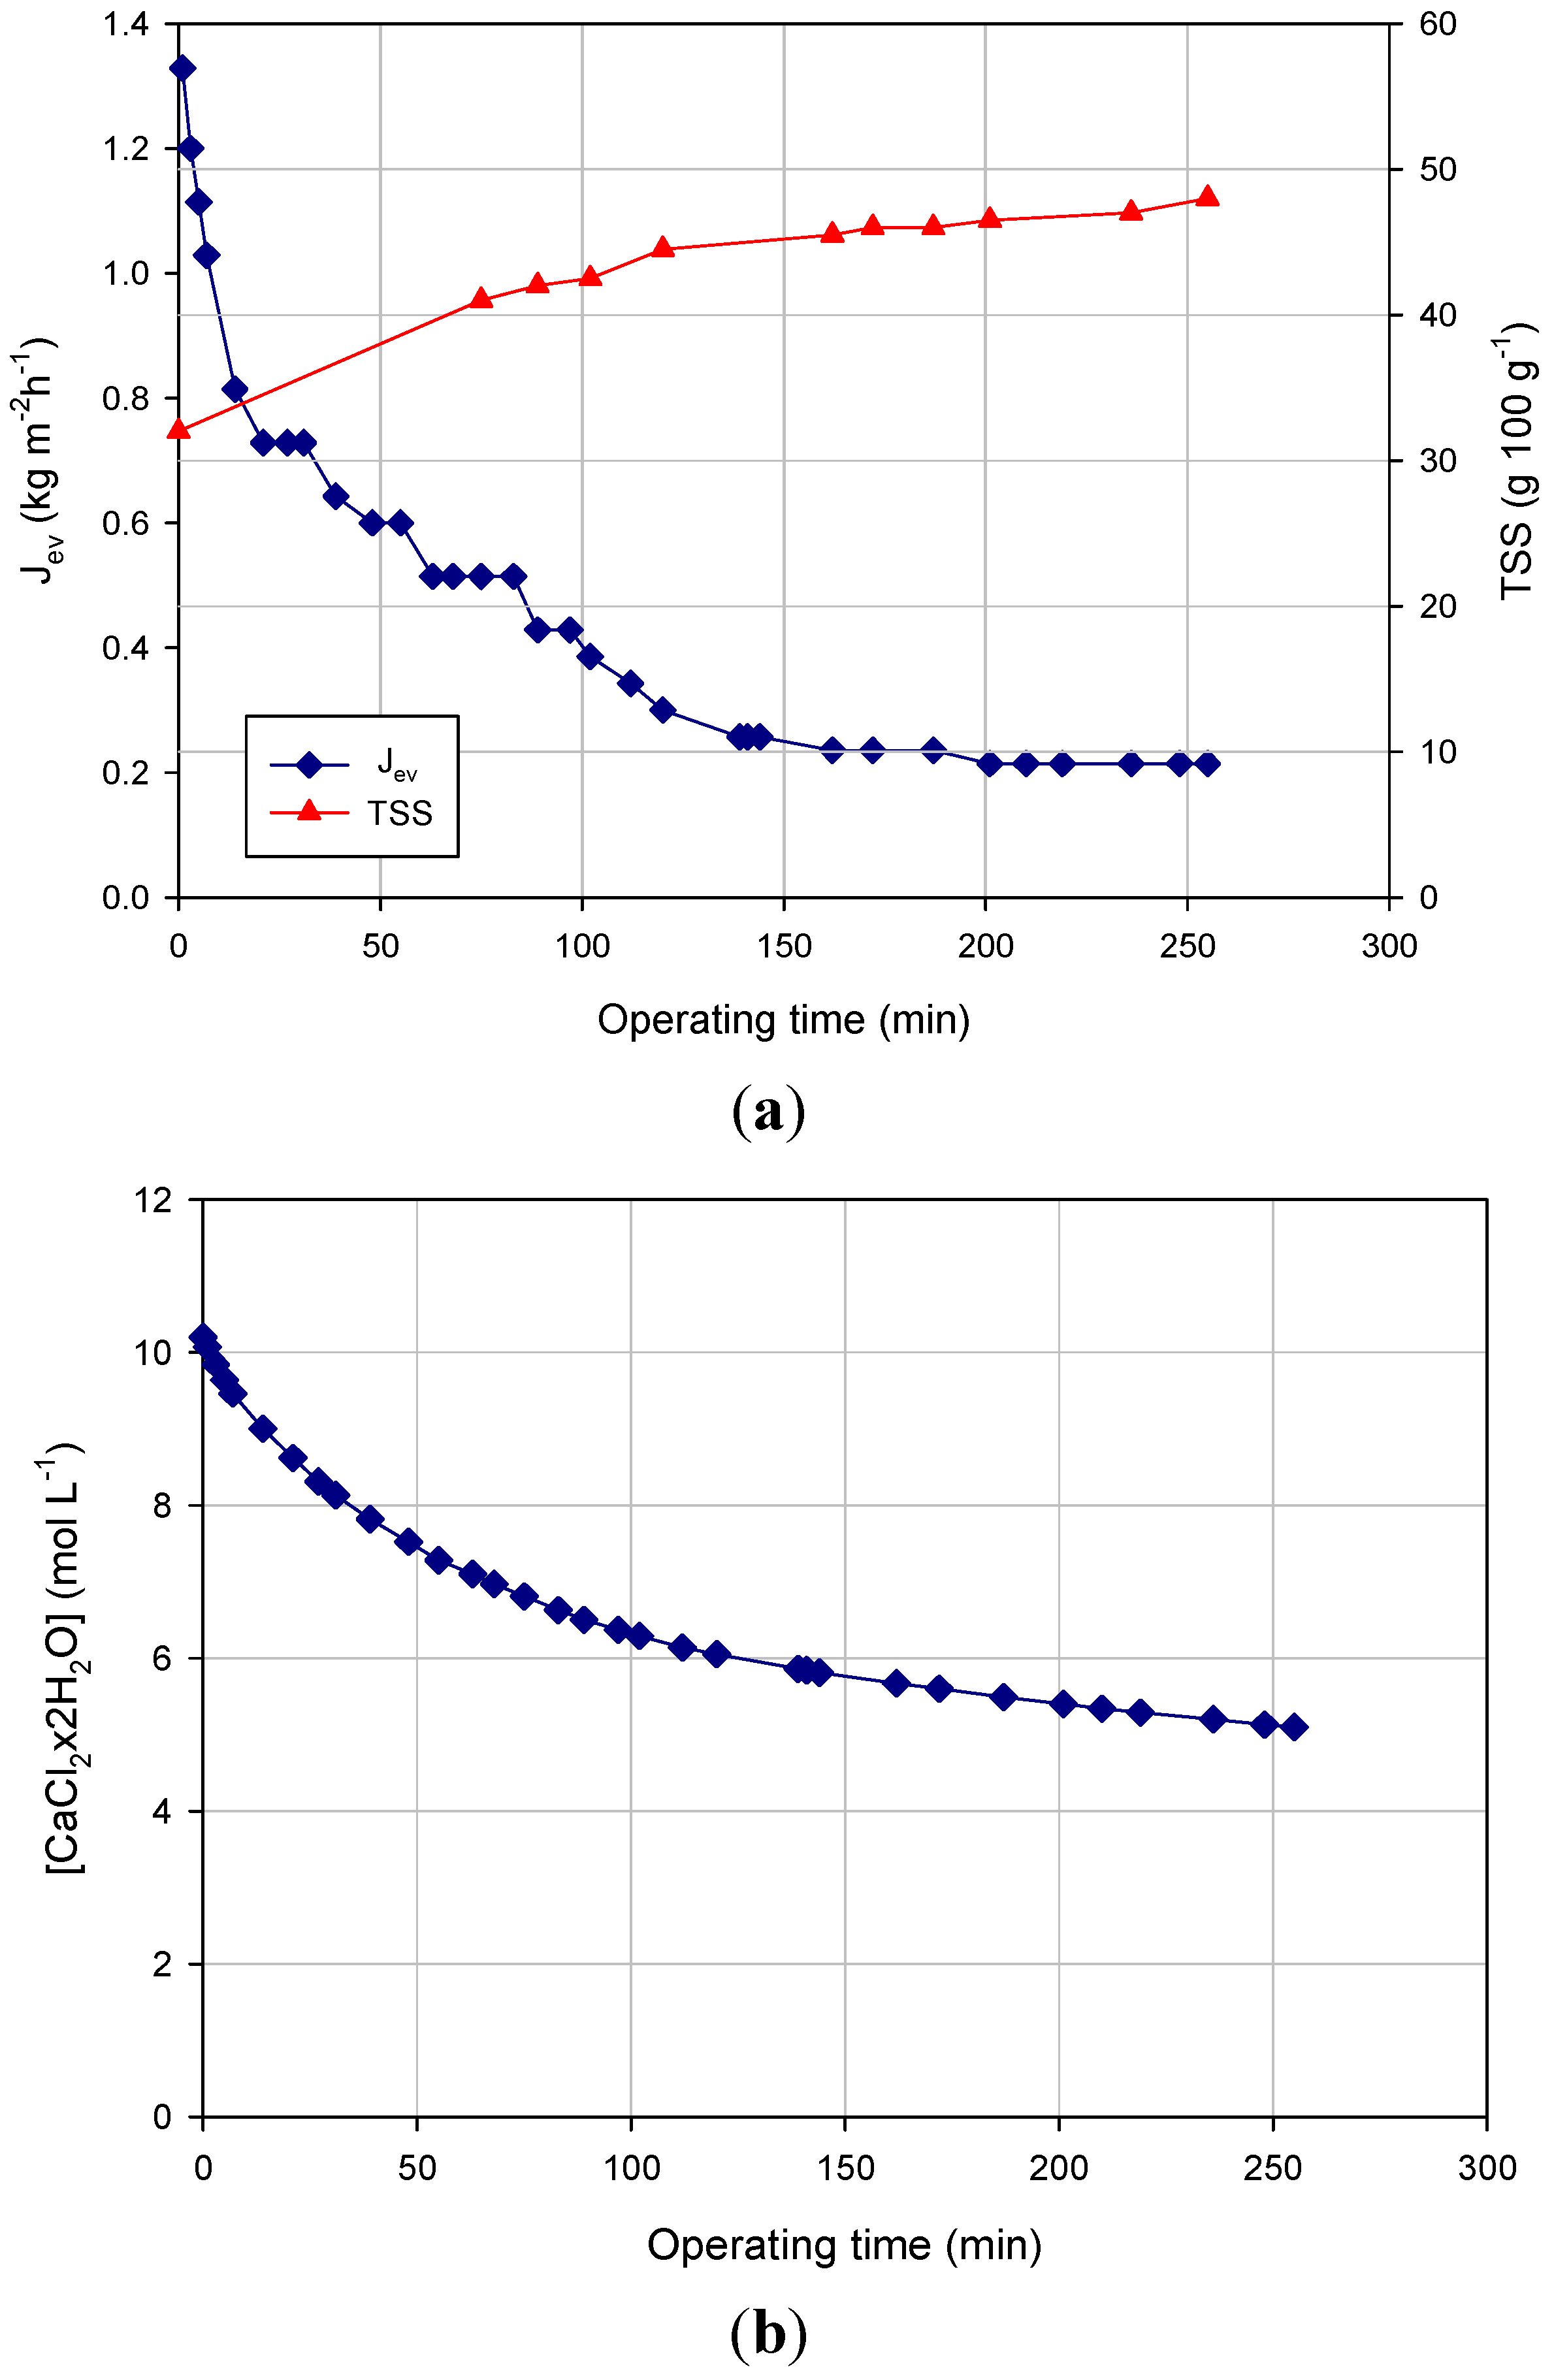
Figure 3 shows the experimental results related to the concentration of the NF retentate within a closed loop from 32 g TSS 100 g
−1 up to 47 g TSS 100 g
−1. At first, the brine concentration was 10 mol·L
−1, producing an evaporation flux of 1.32 kg·m
−2·h
−1. The evaporation flux decreased gradually during the process to reach a final value of 0.21 kg·m
−2·h
−1 corresponding to a final concentration of 47 g TSS 100 g
−1 (
Figure 3a). The decrease of evaporation flux can be mainly attributed to the dilution of the brine solution. In particular, a 43% decrease of the brine concentration in the range 0–150 min (from 10.2 mol·L
−1 to 5.8 mol·L
−1) (
Figure 3b) produced a water vapor flux decay of about 83%. This result shows the strong influence of the brine concentration on the evaporation flux and, consequently, on the driving force of the OD process.
In the range 150–250 min, the evaporation flux remained unchanged despite the increase in the TSS concentration of the liquor. Adversely, studies performed on the concentration of fruit juices and sucrose solutions by OD showed a decreasing of the evaporation flux when the TSS concentration was higher than 30–35 g·100 g
−1 [
32,
33].
Figure 3.
Concentration of NF retentate by OD. Time course of (a) evaporation flux and TSS; (b) stripping solution concentration (operating conditions: TMP, 0.28 bar; temperature, 28 ± 2 °C; Qf, 66 L·h−1; Qb, 26 L·h−1).
Figure 3.
Concentration of NF retentate by OD. Time course of (a) evaporation flux and TSS; (b) stripping solution concentration (operating conditions: TMP, 0.28 bar; temperature, 28 ± 2 °C; Qf, 66 L·h−1; Qb, 26 L·h−1).
3.4. Retention of Flavonoids
The UF membrane removed all suspended solids from the raw press liquor, producing a clear solution with a content of flavanones and anthocyanins similar to that of the initial liquor. Indeed, the rejection of the UF membrane towards flavanones and anthocyanins was lower than 1%. The clarified liquor contained almost all of the soluble solids of the initial feed (10 g·100 g
−1 if compared to 10.1 g·100 g
−1 of the raw press liquor) (
Table 4). The TSS content appeared to be higher in the retentate stream than in the clarified liquor: this phenomenon can be attributed to the high suspended solid content of the feed solution, which can interfere with the measurements of the refractive index.
The NF process produced a pre-concentrated liquor with 32 g TSS 100 g
−1 from the clarified liquor. During the NF process, phenolic compounds were concentrated in the retentate side. The rejection of the NF membrane towards flavanones and anthocyanins was 97.4% and 98.9%, respectively. Similar rejections for the anthocyanins were measured by Cissé
et al. [
16] in the treatment of
Roselle extract with the same NF membrane, but in flat-sheet configuration (designed as NP010).
Table 4.
Analytical evaluation of anthocyanins and flavanones in samples of press liquor coming from the UF treatment.
Table 4.
Analytical evaluation of anthocyanins and flavanones in samples of press liquor coming from the UF treatment.
| Sample | Suspended Solids (%) | TSS (g·100 g−1) | Total Flavanones (g·HE·L−1) | Total Anthocyanins (g·L−1) |
|---|
| Feed UF | 7.13 | 10.1 | 22.850 | 3.160 |
| Permeate UF | 0 | 10.0 | 22.801 | 3.065 |
| Retentate UF | 93.6 | 10.2 | 22.900 | 3.380 |
The high rejection for anthocyanin compounds can be explained assuming that anthocyanins, unlike other subgroups of flavonoids with a similar C6-C3-C6 skeleton, have a positive charge in their structure at acidic pH. The pH of the clarified press liquor is about three; at this pH value, the selected membrane exhibits a positive charge. In particular, data reported in the literature indicate a zeta potential of 1 mV at pH 3 for the NFPES10 membrane [
34]. Consequently, the electrostatic repulsion contributes to the high rejection of the NF membrane towards anthocyanins.
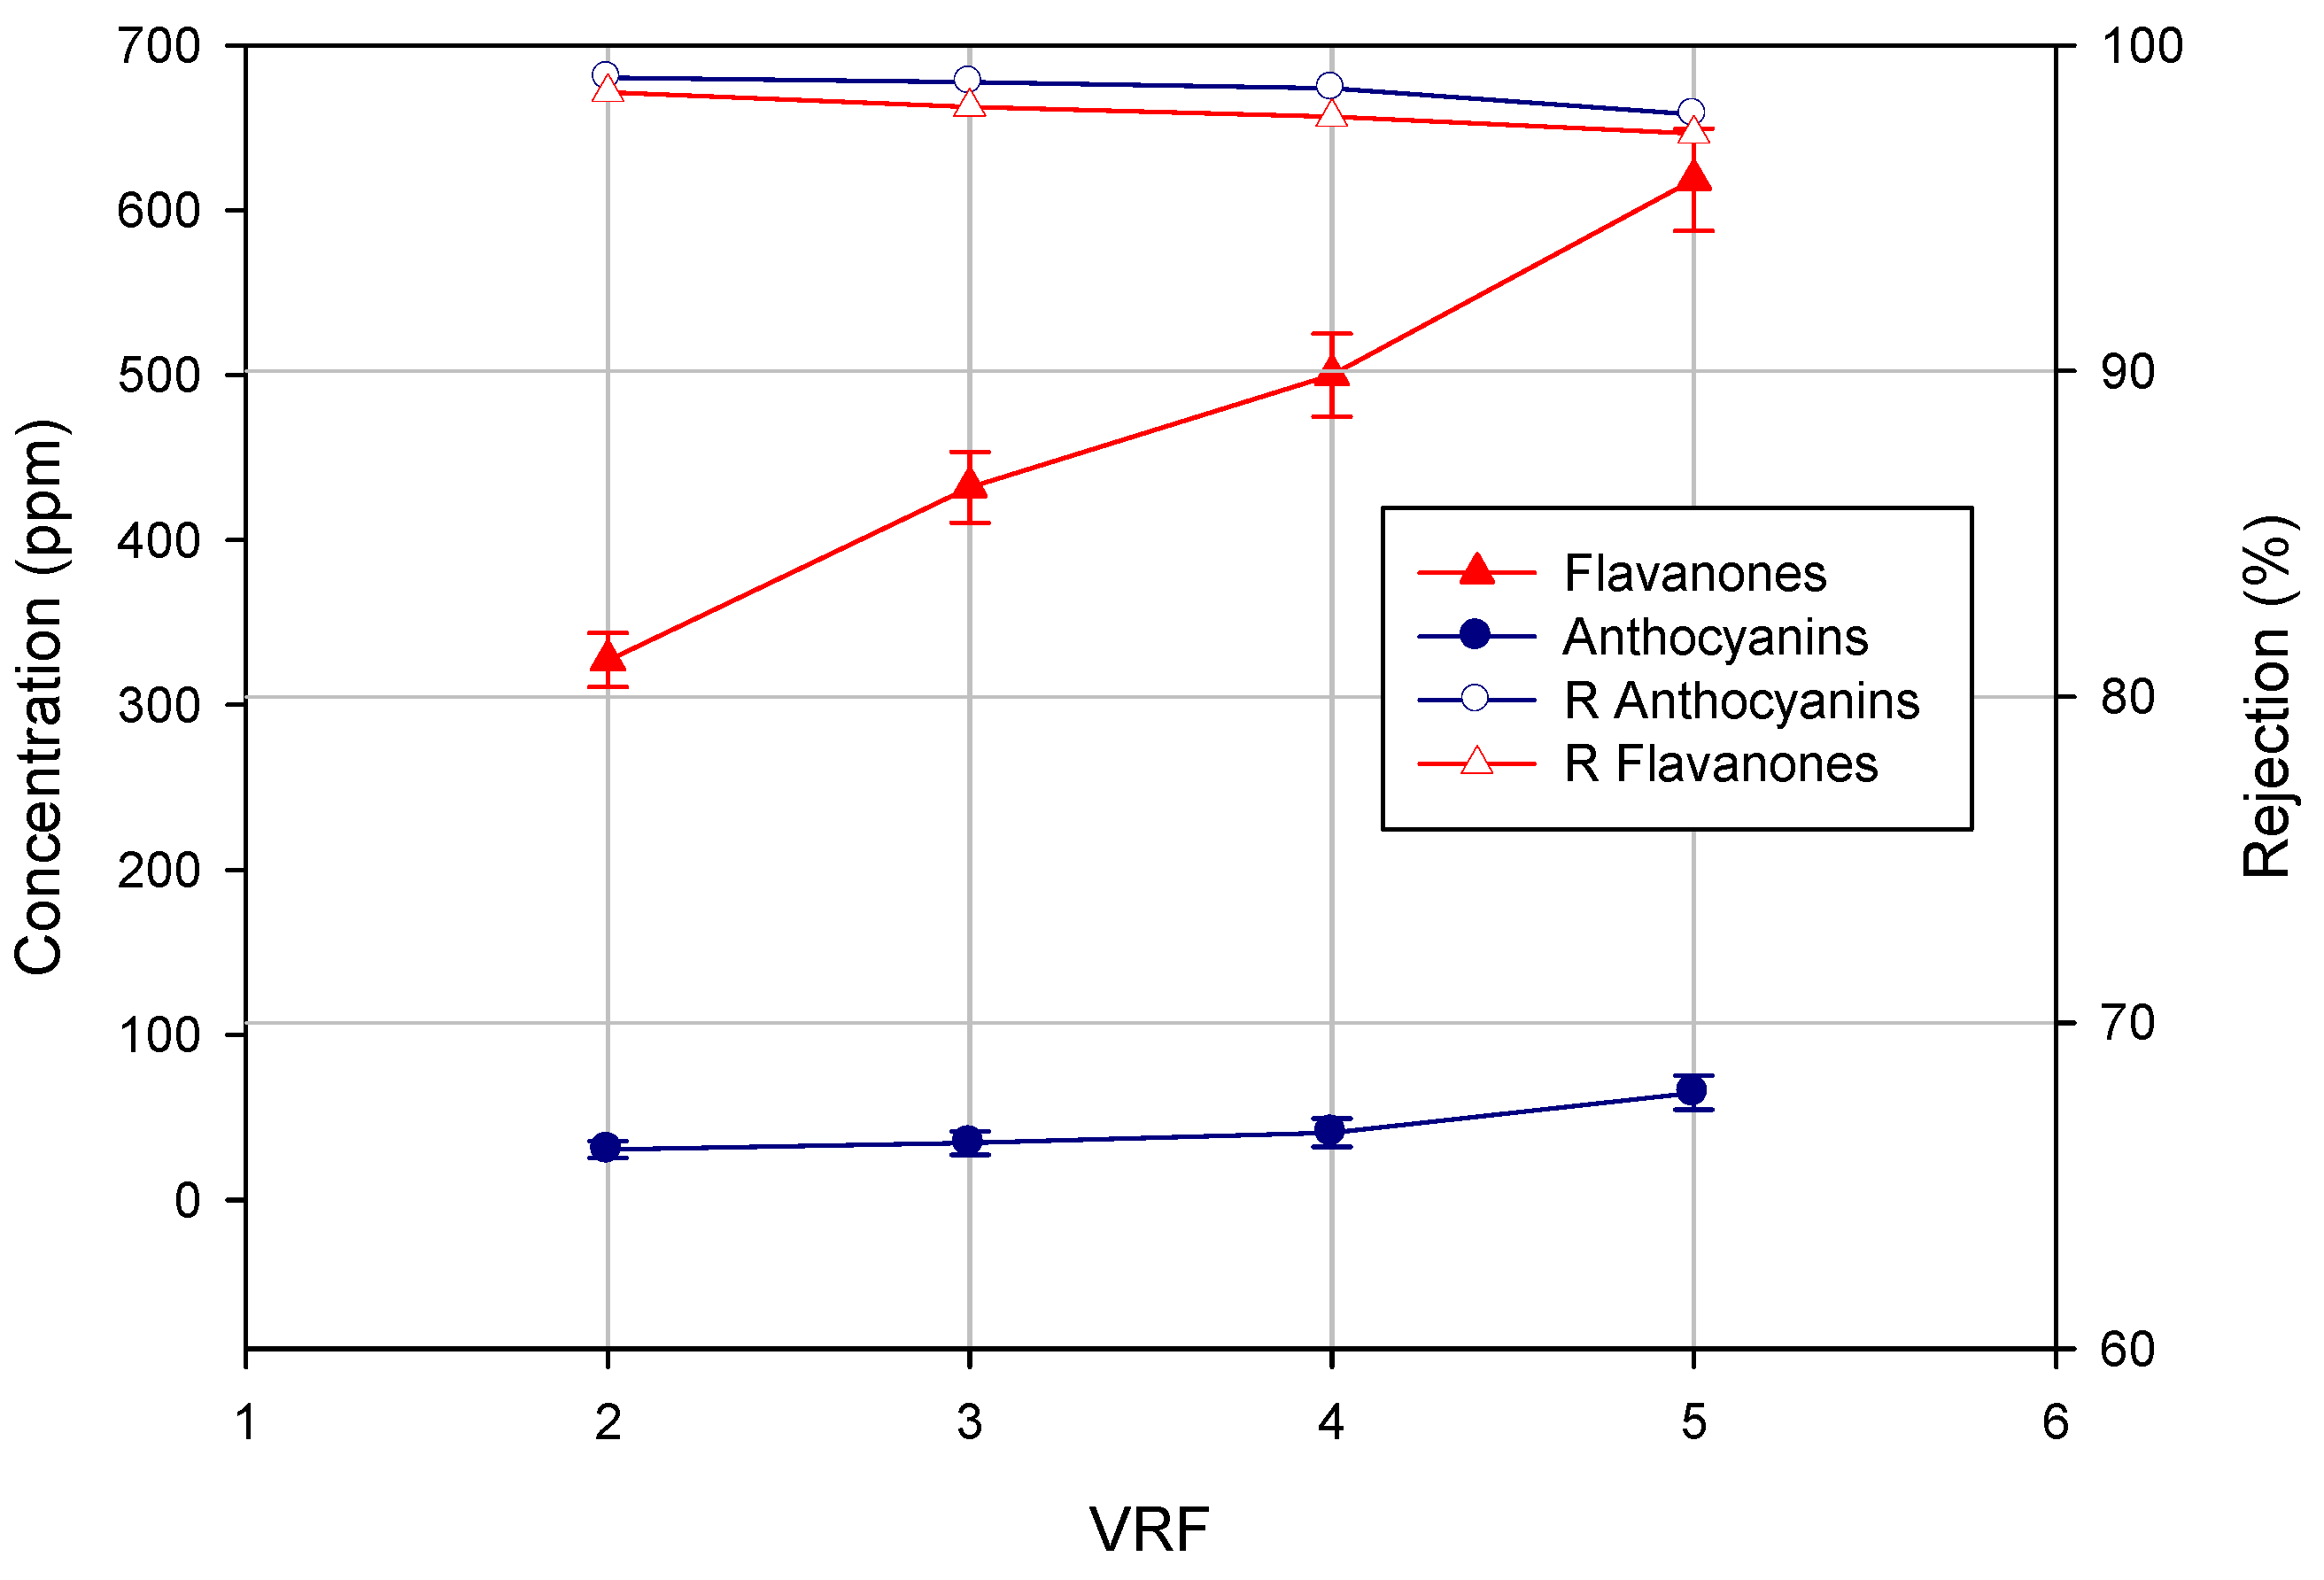
As shown in
Figure 4, the concentration of both flavanones and anthocyanins in the permeate stream increased by increasing the VRF. Consequently, the rejection values decreased slightly with increases in the VRF. These results are representative of filtration processes in the batch concentration configuration: the increase of VRF leads to an increase of the concentration of phenolic compounds in the feed solution, which facilitates their transport to the NF membrane, thus increasing slightly their concentration in the permeate stream according to the diffusion control theory [
35]. Similar results were obtained in the removal of pharmaceutically active compounds from drinking water sources [
36,
37].
Figure 4.
Concentration of flavanones and anthocyanins in the NF permeate as a function of VRF.
Figure 4.
Concentration of flavanones and anthocyanins in the NF permeate as a function of VRF.
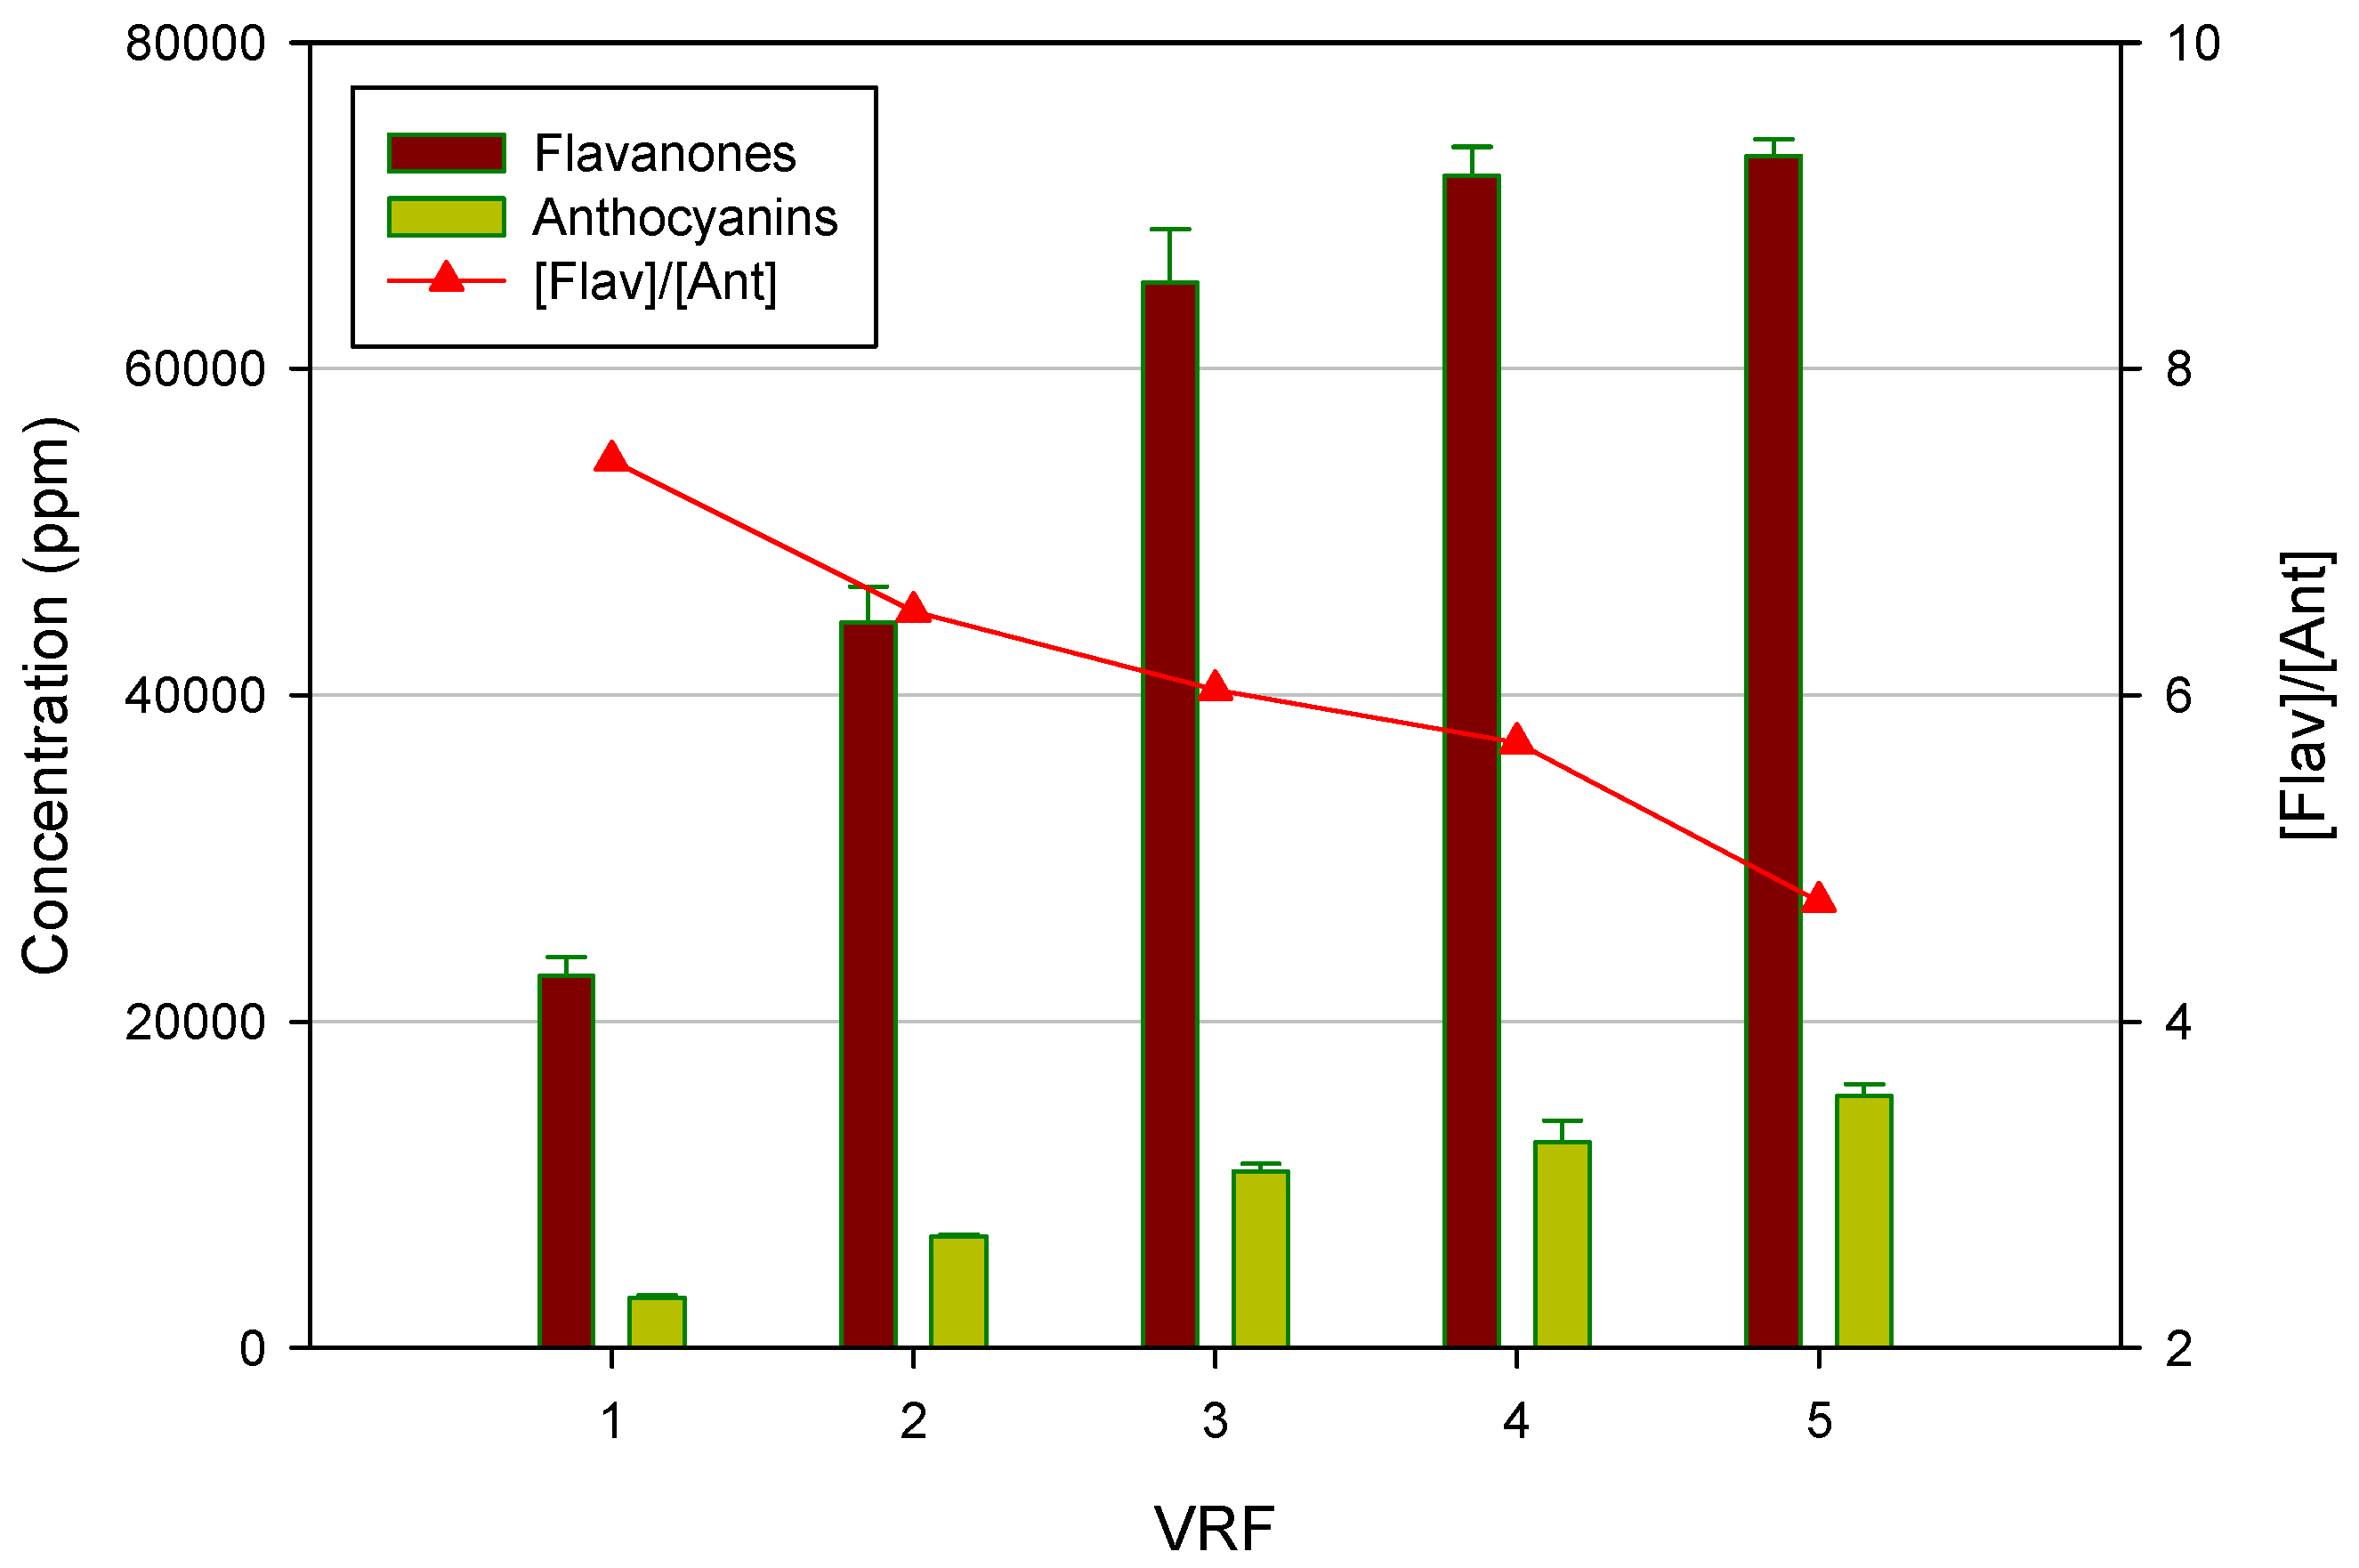
Figure 5 shows the effect of VRF on the concentration of both flavanones and anthocyanins in the NF retentate. As expected, the concentration of both compounds increased by increasing the VRF. Interestingly, the ratio between flavanones and anthocyanins decreased when the VRF was raised. In particular, the initial flavanones/anthocyanins ratio of 7.43 was reduced up to 4.73 at VRF five. This result is of particular interest for the exploitation of the product at an industrial level. Indeed, the clarified press liquor is configurable as an intermediate product characterized by a low coloring power and a strong bittering capacity, due to the higher concentration of flavanones. In order to use the product as a food coloring, it is necessary to balance the flavonoid content in relation to anthocyanin compounds, so as to interfere as little as possible with the organoleptic characteristics of the product under staining. Therefore, the control and the optimization of the VRF in the NF process can be exploited to modify the ratio between flavanones and anthocyanins in order to characterize the final product for its bittering capacity and coloring power.
Figure 5.
Concentration of flavanones and anthocyanins in the NF retentate as a function of VRF.
Figure 5.
Concentration of flavanones and anthocyanins in the NF retentate as a function of VRF.
In
Table 5, the total content of anthocyanins, flavanones and soluble solids in the retentate fractions of both of the NF and OD processes is reported. The concentration factor of anthocyanins in the final OD retentate was in agreement with that of the TSS content due to the water removal. The lowest concentration factor reached for flavanones in the NF retentate could be attributed to the adsorption phenomena of these compounds on the NF membrane.
Table 5.
Analytical evaluations of total anthocyanins, flavanones and TSS in samples of clarified liquor from NF-OD treatments.
Table 5.
Analytical evaluations of total anthocyanins, flavanones and TSS in samples of clarified liquor from NF-OD treatments.
| Sample | TSS | Total Anthocyanins | Total Flavanones |
|---|
| (g·100 g−1) | (g·L−1) | (g·HE·L−1) |
|---|
| Feed NF | 10.0 | 3.065 | 22.801 |
| Retentate NF | 32.0 | 15.425 | 72.160 |
| Retentate OD | 47.0 | 20.978 | 98.250 |
In
Table 6, HPLC determinations of different anthocyanin compounds in the clarified press liquor and NF and OD retentates are reported. As can be seen, cyanidin-3-glucoside chloride was the predominant anthocyanin compound of the clarified press liquor (feed NF), followed by myrtillin chloride and peonidin-3-glucoside chloride.
Table 6.
Analytical evaluations of individual anthocyanins in samples of clarified liquor from NF-OD treatments.
Table 6.
Analytical evaluations of individual anthocyanins in samples of clarified liquor from NF-OD treatments.
| Sample | Cyanin Chloride | Cyanidin-3-glucoside Chloride | Myrtillin Chloride | Peonidin-3-glucoside Chloride |
|---|
| (ppm) | (ppm) | (ppm) | (ppm) |
|---|
| Feed NF | 84.83 | 255.6 | 55.23 | 53.04 |
| Retentate NF | – | 1304.34 | 300.51 | 213.20 |
| Retentate OD | 639.19 | 1787.70 | 400.63 | 399.67 |
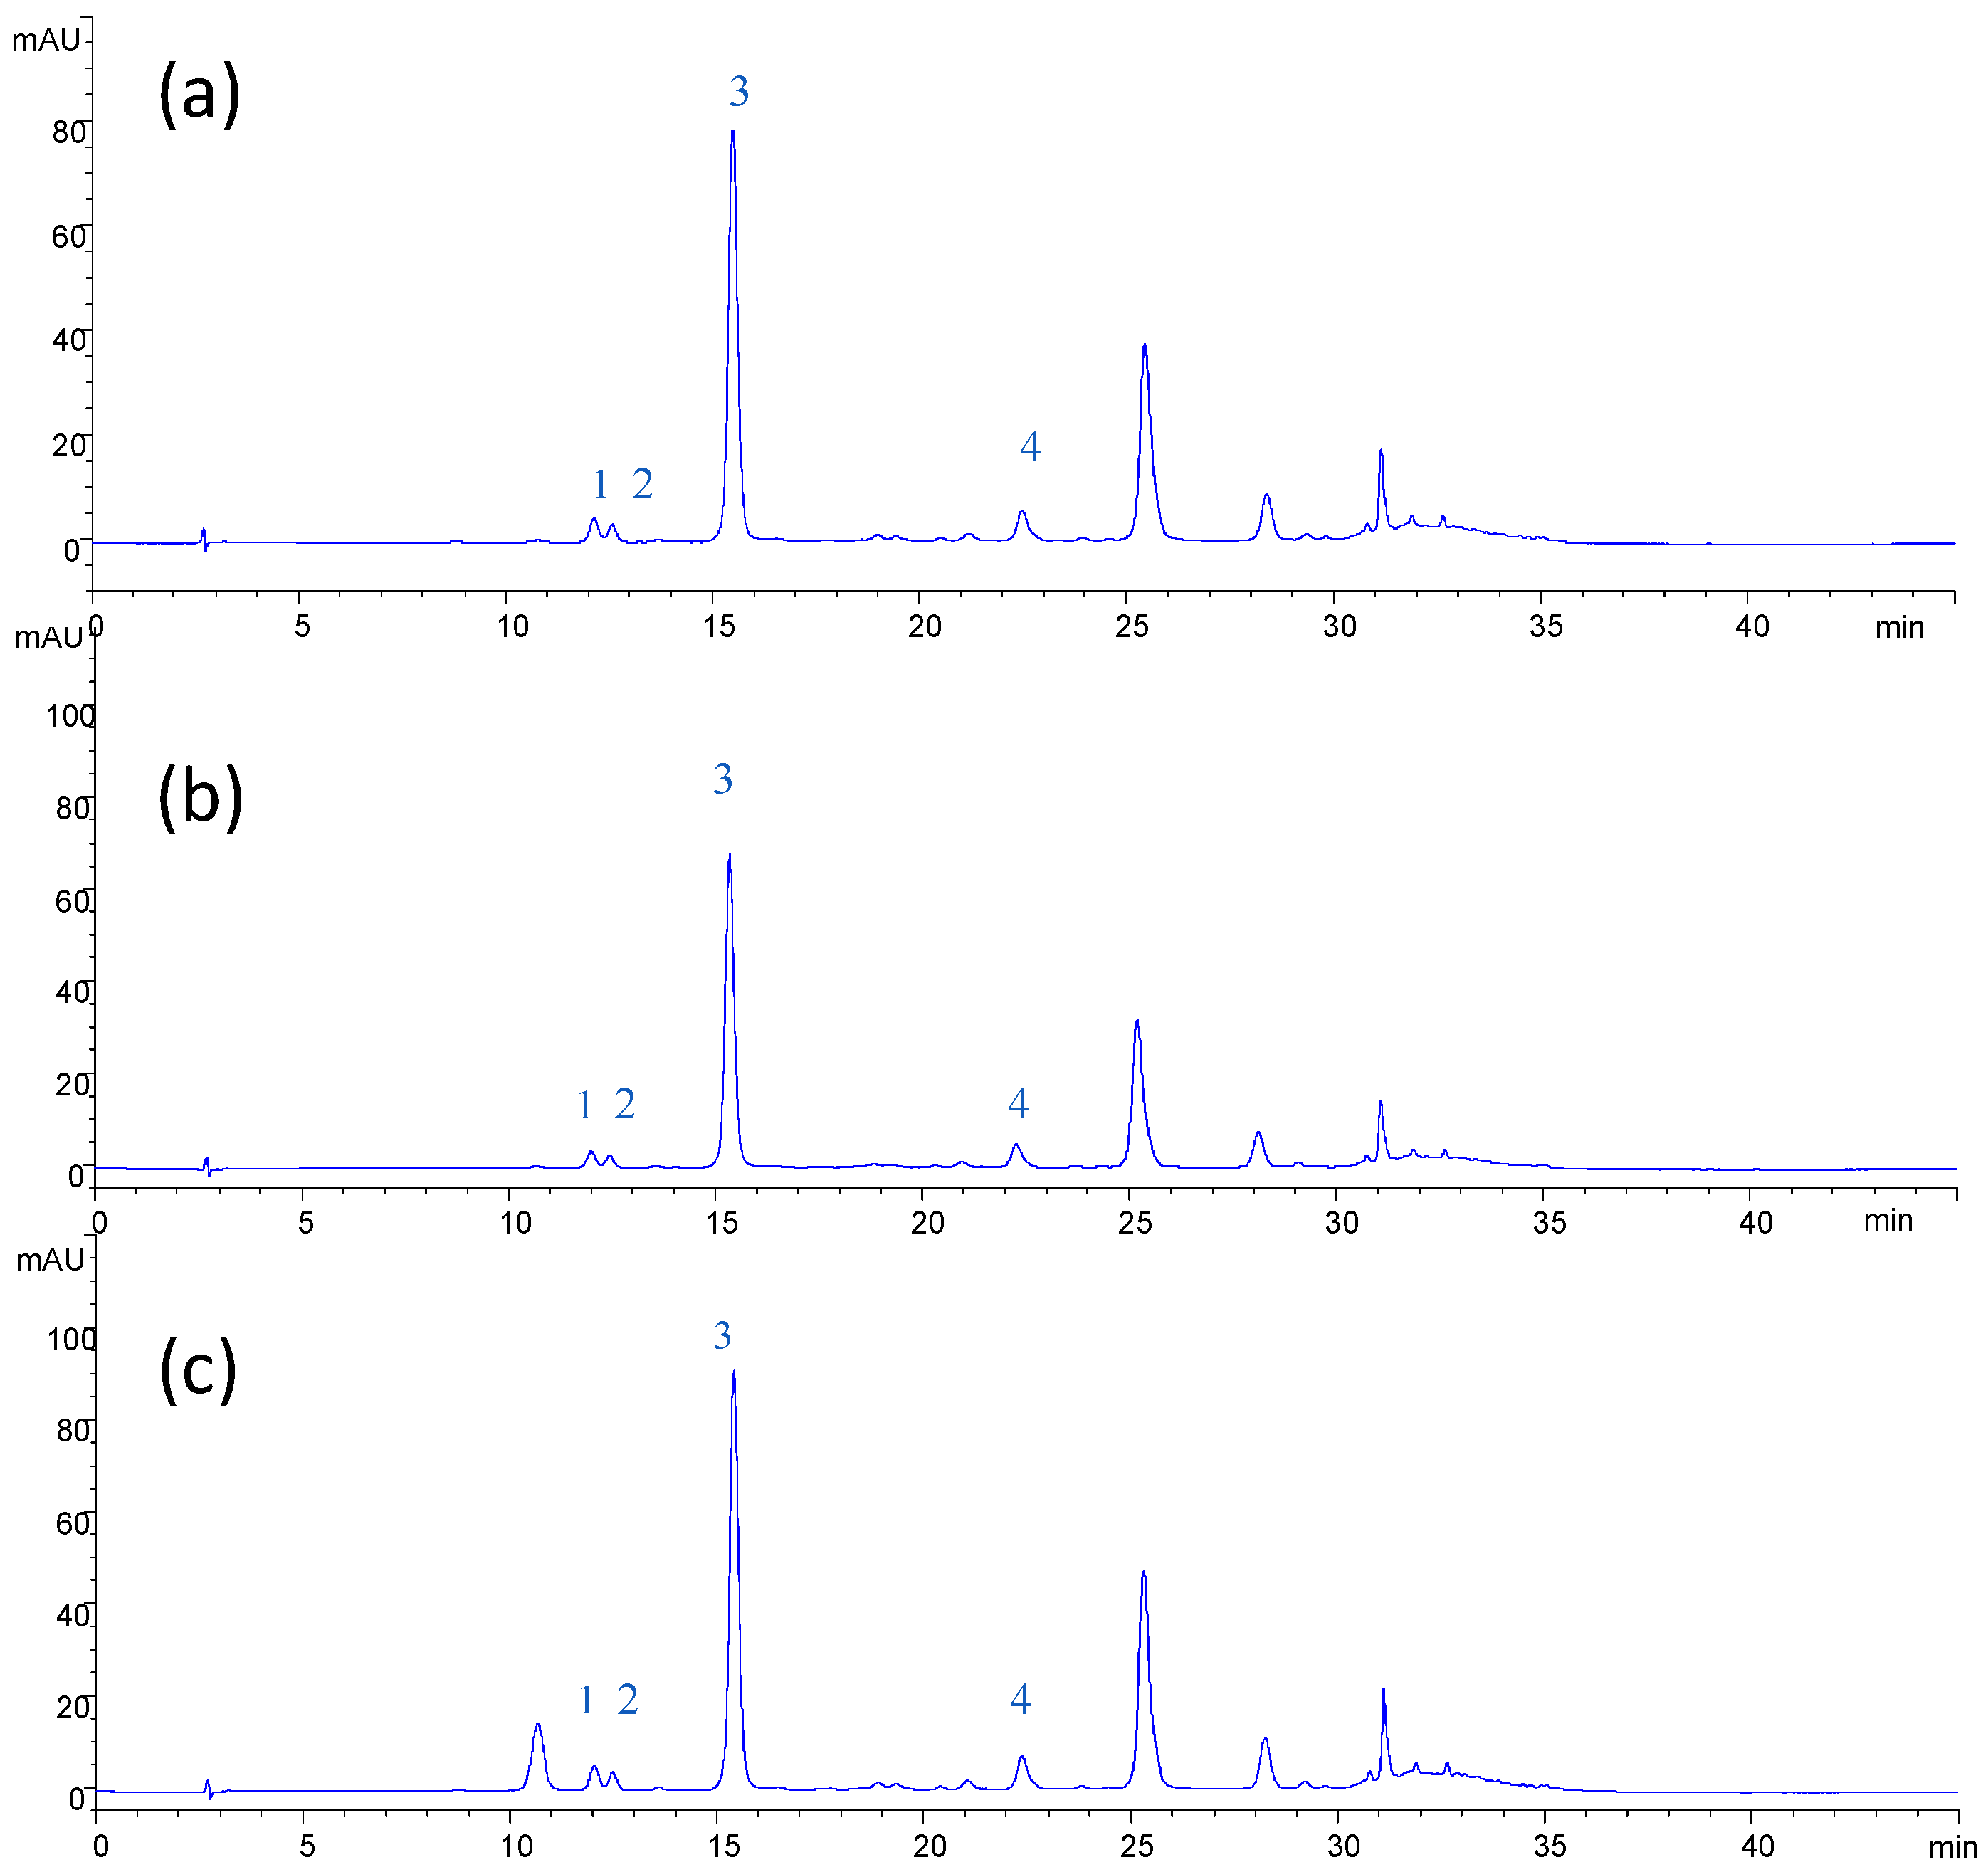
The chromatographic profiles of anthocyanins in the samples of NF feed, NF and OD retentates (
Figure 6) indicated that anthocyanin compounds are well preserved during the clarification and concentration of the press liquor with the selected membranes. These results confirm the possibility of producing at low temperatures preconcentrated extracts without thermal damage before final concentration by OD [
16]. On the other hand, a strong degradation of anthocyanin pigments in the pomegranate juice was observed when the juice is concentrated by thermal evaporation accomplished by the presence of significant levels of 5-hydroxymethyl furfural (an indicator of the potential browning of the juice) and by the reduction of minerals [
38].
Figure 6.
HPLC chromatogram of anthocyanins. (a) Clarified press liquor; (b) NF retentate; (c) OD retentate. Peaks: 1, cyanin chloride; 2, myrtillin chloride; 3, cyanidin-3-glucoside chloride; 4, peonidin-3-glucoside chloride.
Figure 6.
HPLC chromatogram of anthocyanins. (a) Clarified press liquor; (b) NF retentate; (c) OD retentate. Peaks: 1, cyanin chloride; 2, myrtillin chloride; 3, cyanidin-3-glucoside chloride; 4, peonidin-3-glucoside chloride.
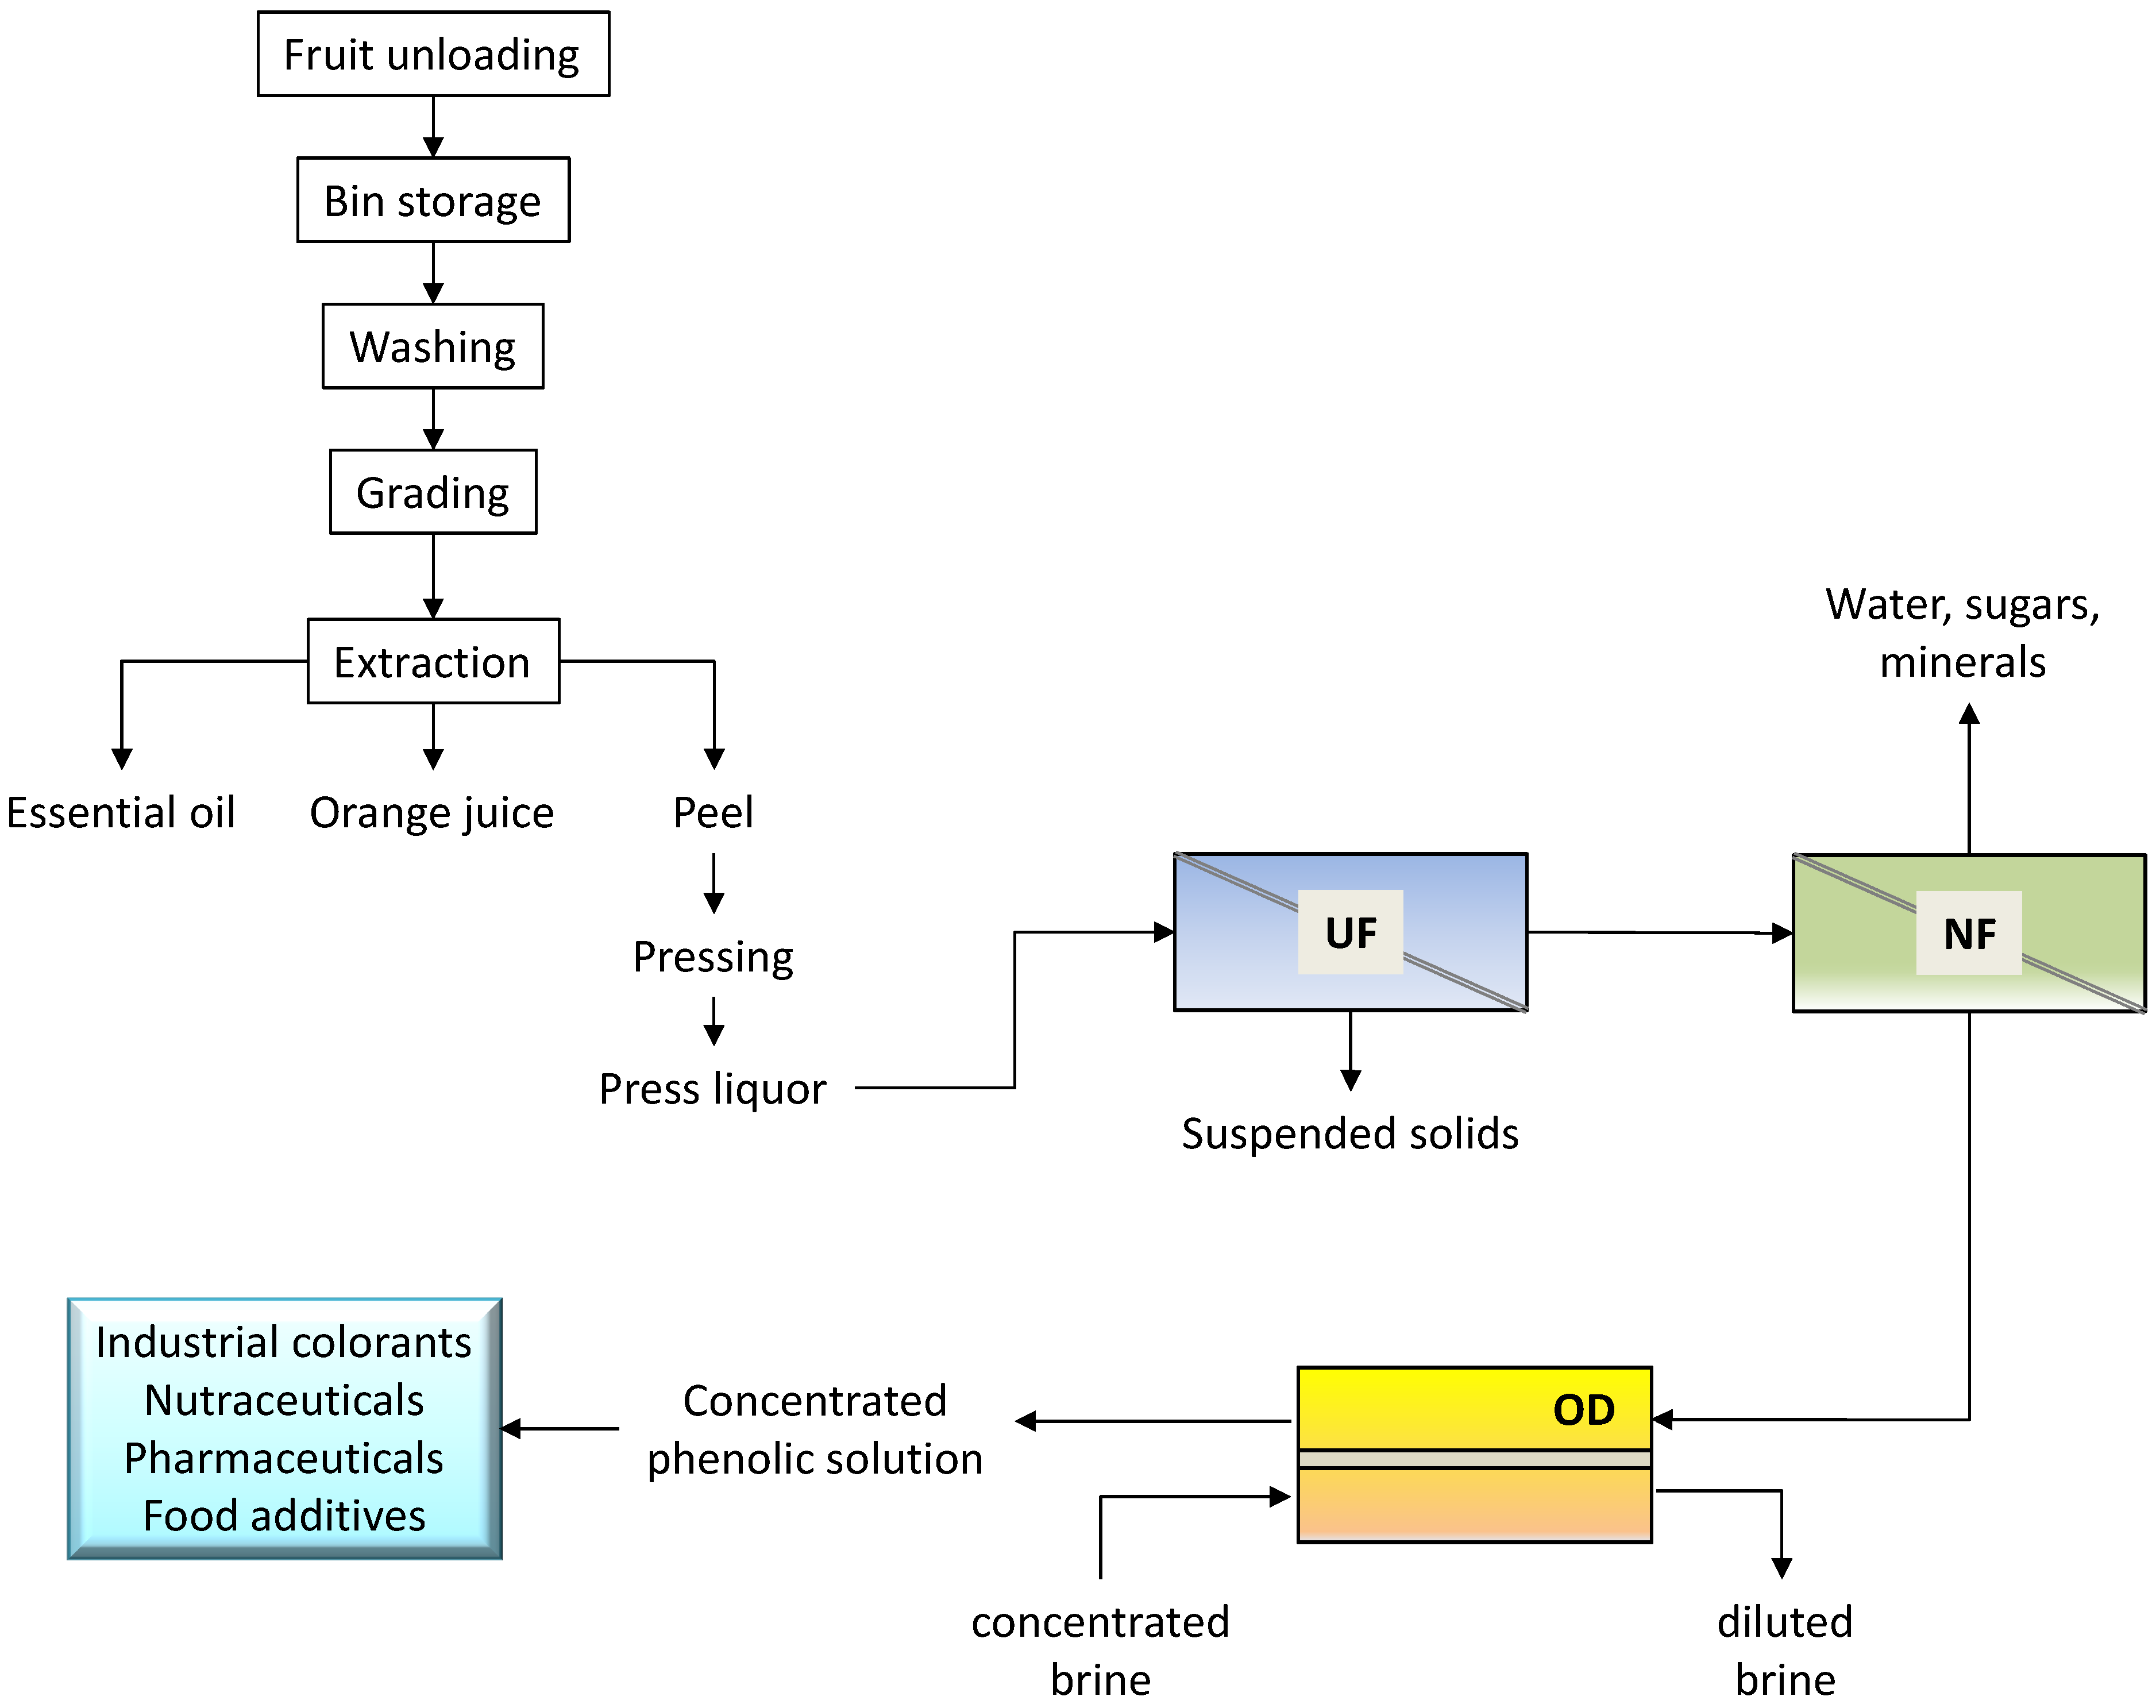
An integrated membrane process for the recovery and concentration of flavonoids from orange press liquor was proposed on the basis of the experimental results (
Figure 7).
The preliminary UF step allows one to remove suspended solids from the raw solution, producing a clear permeate in which most part of the flavonoids was recovered. Flavanones and anthocyanins are pre-concentrated in the NF step with a production of a permeate stream (with a TSS content of 4.5 g·100 g−1) containing sugars and minerals. The final treatment of the NF retentate by OD produces a concentrated solution of great interest for food and pharmaceutical applications. Indeed, flavanones are highly recognized for their pharmacological properties (favorable effect on capillary fragility and treatment of inflammatory states) arising from their antioxidant activity. In addition, the extract can be used in food coloring, so avoiding the use of artificial colorants.
Figure 7.
Schematic of the integrated membrane process proposed for the recovery of flavonoids from orange press liquor.
Figure 7.
Schematic of the integrated membrane process proposed for the recovery of flavonoids from orange press liquor.


