2.1. Available Methods to Measure Filterability
The most applied methods to measure filterability and other relevant fouling parameters, such as critical flux and resistance, are described in
Table 1. The respective installations and operation are described in
Table 2. The methods reviewed in
Table 1 and
Table 2 make use of a filtration test cell and a cross-flow operation mode. The only exception is the Sludge Filtration Index [
10] which applies a dead-end filtration mode. Other methods to express the fouling potential of the sludge, based on dead-end filtration and data observation are described by Geilvoet [
4], Judd [
5], and de la Torre [
11].
Le Clech
et al. [
6] proposed to use critical flux as a fouling indicator, which would simultaneously provide a guide value for a suitable operational flux (
Table 1). The approach has a valuable practical goal useful for full-scale operation; however, the method itself has two weaker points: the extensive duration of the test, estimated to about 5 h and the definition of critical flux (
Table 1). In practice, the critical flux (
Jc) does not remain constant; therefore three proposals are made for the
Jc definition, as follows: 1: when d
P/d
t < 0.1 mbar·min
−1; 2: when Δ(d
P/d
t)/Δ
J becomes discontinuous; 3: when, the relation between
J versus Pave is no longer linear. The duration of the test and the several critical flux definitions, reduce the applicability of the method in full-scale MBR practice.
Evenblij
et al. [
7] developed the DFCm aiming at measuring the filterability of the MBR activated sludge under clearly defined conditions. The DFCm is based on Darcy’s law and comprises a single test lasting about 30 min. The DFCm is a short-term test and measures reversible fouling,
i.e., the fouling mainly caused by the cake layer filtration mechanism. The definitions used for fouling assessment are similar to those described by Kraume
et al. [
3] listed in
Table 3. More details concerning the DFCm are provided in
Section 2.2.
Table 1.
Methods to qualify and quantify the fouling potential in Membrane Bioreactors (MBRs).
Table 1.
Methods to qualify and quantify the fouling potential in Membrane Bioreactors (MBRs).
| Method | Critical flux determination by flux-step method [6] | Delft Filtration Characterization Method (DFCm) [7] | MBR-VITO fouling measurement [8] | Berlin Filtration Method (BFM) [9] | Sludge Filtration Index (SFI) [10] |
|---|
| Fouling Parameter | Critical flux | Filterability | Resistance | Critical flux | Filterability |
| Principle | Flux (J) is increased stepwise until critical flux is obtained | Single TMP filtration measurement at constant supra-critical J | Sequence of filtrations steps at constant TMP followed by physical cleaning steps | Flux is increased and subsequently decreased stepwise | Single dead-end filtration through paper filter, relying on gravity filtration |
| Definitions | Critical flux (Jc): highest flux for which the trans-membrane pressure remains constant | Filterability: fouling potential from the MBR activated sludge. ΔR20: additional membrane resistance obtained when 20 L·m−2 of permeate are produced, following the DFCm. Scale defined between ΔR20 and sludge filtration quality | Reversible fouling: obtained when operating at an air flow rate of 40 mL·min−1; removed by 10 min relaxation and air flow rate of 100 mL·min−1.Irreversible fouling: obtained by operating at an air flow rate of 80 mL·min−1 | Critical flux (Jc): highest flux for which the permeate pressure remains constant.Irreversible fouling: existence of irreversible fouling when hysteresis loop does not present similar values | Filterability: defined as the specific value of the SFI, calculated as the measured time, divided by the MLSS concentration of the sample |
| Data processing | TMP based parameters in each flux-step: initial TMP increase (ΔP0); rate of TMP increase dP/dt; average TMP (Pave) | Data processed as increased membrane resistance, based on Darcy’s law, see Section 2.2.1. | Data processed as permeability subsequently used to obtain total resistance, further subdivided according to the resistance in series model | Pressure of permeate and applied J | Required time to produce specific volume of supernatant; Mixed Liquid Suspended Solids (MLSS) determination |
| Application | Ex situ | Ex situ (also possible in situ, see Section 2.2.4.1) | Ex situ and In situ | In situ | Ex situ |
| Applicability | Measures removable fouling | Measures removable fouling | Measures removable fouling and attempts to quantify the irremovable fouling | Measures removable fouling and qualifies irremovable fouling | Attempt to quantify filterability-removable fouling |
| Duration | 5 h | 30 min | 1–2 h | 2–3 h | 10 min |
| Usefulness | Guide value for suitable operating flux | Quantify fouling potential | Establishes fouling potential; info concerning need of physical or chemical cleaning | Guide value for suitable operating flux; info concerning irreversible fouling | Information on dewatering properties of the sludge |
Table 2.
Installation/operation of methods to qualify/quantify the fouling potential in MBRs.
Table 2.
Installation/operation of methods to qualify/quantify the fouling potential in MBRs.
| Method | Critical flux determination by flux-step method [6] | Delft Filtration Characterization Method (DFCm) [7] | MBR-VITO fouling measurement [8] | Berlin Filtration Method (BFM) [9] | Sludge Filtration Index (SFI) [10] |
|---|
| Installation | 40 L bioreactor. Vertical mounted submerged tubular membrane; pore size 0.2 µm. Constant cross-flow of air: bioreactor air-flow 4 L·min−1 and module air-flow 6 L·min−1 | 40 L bioreactor. Side-stream membrane; pore size 0.03 µm | Submerged membrane. Presently, several types of tubular membranes are proposed with a pore size from 0.1 to 0.01 µm. Cross-flow of air; fixed values varying according to filtration and physical cleaning steps | Submerged Ultra-filtration flat-sheet membranes with a total filtration surface of 0.025 m2 and space between plates of 7 mm; flat-sheet module supplied with aeration | Buchner funnel, with specific paper filter. The sample is mixed through a blade agitator. Volume of produced supernatant is measured and time of production recorded |
| Method operation | Permeation rate incrementally increased and the pressure change continuously monitored. Step duration: 15 min Step height: 2 L·m−2·h−1 | Sludge filtration at J of 80 L·m−2·h−1 and sludge cross-flow velocity of 1 ms−1 | (1) Start up: air flow rate of 100 mL·min−1; (2) Filtration step to establish membrane resistance and removable fouling: constant TMP of 0.1 bar; air flow rate of 40 mL·min−1; (3) Physical cleaning: 10 min relaxation; air flow rate of 100 mL·min−1; (4) Filtration steps to establish irremovable fouling: constant TMP of 0.1 bar; air flow rate of 80 mL·min−1; (5) At least 10 cycles to establish irremovable fouling with physical cleaning of 3 min relaxation and air flow of 100 mL·min−1 in between | Sequence of 5 min filtration steps at constant flux and aeration Specific aeration demand (SAD) of 3.5 m3/m2·h; Relaxation between filtration steps of 2 min; Flux steps of 3 L·m−2·h−1 with variable initial step of 5 to 8 L·m−2·h−1 | A 500 mL sludge sample, previously tempered to 20 °C, is placed on the filter and mixed at 40 rpm. The time to produce 100 mL to 150 mL of supernatant is used to calculate the specific value of the SFI. The MLSS concentration of the sample is measured |
| Cleaning protocol | Backwash with permeate for 5 min at 50–75 mbar.
Ex situ chemical cleaning with NaOCl (0.5 wt %) at 50 °C for 20 h | Forward flush of water at cross-flow velocity >5 ms−1. In situ chemical cleaning with Na OCl 500 ppm | Physical cleaning with fixed duration and air flow rate of 100 mL·min−1 depending on the operation step. Ex situ chemical cleaning, NaOCl at 500 ppm for 2 h | Ex situ chemical cleaning with solution of 1% active chlorine | No cleaning protocol |
Table 3.
Types of fouling. Adapted from Kraume
et al. [
3] in Geilvoet [
4].
Table 3.
Types of fouling. Adapted from Kraume et al. [3] in Geilvoet [4].
| Fouling type | Fouling rate (mbar/min) | Time interval | Cleaning |
|---|
| Reversible fouling | 0.1–1 | 10 min | Mechanical |
| Irreversible fouling | 0.001–0.1 | Weeks, months | Chemical |
| Long-term irreversible fouling | 0.0001–0.001 | Several years | Impossible |
The MBR VITO fouling measurement [
8] attempts to quantify reversible and irreversible fouling. The method operation consists of a sequence of filtration steps with several mechanical cleanings (
Table 2). Therefore, considering that irreversible fouling, according to Kraume
et al. [
3], takes weeks or even months to occur and that, in order to quantify it, a chemical cleaning step should be included, the assumptions made by the VITO fouling measurement are arguable. Nevertheless, the ability to differentiate between the need for a mechanical and/or a chemical cleaning in full-scale MBRs, is of great interest. Such differentiation is possible, due to the several and differentiated mechanical cleanings steps applied. Where the sequential mechanical cleaning steps are not successful in fouling remediation, chemical cleaning remains the only option.
The Berlin Filtration Method (BFM) [
9] overcomes the issue of quantifying irreversible fouling by qualifying it,
i.e., instead of attempting to quantify a phenomenon that takes weeks or months to develop, the method analyses the activated sludge quality by analyzing the hysteresis properties of the activated sludge. After a sequence of filtration and relaxation steps (
Table 2), if the sludge recovers to its initial results, the sludge does not present irreversible fouling and vice-versa. The aforementioned approach is logical and shows the limits of what short-term tests are able to say concerning irreversible fouling. Nevertheless, the BFM also proposes the critical flux as fouling parameter, once more raising the issue of a suitable and practical definition for MBR operation.
The Sludge Filtration Index (SFI) [
10] is the most straight forward method mentioned in this article, particularly due to the simplicity of the applied installation, operation and data processing. However, the operation relies on dead-end filtration due to gravity, which is inexistent in full-scale MBRs. Therefore, it is arguable if the method actually provides a quantification of the sludge dewaterability, instead of the sludge filterability as it aims.
The Critical flux determination and the BFM methods propose the critical flux as fouling parameter, while the DFCm, VITO fouling measurement and SFI methods measure fouling through filterability/resistance (
Table 1). The critical flux parameter has the advantage of representing the maximum operational flux in MBR operation, which is particularly important when the MBR is applied to produce water for reuse. However, there should be one agreed definition for critical flux, which should produce results confirmed by MBR practice. The parameter of filterability/resistance is an activated sludge quality parameter, providing useful information but not directly applicable to MBR operation.
The information provided by each method varies (
Table 1). The Critical flux determination, DFCm, VITO fouling measurement and BFM all measure reversible fouling. Concerning the SFI, the question remains if the method provides a fouling measurement or a sludge dewatering parameter. The VITO fouling measurement establishes the need of a physical or chemical cleaning in MBR operation and aims to quantify irreversible fouling, the latter being as aforementioned arguable. The BFM successfully identifies the existence of irreversible fouling,
i.e., qualifying the fouling potential without quantifying it.
The Critical flux determination, DFCm, VITO fouling measurement and SFI are
ex situ methods (
Table 1). The DFCm and VITO fouling measurement can also be applied
in situ, while the BFM is an
in situ method (
Table 1). The
in situ methods are more likely to preserve the activated sludge characteristics. However, all methods rely on a specific membrane with a particular operational protocol, which differs from the MBR installation. Therefore
in situ methods might change the sludge characteristics when measuring the fouling potential, even if in a lower extent than
ex situ methods. If the method aims to obtain the critical flux, which can be directly applicable to MBR operation, the issue of preserving the original sludge characteristics becomes more significant.
The duration and complexity of the operational protocol are important issues for practical applications. The SFI and DFCm are the fastest and simplest operational methods (
Table 1). The Critical flux determination and BFM have less complex operational protocols than the VITO fouling measurement (
Table 2).
The methods here described are capable of, as follows: quantifying reversible fouling, identifying the need of physical or chemical cleanings, identifying the existence of irreversible fouling, preserving as much as possible the activated sludge characteristics, being fast and simpler enough to enable its use in MBR full-scale practice. Nonetheless, none of the reviewed method reunites all of the advantages in one single method.
2.2. Delft Filtration Characterization Method
The Delft Filtration Characterization installation (DFCi), and the measuring protocol, the Delft Filtration Characterization method (DFCm), are described in Evenblij
et al. [
7].
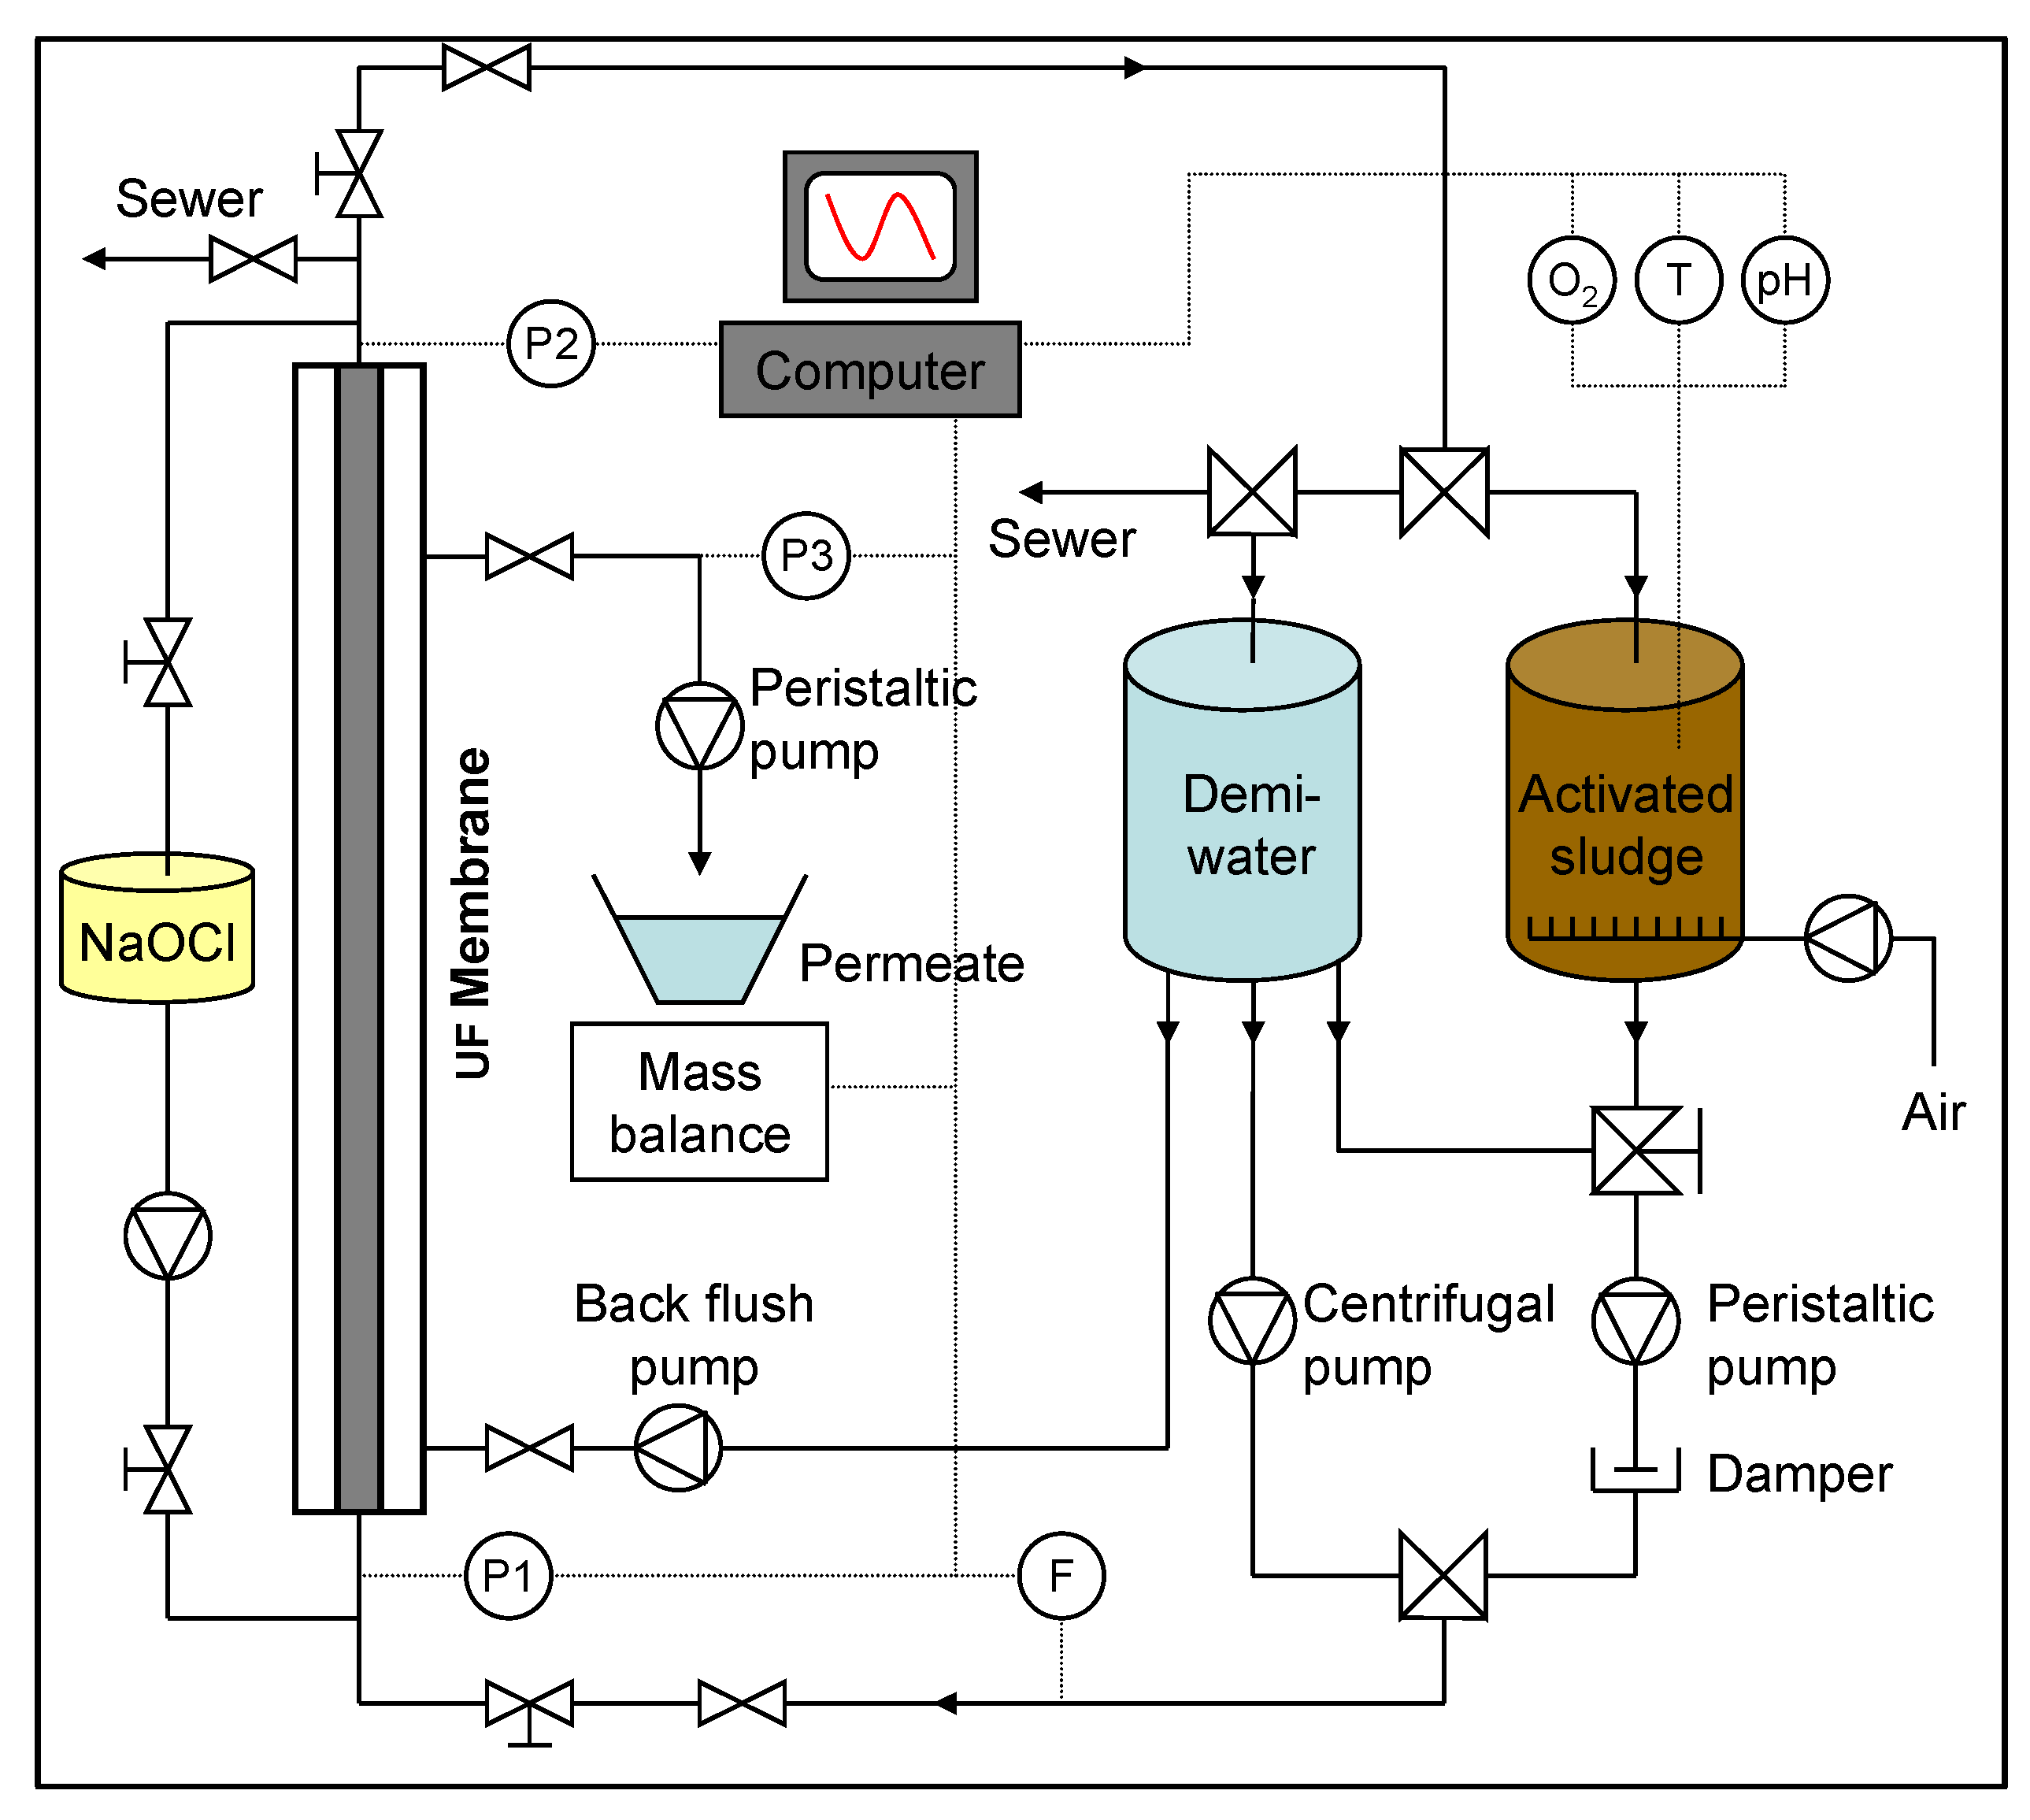
Figure 1 shows the scheme of the DFCi.
Figure 1.
Scheme of the Delft Filtration Characterization Installation (DFCi) [
4]. Reprinted with permission from [
4]. Copyright 2010 Delft University of Technology.
Figure 1.
Scheme of the Delft Filtration Characterization Installation (DFCi) [
4]. Reprinted with permission from [
4]. Copyright 2010 Delft University of Technology.
2.2.1. Output and Data Processing
The measuring protocol consists of three basic steps, as follows: membrane resistance determination, activated sludge filtration and membrane cleaning. The main step of the measuring protocol is the activated sludge filtration step. The following activated sludge parameters, namely dissolved oxygen (DO) concentration, pH and temperature, and process parameters, namely transmembrane pressure (TMP), flux, and cross-flow velocity, are continuously monitored during the activated sludge filtration step. In the output, these parameters are plotted against the specific produced permeate volume (L·m−2). The resulting figures are used to control the development of the activated sludge filtration step online.
The total resistance (
Rt) is calculated according to Darcy’s law. The calculation of
Rt is preceded by a flux and permeate viscosity temperature correction. It is assumed that
Rt is the sum of membrane resistance (
Rm) plus the resistance imposed by the cake layer built up on the membrane during sludge filtration, referred to as fouling resistance or added resistance (Δ
R). In the calculation of Δ
R,
Rm is assumed as the initial value of resistance,
i.e., the first obtained value of Δ
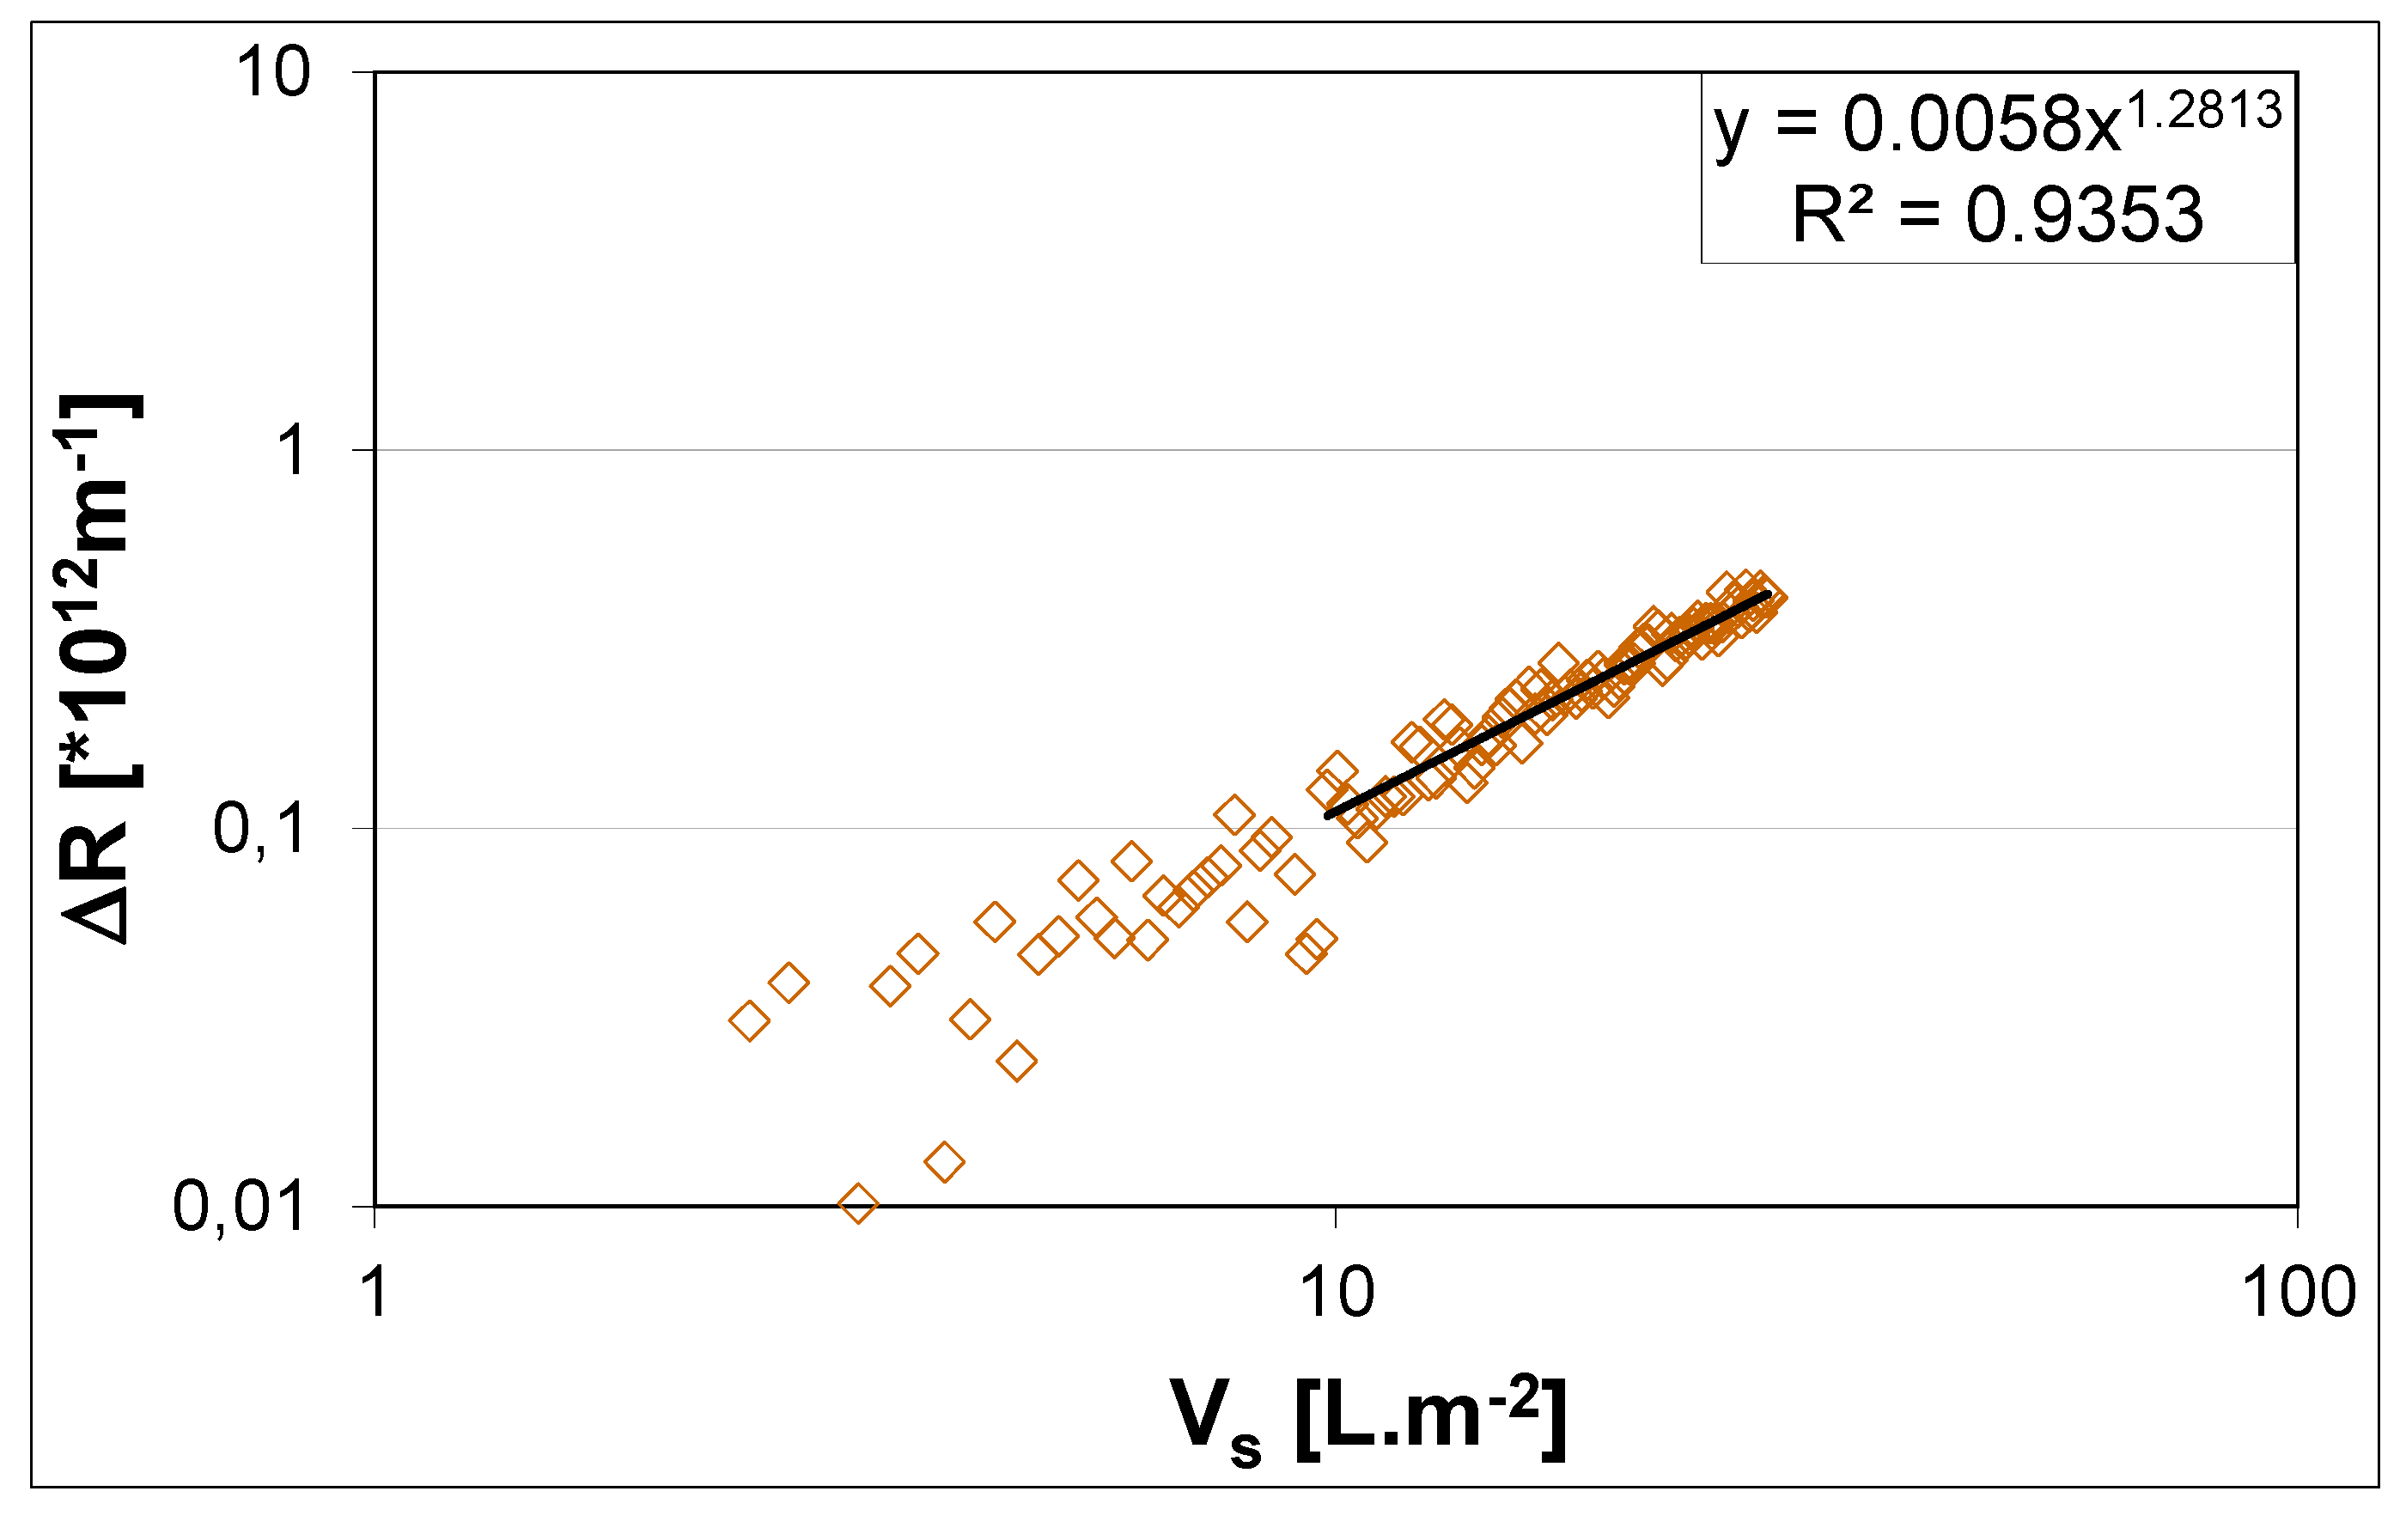
R in the activated sludge filtration step. The main output of the DFCi consists of a graph that plots added resistance (Δ
R) caused by cake layer filtration, as a function of specific permeate production (Vs), as exemplified by
Figure 2.
Figure 2.
Added resistance according to permeate volume production per membrane area [
12]. Reprinted with permission from [
12]. Copyright 2011 Delft University of Technology.
Figure 2.
Added resistance according to permeate volume production per membrane area [
12]. Reprinted with permission from [
12]. Copyright 2011 Delft University of Technology.
The calculated values of added resistance are then used to establish a fouling tendency through a power law equation, as explained by Geilvoet [
4] (
Figure 2). The obtained mathematical expression is then used to calculate the Δ
R20 parameter, α
R × c
i product and s coefficient. The Δ
R20 is the resistance obtained after extracting 20 L of permeate per membrane area [
13], which takes about 15 min. The Δ
R20 parameter, α
R × c
i product and s coefficient are obtained by fitting the cake layer filtration theory to the DFCm output, as presented by Geilvoet [
4] and shown in
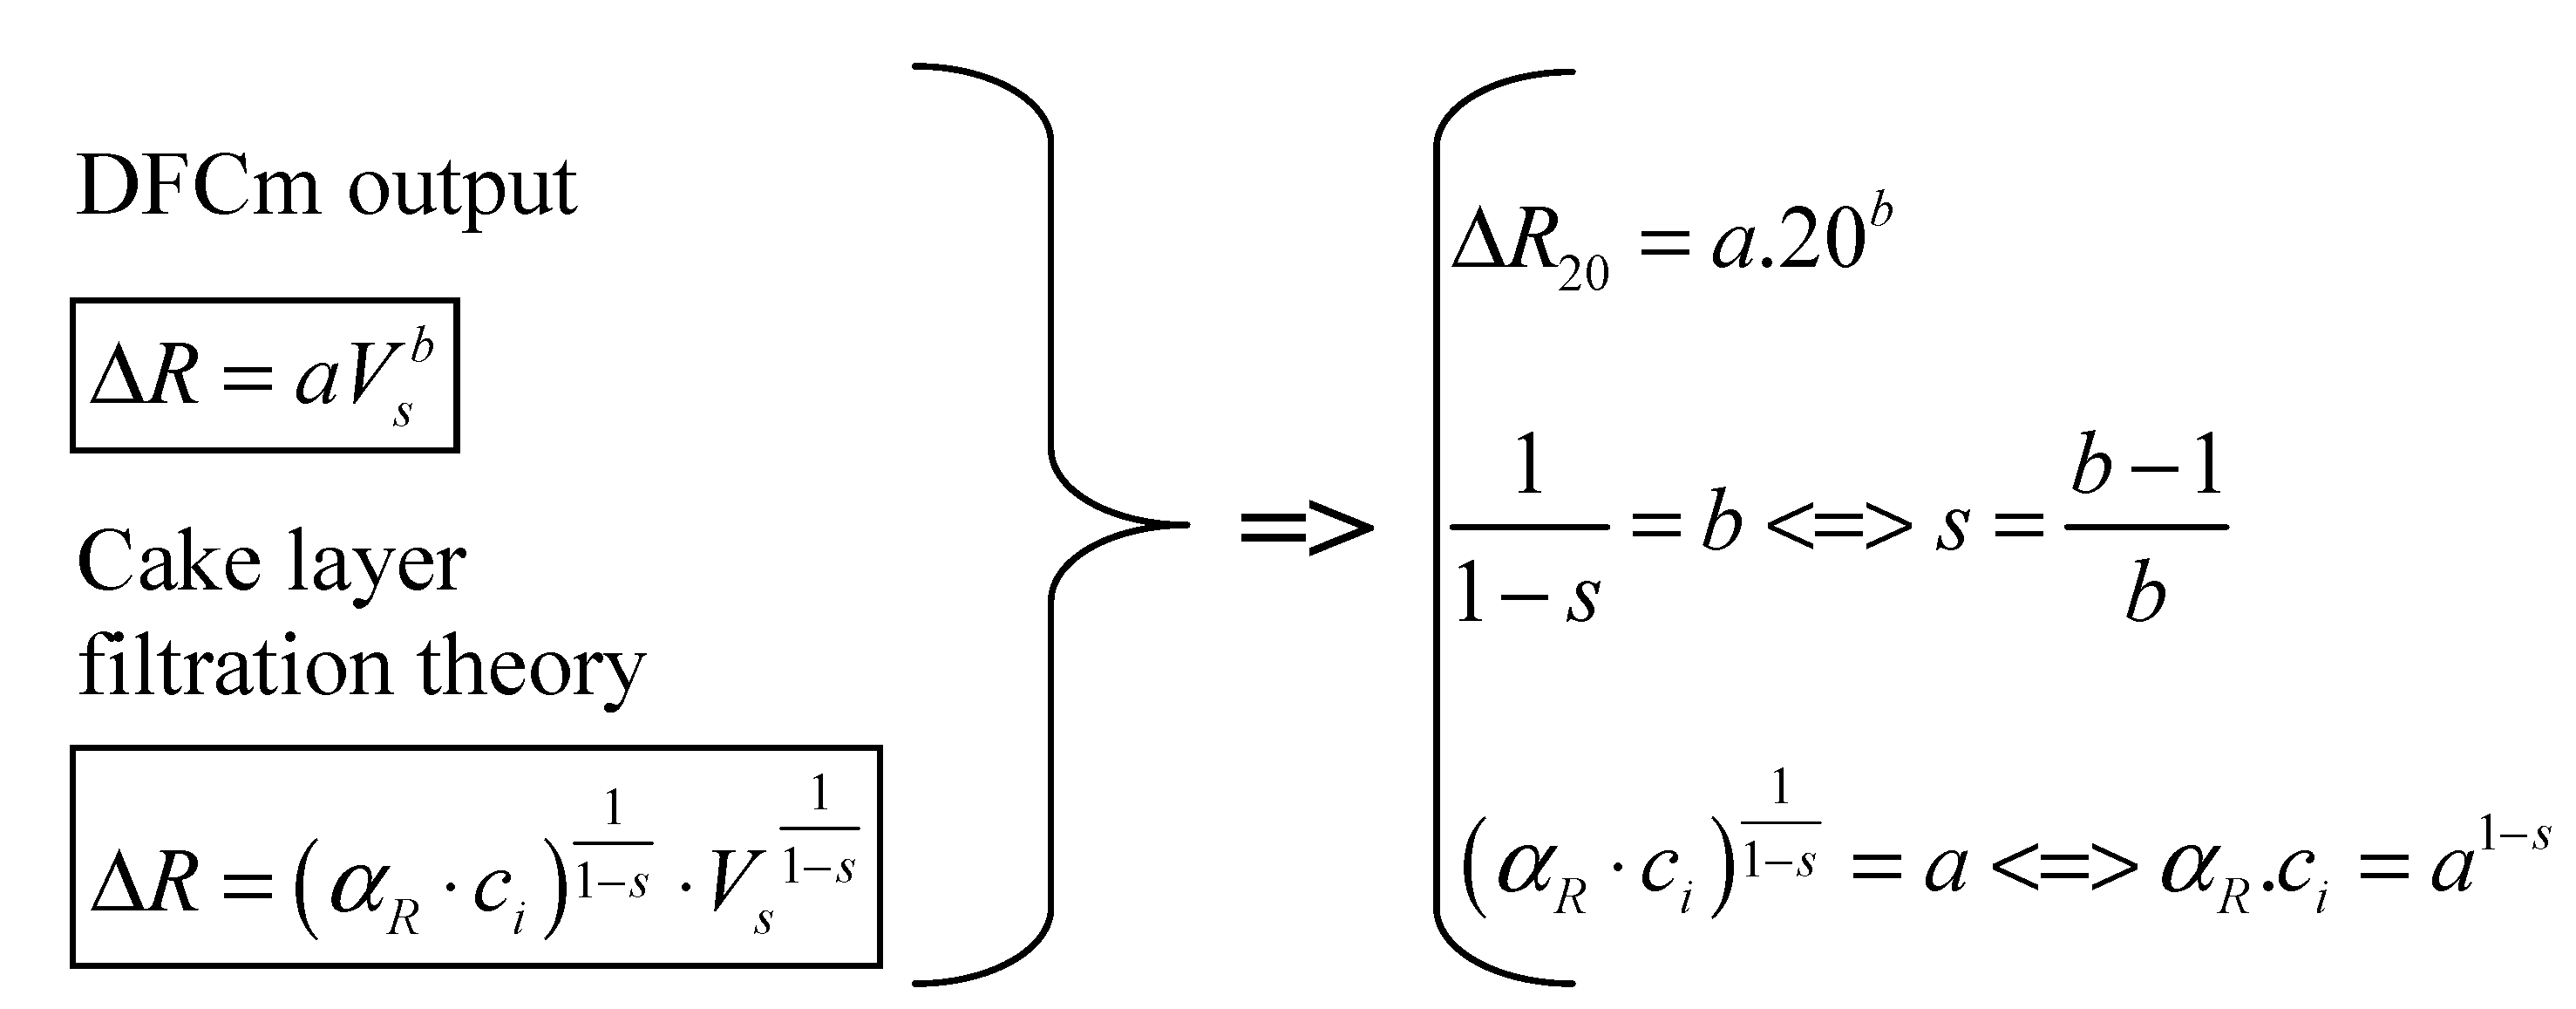
Figure 3. The Δ
R20 parameter, contrary to the α
R × c
i product and s coefficient, does not have a direct physical meaning. The parameter was defined to simplify the comparison between filtration curves, assuming that after 15 min of filtration the measurement is stable.
Figure 3 shows how to obtain the Δ
R20 parameter, α
R × c
i product and s coefficient from single sludge filtration curves. Linear correlation coefficients between Δ
R20 and α
R × c
i product results are of 0.95 to 0.98 [
12,
14], indicating that the total cake layer resistance is basically determined by the mass involved and its specific cake resistance. Additionally, in theory, the compressibility coefficient varies between 0 and 1, indicating respectively no compression to total compression. In the DFCm the compressibility results are mainly between 0 and 0.3 [
12,
14], which shows that hardly compressible cake layers are obtained. Therefore, the DFCm method produces a hardly compressible cake layer, where the cake layer mass and specific cake resistance are the main contributors of the total measured resistance. Furthermore, the Δ
R20 is a fairly good indicator of the method results.
A classification linking the assessed Δ
R20 and MBR activated sludge filterability was defined by Geilvoet [
4], resulting from the weekly monitoring of one full-scale MBR during one year [
15] and is shown in
Table 4.
Figure 3.
Processing of DFCm output (Adapted from Geilvoet [
4] in Lousada-Ferreira [
12]).
Figure 3.
Processing of DFCm output (Adapted from Geilvoet [
4] in Lousada-Ferreira [
12]).
Notes: Key: ΔR: Total cake layer resistance (m−1); a,b: Absolute values obtained in each filtration experiment; Vs: Specific permeate production (L·m−2); αR: Specific cake resistance (m·kg−1); ci: Concentration of cake layer particles (kg·m−3); s: Compressibility coefficient (-); ΔR20: Total cake layer resistance obtained after 20 L of permeate per m2 membrane area are produced (m−1).
Table 4.
Δ
R20 values and corresponding MBR activated sludge filterability-for standard DFC
m measuring protocol [
4].
Table 4.
ΔR20 values and corresponding MBR activated sludge filterability-for standard DFCm measuring protocol [4].
| Sludge quality | ΔR20 (×10 12 m−1) |
|---|
| Minimum | Maximum |
|---|
| Good | 0 | 0.1 |
| Moderate | 0.1 | 1 |
| Poor | 1 | – |
2.2.2. Installations and Locations
During the 10 years of the DFCm practice three DFCis were built, further designated as DFCi I to III. The DFCi I was permanently stationed at the TU Delft water lab, while the DFCi II and III are mobile. The design is identical for all three installations; however, DFCi II and DFCi III were developed and built with increasing mobility and assembly easiness.
The DFCm was extensively applied in weekly measurements at full-scale MBR installations around Europe [
12,
14,
16], further designated as MBR A to MBR F. The aforementioned Waste Water Treatment Plants (WWTP) have a biological capacity from 7000 to 80,000 population equivalent and a total membrane area from 2436 to 84,480 m
2. In all visited MBR installations, information concerning characteristics of the MBR such as design, influent quality, activated sludge quality, effluent quality, and MBR performance is requested to the plant operators. In the full-scale weekly campaigns, the DFCi is transported to the MBR installations and is applied as an
ex situ measurement tool, or exceptionally, as an
in situ tool.
The DFCm was also applied in lab environment, using the DFCi as a lab-scale research unit. For the latter experiments the activated sludge is collected at MBR full-scale installations and transported to the lab.
2.2.3. Sampling
At the full-scale weekly campaigns, when the DFCm is applied as an ex situ measurement tool, the sludge samples are preferably collected in the upper decks of the MBR installations, from central areas of the MBR tanks. In membrane tanks with submerged membranes, the activated sludge is collected from the top of the tank. When exceptionally the DFCm is used in situ, the DFCi sludge pump is connected directly to the full-scale membrane tank sludge. During the activated sludge filtration step, the concentrated sludge is returned to the full-scale membrane tank.
When the DFCi is applied as lab-scale research unit, the collection of the activated sludge samples follows the same procedure as applied when the DFCi is applied as
ex situ tool. Geilvoet [
4] studied the consequences of lack of DO to the activated sludge filterability. The author showed that MBR sludge filterability would decrease without aeration,
i.e., an increase in the Δ
R20 value from 0.05 to 3.3 × 10
12 m
−1 was measured, when the activated sludge was kept without DO for 4 days. However, the activated sludge showed a recovery rate 12 times faster than the degradation rate. After a period of 6 h of aeration, the activated sludge presented a Δ
R20 of 0.7 × 10
12 m
−1. To overcome the filterability decrease, due to the transport of the samples from the MBR installation to the lab, samples are submitted to aeration, according to the recovery rate obtained by Geilvoet [
4] before being submitted to the DFCm measurement.
2.2.4. Evaluation
2.2.4.1. Accuracy
The DFCi was applied as an
in situ tool at MBR C, in July 2007. The activated sludge and permeate characteristics at MBR C are shown in
Table 5. The filterability results obtained in the referred campaign are shown in
Table 6.
Table 6 shows that, even considering variations of filterability during one day, the average deviation for Δ
R20 per day is always below 0.1 × 10
12 m
−1. Influent daily variations are expected, which is confirmed by the slight variations in pH and temperature of the MBR activated sludge shown in
Table 6. The DFCm is capable to follow these fluctuations leading to changes in the order of 0.01–0.02 for Δ
R20, which leads to an accuracy of approximately 10%.
Table 5.
Activated sludge and permeate characteristics.
Table 5.
Activated sludge and permeate characteristics.
| Date | 4 July 2007 | 5 July 2007 | 6 July 2007 |
|---|
| Activated sludge | – | – | – |
| MLSS g/L | 14.5 | 14.6 | 14.4 |
| Permeability L/m2·h·bar | 193 | 199 | 186 |
| Permeate | – | – | – |
| COD mg/L | 21.7 | 15.9 | 18.1 |
| NH4-N mg/L | 0.01 | 0.02 | 0.02 |
| NO3-N mg/L | 3,3 | 3,7 | 4 |
| PO4-P mg/L | 0.18 | 0.28 | 0.36 |
Table 6.
Filterability, as ΔR20, temperature and pH of MBR activated sludge.
Table 6.
Filterability, as ΔR20, temperature and pH of MBR activated sludge.
| Day-Month-Year | Hour:Minute | ΔR20 (1012 m−1) | ΔR20 Standard deviation(daily) | pH | T (°C) |
|---|
| 4 July 2007 | 8:27 | 0.05 | 0.098 | 7.1 | 19.7 |
| 4 July 2007 | 9:31 | 0.06 | 7.2 | 19.7 |
| 4 July 2007 | 10:51 | 0.08 | 7.2 | 19.7 |
| 4 July 2007 | 11:48 | 0.22 | 7.1 | 19.6 |
| 4 July 2007 | 13:09 | 0.26 | 7.1 | 19.5 |
| 5 July 2007 | 8:27 | 0.21 | 0.06 | 6.7 | 17.8 |
| 5 July 2007 | 10:18 | 0.08 | 6.4 | 17.7 |
| 5 July 2007 | 12:05 | 0.08 | 6.1 | 17.8 |
| 5 July 2007 | 12:59 | 0.07 | 6.3 | 17.8 |
| 5 July 2007 | 13:42 | 0.16 | 6.4 | 17.8 |
| 6 July 2007 | 8:30 | 0.11 | 0.025 | 6.6 | 18.9 |
| 6 July 2007 | 9:32 | 0.16 | 6.5 | 18.9 |
| 6 July 2007 | 10:21 | 0.13 | 6.5 | 18.9 |
2.2.4.2. Reproducibility
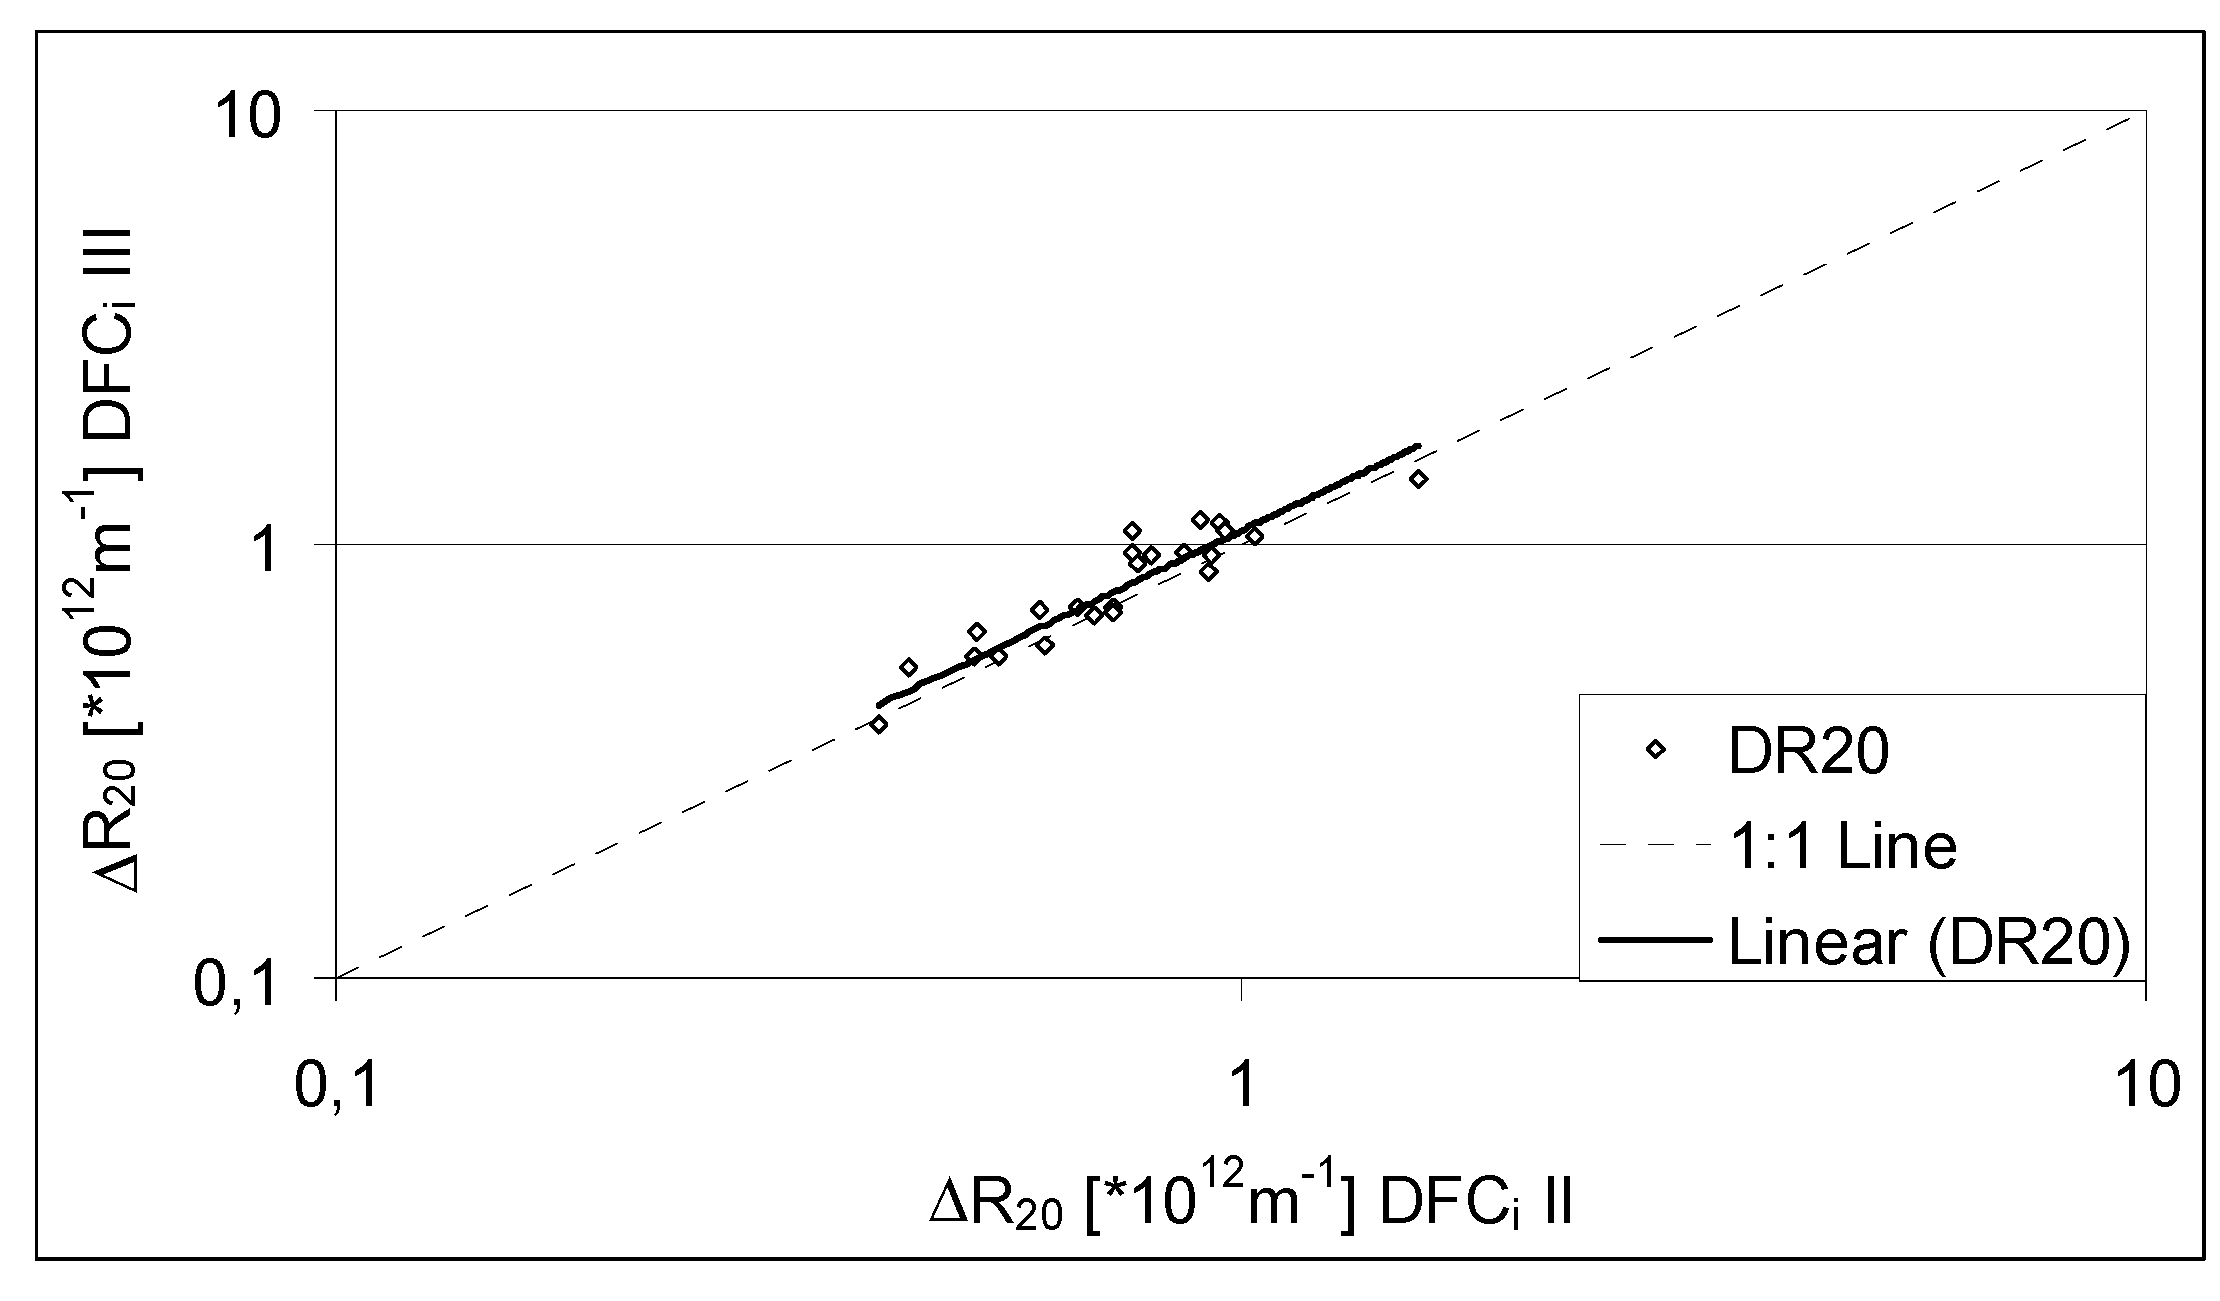
A full-scale campaign at MBR D was performed, where activated sludge samples simultaneously collected were submitted to the DFCm in the DFCi II and III [
14]. The obtained results are shown in
Figure 4.
Figure 4.
Filterability, as Δ
R20, obtained at two Delft Filtration Characterization Installations: DFCi II and DFCi III. (Adapted from Krzeminski [
14]).
Figure 4.
Filterability, as Δ
R20, obtained at two Delft Filtration Characterization Installations: DFCi II and DFCi III. (Adapted from Krzeminski [
14]).
Figure 4 shows that there is a strong correlation between results obtained in the two DFCis. The Pearson coefficient, between the two sets of results, is of 0.907. The results provided by the DFCi III were in average 7% higher than the results obtained in the DFCi II. As deduced in
Section 2.2.4.1, the accuracy of the DFCm is of about 10% therefore the DFCm results are considered reproducible, irrespective of the used installation.
2.2.4.3. Reliability
The average and standard deviation of the filterability as well as the MBR operation stability, obtained at several full-scale MBRs, are shown in
Table 7. The MBR operation was defined as “steady” when the effluent quality parameters were below the discharge limits and if the permeability remained stable, during the weekly campaign [
16].
Table 7.
Filterability, as Δ
R20, and MBR installation stability (Adapted from Moreau [
16] and Krzeminski [
14]).
Table 7.
Filterability, as ΔR20, and MBR installation stability (Adapted from Moreau [16] and Krzeminski [14]).
| MBR installation | Month Year | ΔR20 (1012 m−1) | MBR operation stability |
|---|
| Average | Standard deviation |
|---|
| A | February 2007 | 0.97 | 0.11 | Steady |
| April 2008 | 3.01 | 1.47 | Unsteady |
| August 2008 | 0.31 | 0.07 | Steady |
| B | March 2007 | 0.56 | 0.04 | Steady |
| September 2008 | 0.08 | 0.02 | Steady |
| C | July 2007 | 0.12 | 0.07 | Steady |
| November 2008 | 0.43 | 0.07 | Steady |
| D | February 2007 | 0.31 | 0.12 | Steady |
| June 2008 | 0.05 | 0.05 | Steady |
| January 2009 | 0.30 | 0.12 | Steady |
| July 2009 | 0.14 | 0.07 | Steady |
| February 2010 | 0.77 | 0.14 | Steady |
| E | June 2008 | 0.18 | 0.04 | Steady |
| February 2009 | 2.72 | 0.41 | Unsteady |
| August 2009 | 0.04 | 0.01 | Steady |
| March 2010 | 0.95 | 0.13 | Steady |
| F | June 2008 | 0.17 | 0.04 | Steady |
| February 2009 | 3.46 | 0.37 | Unsteady |
| August 2009 | 0.04 | 0.00 | Steady |
| March 2010 | 0.75 | 0.11 | Steady |
Table 7 shows that stable reactor operation corresponds to Δ
R20 values below 1 × 10
12 m
−1 with a maximum standard deviation of 0.14 × 10
12 m
−1. On the opposite, when the operation is unstable the obtained Δ
R20 values are above 1 × 10
12 m
−1 and present a standard deviation between 0.3 × 10
12 and 1.5 × 10
12 m
−1. The aforementioned results show that the filterability measurements are consistent with the operation state of the MBR and therefore provide reliable information. In fact, filterability is the connecting parameter between membrane bioreactor ‘biology’ and membrane operation.
2.2.4.4. Applicability
The DFCm measures the filterability of an activated sludge sample, which is one of the starting points for a satisfactory MBR filtration process [
4]. If filterability, with its dynamic changes, is properly evaluated, the process operation can be optimized. Furthermore, the DFCm can be useful to research how filterability can be influenced by, as follows: MBR configuration [
17]; MBR design, in particular hydraulic retention time [
18] and recirculation [
19]; membrane configurations [
18,
20]; wastewater influent characteristics [
20,
21,
22]; activated sludge characteristics, such as temperature [
18,
21], mixed liquid suspended solids [
18,
23], viscosity [
24], floc size [
19], soluble organic fractions [
18], sludge morphology and relative hydrophobicity [
25]; operational parameters, such as sludge retention time [
18,
26], food to mass ratio [
18], substrate addition [
27], and dissolved oxygen concentrations [
28].
The DFCm is a short-term filtration experiment. When the sludge filtration step is initiated the membrane is still clean and the initial fouling mechanism will be pore blocking, which will shift to cake layer filtration depending on the amount of accumulated substances. Jiang
et al. [
29] performed filtration tests in a set-up with a side-stream membrane, fluxes of 52 to 72 L·m
−2·h
−1, and reported that the main fouling mechanism changed from pore blocking to cake filtration after 8 s. Considering the high MLSS concentration in MBR sludge, usually superior to 6 g/L [
12], and the high flux applied in the DFCm, of 80 L·m
−2·h
−1, it is expected that the dominant fouling mechanism is cake filtration. Furthermore, in the DFCm the resistance is quantified based on Darcy’s law, therefore cake filtration is only mechanism taken into account for the calculations. As a short-term experiment, the DFCm will mainly measure reversible fouling.
The long-term performance of an MBR installation will be mainly determined by the irreversible and irrecoverable fouling. The irreversible fouling is expected to be a consequence of the removal efficiency of the reversible fouling [
4]. A relation between filterability and irreversible fouling can be empirically analyzed through the developments of filterability and permeability, of the considered MBR plant. In the aforementioned case, the DFCm allows the evaluation of the activated sludge properties in the filtration process and consequently the eventual optimization of the operation conditions, such as filtration and relaxation/backwash protocols. Another optimization possibility deriving from frequent filterability measurements at an MBR installation is to allow operators to take advantages of good filterability periods to improve the energy efficiency of the plant, by for instance prolonging the filtration protocol. Additionally, frequent filterability measurements could also act as an early warning system for operators and as a membrane aeration energy optimization tool.

