2.1. Structure and Morphology of the Bare and Sulphated Tin Oxide Powders
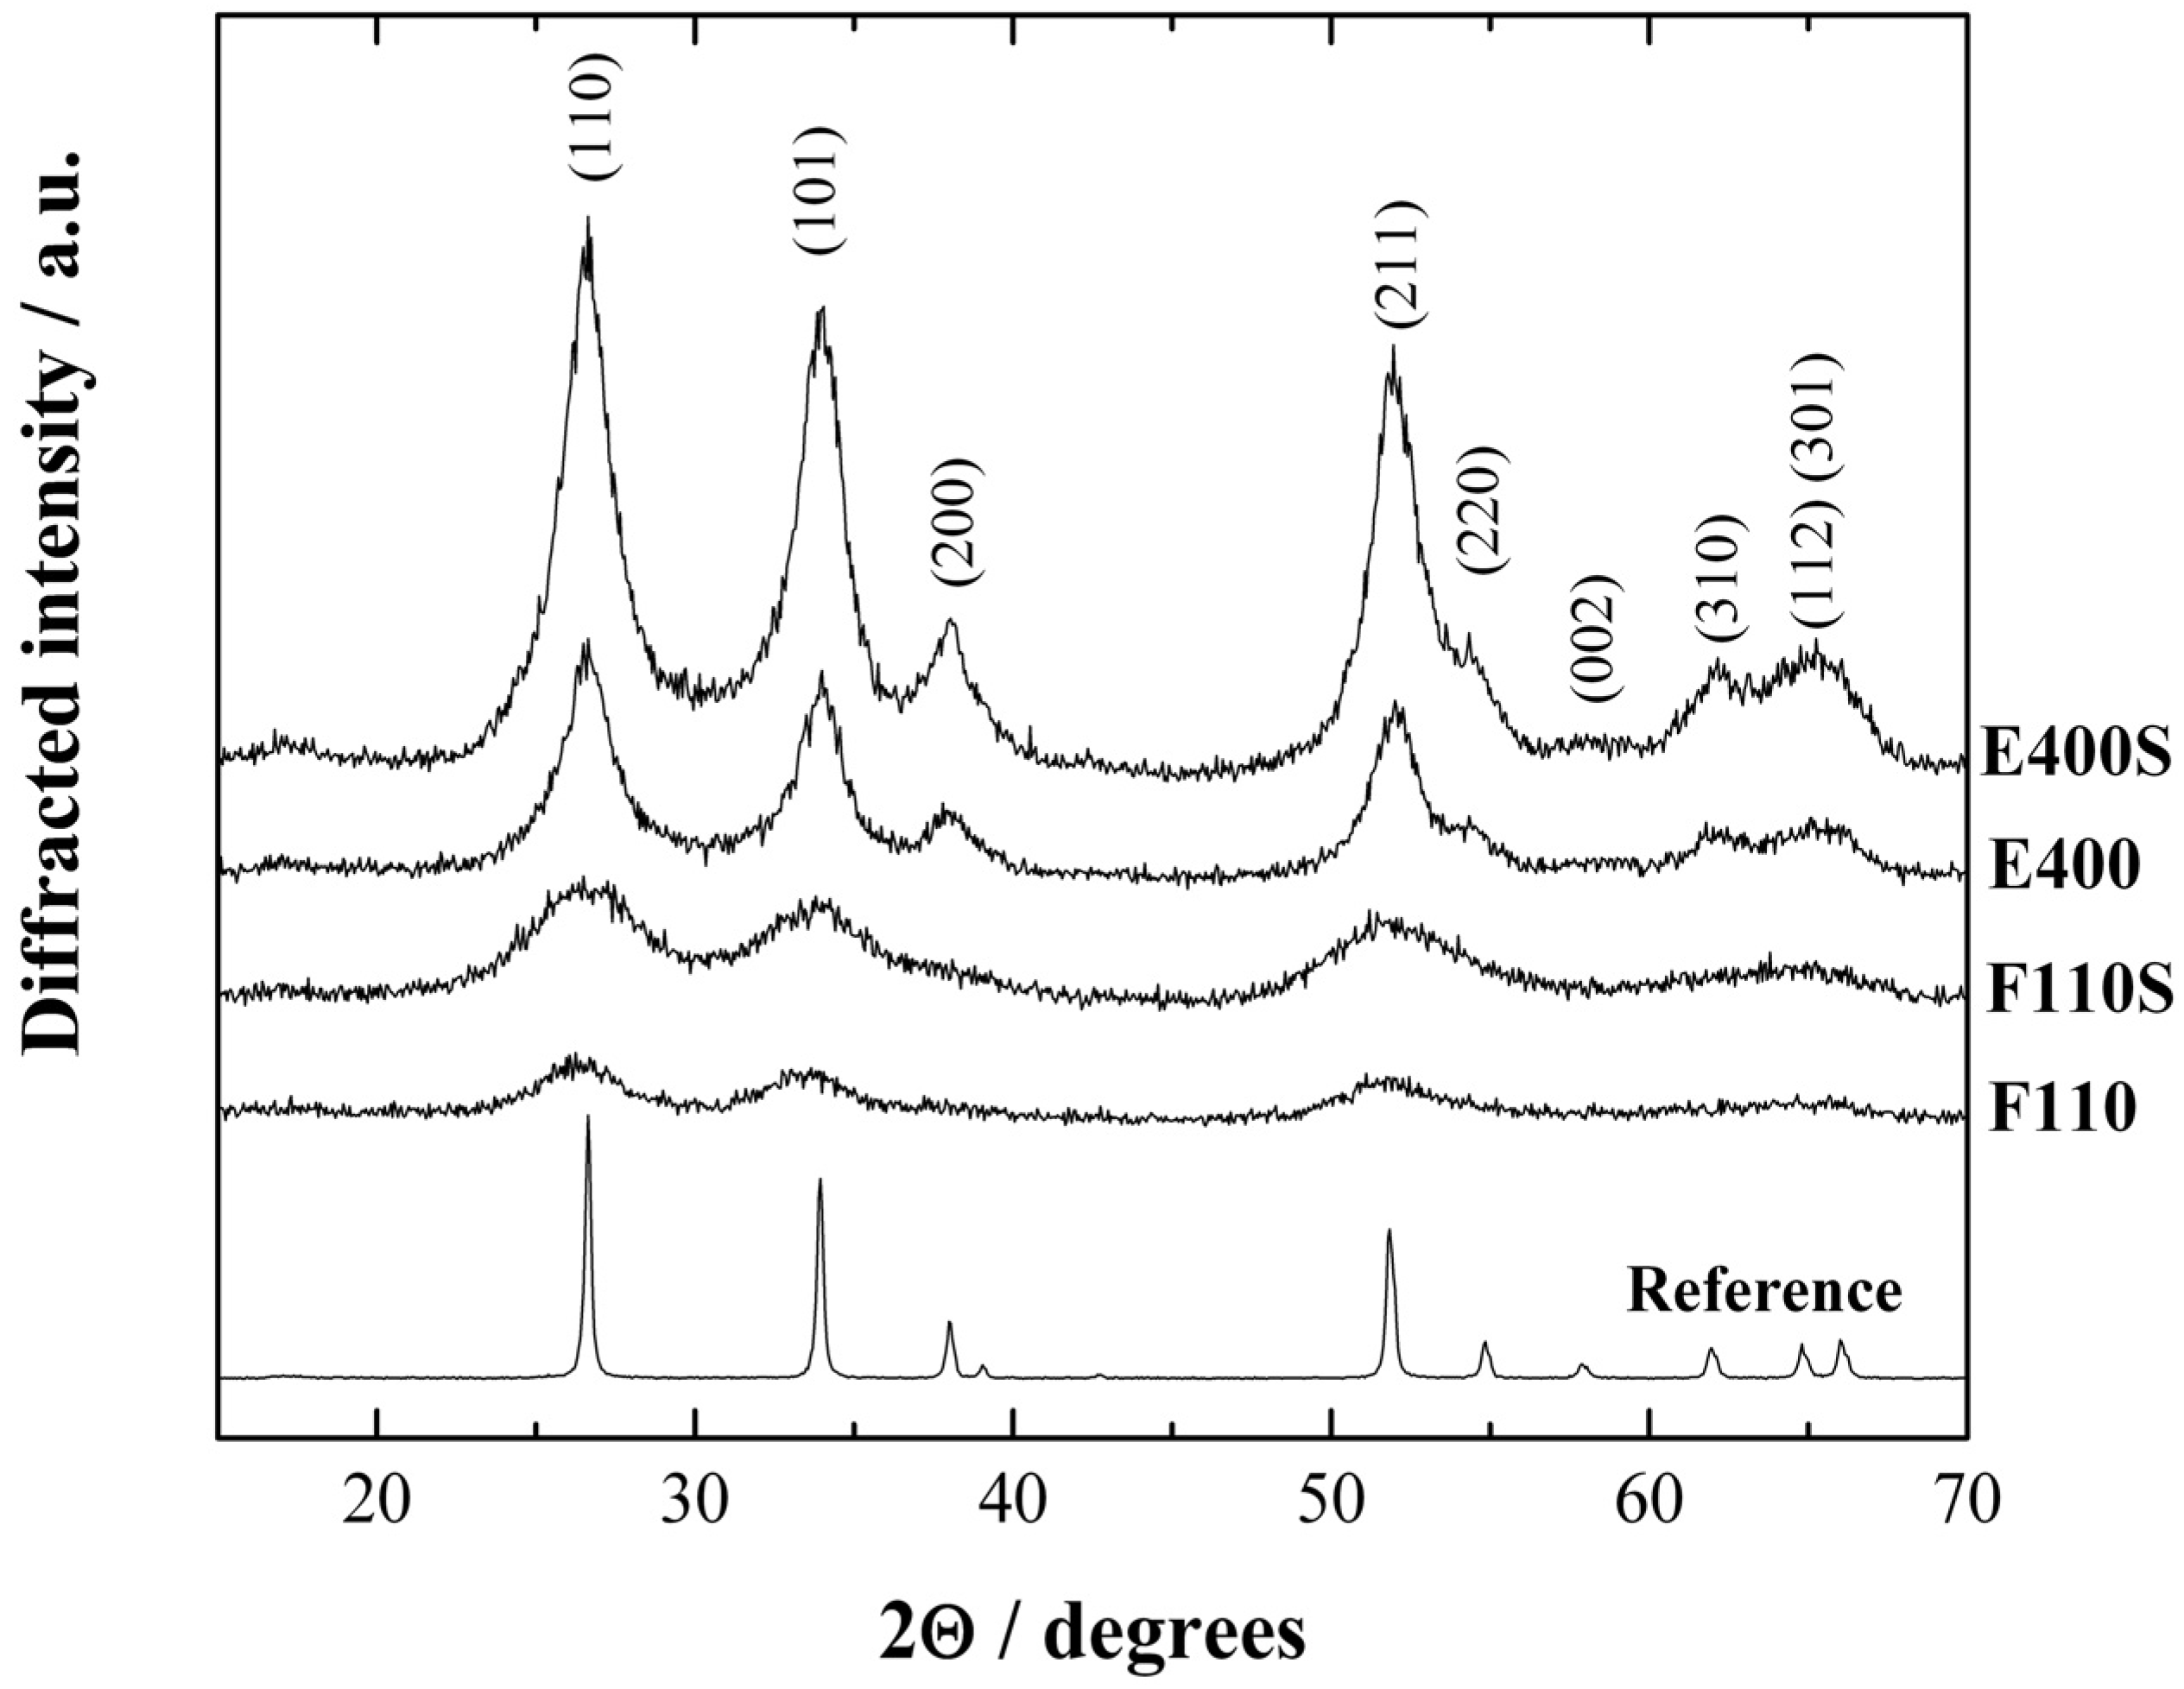
The X-ray diffraction (XRD) patterns of the synthesized ceramic samples, both bare and sulphated, are presented in
Figure 1.
Figure 1.
X-ray diffraction (XRD) patterns of the tin oxide samples, bare and sulphated. Reference: SnO2 bulk oxide.
Figure 1.
X-ray diffraction (XRD) patterns of the tin oxide samples, bare and sulphated. Reference: SnO2 bulk oxide.
The XRD patterns of all materials have been indexed in agreement with the tetragonal rutile structure of the bulk SnO
2 (reference spectra, Sigma Aldrich 99% purity). All the synthesized samples show broad peaks revealing the presence of particles in the nanosized range. The mean crystallite sizes (<d>) have been calculated by the standard Scherrer equation [
33] starting from the profile broadening (Δ, full width at half maximum) of the (110), (101), and (211) peaks using the usual formula: <d> = λ/(Δcosθ), being λ = 1.5418 Å the wavelength of the CuKα radiation. The resulting values are 1.7 and 2.8 nm for F110 and F110S samples, and 5.0 and 6.1 nm for E400 and E400S samples, respectively. The various degree of crystallinity reflects the thermal history of the samples. In particular it is to be noted that the sulphated oxides show in both cases (E400S and F110S) larger crystallite sizes compared to the bare pristine oxide (E400 and F110, respectively), this being due to the further annealing step at 500 °C performed during the sulphation procedure. Additionally, the nanosized structure is retained by both E400S and F110S samples.
The amount of sulphate groups chemically bonded to the surfaces has been established by thermogravimetric measurements,
Figure 2.
Figure 2.
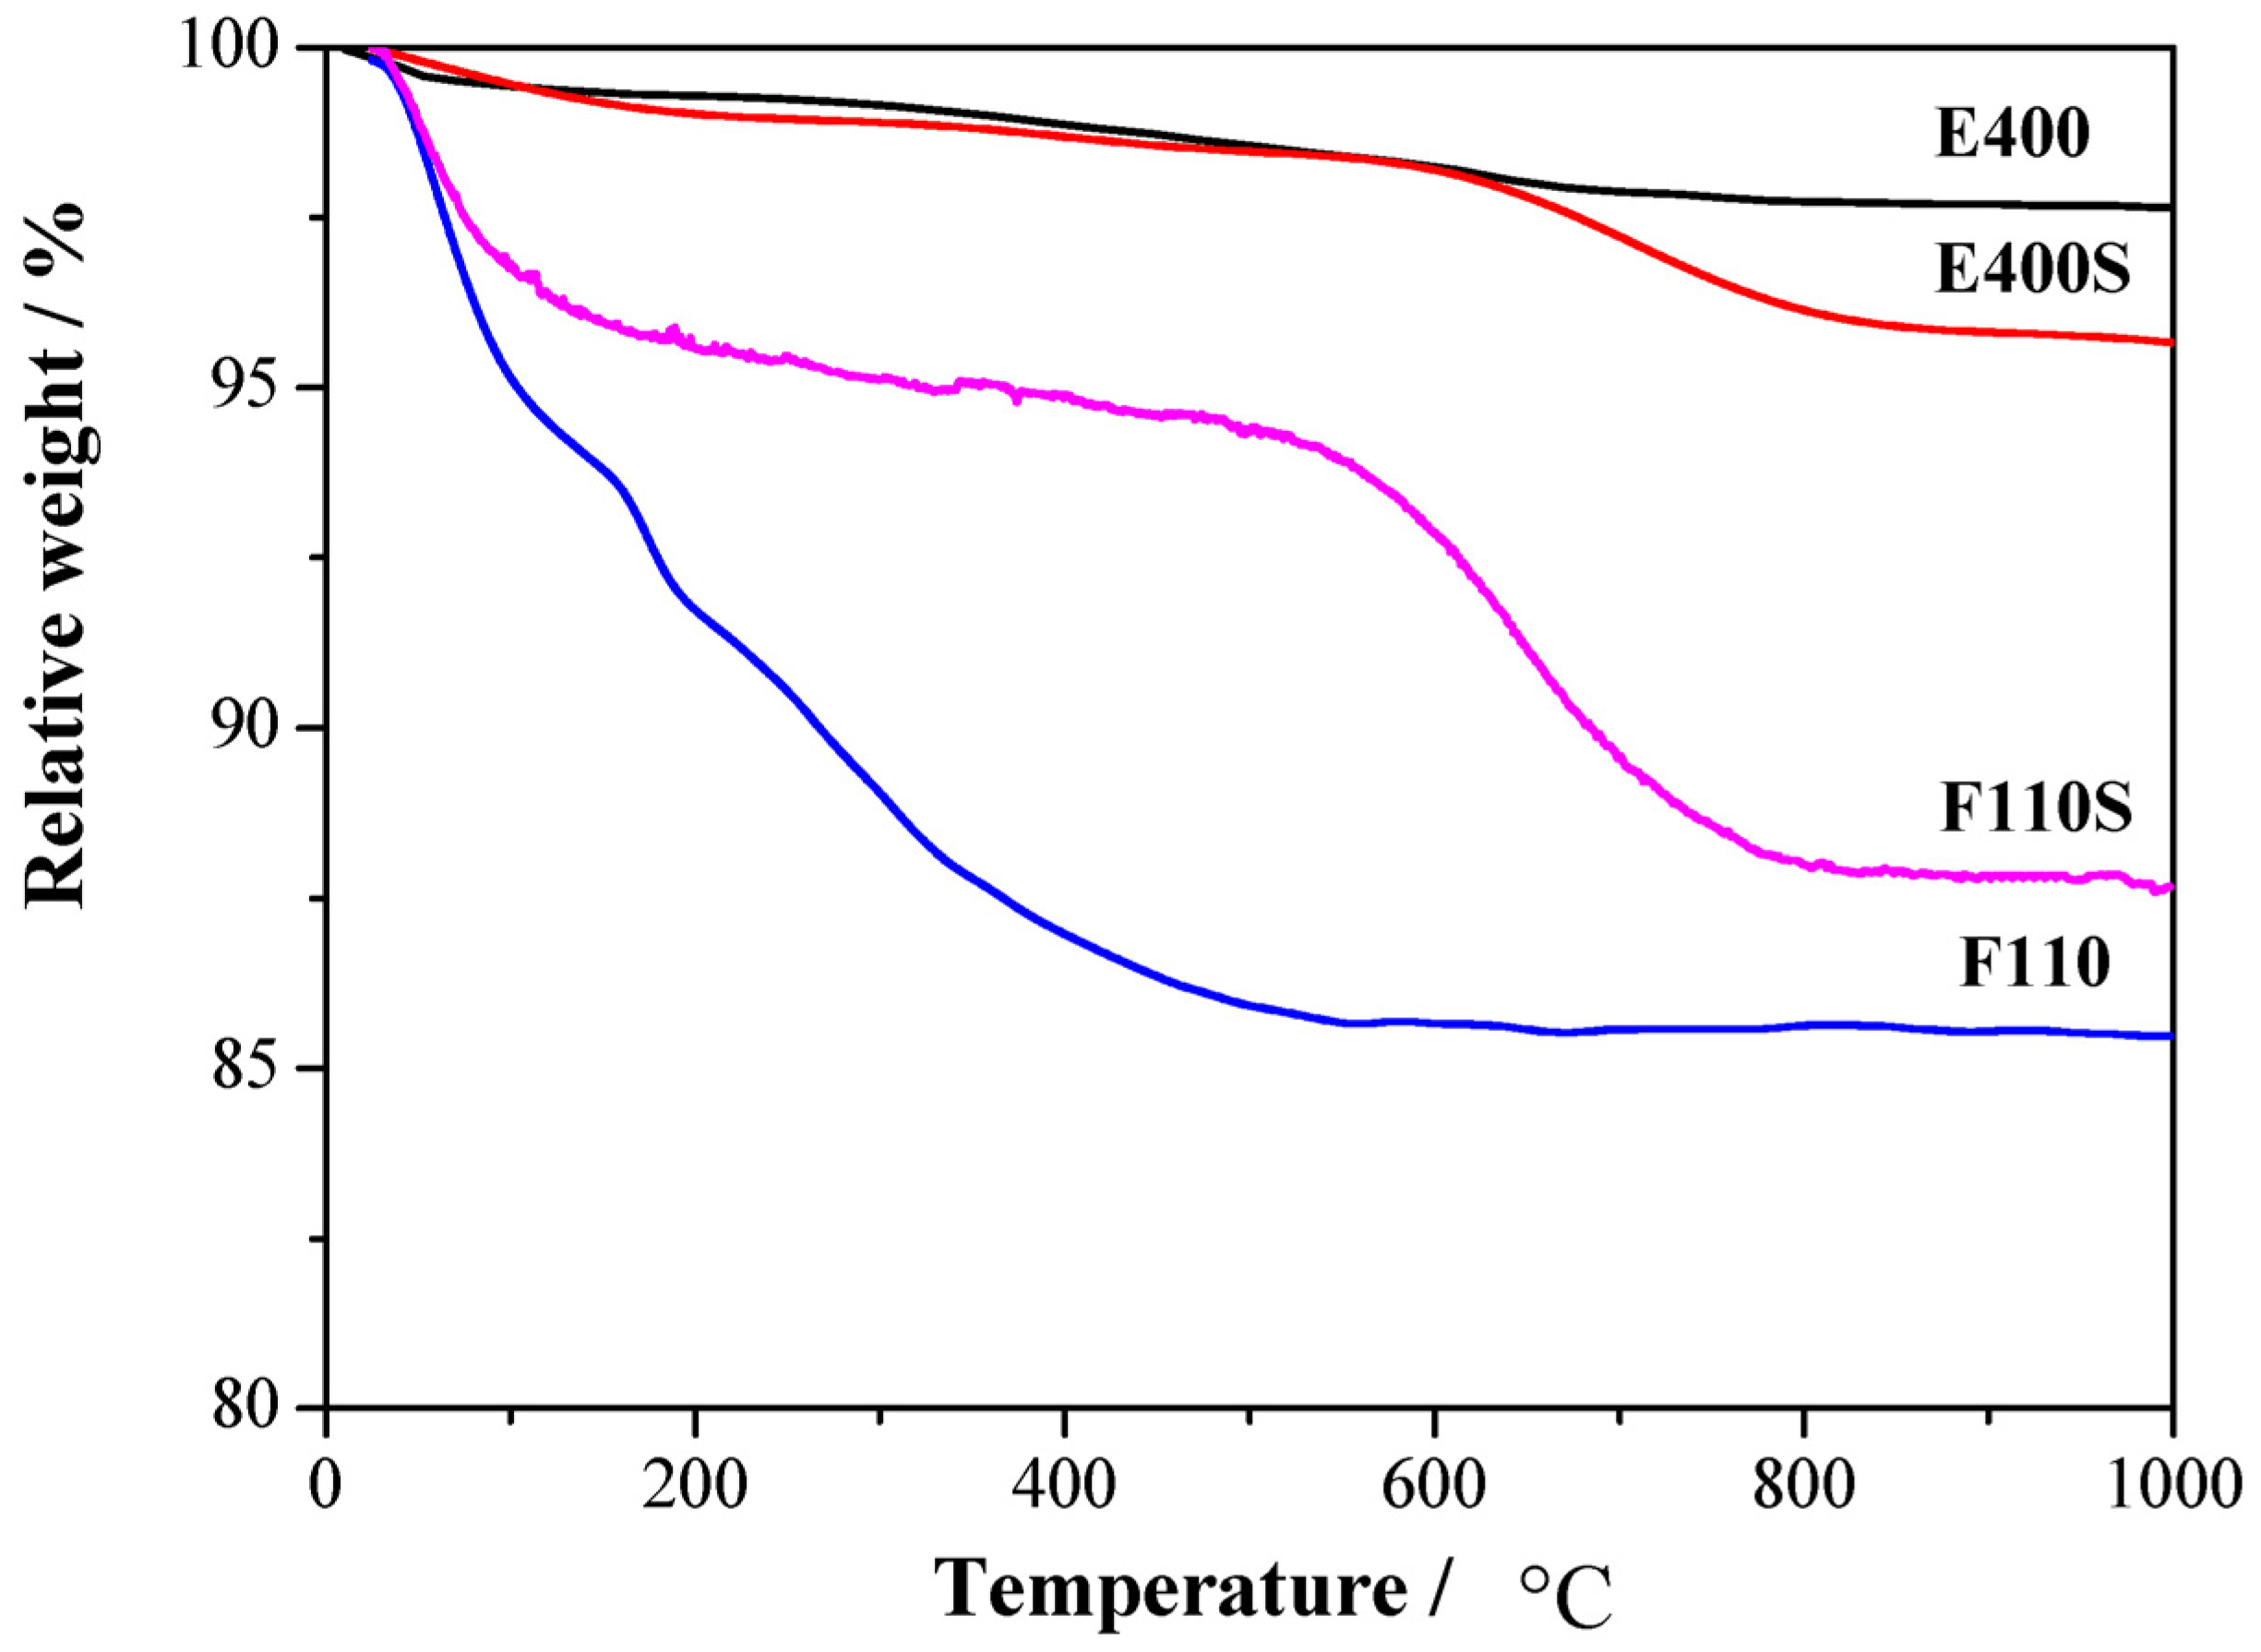
Thermal gravimetric (TG) analysis responses for the four synthesized oxides.
Figure 2.
Thermal gravimetric (TG) analysis responses for the four synthesized oxides.
Mass losses are observed in different thermal ranges. The first mass loss below 250 °C is observed in all the four samples and it is related to the removal of physisorbed and chemisorbed water as well as OH groups: the largest mass loss is observed, as expected, for the F110 sample, being it the one treated at relatively low temperature (
i.e., 110 °C, see experimental section). A second mass loss is observed between 400 and 500 °C only for the E400 sample and it is likely related to residual organic traces from the organometallic precursor. A similar mass loss in the 400–500 °C range is not evident for the sulphated parent sample E400S, most likely due to the removal of the contaminations during the high temperature treatment involved in the sulphation process. Another mass loss is observed above 600 °C only for the two E400S and F110S sulphated samples. This mass loss is related to the removal of the sulphate groups bonded to the surface of the tin oxide particles [
30]. The two samples show a loss of about 3% and 7% in mass for E400S and F110S, respectively. The larger concentration of chemisorbed sulphate groups in the F110S sample compared to the E400S goes in parallel with the smaller crystallite size of the pristine F110 bare oxide before the sulphation process in respect to the E400 one (see XRD results above). Such evidence suggests that the amount of sulphate groups chemisorbed on the SnO
2 surface increases with the nanometrization of the oxide particles.
The SEM micrographs of the four oxides at 20 k magnifications are reported in
Figure 3.
Figure 3.
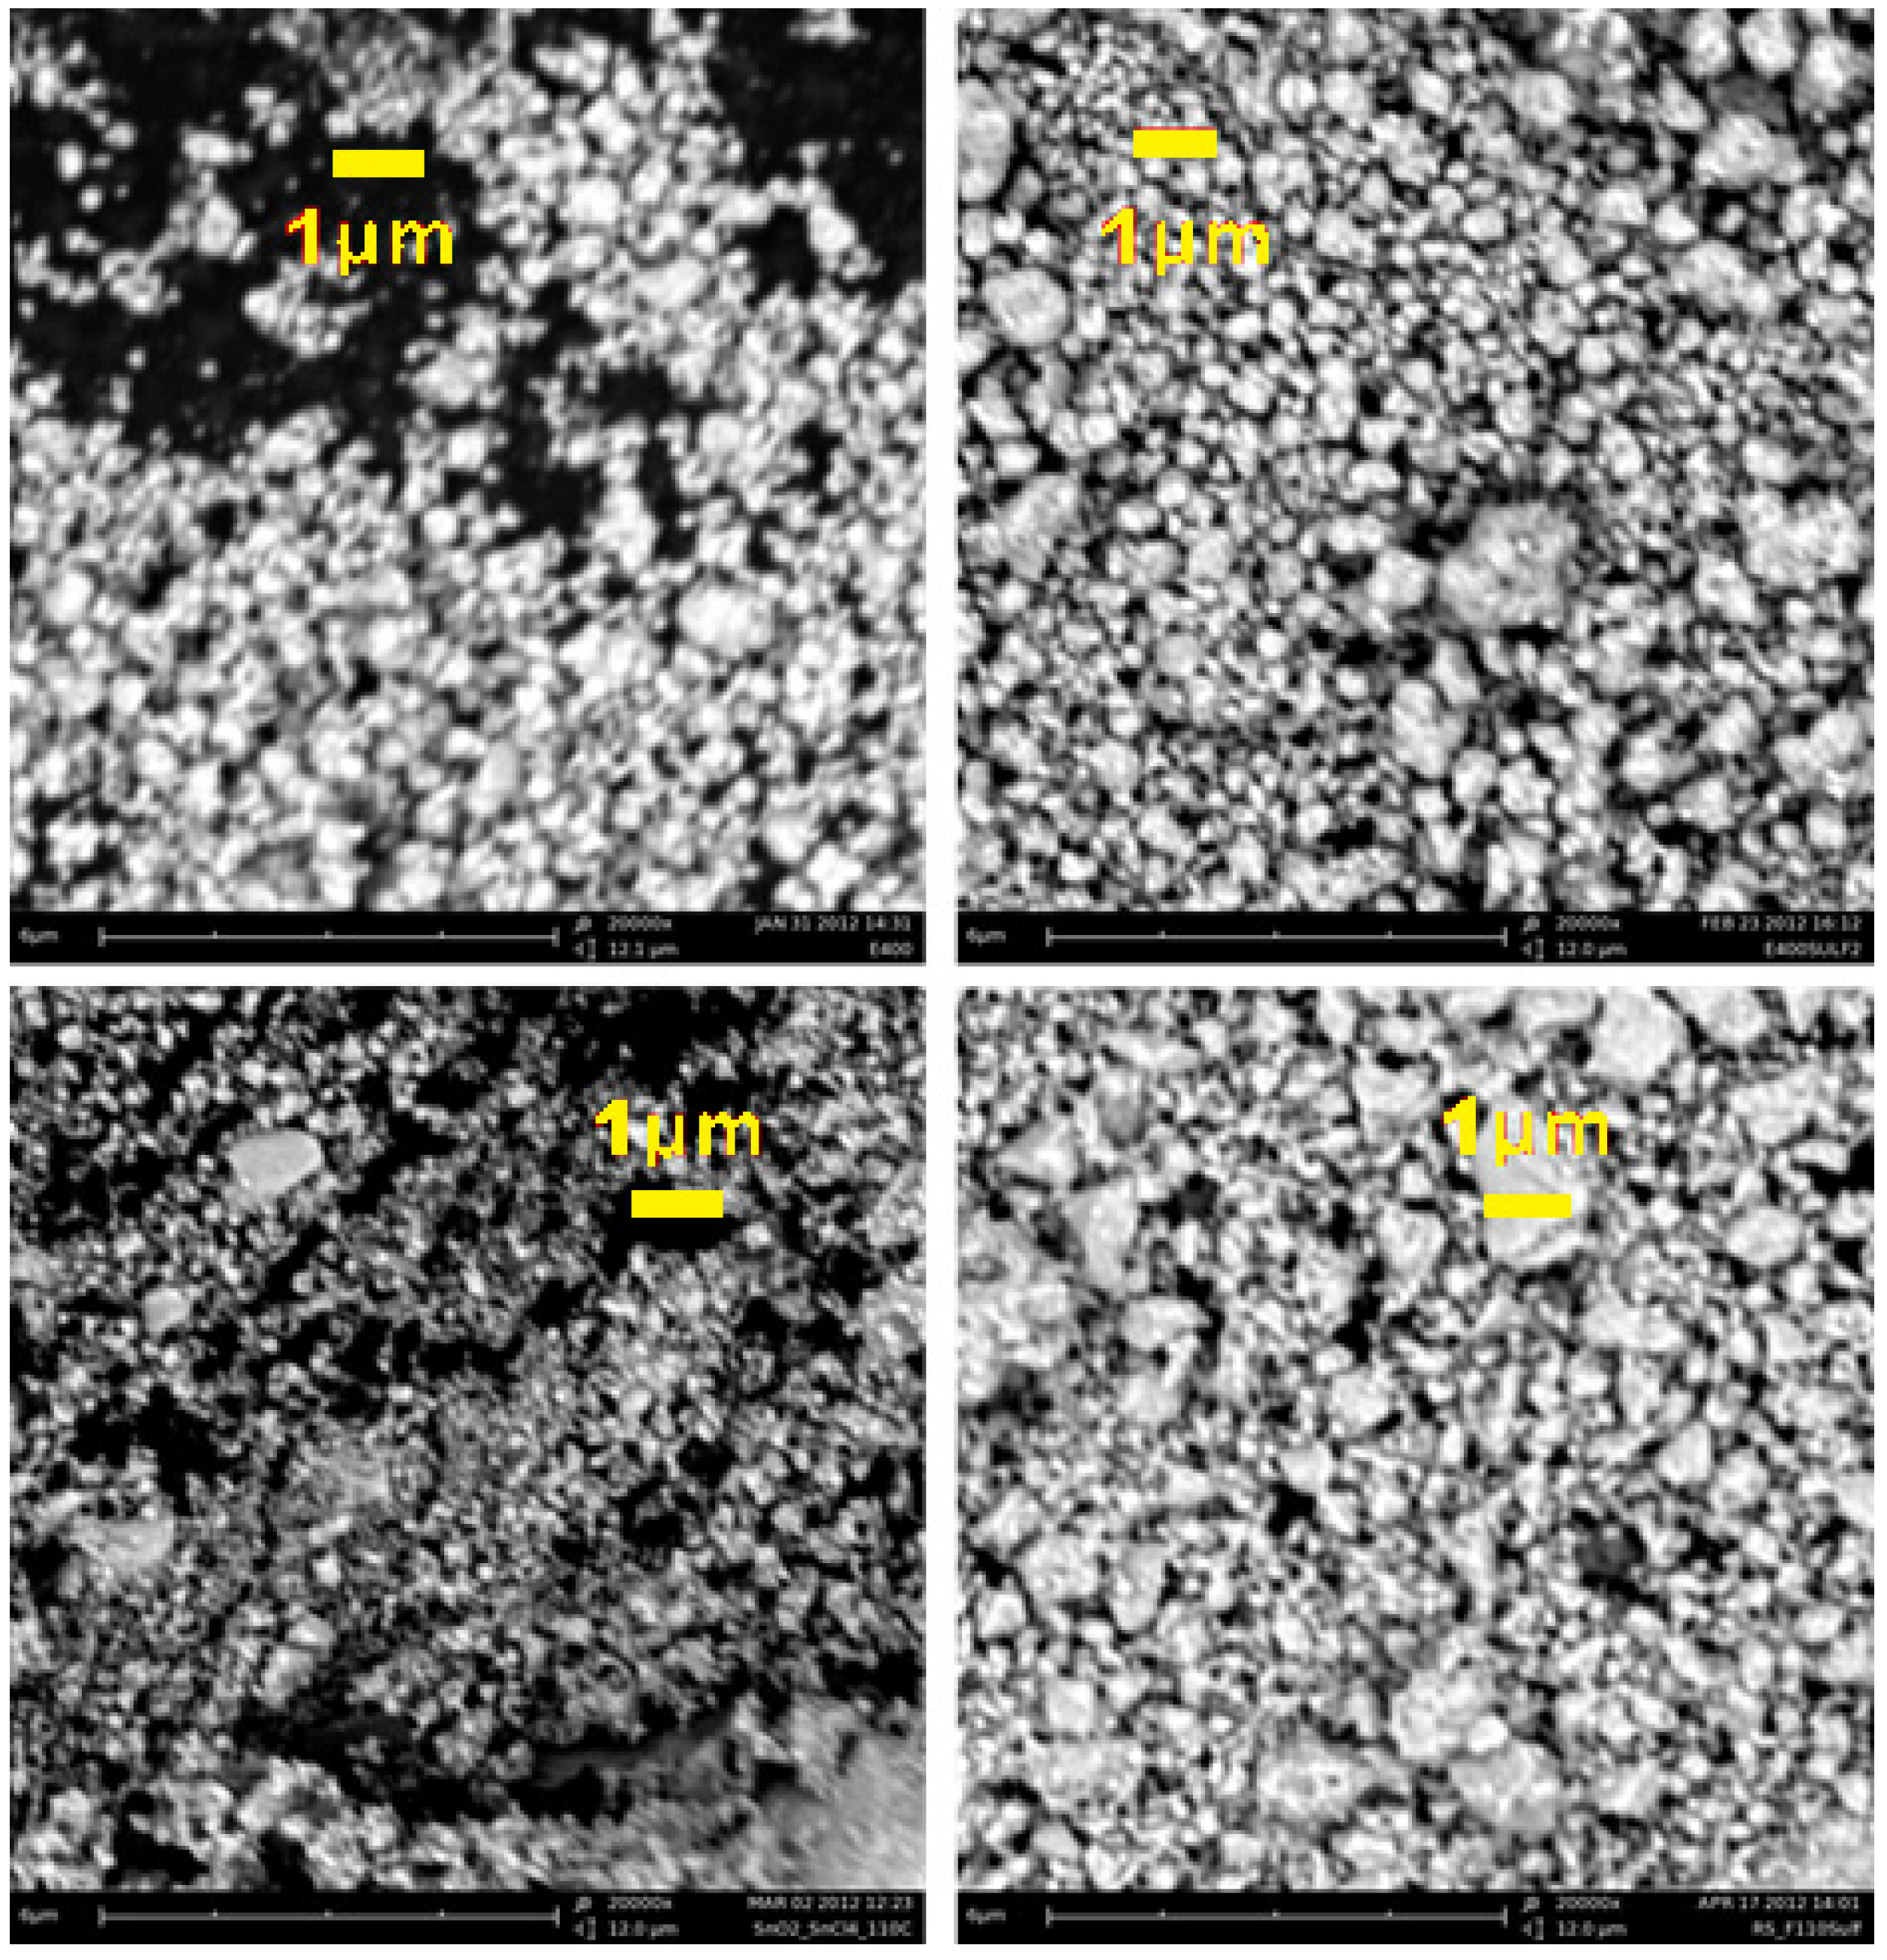
Scanning electron microscopy (SEM) micrographs of the four synthesized oxides. From left to right and from top to bottom: E400, E400S, F110, and F110S, respectively.
Figure 3.
Scanning electron microscopy (SEM) micrographs of the four synthesized oxides. From left to right and from top to bottom: E400, E400S, F110, and F110S, respectively.
The morphology in the microscopic range of all the powders is similar: all the samples consist of sub-micrometric particles (secondary particles) with a remarkable dispersion in size. Such large particles are likely formed by the aggregation of the nanometric crystallites estimated by the XRD data. The sulphation of the surfaces does not lead to drastic alterations: the surface-modified materials show only a slight increase in the size of the secondary particles. This picture is also confirmed by the trend of the surface areas, the measured values being 65 ± 2 m2 g−1 (E400), 52 ± 3 m2 g−1 (E400S), 160 ± 5 m2 g−1 (F110) and 100 ± 1 m2 g−1 (F110S). These values correspond to estimated spherical particle diameters of 13, 17, 5, and 9 nm for the E400, E400S, F110, and F110S samples, respectively. It is interesting to observe that the surface area of the F110S samples is approximately the double of the other sulphated E400S sample. This difference accounts for the approximate double amount of sulphate groups bonded to the F110S sample in comparison to the E400S one.
2.2. Spectroscopic Characterization of the Bare and Sulphated Tin Oxide Powders
All the SnO2 samples, both bare and sulphated, have been investigated by vibrational spectroscopies (FTIR and Raman) in order to investigate the modes of the surface groups and the nature of the chemical bond between the sulphates and the SnO2 surfaces.
The FTIR spectra of the four samples are reported in the
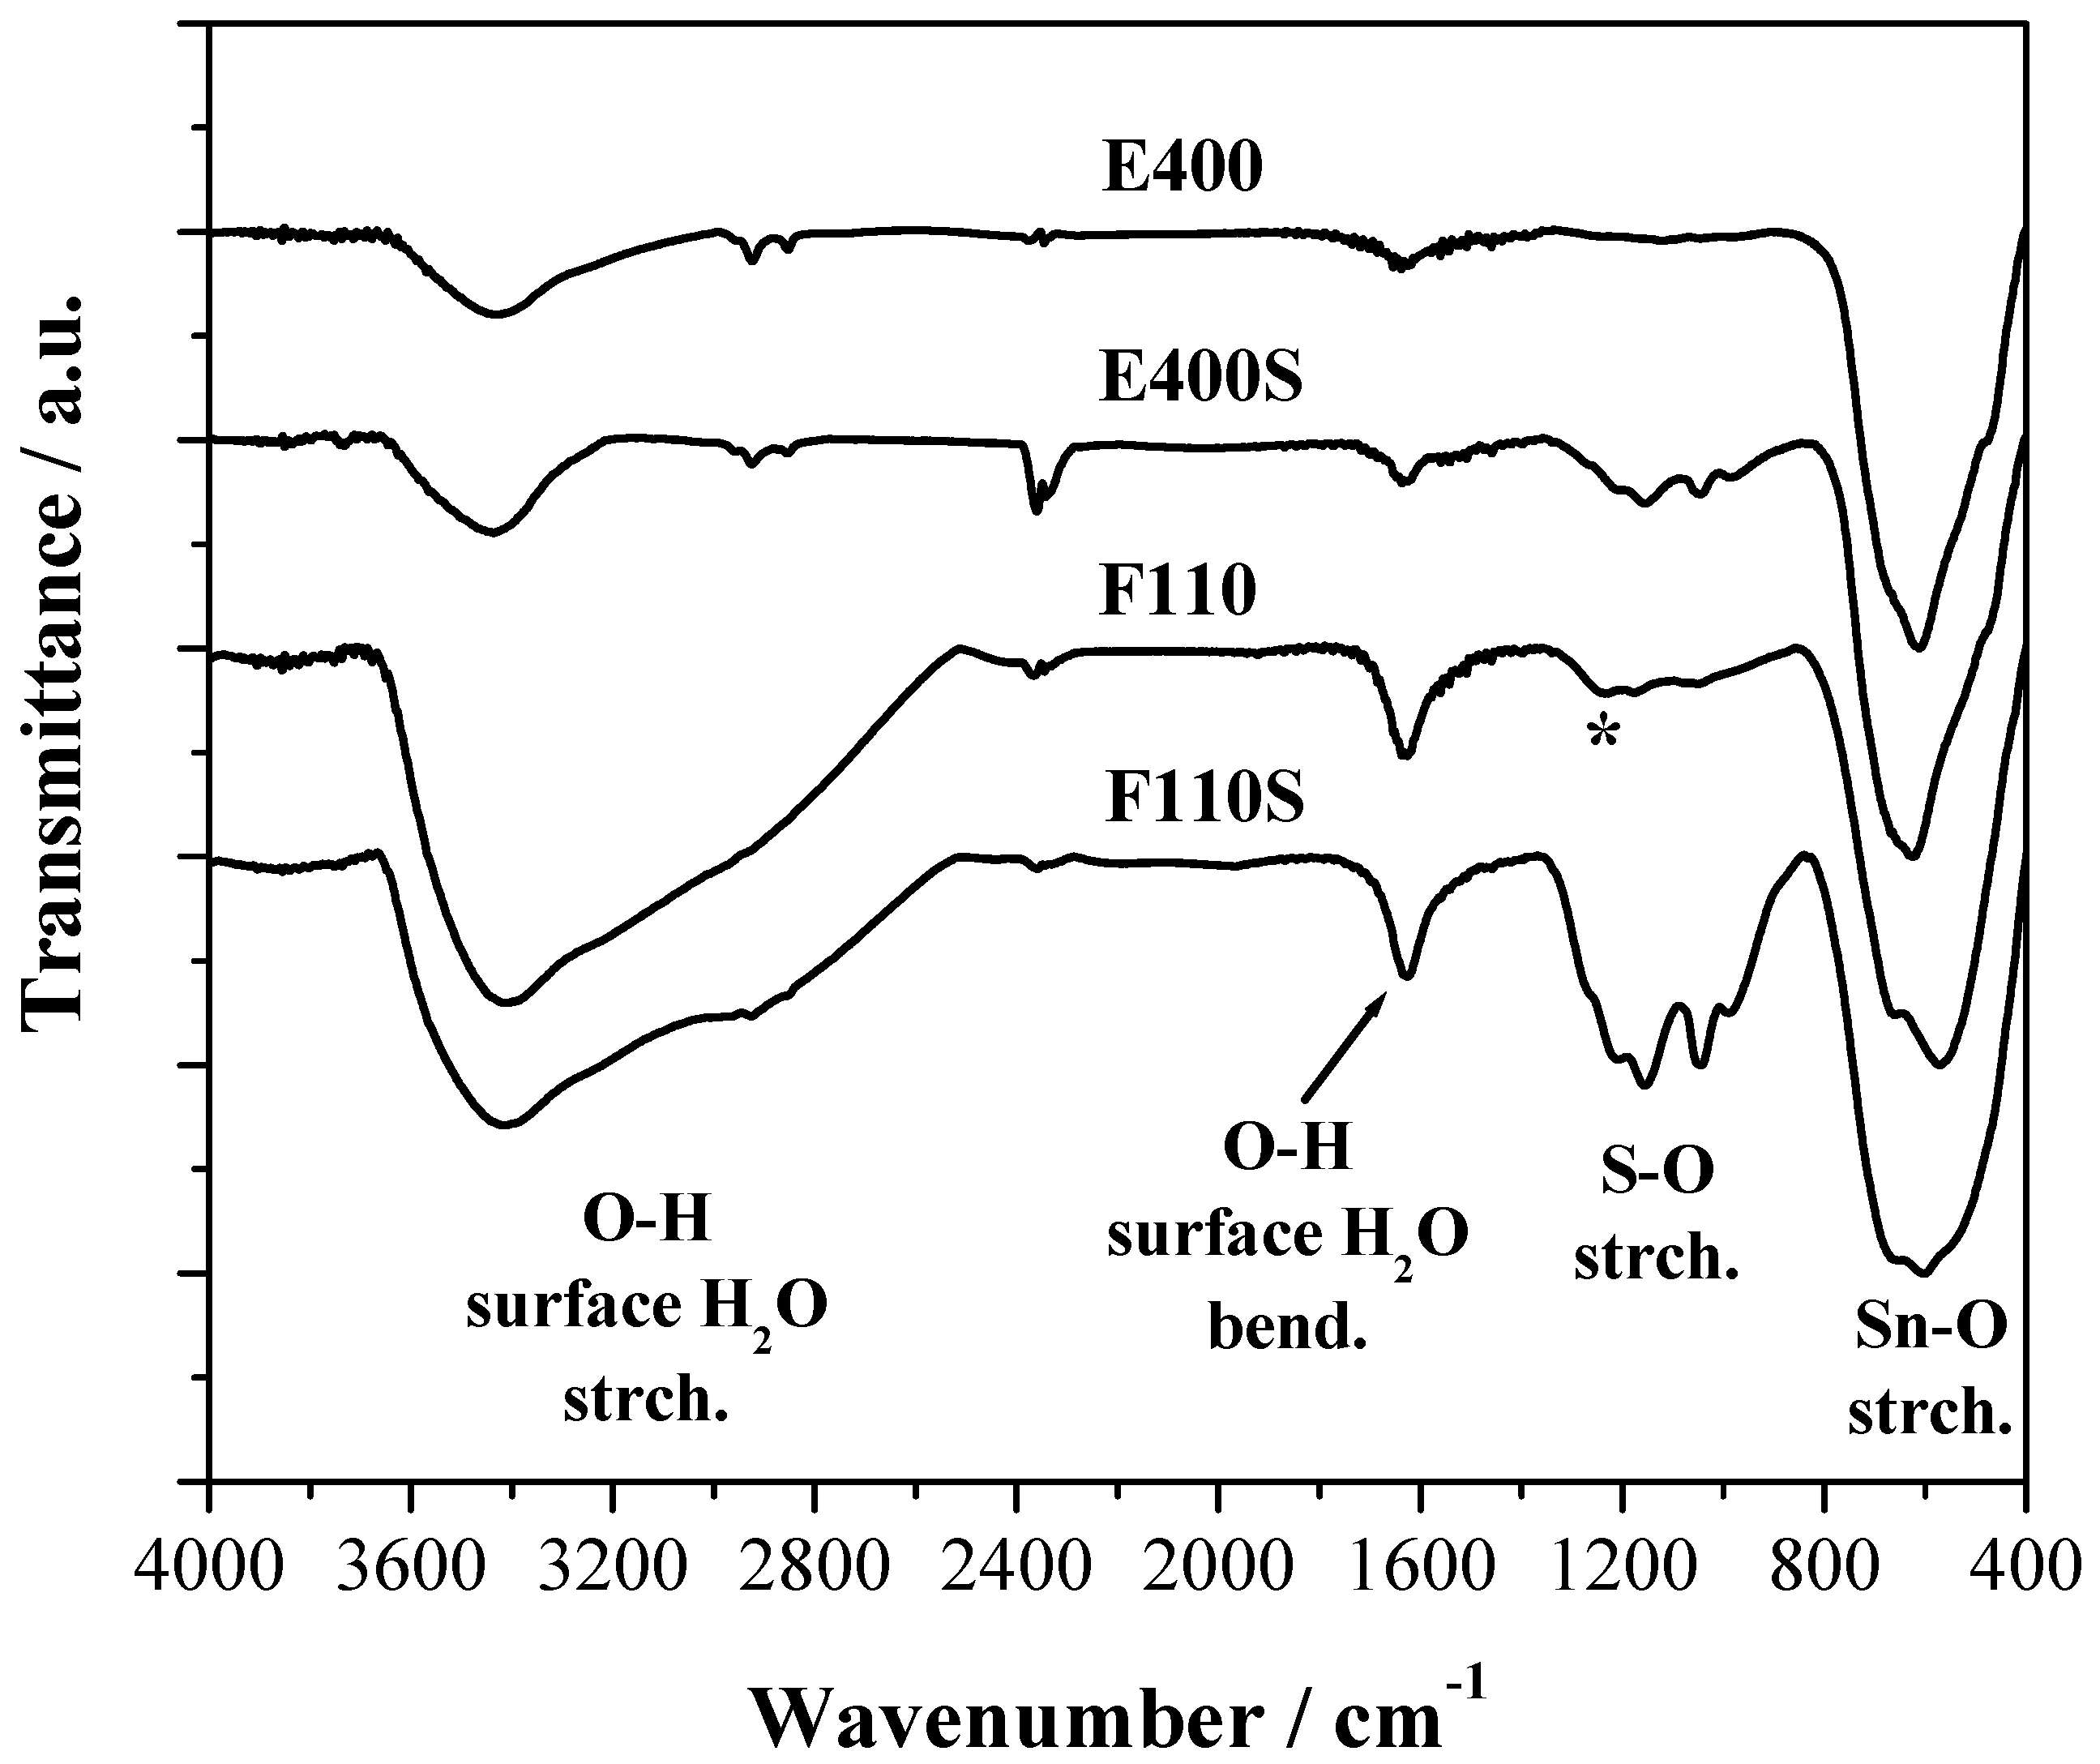
Figure 4 where three main spectral features are observed. All samples show a broad composite band due to the vibrational modes of the Sn–O–Sn oxide lattice below 800 cm
−1 and a band at about 1620 cm
−1 attributed to the bending mode of surface water molecules and –OH groups [
34].
Figure 4.
Fourier Transform Infrared (FTIR) spectra of the bare and sulphated oxides. The (*) symbol corresponds to the Sn–OH bending mode.
Figure 4.
Fourier Transform Infrared (FTIR) spectra of the bare and sulphated oxides. The (*) symbol corresponds to the Sn–OH bending mode.
The presence of physisorbed water and OH terminal groups on the surface of all the samples, even after calcination at 400 °C and/or 500 °C, is confirmed by the large broad band due to the stretching of the OH bond between 2400 and 3600 cm
−1. The F110 sample shows in addition a composite response between 1250 and 800 cm
−1 that is likely due to the bending of Sn–OH bonds as discussed in [
35].
For the two E400S and F110S sulphated samples a series of FTIR bands between 1400 and 800 cm−1 due to the sulphate stretching modes are evident. As expected, their intensity is stronger for the F110S sample that has a double amount of sulphate groups bonded to the surface compared to the E400S sample. It is to be noted that the position and relative intensity of the bunch of narrow bands due to sulphate groups are very similar for the two samples: this evidence suggests that the nature of the chemical bond between the SnO2 oxide and the sulphate groups bonded is almost the same in the two samples.
The evolution of surface vibration modes, revealed by Raman spectroscopy, are presented in
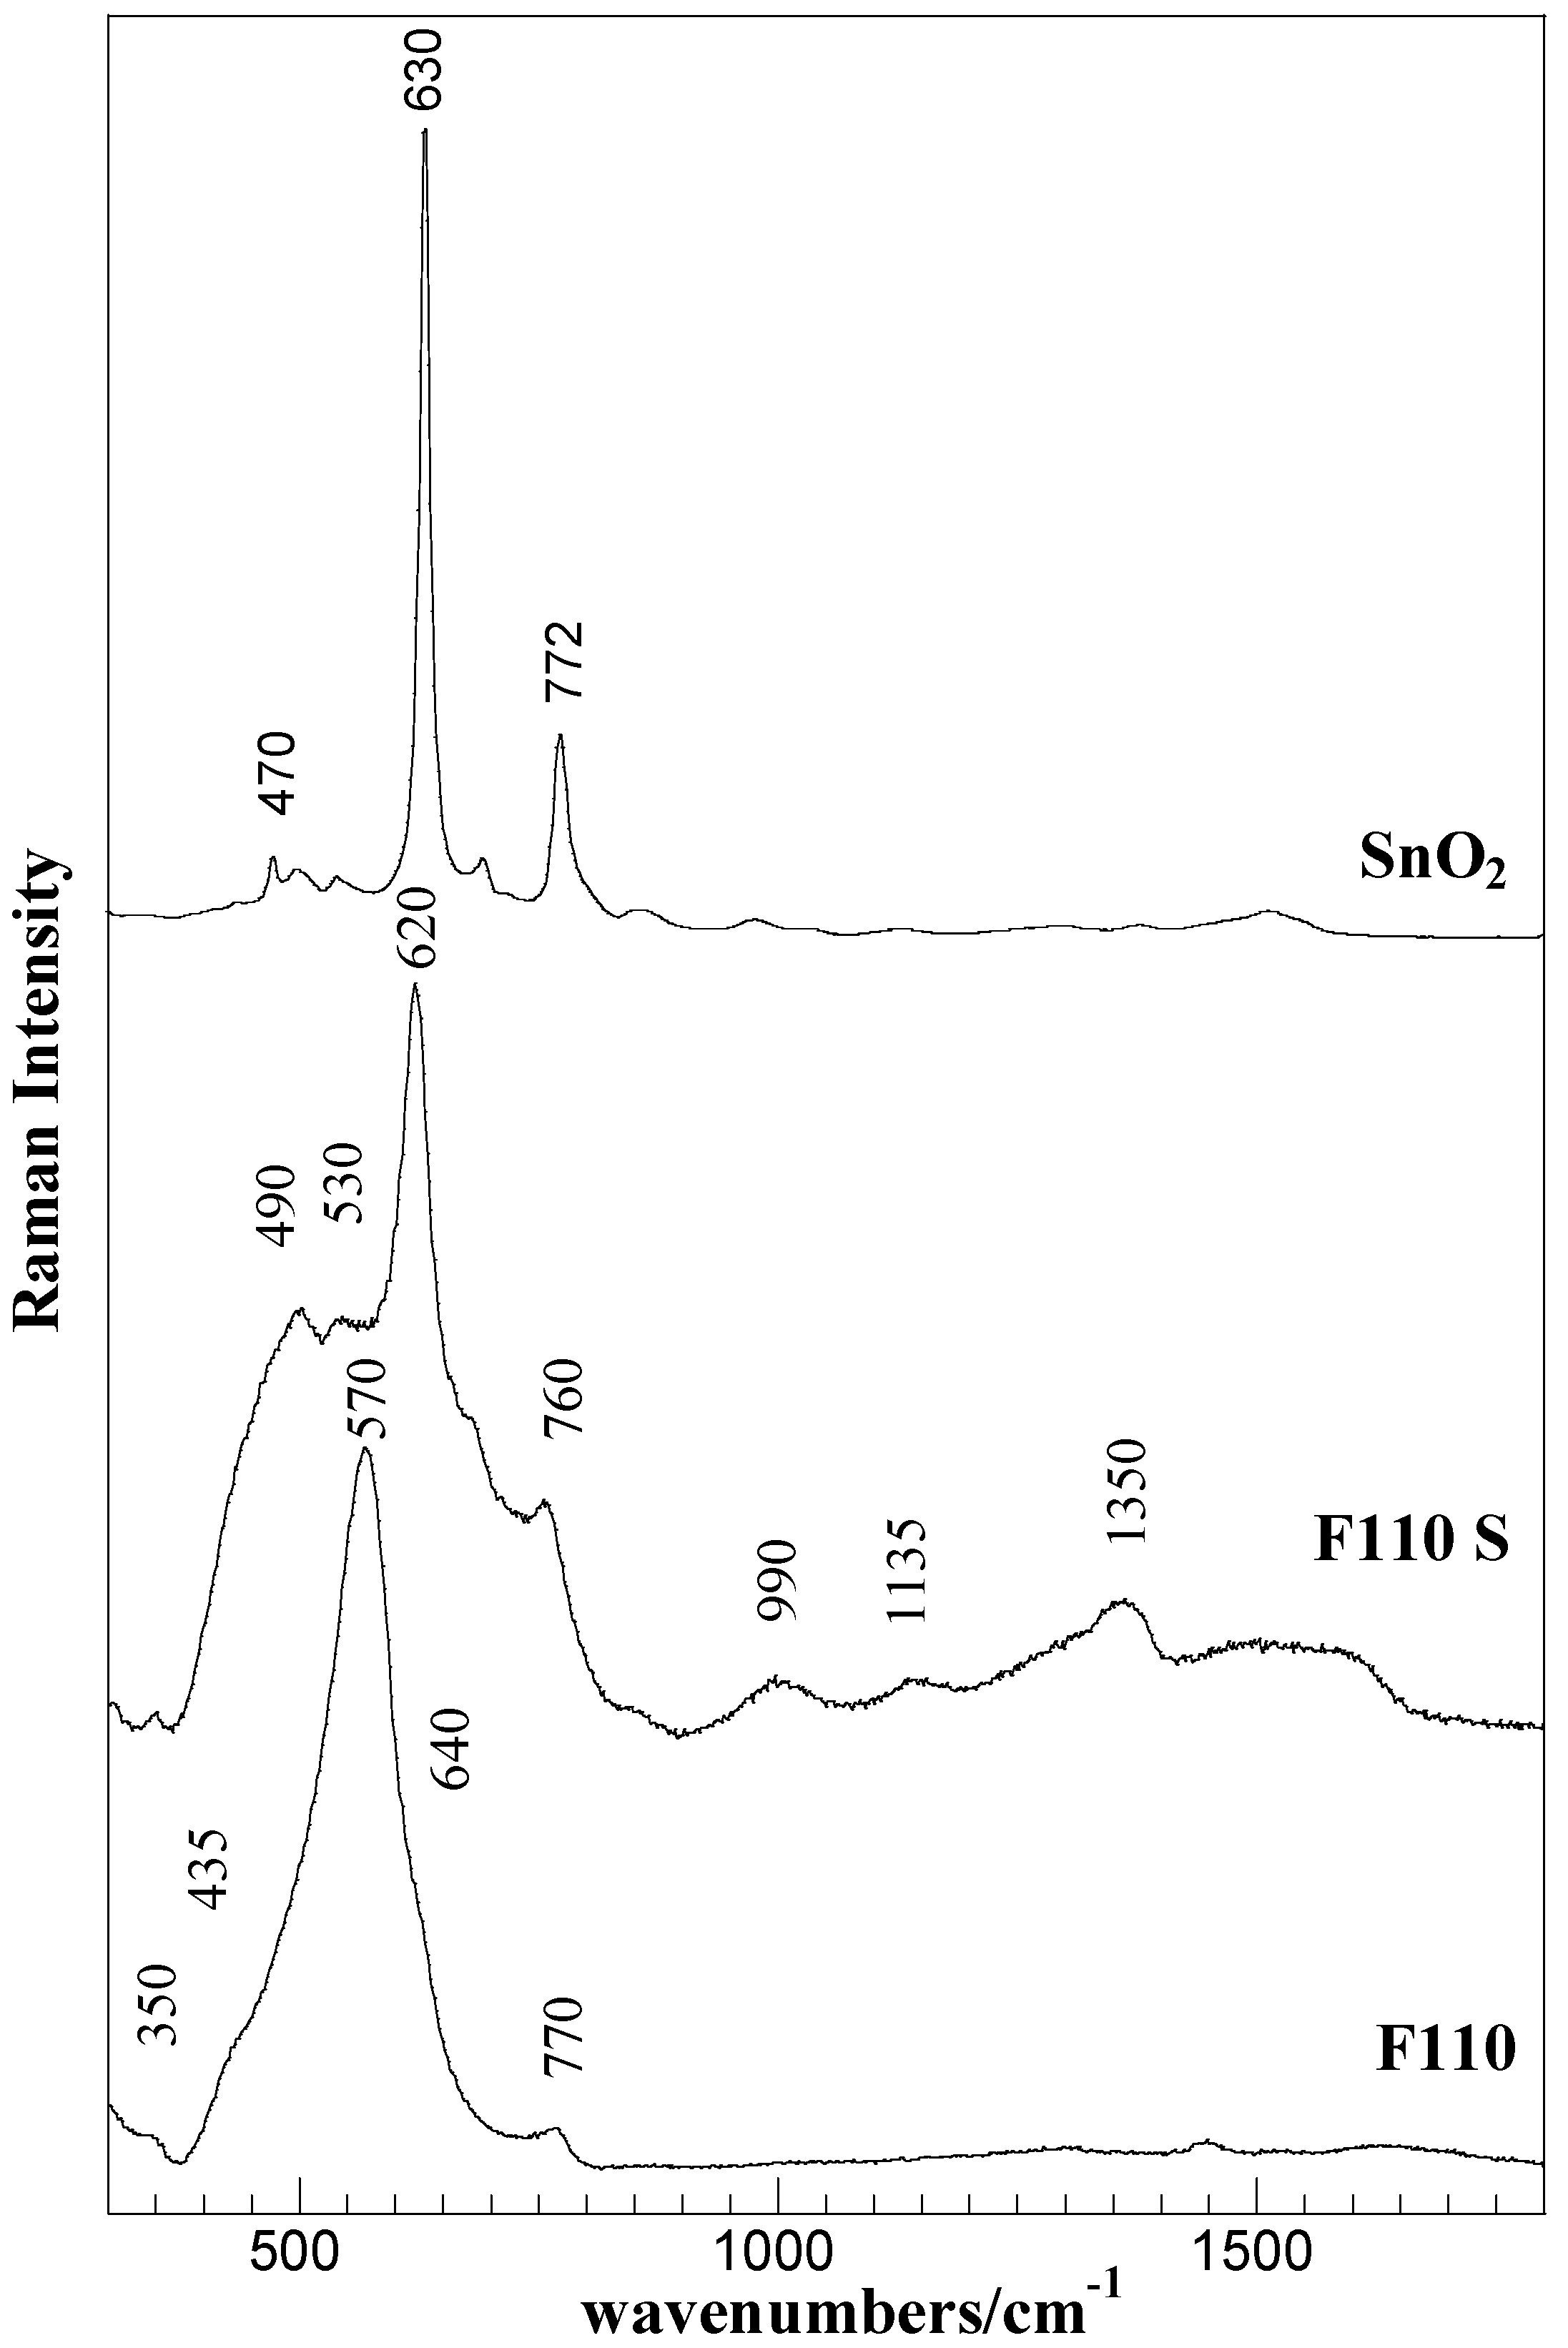
Figure 5 for the F110 and F110S samples, as a representative case. The spectrum of bulk SnO
2 is also shown for comparison.
Figure 5.
Raman spectra of the F110 and F110S samples and of bulk SnO2 (Aldrich).
Figure 5.
Raman spectra of the F110 and F110S samples and of bulk SnO2 (Aldrich).
The Raman spectrum of the starting F110 sample mainly consists of a broadened strong band centered at about 570 cm
−1 and of low intensity bands at about 350 cm
−1, 435 cm
−1, 640 cm
−1, and 770 cm
−1. According to factor group analysis, four first-order Raman active modes (A
1g, B
1g, B
2g, E
g) are predicted for crystalline SnO
2 (tetragonal rutile structure) at 100 cm
−1 (B
1g), 479 cm
−1 (E
g), 638 cm
−1 (A
1g), and 779 cm
−1 (B
2g) [
36]. The bands at about 570 and 350 cm
−1 are attributed to interface or surface phonon modes of nanostructured SnO
2 material [
37,
38], being this in agreement with the results of XRD and morphological analyses. As, at decreasing particle size, a shift to lower wavenumbers is expected, the strong band at about 570 cm
−1 can be related to the A
1g mode of the SnO
2 structure, whereas the barely detectable bands at about 435 cm
−1, 640 cm
−1, and at about 770 cm
−1 are attributed to normal interior phonon modes of the bulk SnO
2 structure.
The sulphation process yielded a strong modification in the Raman spectra of the F110 sample. In addition to the changes in the SnO
2 structure, revealed in the 300–800 cm
−1 spectral region, the presence of sulphate-species were detected in the range 930–1600 cm
−1 of the F110S sample. The sharp and intense bands at about 490, 620, and 760 cm
−1 are ascribed to SnO
2 in crystalline form (E
g, A
1g, and B
2g modes) [
36], the amorphous nanostructured starting material is, however, still present as evidenced by the large band underlying the whole region representative of surface phonon modes.
The bands in the 900–1500 cm
−1 range, at about 1000, 1150, and 1360 cm
−1, disclose the presence of various surface sulfate species. Although bands assignment is still conflicting, the bands at about 1000 and 1350 cm
−1 can be attributed to S–O and S=O modes of the surface sulfate groups [
39]. The band at about 1135 cm
−1 can also be attributed to S–O stretching modes, but in polynuclear sulfate groups and/or stretching modes in bidentate sulfate species [
40]. Furthermore, the broad band centered at about 1600 cm
−1 can be assigned to the OH vibration of adsorbed molecular water.
2.3. Physico–Chemical Characterization of the Nafion-based Membranes
Five membranes have been prepared without and with the four filler powders. The filler loading has been chosen as 5 wt % in agreement with previous results published by Chen
et al., where Nafion membranes containing 5 wt % of sulphated tin oxide were shown to have optimized proton conductivity with respect to undoped and 10 wt %-added membranes [
30]. Filler amount not higher than 4–5 wt % has been demonstrated to be the most effective also for other metal oxide-doped Nafion membranes, both in terms of homogeneous dispersion of the additive within the polymer matrix and of improved stiffness of the resulting composite system [
21,
41].
A summary of the membrane compositions and the corresponding water uptake (WU) and ionic exchange capacity (IEC) values are reported in the
Table 1 together with data derived from the thermal analyses.
Table 1.
Water uptake (WU), ionic exchange capacity (IEC), and parameters derived from the thermal analysis for the five prepared membranes.
Table 1.
Water uptake (WU), ionic exchange capacity (IEC), and parameters derived from the thermal analysis for the five prepared membranes.
| Code | Filler (5 wt %) | IEC mequiv g−1 | WU | ΔH/J g−1 (DSC) | Ttr/°C (DSC) |
|---|
| N | none | 0.880 | 37% | 76.9 | 185 |
| N-E400 | E400 | 0.834 | 38% | 105 | 163 |
| N-E400S | E400S | 0.812 | 37% | 93.3 | 153 |
| N-F110 | F110 | 0.827 | 40% | 114 | 146 |
| N-F110S | F110S | 0.820 | 40% | 181 | 153 |
The ionic exchange capacity decreases slightly for all the composite membranes compared with the benchmark recast Nafion (N). This is likely ascribed to the fact that the ceramic powder addition is expected to increase the density of the membrane thus reducing the amount of acid sites for mass units. The small differences in IEC values among membranes containing sulphated or unsulphated filler are not considered of relevance. Indeed, due to the nature of the experiment adopted for the IEC determination (see Experimental section), incomplete ion exchange can even be considered, mainly when compounds with very high proton affinity are being used.
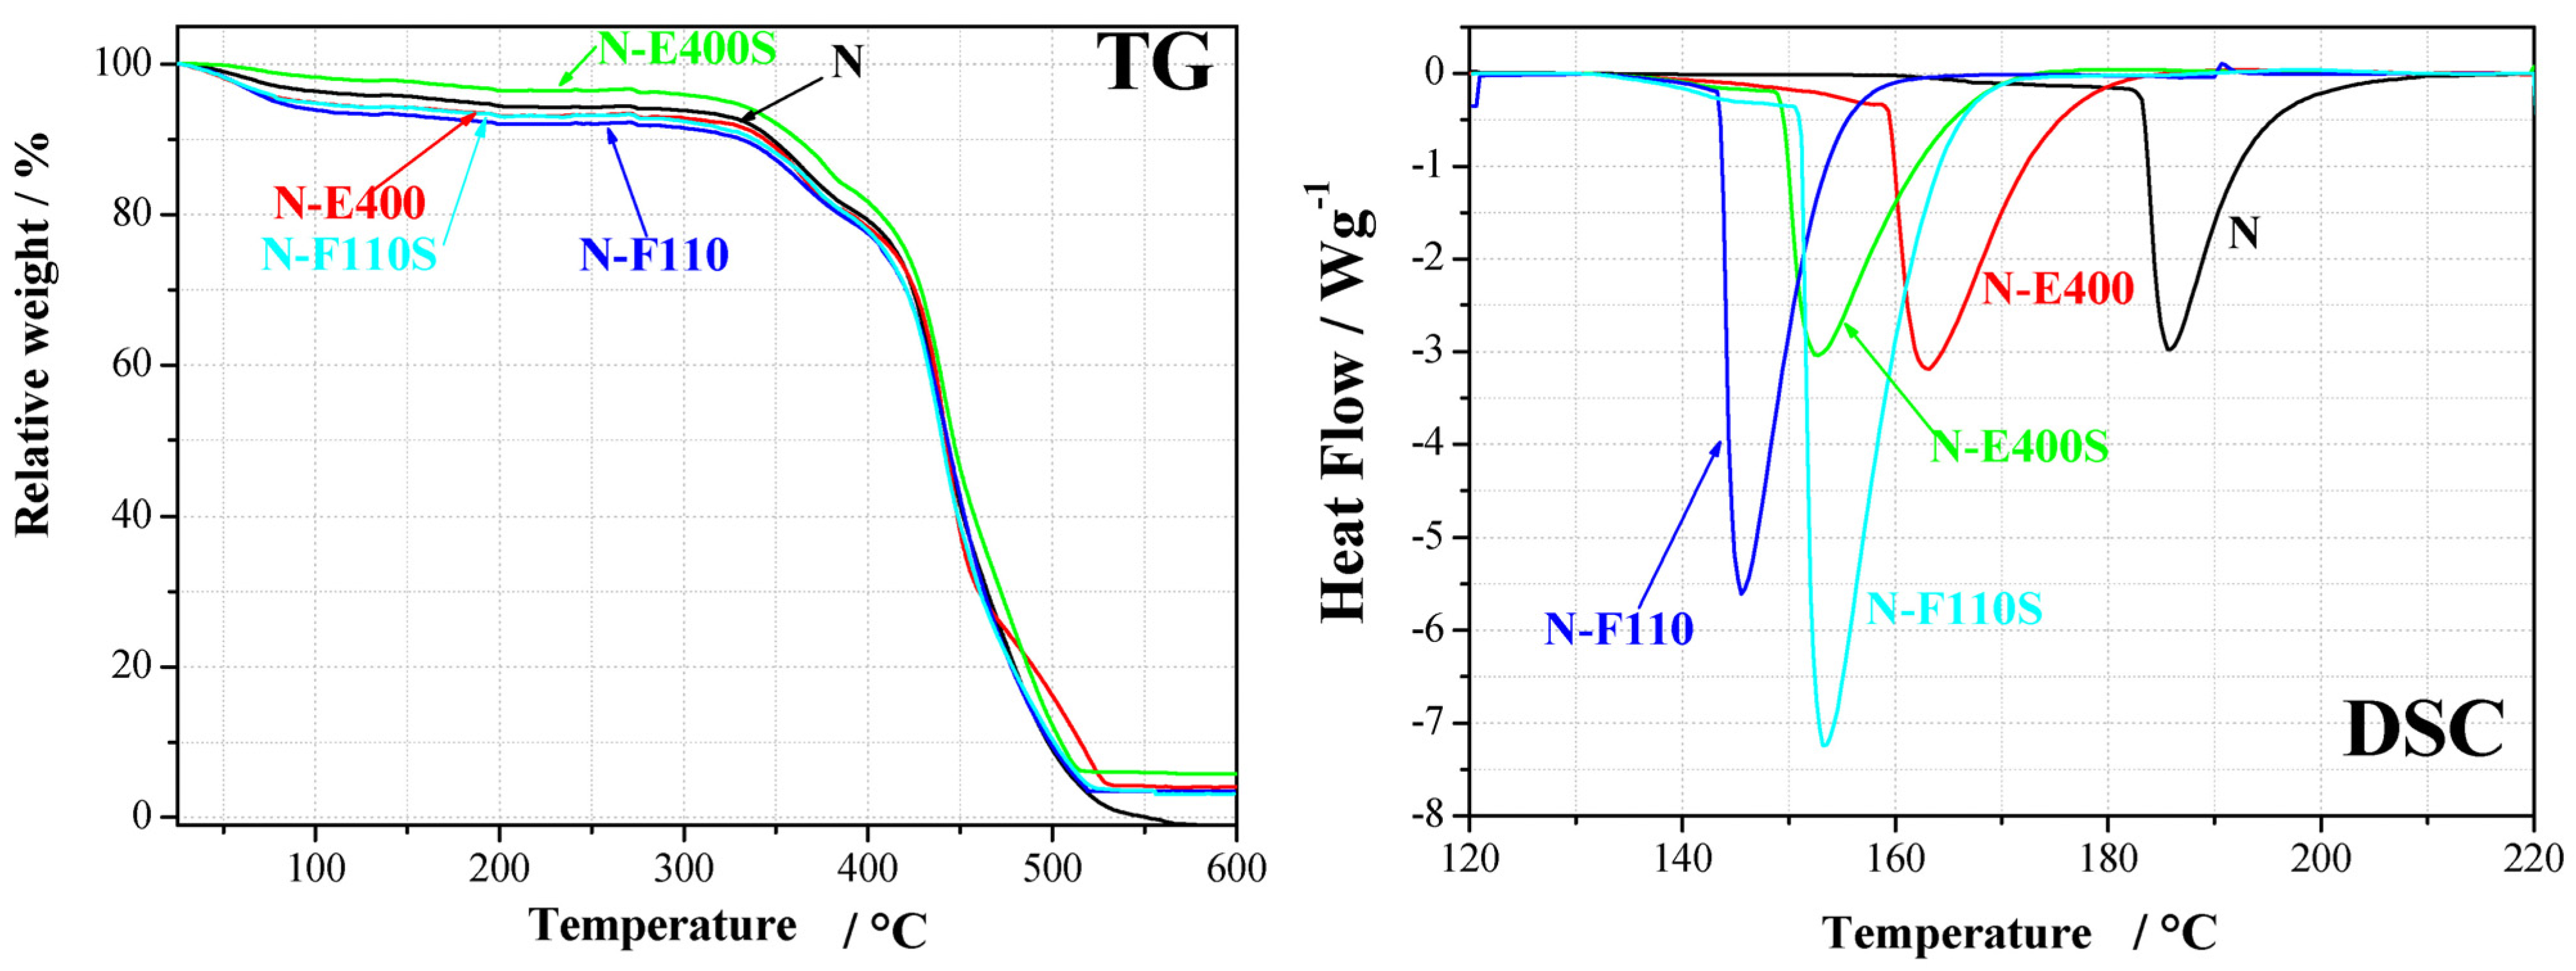
The effect of the fillers on the hydration/dehydration of the membranes is proved by water uptake and thermal analysis results. The WU is apparently slightly higher in the case of the composite membranes containing the F110 additive, both sulphated and non. However these data do not provide information on the nature and the strength of the bonds between water, filler, and Nafion ionic domains. The thermal profiles of the membranes from TG and DSC experiments are shown in
Figure 6.
Figure 6.
Thermal analysis results (TG and DSC) for the five membranes.
Figure 6.
Thermal analysis results (TG and DSC) for the five membranes.
The TG analyses show, as expected, two main mass loss processes: below 200 °C and above 300 °C, respectively. The first process is related to the removal of water from the polymer matrix, whereas the processes above 300 °C to the degradation and combustion of the polymer matrix. The residual mass above 500 °C is due to the ceramic filler; values, slightly differing from the theoretical amount of 5 wt %, are ascribed to small non-homogeneity within the samples. The composite membranes added with the sulphated oxide fillers, i.e., N-E400S and N-F110S, show a mass loss around 120 °C slightly smaller than those observed for membranes added with the bare oxides, N-E400 and N-F110, respectively. The membrane hydration above 100 °C is a key technological property as such a temperature range is a practical target for PEM fuel cell operation. This experimental evidence may suggest a content of water smaller for the N-E400S and N-F110S samples than for the N-E400 and N-F110 parent membranes. On the other hand, one cannot exclude the presence of highly coordinated or bonded water, strongly interacting with the fillers, not easy to be removed at the quoted temperature. Owing to this and to the nature of TGA experiments (see Experimental section), where membrane samples are not equilibrated under stable temperature and/or relative humidity states, the mass losses at 120 °C can not be taken as a metric for evaluating water content in the membranes.
DSC experiments show for all samples the expected broad endothermic peaks between 140 and 190 °C. This thermal effect is due to an order-disorder transition in the ionic domains of the Nafion polymer membrane [
42]. It is known to be strongly affected by the amount of water within the membrane both in terms of transition temperature (T
tr, smaller for larger water contents) and enthalpy variation (ΔH, larger for higher hydration degrees) [
21]. All the membranes added with the inorganic fillers show smaller transition temperatures and larger enthalpy variations in comparison with the Nafion benchmark membrane. Thus, the addition of SnO
2-based inorganic fillers univocally leads to an increase of the amount of water within the composite membranes under the experimental conditions here quoted (
i.e., without any control of external relative humidity). In particular the comparison among the DSC data for the N-E400, the N-F110 and the benchmark N membrane suggests that the N-F110 sample keeps the larger amount of water. This is in agreement with the TG results (see
Figure 2) and with the WU measurements (see data in
Table 1).
Focusing the attention to the sulphated membranes, the DSC data show contradictory trends. In particular, the N-E400S sample shows a decrease of the transition temperature and of the enthalpy variation compared to the bare N-E400 membrane, whereas the N-F110S sample shows an increase of the transition temperature and of the enthalpy variation compared to the bare N-F110 membrane (see data in
Table 1).
In the attempt to understand this behavior, relative interactions among components on a molecular level and the water affinity of the four oxide fillers have to be considered. As shown by the TG data reported in
Figure 2, the mass loss due to water desorption from the oxides is different in the four cases. In particular, the E400 and the E400S oxides show a similar mass loss <1% up to 160 °C, whereas the F110 and the F110S samples suffer larger losses,
i.e., 6% and 4%, respectively. Owing to this, it is likely that also the amount of water in the N-E400 and N-E400S is quite similar. In this view it is possible to speculate that the H
2O molecules are more strongly bonded in the N-E400S membrane compared to the N-E400 sample and that the addition of the sulphated E400S filler enhances the retention of water above room temperature. This is in agreement with the decrease of the order-disorder transition temperature observed in the DSC data between N-E400 and N-E400S. The parallel contradictory smaller enthalpy variation may be related to the larger strength of the chemical bond between water molecules and the oxides particles in the case of the N-E400S membrane, this reducing the expected effect of water towards the polymer ionic clusters in terms of cohesive interactions. In fact, the sulphate groups on SnO
2 may strongly coordinate the residual water around the inorganic fillers particles, thus, altering the mean amount of free water dispersed throughout the Nafion matrix.
Turning back to the F110 and F110S samples, the TG data reported in
Figure 2 suggest larger mass losses for the F110 oxide in comparison to F110S, excluding in the estimate the loss due to sulphate group removal. In this view it is likely that the amount of water in the composite matrix is much larger for the N-F110 membrane compared to the N-F110S. This is in agreement with the lower order-disorder transition temperature observed in the DSC for the N-F110 sample compared to the N-F110S membrane. Here, the higher enthalpy variation observed for the N-F110S sample in comparison with the N-F110 one may be related to enhanced interactions between water molecules and ionic clusters, this suggesting the existence of differently coordinated and interacting water in the various membranes. In summary the addition of the SnO
2-based inorganic filler promotes hydration into the Nafion-based membranes, as shown by both WU measurements and thermal analyses. Furthermore the surface modification of the filler, due to the addition of sulphate groups, apparently modifies the strength and the nature of the water-filler and water-ionic cluster bonds.
2.4. Atomic Force Microscopy (AFM) and Dynamic Mechanical Characterization of the Composite Membranes
The morphologies of the composite membranes, as well as of the benchmark Nafion, all in their dried state (i.e., 1 h treatment at 70 °C in air), were investigated by AFM in tapping mode.
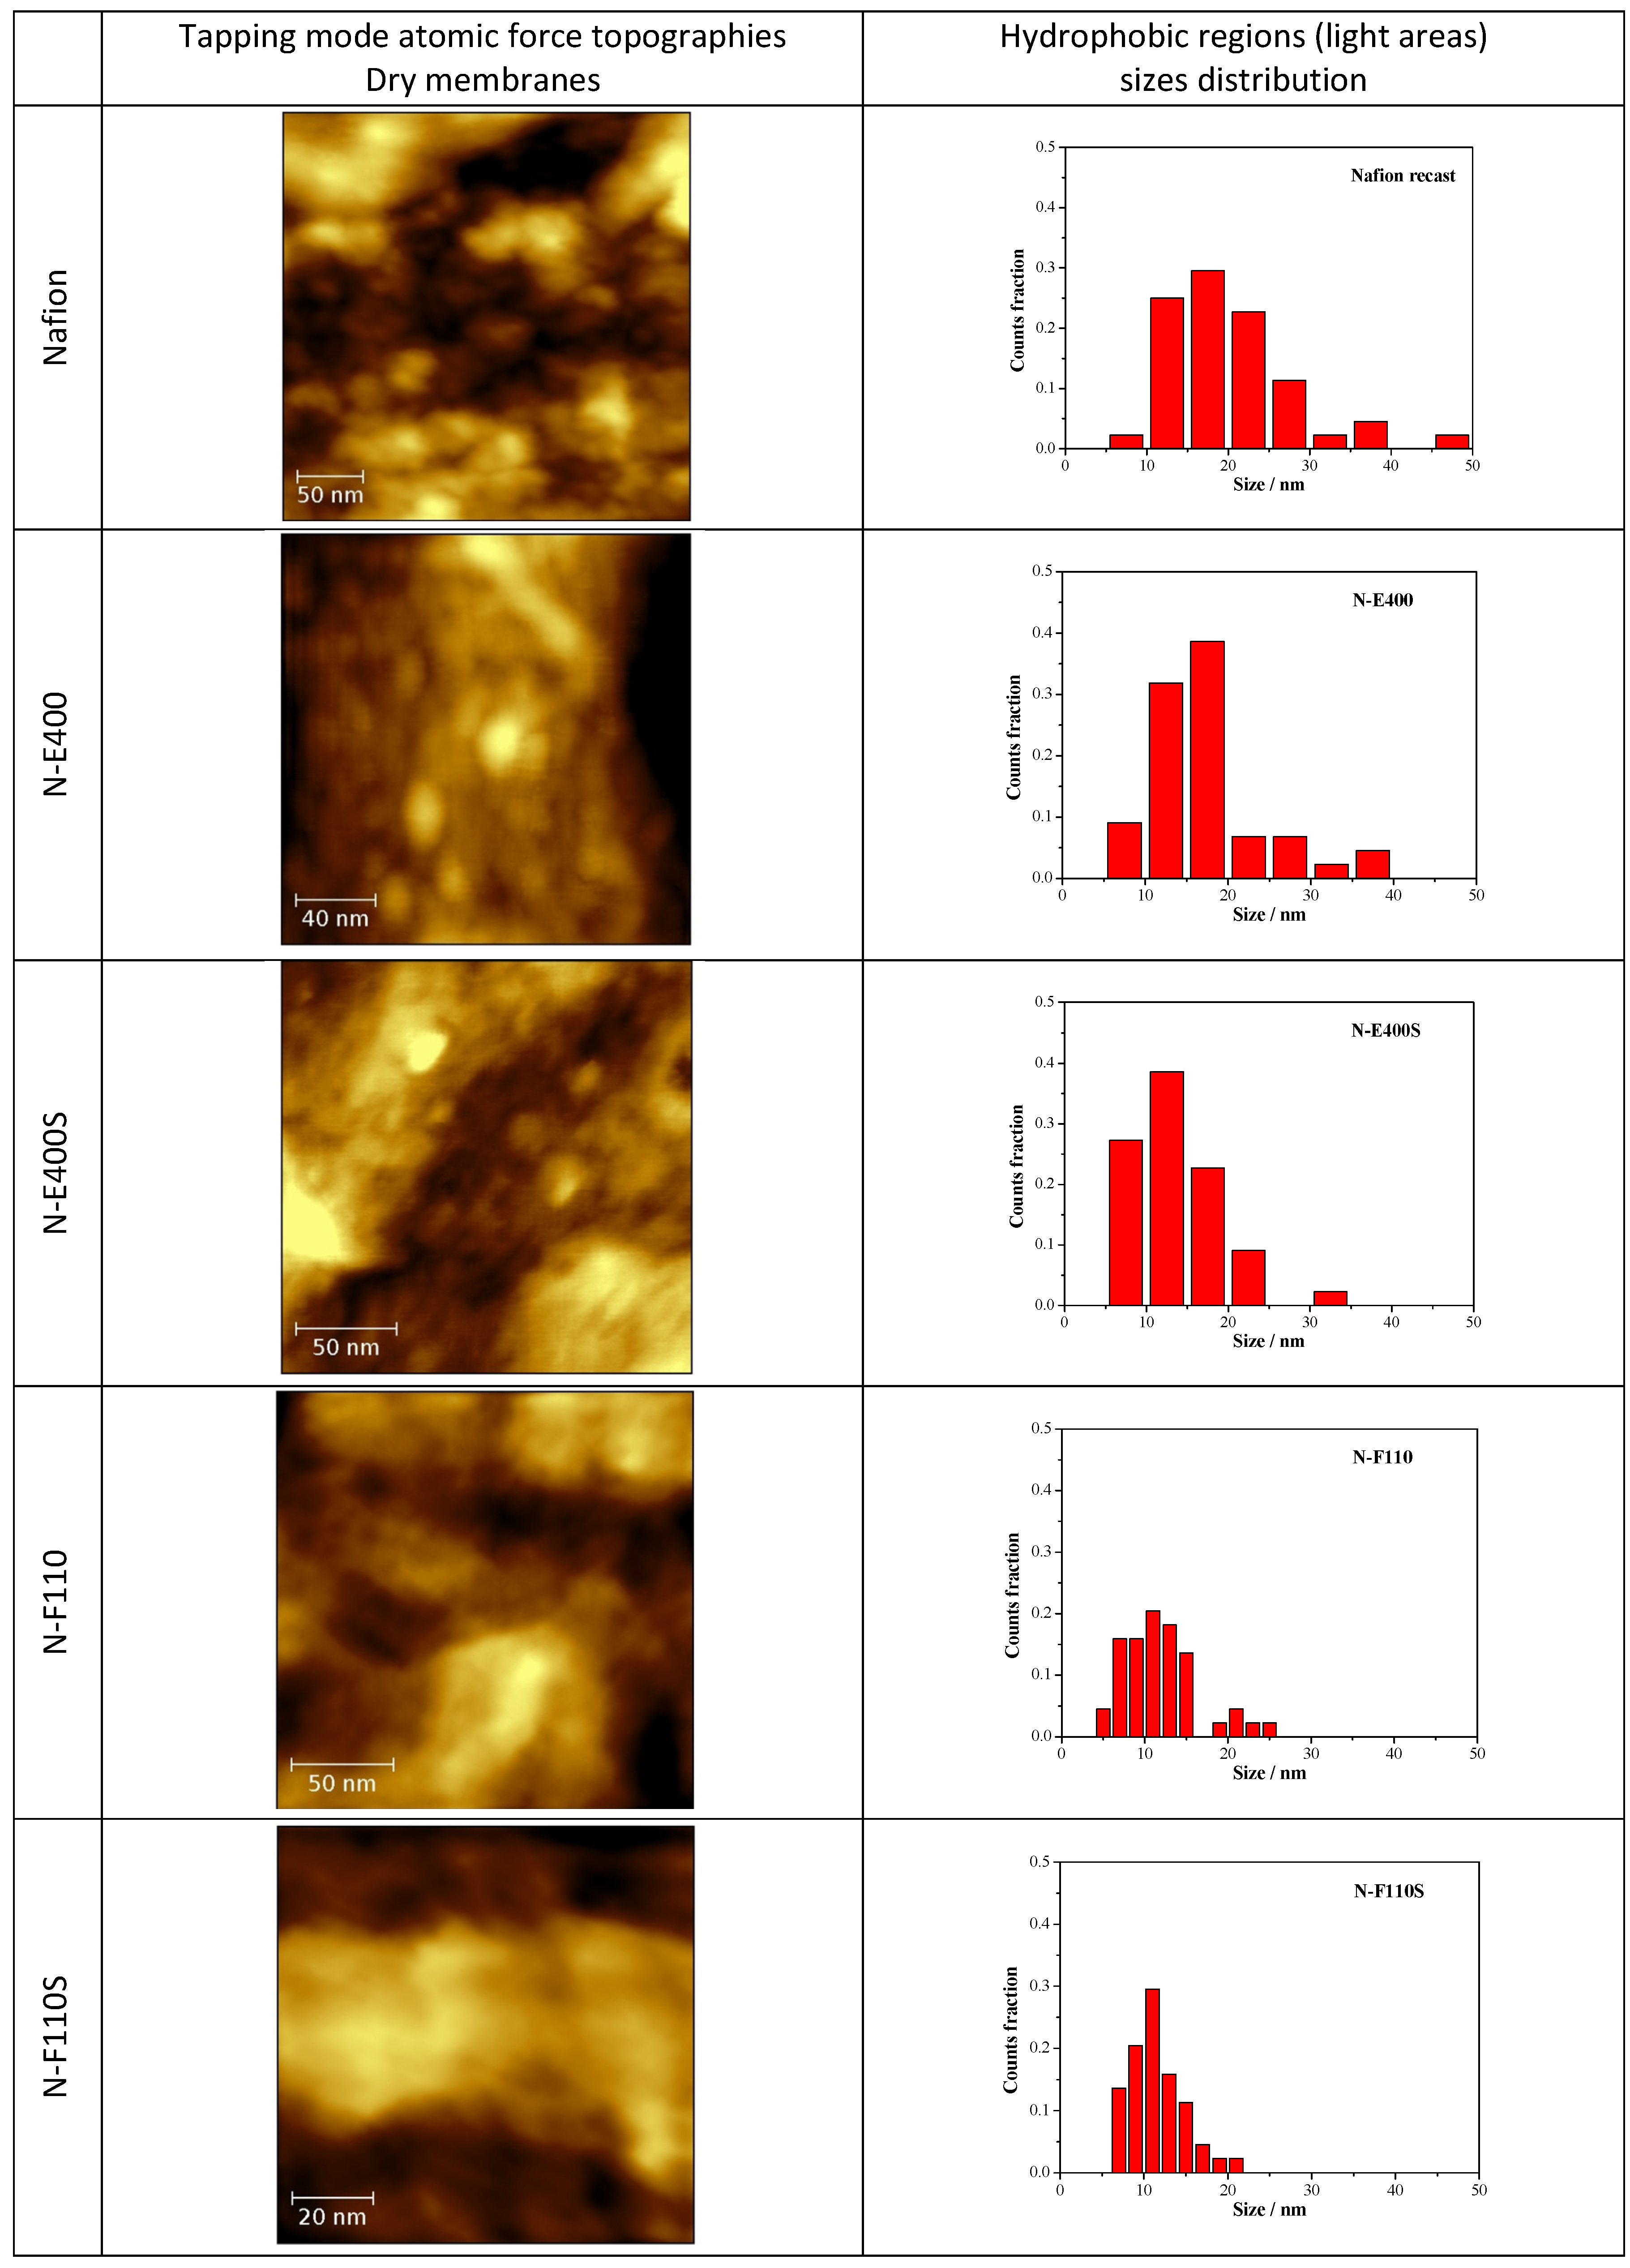
In
Figure 7 the tapping mode AFM topographies of the five membranes in their dried state are compared together with the size distribution of the round-shaped pseudo-particles (see below) derived from the image analysis by the software ImageJ [
43] of five different AFM micrographies at different magnifications for each sample. AFM experiments have been carried out on both sides of the membranes without observing remarkable differences.
Figure 7.
Atomic force microscopy (AFM) topographies measured in tapping mode of the five dried membranes and size distribution of the hydrophobic regions as derived from the image analysis.
Figure 7.
Atomic force microscopy (AFM) topographies measured in tapping mode of the five dried membranes and size distribution of the hydrophobic regions as derived from the image analysis.
The N, N-E400, and N-E400S dried membranes show quite similar surfaces with round shaped aggregated pseudo-particles of different sizes (light regions). This morphology (
i.e., agglomerated round shaped pseudo-particles separated by darker areas) can be ascribed to the alternation of the hydrophobic (light regions)/hydrophilic (dark regions) domains across the polymer matrix due to the interaction of the sulphonic groups dispersed within the hydrophobic network of the Nafion polymeric backbone [
44,
45,
46,
47]. The dimension (<d>, mean diameter of the hydrophobic regions (light round-shaped pseudo-particles) is much smaller and more homogenously dispersed in the case of the two membranes added with E400 (<d> = 16.6 ± 6.7 nm) and E400S oxides (<d> = 13.9 ± 5.4 nm) in comparison with the benchmark N (<d> = 20.0 ± 8.9 nm). Furthermore, the hydrophilic domains (dark areas) surrounding the pseudo-particles increase their size and morphological regularity passing from the recast Nafion membrane to the N-E400 and the N-E400S membranes. Apparently, the addition of the E400 and E400S oxides leads to a more homogeneous dispersion of the hydrophilic/hydrophobic domains and to a reduction of the size of the latter. The size of the light areas matches those observed for similar samples in the literature (e.g., [
47]) where cluster-like structures with diameter of 5–30 nm are typically observed. Furthermore, superstructure of spherical domains with an average diameter of tenths of nanometers containing 10–12 nm grains are usually detailed in AFM images [
47]. Among these grains, dark interstitial regions of few nanometers are observed being the latter an estimate of the ionic cluster size. Apparently, our observation matches this picture.
The alterations of the morphology of the three samples are induced by the oxide particles. Although these changes may be easily put into correlation with the possible larger hydration of the hydrophilic domains, they may result from two different and interacting phenomena difficult to decouple, i.e., (a) the alteration of the re-casting mechanism during membrane preparation (see experimental part) that reflects on the local organization of the ionic/hydrophobic domains; (b) the possible larger water retention in the membrane after drying due to the stronger bonding of the water molecules mediated by the oxide surfaces.
On passing one may observe that the size of the oxide particles (both E400 and E400S, see XRD and morphological analyses results) matches that of the round shaped ionic domains. Unfortunately our AFM investigation did not give clear evidence of filler particles: in our experience, it is difficult to distinguish between the ionic domain and the similar-in-size filler particles without referring to the AFM phase-images, where the harder oxide particles may give evidences. As a consequence, the here reported AFM study did not provide any undoubted evidence of the presence of filler particles embedded in the polymer matrix. In this view a further interpretation of the possible origin of the larger hydration of the ionic channels based on our AFM data would be too speculative.
A larger surface morphology alteration is observed for both the N-F110 and N-F110S. In particular, although as expected the overall morphologies of the N-F110 and the N-F110S samples still resemble those of the benchmark Nafion and the N-E400 and N-E400S membranes, the surfaces are apparently smoother with less resolved alternation of the hydrophilic/hydrophobic domains. The size-distribution plots suggest a mean size of the hydrophobic pseudo-particles of about 12.0 ± 4.4 and 11.2 ± 3.2 nm for the N-F110 and the N-F110S samples, respectively. Moreover also the hydrophilic regions surrounding the light hydrophobic domains show round-shaped morphologies and sizes matching those of the light areas. In addition, in the cases of the N-F110 and the N-F110S membranes the modification of the morphologies may be ascribed to the increase of the hydration of the ionic channels resulting from the alteration of the re-cast process and/or to the larger water retention after drying. Moreover it is interesting to underline that, differently from the cases of the N-E400 and N-E400S membranes, in both the N-F110 and N-F110S cases the particle size of the inorganic fillers estimated from surface area measurements is much smaller in comparison with the size of the round-shaped pseudo-particles and the surrounding darker areas. One may speculate that, in these two cases (N-F110 and N-F110S), the oxide particles may float well within the hydrophilic channels thus improving the water retention without inducing a large mechanical stress on the surrounding polymer matrix.
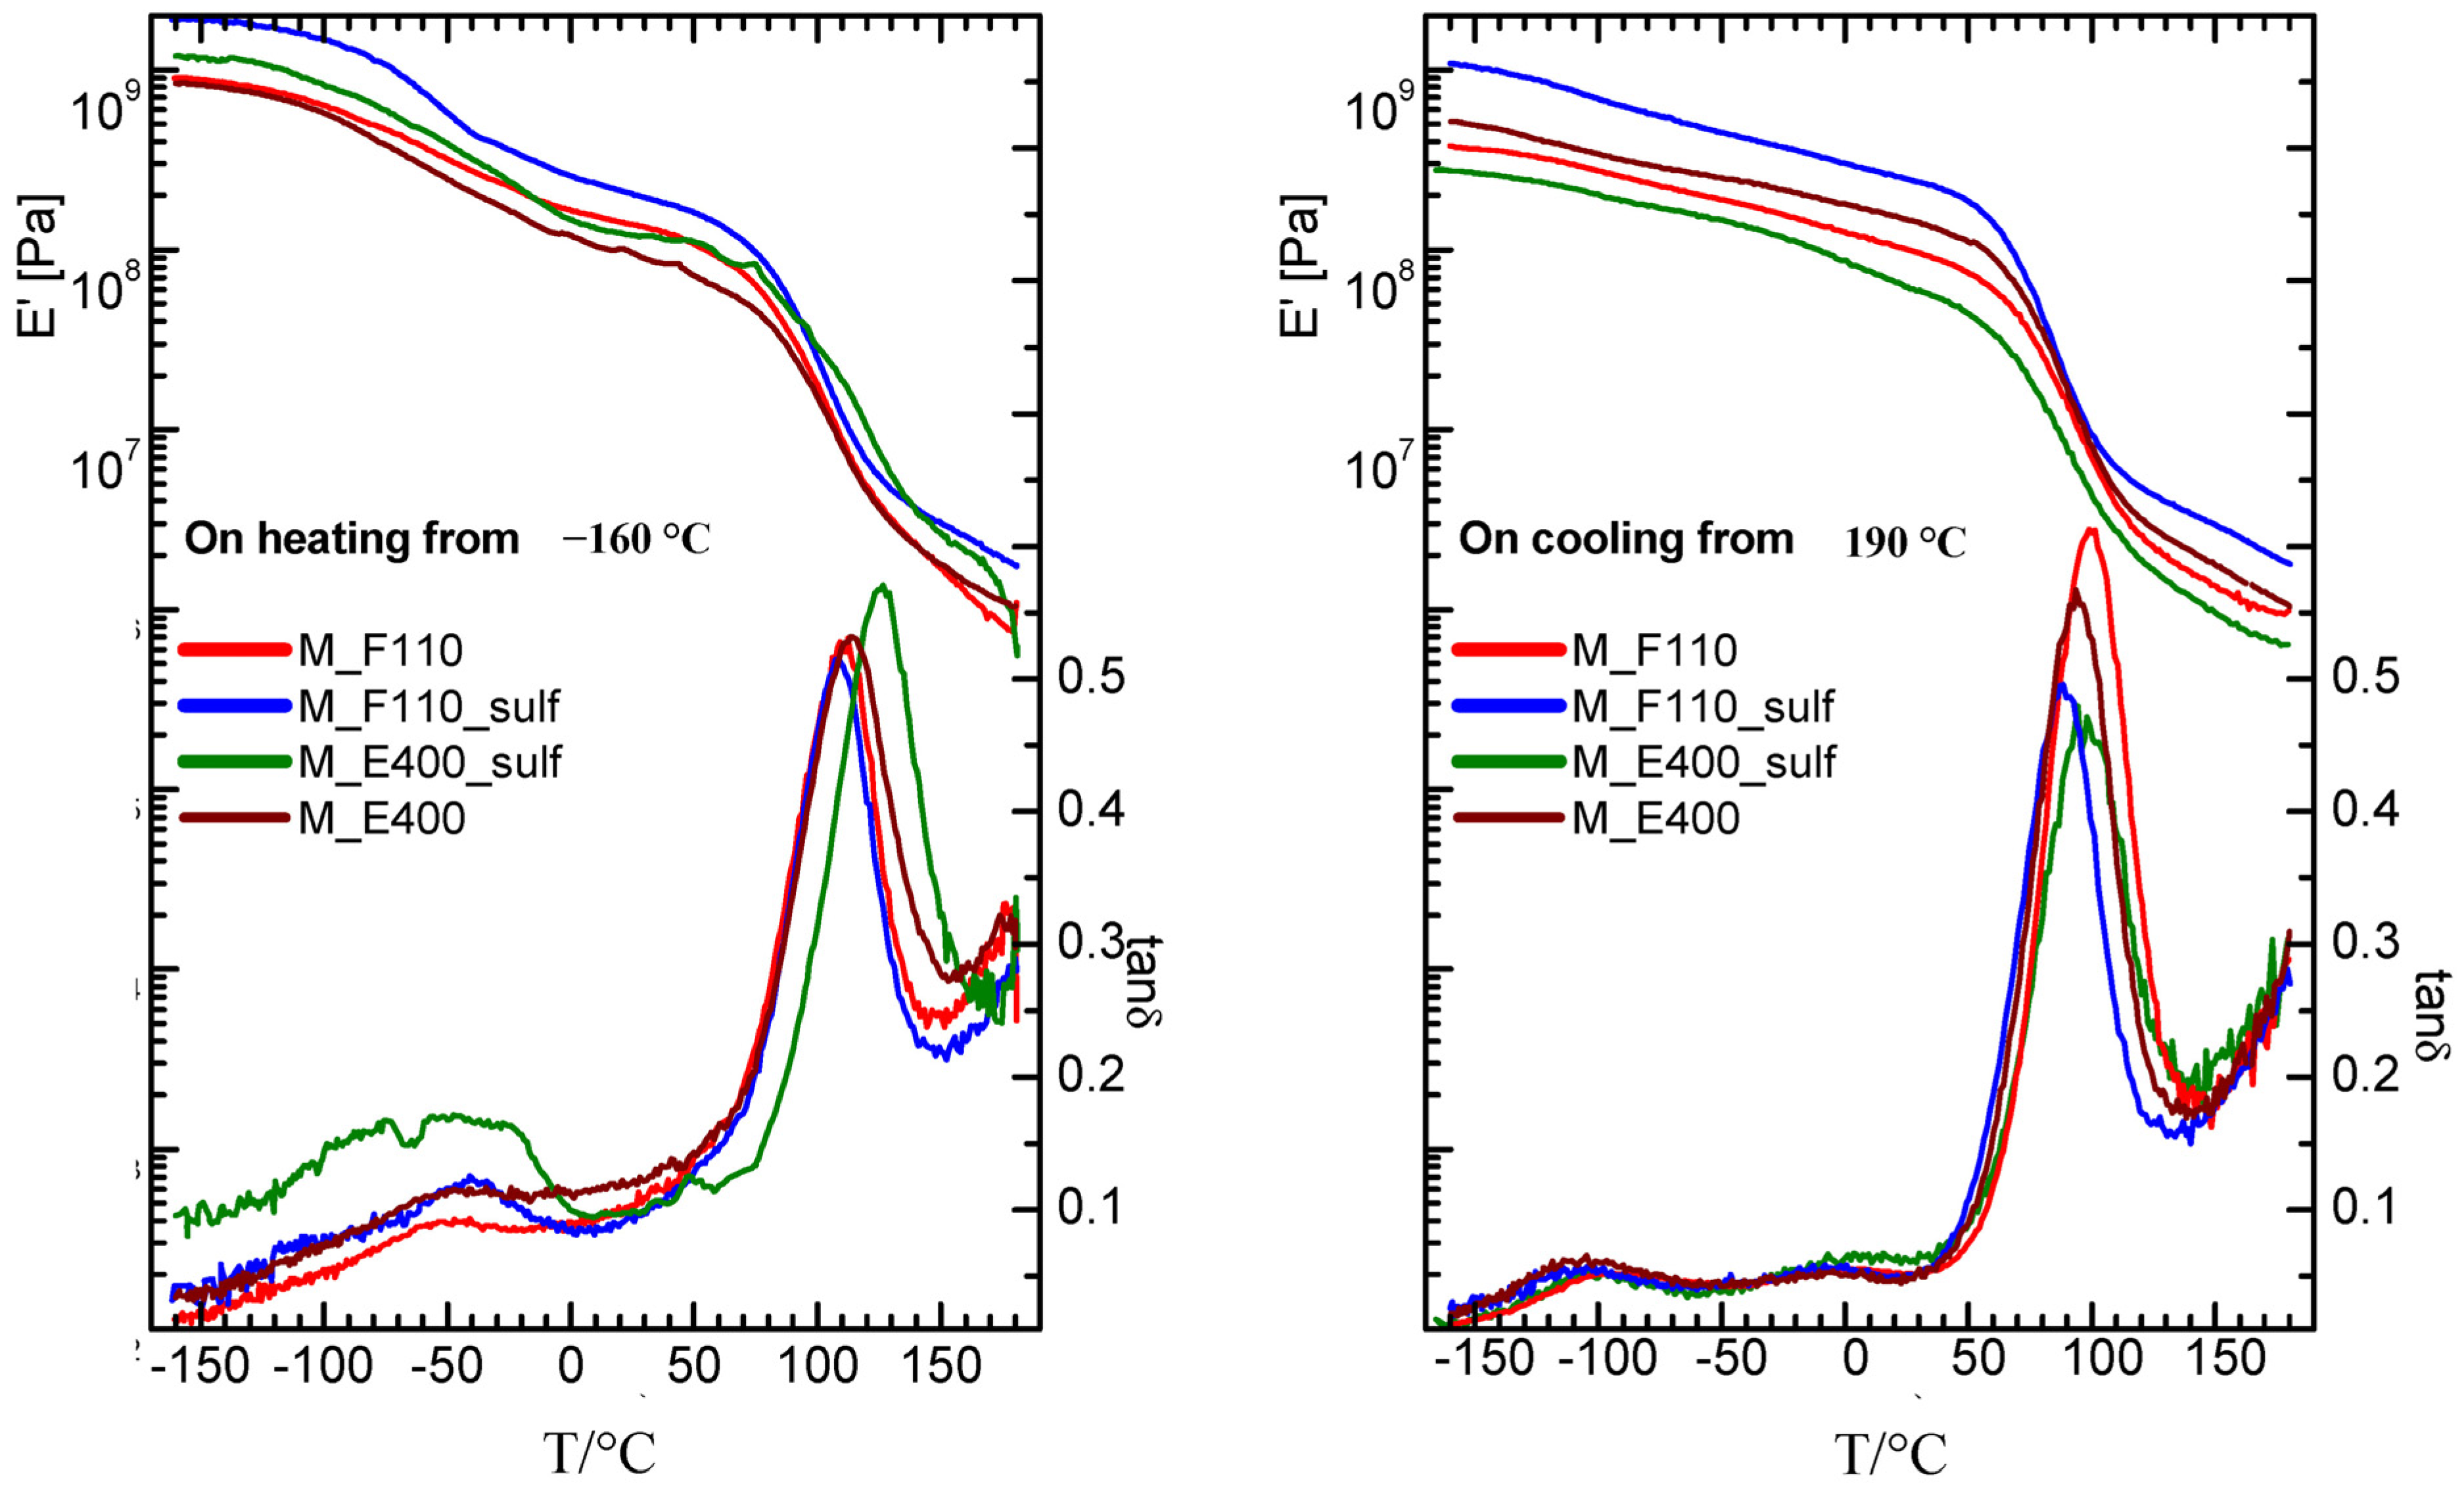
Turning to the mechanical properties, the storage modulus (E’) and elastic energy dissipation (tanδ) of the nanocomposite membranes (N-E400, N-E400S, N-F110, and N-F110S), measured starting from a “wet membrane” state on heating and subsequent cooling, are reported in
Figure 8.
Figure 8.
Storage modulus and elastic energy dissipation of nanocomposite membranes measured for f = 1 Hz on heating (left panel) and subsequent cooling (right panel).
Figure 8.
Storage modulus and elastic energy dissipation of nanocomposite membranes measured for f = 1 Hz on heating (left panel) and subsequent cooling (right panel).
On heating starting from −160 °C, the α relaxation (the intense peak in tanδ and the two order of magnitude drop in the modulus) is detected around 110 °C in the F110-added (either sulphated or not) and in the E400-added nanocomposite membranes, while it results slightly shifted to higher temperature (120 °C) in the sulphated E400-added sample. This relaxation corresponds to the glass transition of the hydrophilic domains (polar regions) of the Nafion polymer matrix. On cooling, the peak associated to the alpha relaxation is measured at about 80 °C (see right panel of the figure) in all membranes, showing thermal hysteresis. Moreover, on heating between −90 and 30 °C, all the nanocomposite membranes show a broad peak, accompanied by an increase in the modulus. This feature has been already observed in a wet undoped Nafion membrane [
48] and attributed to the friction between the liquid water bound to the walls of the hydrophilic domains and the solid ice inside the channels. The intensity of this peak is higher in the membrane with the sulphated oxide as filler, and is maximum in the sulphated samples prepared by the E400 procedure (N-E400S). It can be speculated that the higher intensity of the broad peak below 30 °C in N-E400S is related to the distribution and to the particular status of water molecules within the composite matrix. Even though a sort of preferential interactions between water and this particular filler (E400S) in Nafion membrane has been also revealed by DSC measurements (see discussion above), further insights are needed to better explain this evidence, thus complementary investigations are currently in progress.
The effect of hydration on the properties of ionomers and polyelectrolytes is, in general, a very complex, still open question. It is known that many variables, such as external relative humidity, temperature, and, as recently demonstrated by Kreuer, internal pressure contribute to define the hydration thermodynamics and the transport properties across the membrane [
49]. When inorganic nanoparticles are introduced into a polymer electrolyte, the picture becomes even more complex and hydration is altered [
50].
Our findings show that the storage modulus and tanδ measured for all the nanocomposite membranes on cooling immediately after heating at 180 °C are close and similar to those already reported for a dry, undoped Nafion membrane [
48] as they do not show anymore neither the broad peak nor the corresponding increase in the modulus due to the reinforcing action of solid water. Moreover, when measured on cooling, the gamma and beta relaxations are more evident around −70 and 0 °C, respectively, as the corresponding peaks are more separated. The beta relaxation has been ascribed in the literature to the glass transition of the Nafion non-ionic matrix, while the gamma relaxation was assigned to short-range molecular motions of the –CF
2– backbone.
There are some interesting examples in literature where the viscoelastic properties of Nafion have been studied as a function of the hydration level and of temperature and correlated to the transport properties across the polymer membrane [
49,
51]. In the present work, the effect of the particles addiction on the mechanical properties of the membranes can be discussed by the measurements of the storage modulus in the cooling run (right panel of
Figure 8), where most of the water may have evaporated. Most of the composite samples present values higher than that of pure recast Nafion (results not shown here) and, in particular the N-F110S sample displays the highest modulus, suggesting a reinforcing action due to the incorporation of the F110S sulphated tin oxide particles. An increase of the Young modulus in a Nafion membrane with the addition of SnO
2 nanoparticles was already observed by Nørgaard
et al. [
41] and related to a stiffening effect due to interfacial interactions between the inorganic phase and sulfonic acid groups in the polymer.
The applicability of the proposed composite membranes as effective electrolytes needs, of course, to be demonstrated. To this purpose, a detailed characterization, including electrochemical measurements of proton conductivity and fuel cell operation, will be reported in another publication aimed at elucidating the practical impact of the selected electrolytes under critical conditions [
52]. It’s here worth mentioning that interesting conductivity values were obtained for the two sulfated tin oxide-added membranes, ranging from 7 × 10
−3 to 9 × 10
−3 S cm
−1 at room temperature under 100% RH.


 ,
, 


